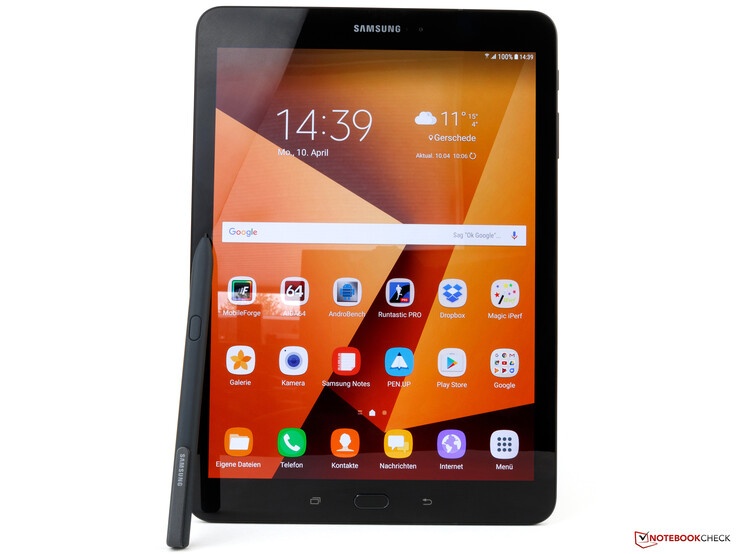
Samsung Galaxy Tab S3 Tablet rövid értékelés
» A Top 10 multimédiás noteszgép - tesztek alapján
» A Top 10 játékos noteszgép
» A Top 10 belépő szintű üzleti noteszgép
» A Top 10 üzleti noteszgép
» A Top 10 notebook munkaállomása
» A Top 10 okostelefon - tesztek alapján
» A Top 10 táblagép
» A Top 10 Windows tabletje
» A Top 10 subnotebook - tesztek alapján
» A Top 10 300 euró alatti okostelefonja
» A Top 10 120 euró alatti okostelefonja
» A Top 10 phabletje (>5.5-inch)
» A Top 10 noteszgép 500 EUR (~160.000 HUF) alatt
» A Top 10 "pehelysúlyú" gaming notebookja
| Networking | |
| iperf3 transmit AX12 | |
| Samsung Galaxy Tab S3 SM-T825 | |
| Apple iPad (2017) | |
| Asus ZenPad 3s 10 Z500M | |
| Huawei MediaPad M3 8.4 inch | |
| iperf3 receive AX12 | |
| Samsung Galaxy Tab S3 SM-T825 | |
| Apple iPad (2017) | |
| Asus ZenPad 3s 10 Z500M | |
| Huawei MediaPad M3 8.4 inch | |
| |||||||||||||||||||||||||
Fényerő megoszlás: 82 %
Centrumban: 452 cd/m²
Kontraszt: ∞:1 (Fekete: 0 cd/m²)
ΔE ColorChecker Calman: 1.8 | ∀{0.5-29.43 Ø4.76}
ΔE Greyscale Calman: 1.2 | ∀{0.09-98 Ø5}
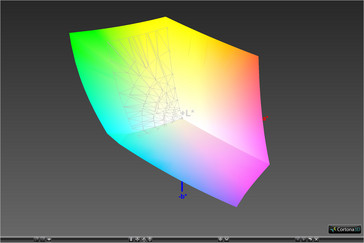
99.06% sRGB (Argyll 1.6.3 3D)
82.32% AdobeRGB 1998 (Argyll 1.6.3 3D)
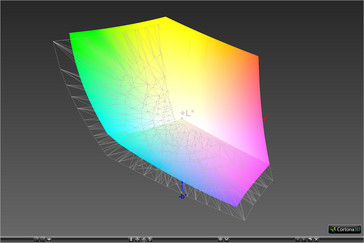
94% AdobeRGB 1998 (Argyll 3D)
99.1% sRGB (Argyll 3D)
83.9% Display P3 (Argyll 3D)
Gamma: 2.11
CCT: 6500 K
| Samsung Galaxy Tab S3 SM-T825 Super AMOLED, 2048x1526, 9.7" | Samsung Galaxy Tab S2 9.7 LTE Super AMOLED, 2048x1536, 9.7" | Huawei MediaPad T2 10.0 Pro IPS, 1920x1200, 10.1" | Apple iPad Pro 9.7 IPS, 2048x1536, 9.7" | Google Pixel C LTPS, 2560x1800, 10.2" | Asus ZenPad 3s 10 Z500M IPS, 2048x1536, 9.7" | Apple iPad (2017) IPS, 2048x1536, 9.7" | |
|---|---|---|---|---|---|---|---|
| Screen | -11% | -94% | 11% | -145% | -141% | -0% | |
| Brightness middle (cd/m²) | 452 | 358 -21% | 392 -13% | 523 16% | 487 8% | 489 8% | 514 14% |
| Brightness (cd/m²) | 468 | 357 -24% | 385 -18% | 500 7% | 510 9% | 443 -5% | 485 4% |
| Brightness Distribution (%) | 82 | 86 5% | 91 11% | 93 13% | 91 11% | 86 5% | 88 7% |
| Black Level * (cd/m²) | 0.59 | 0.52 | 0.39 | 0.43 | 0.46 | ||
| Colorchecker dE 2000 * | 1.8 | 1.78 1% | 4.5 -150% | 1.1 39% | 5.24 -191% | 5.5 -206% | 1.4 22% |
| Colorchecker dE 2000 max. * | 4 | 7.8 -95% | 1.9 52% | 11.6 -190% | 2.9 27% | ||
| Greyscale dE 2000 * | 1.2 | 1.38 -15% | 4.8 -300% | 1.4 -17% | 7.95 -563% | 6.7 -458% | 2.1 -75% |
| Gamma | 2.11 104% | 2.24 98% | 2.47 89% | 2.11 104% | 2.16 102% | 2.06 107% | 2.22 99% |
| CCT | 6500 100% | 6366 102% | 7426 88% | 6662 98% | 6565 99% | 7457 87% | 6647 98% |
| Color Space (Percent of AdobeRGB 1998) (%) | 82.32 | 62.97 -24% | |||||
| Color Space (Percent of sRGB) (%) | 99.06 | 99.55 0% | |||||
| Contrast (:1) | 664 | 1006 | 1249 | 1137 | 1117 |
* ... a kisebb jobb
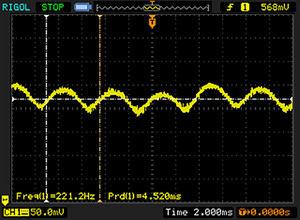
Képernyő villogása / PWM (impulzusszélesség-moduláció)
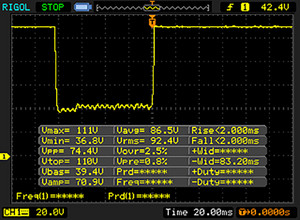
| Képernyő villogása / PWM észlelve | 221.2 Hz | ≤ 100 % fényerő beállítása | |
A kijelző háttérvilágítása 221.2 Hz-en villog (a legrosszabb esetben, pl. PWM használatával) Villódzás észlelve a 100 % vagy annál kisebb fényerő-beállításnál. E fényerő-beállítás felett nem lehet villogás vagy PWM. A 221.2 Hz frekvenciája viszonylag alacsony, így az érzékeny felhasználók valószínűleg villogást észlelnek, és megerőltetik a szemüket a megadott és az alatti fényerő-beállítás mellett. Összehasonlításképpen: az összes tesztelt eszköz 53 %-a nem használja a PWM-et a kijelző elsötétítésére. Ha PWM-et észleltek, akkor átlagosan 8016 (minimum: 5 - maximum: 343500) Hz-t mértek. | |||
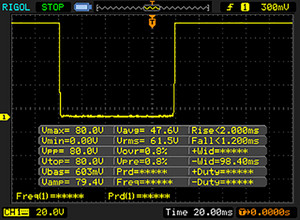
Megjelenítési válaszidők
| ↔ Válaszidő Fekete-fehér | ||
|---|---|---|
| 3.2 ms ... emelkedés és süllyedés ↘ kombinálva | ↗ 2 ms emelkedés | |
| ↘ 1.2 ms ősz | ||
| A képernyő tesztjeinkben nagyon gyors reakciósebességet mutatott, és nagyon jól használható gyors tempójú játékokhoz. Összehasonlításképpen, az összes tesztelt eszköz 0.1 (minimum) és 240 (maximum) ms között mozog. » 14 % of all devices are better. Ez azt jelenti, hogy a mért válaszidő jobb, mint az összes vizsgált eszköz átlaga (20.1 ms). | ||
| ↔ Válaszidő 50% szürke és 80% szürke között | ||
| 4 ms ... emelkedés és süllyedés ↘ kombinálva | ↗ 2 ms emelkedés | |
| ↘ 2 ms ősz | ||
| A képernyő tesztjeinkben nagyon gyors reakciósebességet mutatott, és nagyon jól használható gyors tempójú játékokhoz. Összehasonlításképpen, az összes tesztelt eszköz 0.165 (minimum) és 636 (maximum) ms között mozog. » 14 % of all devices are better. Ez azt jelenti, hogy a mért válaszidő jobb, mint az összes vizsgált eszköz átlaga (31.4 ms). | ||
| GFXBench | |
| on screen Car Chase Onscreen | |
| Samsung Galaxy Tab S3 SM-T825 | |
| Samsung Galaxy S8 Plus | |
| Google Pixel C | |
| Huawei MediaPad M3 8.4 inch | |
| Asus ZenPad 3s 10 Z500M | |
| 1920x1080 Car Chase Offscreen | |
| Samsung Galaxy S8 Plus | |
| Google Pixel C | |
| Samsung Galaxy Tab S3 SM-T825 | |
| Huawei MediaPad M3 8.4 inch | |
| Asus ZenPad 3s 10 Z500M | |
| PCMark for Android | |
| Work performance score | |
| Google Pixel C | |
| Samsung Galaxy S8 Plus | |
| Samsung Galaxy Tab S3 SM-T825 | |
| Samsung Galaxy Tab S2 9.7 LTE | |
| Huawei MediaPad M3 8.4 inch | |
| Lenovo Yoga Book Android YB1-X90F | |
| Asus ZenPad 3s 10 Z500M | |
| Huawei MediaPad T2 10.0 Pro | |
| Work 2.0 performance score | |
| Samsung Galaxy Tab S3 SM-T825 | |
| Samsung Galaxy S8 Plus | |
| Storage score | |
| Samsung Galaxy S8 Plus | |
| Samsung Galaxy Tab S3 SM-T825 | |
| Geekbench 4.4 | |
| 64 Bit Single-Core Score | |
| Samsung Galaxy S8 Plus | |
| Samsung Galaxy Tab S3 SM-T825 | |
| 64 Bit Multi-Core Score | |
| Samsung Galaxy S8 Plus | |
| Samsung Galaxy Tab S3 SM-T825 | |
| Basemark ES 3.1 / Metal - offscreen Overall Score | |
| Samsung Galaxy S8 Plus | |
| Apple iPad Pro 9.7 | |
| Apple iPad (2017) | |
| Google Pixel C | |
| Samsung Galaxy Tab S3 SM-T825 | |
| ANDEBench PRO | |
| Device Score | |
| Google Pixel C | |
| Samsung Galaxy Tab S3 SM-T825 | |
| CoreMark-PRO/HPC (Base) | |
| Samsung Galaxy Tab S3 SM-T825 | |
| Google Pixel C | |
| Memory Bandwidth | |
| Samsung Galaxy Tab S3 SM-T825 | |
| Google Pixel C | |
| Memory Latency | |
| Google Pixel C | |
| Samsung Galaxy Tab S3 SM-T825 | |
| Storage | |
| Google Pixel C | |
| Samsung Galaxy Tab S3 SM-T825 | |
| Platform | |
| Google Pixel C | |
| Samsung Galaxy Tab S3 SM-T825 | |
| 3D | |
| Google Pixel C | |
| Samsung Galaxy Tab S3 SM-T825 | |
| Epic Citadel - Ultra High Quality | |
| Samsung Galaxy S8 Plus | |
| Google Pixel C | |
| Samsung Galaxy Tab S3 SM-T825 | |
* ... a kisebb jobb
| Samsung Galaxy Tab S3 SM-T825 | Samsung Galaxy Tab S2 9.7 LTE | Huawei MediaPad T2 10.0 Pro | Google Pixel C | Huawei MediaPad M3 8.4 inch | Asus ZenPad 3s 10 Z500M | Lenovo Yoga Book Android YB1-X90F | Samsung Galaxy S8 Plus | |
|---|---|---|---|---|---|---|---|---|
| AndroBench 3-5 | -32% | -52% | -25% | 9% | -27% | -34% | 80% | |
| Sequential Read 256KB (MB/s) | 288.6 | 248.2 -14% | 131 -55% | 154.3 -47% | 249.7 -13% | 209.3 -27% | 143.4 -50% | 788 173% |
| Sequential Write 256KB (MB/s) | 87.6 | 49.37 -44% | 78.2 -11% | 109.4 25% | 117.2 34% | 136.5 56% | 80.6 -8% | 194.2 122% |
| Random Read 4KB (MB/s) | 45.82 | 25.56 -44% | 14.59 -68% | 19.96 -56% | 32.04 -30% | 24.85 -46% | 23.5 -49% | 127.2 178% |
| Random Write 4KB (MB/s) | 13.13 | 9.82 -25% | 9.86 -25% | 10.08 -23% | 31.35 139% | 6.8 -48% | 11.7 -11% | 15.27 16% |
| Sequential Read 256KB SDCard (MB/s) | 76.4 | 17.57 -77% | 61.7 -19% | 45.15 -41% | 48.9 -36% | 71.1 -7% | ||
| Sequential Write 256KB SDCard (MB/s) | 58.6 | 13.98 -76% | 23.52 -60% | 26.9 -54% | 30.6 -48% | 57.2 -2% |
| Dead Trigger 2 | |||
| Beállítások | Érték | ||
| high | 30 fps | ||
| Asphalt 8: Airborne | |||
| Beállítások | Érték | ||
| high | 30 fps | ||
| very low | 30 fps | ||
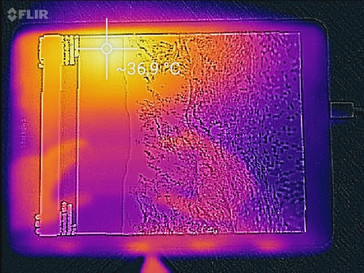
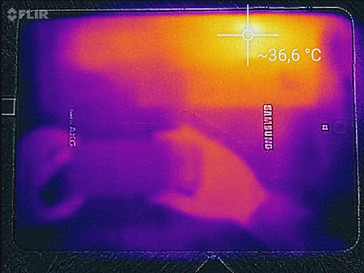
(+) A felső oldalon a maximális hőmérséklet 34.4 °C / 94 F, összehasonlítva a 33.6 °C / 92 F átlagával , 20.7 és 53.2 °C között a Tablet osztálynál.
(+) Az alsó maximum 31.1 °C / 88 F-ig melegszik fel, összehasonlítva a 33.2 °C / 92 F átlagával
(+) Üresjáratban a felső oldal átlagos hőmérséklete 27.8 °C / 82 F, összehasonlítva a 30 °C / ### eszközátlaggal class_avg_f### F.
Samsung Galaxy Tab S3 SM-T825 hangelemzés
(+) | a hangszórók viszonylag hangosan tudnak játszani (86.5 dB)
Basszus 100 - 315 Hz
(-) | szinte nincs basszus – átlagosan 26.5%-kal alacsonyabb a mediánnál
(±) | a basszus linearitása átlagos (14.5% delta az előző frekvenciához)
Közepes 400-2000 Hz
(±) | magasabb középértékek – átlagosan 5.1%-kal magasabb, mint a medián
(+) | a középpontok lineárisak (5.2% delta az előző frekvenciához)
Maximum 2-16 kHz
(+) | kiegyensúlyozott csúcsok – csak 1.9% választja el a mediántól
(+) | a csúcsok lineárisak (5.6% delta az előző frekvenciához képest)
Összességében 100 - 16.000 Hz
(±) | az általános hang linearitása átlagos (17.9% eltérés a mediánhoz képest)
Ugyanazon osztályhoz képest
» 45%Ebben az osztályban az összes tesztelt eszköz %-a jobb volt, 6% hasonló, 48%-kal rosszabb
» A legjobb delta értéke 7%, az átlag 20%, a legrosszabb 129% volt
Az összes tesztelt eszközzel összehasonlítva
» 36% az összes tesztelt eszköz jobb volt, 8% hasonló, 56%-kal rosszabb
» A legjobb delta értéke 4%, az átlag 24%, a legrosszabb 134% volt
Apple iPad Pro 9.7 hangelemzés
(+) | a hangszórók viszonylag hangosan tudnak játszani (90.6 dB)
Basszus 100 - 315 Hz
(-) | szinte nincs basszus – átlagosan 23.2%-kal alacsonyabb a mediánnál
(±) | a basszus linearitása átlagos (8.6% delta az előző frekvenciához)
Közepes 400-2000 Hz
(+) | kiegyensúlyozott középpontok – csak 4.7% választja el a mediántól
(+) | a középpontok lineárisak (4.9% delta az előző frekvenciához)
Maximum 2-16 kHz
(+) | kiegyensúlyozott csúcsok – csak 4.6% választja el a mediántól
(+) | a csúcsok lineárisak (4.1% delta az előző frekvenciához képest)
Összességében 100 - 16.000 Hz
(±) | az általános hang linearitása átlagos (16.8% eltérés a mediánhoz képest)
Ugyanazon osztályhoz képest
» 41%Ebben az osztályban az összes tesztelt eszköz %-a jobb volt, 4% hasonló, 55%-kal rosszabb
» A legjobb delta értéke 7%, az átlag 20%, a legrosszabb 129% volt
Az összes tesztelt eszközzel összehasonlítva
» 29% az összes tesztelt eszköz jobb volt, 7% hasonló, 64%-kal rosszabb
» A legjobb delta értéke 4%, az átlag 24%, a legrosszabb 134% volt
Google Pixel C hangelemzés
(+) | a hangszórók viszonylag hangosan tudnak játszani (92.8 dB)
Basszus 100 - 315 Hz
(-) | szinte nincs basszus – átlagosan 29.9%-kal alacsonyabb a mediánnál
(±) | a basszus linearitása átlagos (7.5% delta az előző frekvenciához)
Közepes 400-2000 Hz
(+) | kiegyensúlyozott középpontok – csak 4.8% választja el a mediántól
(±) | a középpontok linearitása átlagos (7% delta az előző gyakorisághoz)
Maximum 2-16 kHz
(±) | magasabb csúcsok – átlagosan 7.5%-kal magasabb, mint a medián
(±) | a csúcsok linearitása átlagos (8.6% delta az előző gyakorisághoz)
Összességében 100 - 16.000 Hz
(±) | az általános hang linearitása átlagos (24.2% eltérés a mediánhoz képest)
Ugyanazon osztályhoz képest
» 76%Ebben az osztályban az összes tesztelt eszköz %-a jobb volt, 6% hasonló, 18%-kal rosszabb
» A legjobb delta értéke 7%, az átlag 20%, a legrosszabb 129% volt
Az összes tesztelt eszközzel összehasonlítva
» 73% az összes tesztelt eszköz jobb volt, 6% hasonló, 21%-kal rosszabb
» A legjobb delta értéke 4%, az átlag 24%, a legrosszabb 134% volt
| Kikapcsolt állapot / Készenlét | |
| Üresjárat | |
| Terhelés |
|
Kulcs:
min: | |
| Samsung Galaxy Tab S3 SM-T825 6000 mAh | Samsung Galaxy Tab S2 9.7 LTE 5870 mAh | Apple iPad Pro 9.7 7306 mAh | Huawei MediaPad T2 10.0 Pro 6600 mAh | Google Pixel C mAh | Asus ZenPad 3s 10 Z500M 5900 mAh | Apple iPad (2017) 8.827 mAh | |
|---|---|---|---|---|---|---|---|
| Power Consumption | -31% | -59% | -5% | -32% | -25% | -64% | |
| Idle Minimum * (Watt) | 2.08 | 2.3 -11% | 1.71 18% | 1.58 24% | 1.82 12% | 1.59 24% | 2.06 1% |
| Idle Average * (Watt) | 3.5 | 4.5 -29% | 7.55 -116% | 4.12 -18% | 4.26 -22% | 4.14 -18% | 7.42 -112% |
| Idle Maximum * (Watt) | 3.58 | 5 -40% | 7.62 -113% | 4.15 -16% | 4.33 -21% | 4.23 -18% | 7.47 -109% |
| Load Average * (Watt) | 6.97 | 9.4 -35% | 8.39 -20% | 6.2 11% | 9.82 -41% | 10.89 -56% | 9.45 -36% |
| Load Maximum * (Watt) | 7.4 | 10.4 -41% | 12.08 -63% | 9.27 -25% | 13.99 -89% | 11.58 -56% | 12.31 -66% |
* ... a kisebb jobb
| Samsung Galaxy Tab S3 SM-T825 6000 mAh | Samsung Galaxy Tab S2 9.7 LTE 5870 mAh | Huawei MediaPad T2 10.0 Pro 6600 mAh | Asus ZenPad 3s 10 Z500M 5900 mAh | Apple iPad (2017) 8.827 mAh | Apple iPad Pro 9.7 7306 mAh | |
|---|---|---|---|---|---|---|
| Akkumulátor üzemidő | -26% | -27% | -22% | -2% | -6% | |
| Reader / Idle (h) | 31.7 | 15.3 -52% | 20.5 -35% | 24.2 -24% | 24.9 -21% | 30.8 -3% |
| H.264 (h) | 9.2 | 10.9 18% | 9.9 8% | 10 9% | 14.1 53% | 11.8 28% |
| WiFi v1.3 (h) | 12.7 | 6.6 -48% | 6.9 -46% | 8.6 -32% | 12.7 0% | 13 2% |
| Load (h) | 6.3 | 4.9 -22% | 4.1 -35% | 3.8 -40% | 3.8 -40% | 3.1 -51% |
Pro
Kontra
A Samsung Galaxy Tab S3 LTE nagyon jó tablet, amely nem a legmodernebb hardvert használja mindenre (hasonlóan az Apple iPad 2017-hez), de összességében igen vonzó.
A Samsung Galaxy Tab S3 ugyan nem tesz csodákat, de jelenleg így is a legjobb Android-os tablet.
A kiváló, HDR-képes kijelzőn kívül jó hangszórók, hosszabb üzemidő, S Pen támogatás, valamint igen gyors WiFi modul kapott helyet a gépben. A beépített Snapdragon 820 nem éppen a legújabb Qualcomm lapkakészlet, de a teljesítménye még mindig nagyon jó. Csak a kicsi és lassú eMMC tárhely nem illik egy prémium multimédiás tabletről alkotott képbe. A Samsung kamerákból sem túl jókat épített a gépbe, így végképp nincs prémium érzete.
Az S Pen támogatás viszont kifejezetten tetszett. Alapértelmezettként minden Tab S3 mellé kapunk egyet, és használat közben kiváló benyomást kelt. 770 euró azonban még mindig sok pénz egy tabletért, amelyre nem igazán éri meg váltani, ha már rendelkezünk egy Galaxy Tab S2 9.7-tel, és le tudunk mondani a tollról.
Ez az eredeti értékelés rövidített változata. A teljes, angol nyelvű cikk itt olvasható.
Samsung Galaxy Tab S3 SM-T825
- 04/26/2017 v6 (old)
Daniel Schmidt


