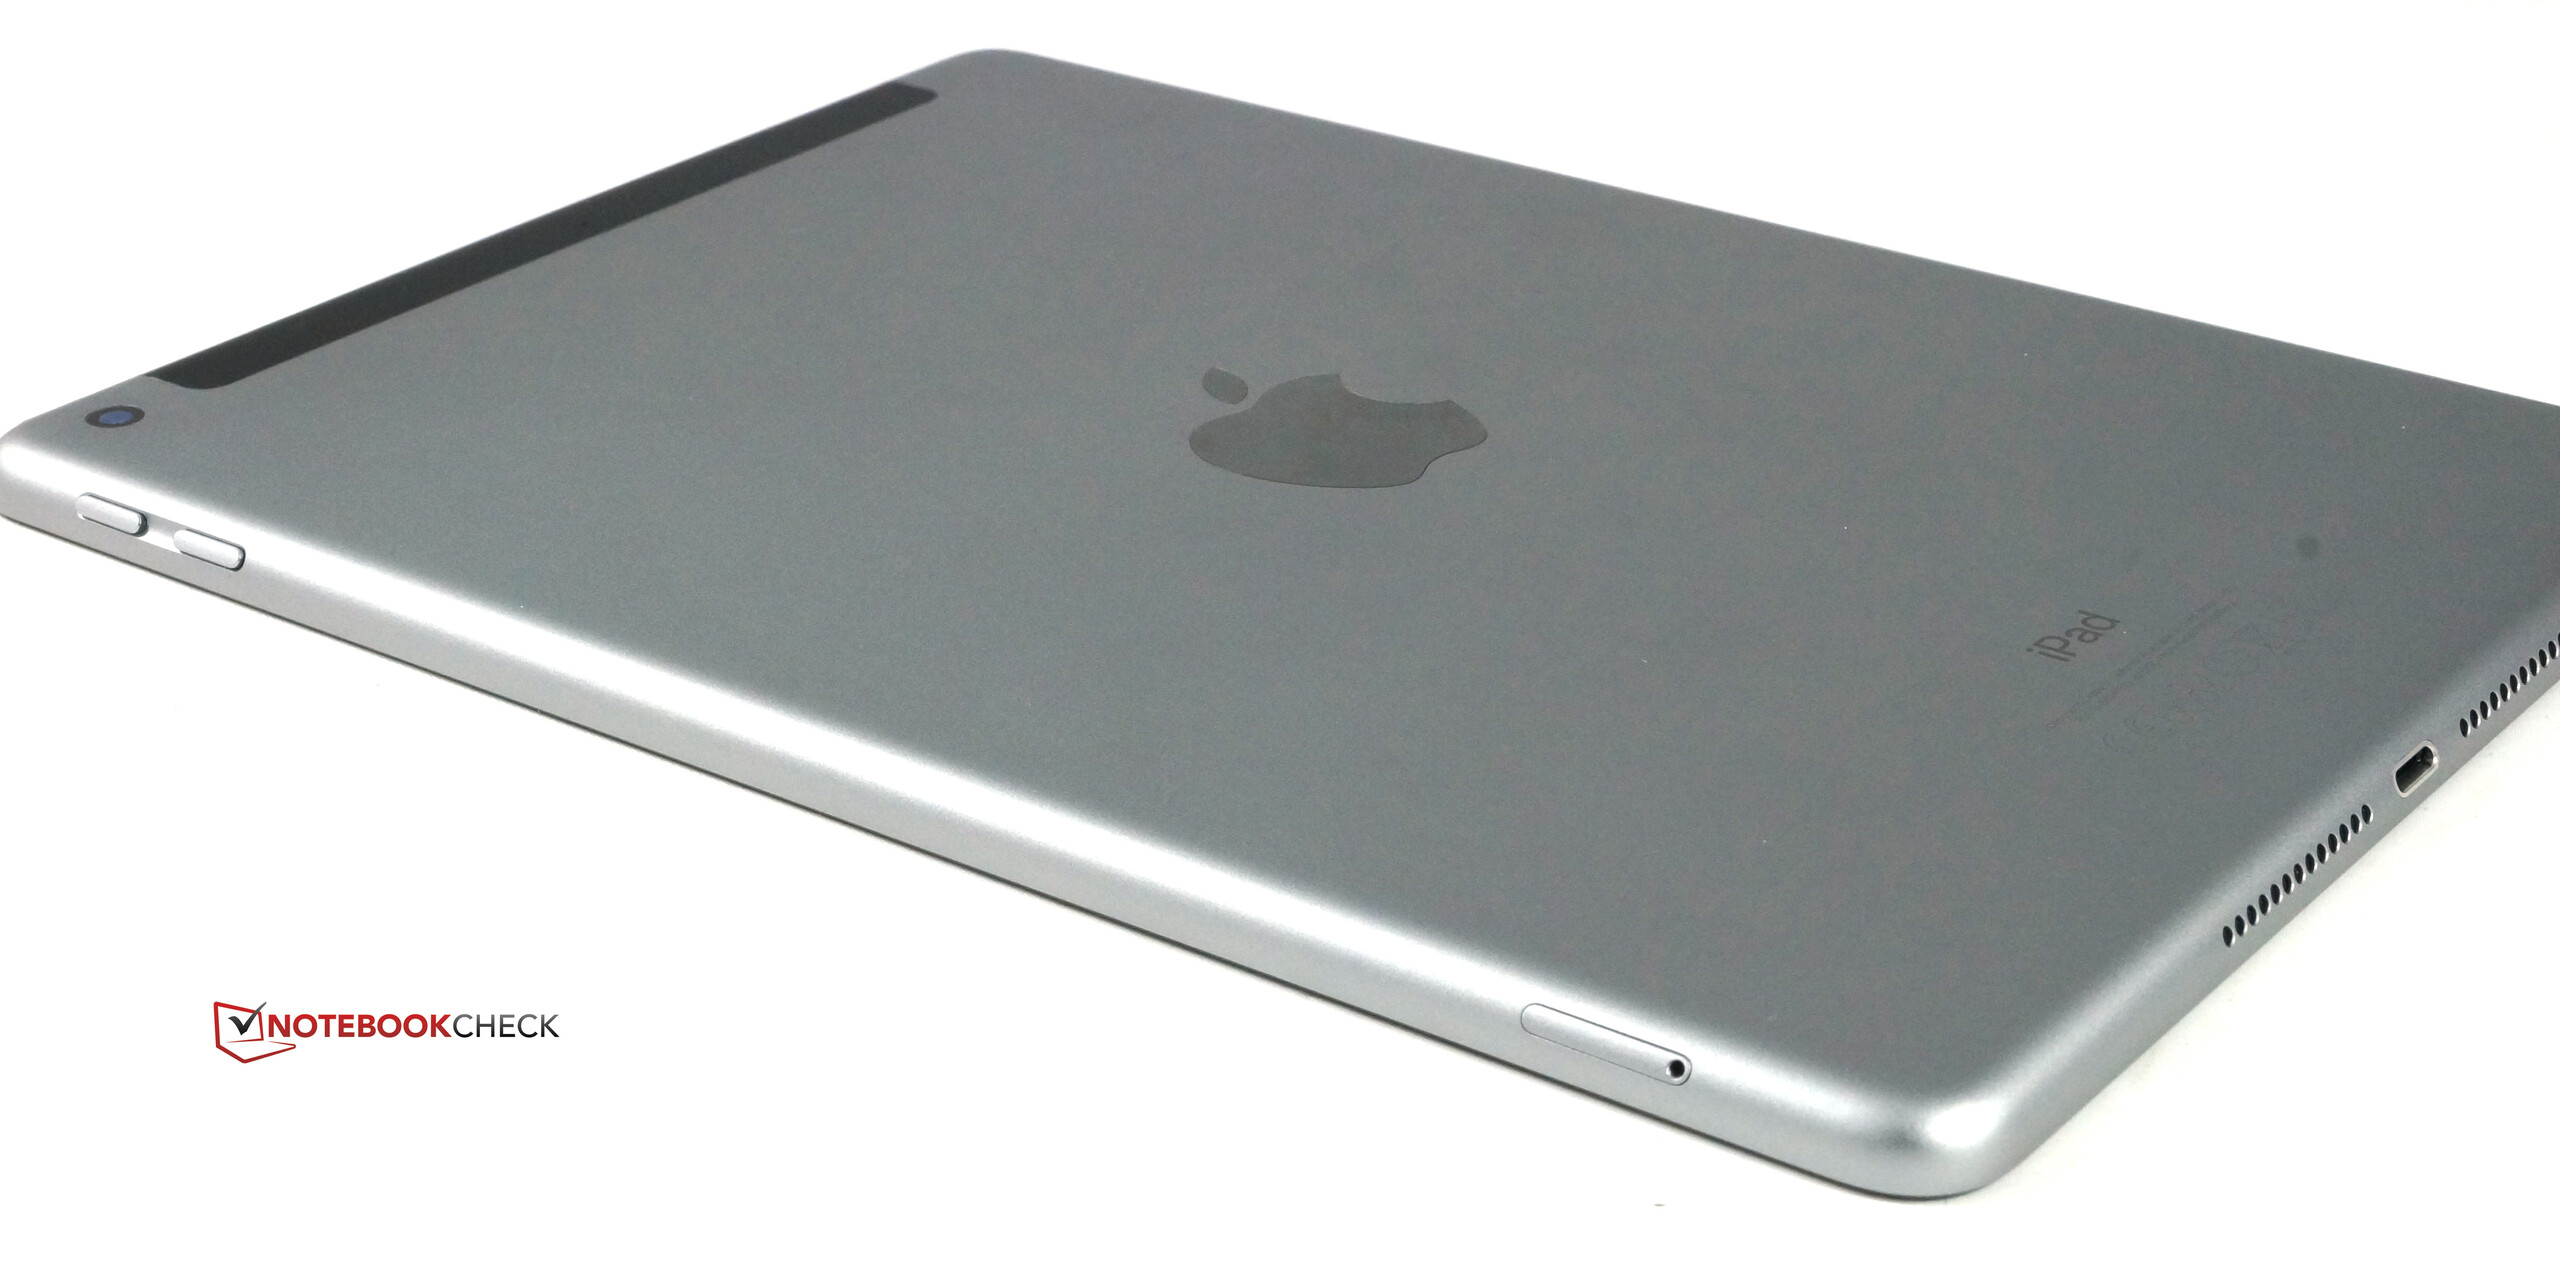
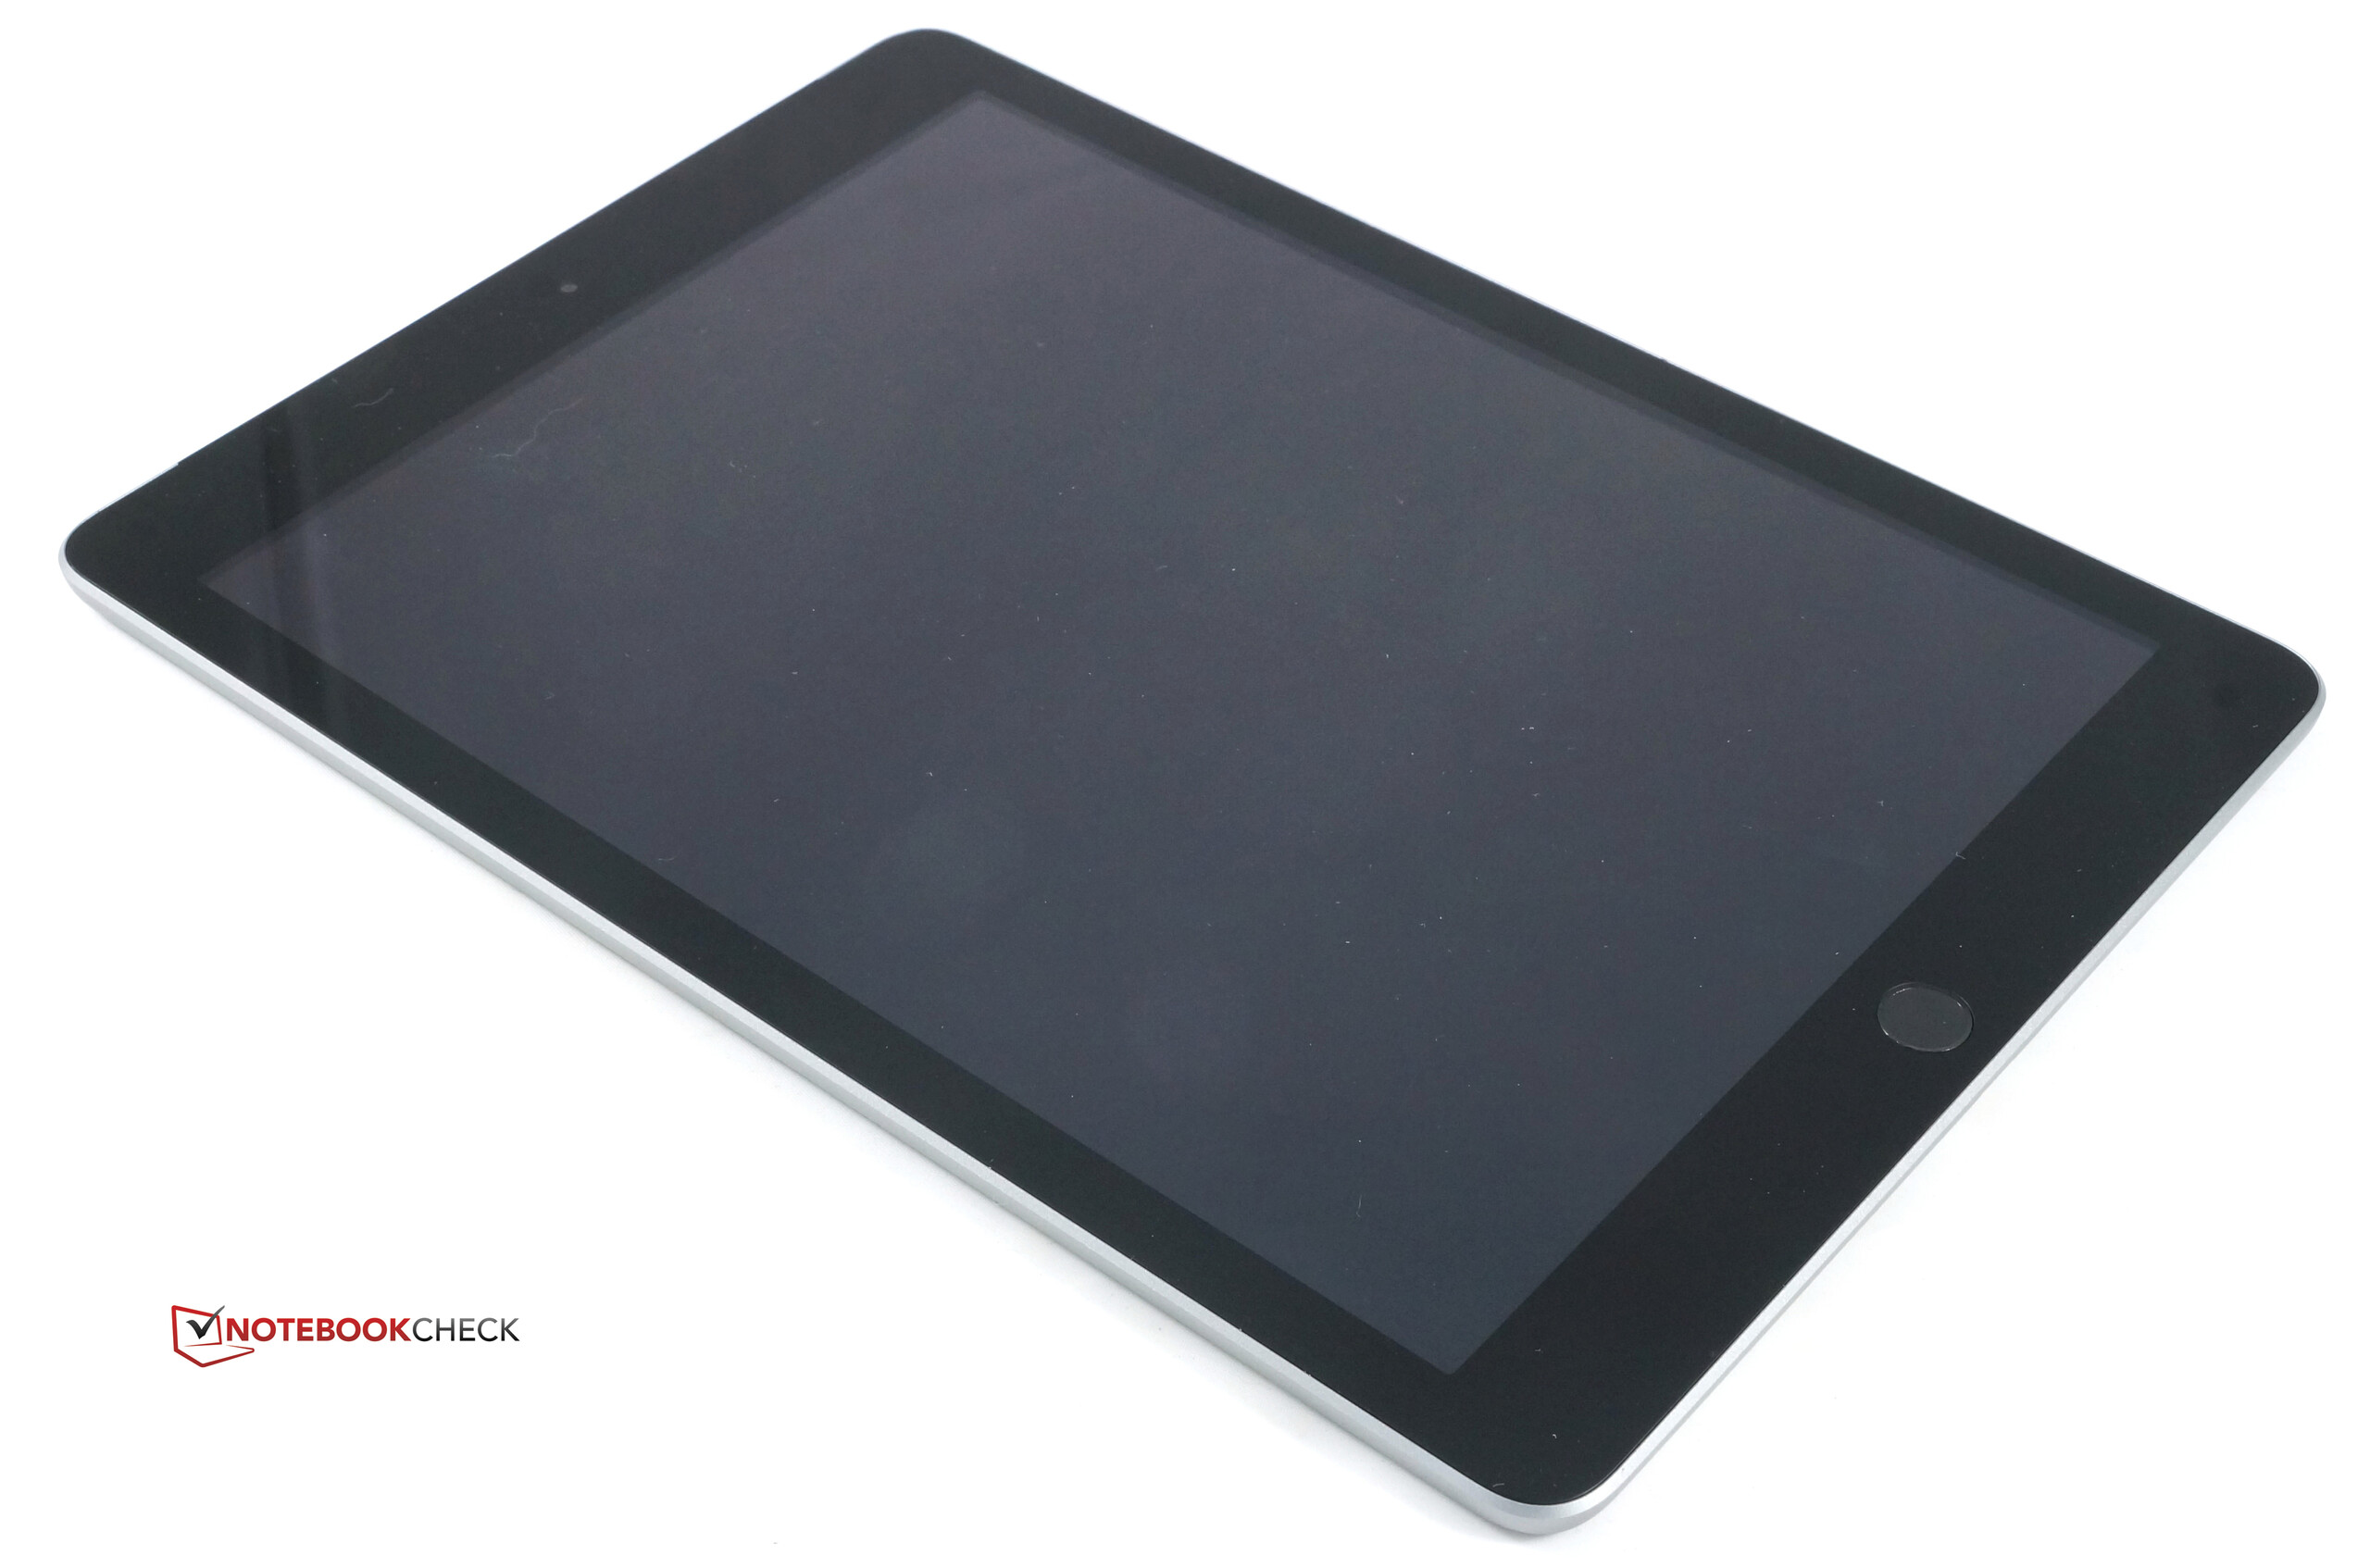
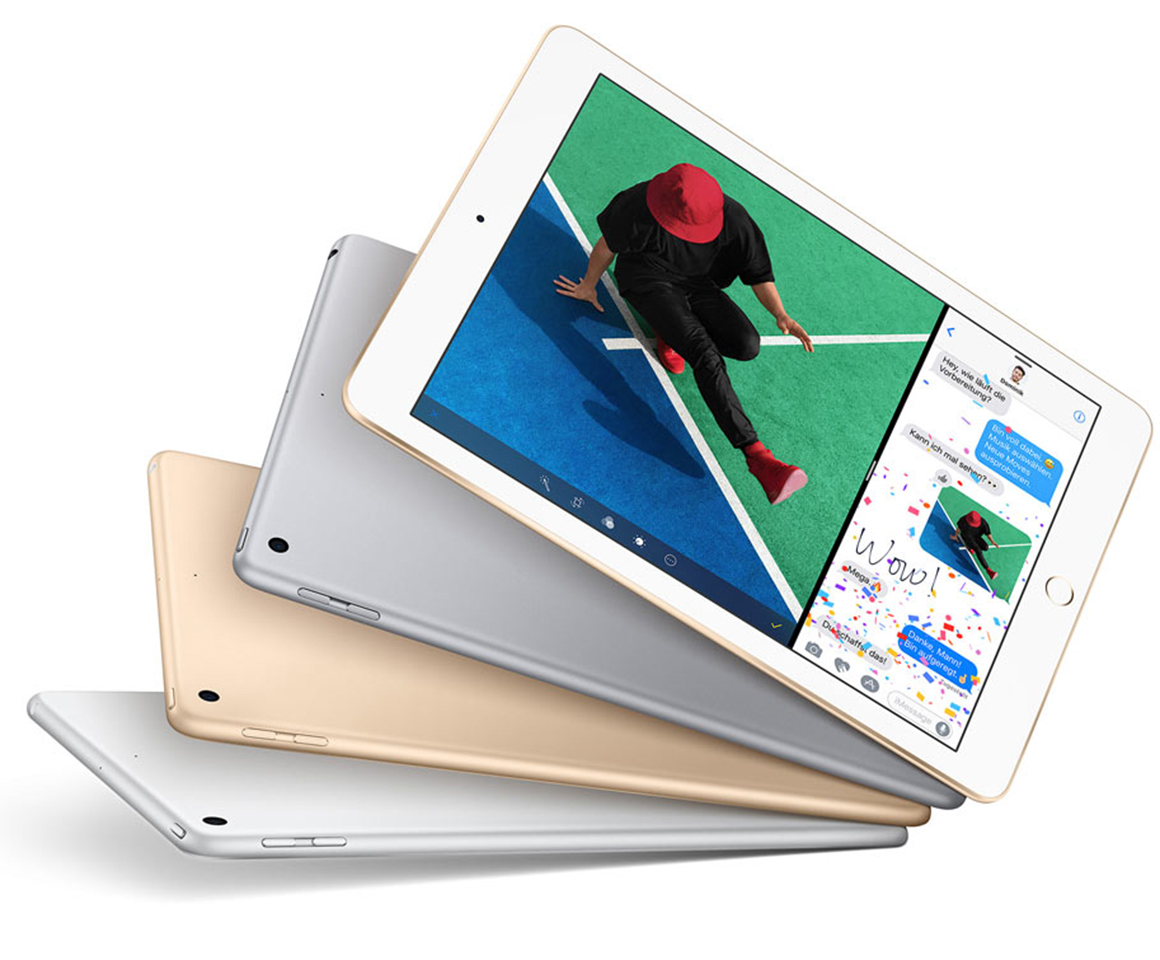
Apple iPad (2017) Tablet rövid értékelés
| Networking | |
| iperf3 transmit AX12 | |
| Apple iPhone 7 (Klaus I211) | |
| Apple iPad (2017) | |
| Samsung Galaxy S7 | |
| iperf3 receive AX12 | |
| Apple iPhone 7 (Klaus I211) | |
| Apple iPad (2017) | |
| Samsung Galaxy S7 | |

| |||||||||||||||||||||||||
Fényerő megoszlás: 88 %
Centrumban: 514 cd/m²
Kontraszt: 1117:1 (Fekete: 0.46 cd/m²)
ΔE ColorChecker Calman: 1.4 | ∀{0.5-29.43 Ø4.73}
ΔE Greyscale Calman: 2.1 | ∀{0.09-98 Ø4.97}
97.4% sRGB (Calman 2D)
Gamma: 2.22
CCT: 6647 K
| Apple iPad (2017) IPS, 2048x1536, 9.7" | Apple iPad Air 1 2013 IPS, 2048x1536, 9.7" | Apple iPad Pro 9.7 IPS, 2048x1536, 9.7" | Apple iPad Pro 12.9 IPS, 2732x2048, 12.9" | Google Pixel C LTPS, 2560x1800, 10.2" | Huawei MediaPad T2 10.0 Pro IPS, 1920x1200, 10.1" | |
|---|---|---|---|---|---|---|
| Screen | -10% | 10% | -11% | -75% | -79% | |
| Brightness middle (cd/m²) | 514 | 473 -8% | 523 2% | 399 -22% | 487 -5% | 392 -24% |
| Brightness (cd/m²) | 485 | 442 -9% | 500 3% | 393 -19% | 510 5% | 385 -21% |
| Brightness Distribution (%) | 88 | 90 2% | 93 6% | 92 5% | 91 3% | 91 3% |
| Black Level * (cd/m²) | 0.46 | 0.41 11% | 0.52 -13% | 0.22 52% | 0.39 15% | 0.59 -28% |
| Contrast (:1) | 1117 | 1154 3% | 1006 -10% | 1814 62% | 1249 12% | 664 -41% |
| Colorchecker dE 2000 * | 1.4 | 2.82 -101% | 1.1 21% | 2.96 -111% | 5.24 -274% | 4.5 -221% |
| Colorchecker dE 2000 max. * | 2.9 | 1.9 34% | 7.8 -169% | |||
| Greyscale dE 2000 * | 2.1 | 1.45 31% | 1.4 33% | 3 -43% | 7.95 -279% | 4.8 -129% |
| Gamma | 2.22 99% | 2.47 89% | 2.11 104% | 2.21 100% | 2.16 102% | 2.47 89% |
| CCT | 6647 98% | 6768 96% | 6662 98% | 7049 92% | 6565 99% | 7426 88% |
| Color Space (Percent of AdobeRGB 1998) (%) | 62.97 | 71.15 | ||||
| Color Space (Percent of sRGB) (%) | 99.55 | 97.87 |
* ... a kisebb jobb
Képernyő villogása / PWM (impulzusszélesség-moduláció)
| Képernyő villogása / PWM nem érzékelhető | 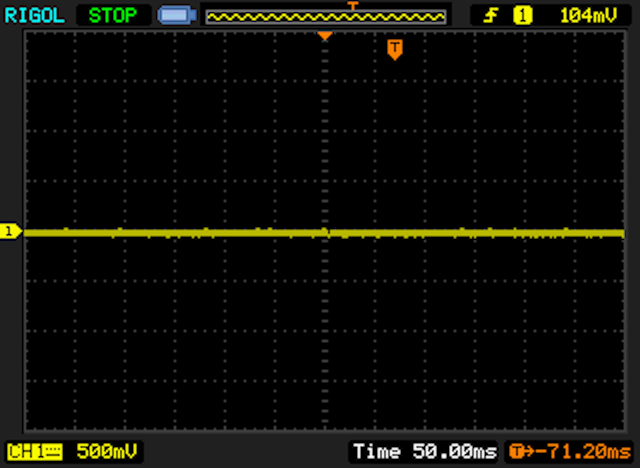 | ||
Összehasonlításképpen: az összes tesztelt eszköz 52 %-a nem használja a PWM-et a kijelző elsötétítésére. Ha PWM-et észleltek, akkor átlagosan 7798 (minimum: 5 - maximum: 343500) Hz-t mértek. | |||
Megjelenítési válaszidők
| ↔ Válaszidő Fekete-fehér | ||
|---|---|---|
| 26 ms ... emelkedés és süllyedés ↘ kombinálva | ↗ 15 ms emelkedés | 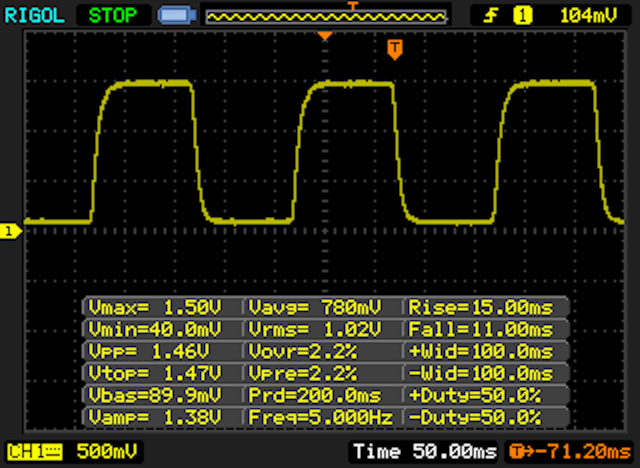 |
| ↘ 11 ms ősz | ||
| A képernyő viszonylag lassú reakciósebességet mutat tesztjeinkben, és túl lassú lehet a játékosok számára. Összehasonlításképpen, az összes tesztelt eszköz 0.1 (minimum) és 240 (maximum) ms között mozog. » 62 % of all devices are better. Ez azt jelenti, hogy a mért válaszidő rosszabb, mint az összes vizsgált eszköz átlaga (19.9 ms). | ||
| ↔ Válaszidő 50% szürke és 80% szürke között | ||
| 40 ms ... emelkedés és süllyedés ↘ kombinálva | ↗ 23 ms emelkedés | 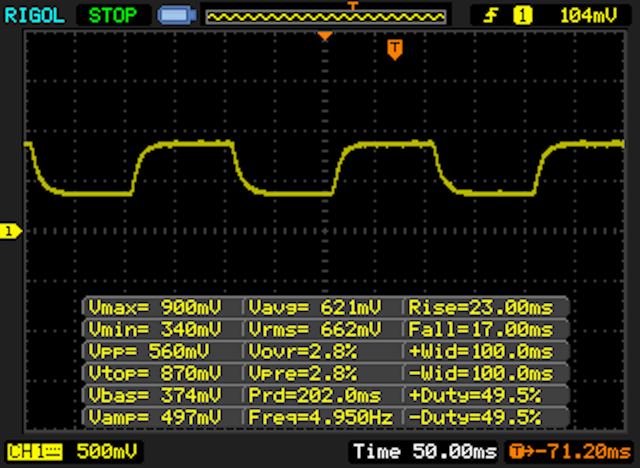 |
| ↘ 17 ms ősz | ||
| A képernyő lassú reakciósebességet mutat tesztjeinkben, és nem lesz kielégítő a játékosok számára. Összehasonlításképpen, az összes tesztelt eszköz 0.165 (minimum) és 636 (maximum) ms között mozog. » 61 % of all devices are better. Ez azt jelenti, hogy a mért válaszidő rosszabb, mint az összes vizsgált eszköz átlaga (31.1 ms). | ||
| AnTuTu v6 - Total Score | |
| Apple iPad Pro 12.9 | |
| Apple iPad Pro 9.7 | |
| Samsung Galaxy Tab S3 SM-T825 | |
| Apple iPhone 7 | |
| Apple iPad (2017) | |
| Google Pixel C | |
| Huawei MediaPad T2 10.0 Pro | |
| GFXBench 3.0 | |
| on screen Manhattan Onscreen OGL | |
| Apple iPhone 7 | |
| Apple iPad Pro 9.7 | |
| Samsung Galaxy Tab S3 SM-T825 | |
| Apple iPad Pro 12.9 | |
| Apple iPad (2017) | |
| Google Pixel C | |
| Huawei MediaPad T2 10.0 Pro | |
| 1920x1080 1080p Manhattan Offscreen | |
| Apple iPad Pro 12.9 | |
| Apple iPhone 7 | |
| Apple iPad Pro 9.7 | |
| Samsung Galaxy Tab S3 SM-T825 | |
| Apple iPad (2017) | |
| Google Pixel C | |
| Huawei MediaPad T2 10.0 Pro | |
| GFXBench 3.1 | |
| on screen Manhattan ES 3.1 Onscreen | |
| Apple iPhone 7 | |
| Apple iPad Pro 12.9 | |
| Apple iPad Pro 9.7 | |
| Samsung Galaxy Tab S3 SM-T825 | |
| Apple iPad (2017) | |
| Google Pixel C | |
| 1920x1080 Manhattan ES 3.1 Offscreen | |
| Apple iPad Pro 12.9 | |
| Apple iPhone 7 | |
| Apple iPad Pro 9.7 | |
| Samsung Galaxy Tab S3 SM-T825 | |
| Google Pixel C | |
| Apple iPad (2017) | |
| Basemark ES 3.1 / Metal - offscreen Overall Score | |
| Apple iPad Pro 12.9 | |
| Apple iPhone 7 | |
| Apple iPhone 7 | |
| Apple iPad Pro 9.7 | |
| Apple iPad (2017) | |
| Google Pixel C | |
| Samsung Galaxy Tab S3 SM-T825 | |
| Octane V2 - Total Score | |
| Apple iPhone 7 | |
| Apple iPad Pro 12.9 | |
| Apple iPad Pro 9.7 | |
| Apple iPad (2017) | |
| Samsung Galaxy Tab S3 SM-T825 | |
| Google Pixel C | |
| Apple iPad Air 1 2013 | |
| Huawei MediaPad T2 10.0 Pro | |
| Mozilla Kraken 1.1 - Total | |
| Huawei MediaPad T2 10.0 Pro | |
| Apple iPad Air 1 2013 | |
| Google Pixel C | |
| Samsung Galaxy Tab S3 SM-T825 | |
| Apple iPad Pro 9.7 | |
| Apple iPad Pro 12.9 | |
| Apple iPad (2017) | |
| Apple iPhone 7 | |
| JetStream 1.1 - 1.1 Total | |
| Apple iPhone 7 | |
| Apple iPad Pro 9.7 | |
| Apple iPad Pro 12.9 | |
| Apple iPad (2017) | |
| Google Pixel C | |
| Samsung Galaxy Tab S3 SM-T825 | |
| Huawei MediaPad T2 10.0 Pro | |
| WebXPRT 2015 - Overall | |
| Apple iPad Pro 9.7 | |
| Apple iPad Pro 12.9 | |
| Apple iPad (2017) | |
| Apple iPhone 7 | |
| Samsung Galaxy Tab S3 SM-T825 | |
| Google Pixel C | |
| Huawei MediaPad T2 10.0 Pro | |
* ... a kisebb jobb
| PassMark PerformanceTest Mobile V1 - Disk Tests | |
| Apple iPad Pro 12.9 | |
| Apple iPad Pro 9.7 | |
| Apple iPad (2017) | |
| Apple iPhone 7 | |
| Apple iPad Air 1 2013 | |
| Google Pixel C | |
| BaseMark OS II - Memory | |
| Apple iPad Pro 9.7 | |
| Apple iPad Pro 12.9 | |
| Samsung Galaxy Tab S3 SM-T825 | |
| Apple iPad (2017) | |
| Apple iPhone 7 | |
| Google Pixel C | |
| Huawei MediaPad T2 10.0 Pro | |
(+) A felső oldalon a maximális hőmérséklet 35.2 °C / 95 F, összehasonlítva a 33.6 °C / 92 F átlagával , 20.7 és 53.2 °C között a Tablet osztálynál.
(+) Az alsó maximum 37.7 °C / 100 F-ig melegszik fel, összehasonlítva a 33.2 °C / 92 F átlagával
(+) Üresjáratban a felső oldal átlagos hőmérséklete 31 °C / 88 F, összehasonlítva a 30 °C / ### eszközátlaggal class_avg_f### F.
Apple iPad (2017) hangelemzés
(+) | a hangszórók viszonylag hangosan tudnak játszani (86.1 dB)
Basszus 100 - 315 Hz
(-) | szinte nincs basszus – átlagosan 17.5%-kal alacsonyabb a mediánnál
(±) | a basszus linearitása átlagos (10.8% delta az előző frekvenciához)
Közepes 400-2000 Hz
(+) | kiegyensúlyozott középpontok – csak 2.8% választja el a mediántól
(+) | a középpontok lineárisak (5.3% delta az előző frekvenciához)
Maximum 2-16 kHz
(±) | magasabb csúcsok – átlagosan 8.5%-kal magasabb, mint a medián
(+) | a csúcsok lineárisak (3.9% delta az előző frekvenciához képest)
Összességében 100 - 16.000 Hz
(±) | az általános hang linearitása átlagos (19% eltérés a mediánhoz képest)
Ugyanazon osztályhoz képest
» 52%Ebben az osztályban az összes tesztelt eszköz %-a jobb volt, 5% hasonló, 43%-kal rosszabb
» A legjobb delta értéke 7%, az átlag 20%, a legrosszabb 129% volt
Az összes tesztelt eszközzel összehasonlítva
» 45% az összes tesztelt eszköz jobb volt, 7% hasonló, 48%-kal rosszabb
» A legjobb delta értéke 4%, az átlag 24%, a legrosszabb 134% volt
Apple iPad Pro 9.7 hangelemzés
(+) | a hangszórók viszonylag hangosan tudnak játszani (90.6 dB)
Basszus 100 - 315 Hz
(-) | szinte nincs basszus – átlagosan 23.2%-kal alacsonyabb a mediánnál
(±) | a basszus linearitása átlagos (8.6% delta az előző frekvenciához)
Közepes 400-2000 Hz
(+) | kiegyensúlyozott középpontok – csak 4.7% választja el a mediántól
(+) | a középpontok lineárisak (4.9% delta az előző frekvenciához)
Maximum 2-16 kHz
(+) | kiegyensúlyozott csúcsok – csak 4.6% választja el a mediántól
(+) | a csúcsok lineárisak (4.1% delta az előző frekvenciához képest)
Összességében 100 - 16.000 Hz
(±) | az általános hang linearitása átlagos (16.8% eltérés a mediánhoz képest)
Ugyanazon osztályhoz képest
» 41%Ebben az osztályban az összes tesztelt eszköz %-a jobb volt, 5% hasonló, 55%-kal rosszabb
» A legjobb delta értéke 7%, az átlag 20%, a legrosszabb 129% volt
Az összes tesztelt eszközzel összehasonlítva
» 29% az összes tesztelt eszköz jobb volt, 8% hasonló, 63%-kal rosszabb
» A legjobb delta értéke 4%, az átlag 24%, a legrosszabb 134% volt
| Kikapcsolt állapot / Készenlét | |
| Üresjárat | |
| Terhelés |
|
Kulcs:
min: | |
| Apple iPad (2017) 8.827 mAh | Apple iPad Pro 9.7 7306 mAh | Apple iPad Pro 12.9 10307 mAh | Apple iPad Air 1 2013 mAh | Google Pixel C mAh | Huawei MediaPad T2 10.0 Pro 6600 mAh | |
|---|---|---|---|---|---|---|
| Power Consumption | 5% | -31% | 15% | 16% | 34% | |
| Idle Minimum * (Watt) | 2.06 | 1.71 17% | 2.69 -31% | 1.8 13% | 1.82 12% | 1.58 23% |
| Idle Average * (Watt) | 7.42 | 7.55 -2% | 10.95 -48% | 5.9 20% | 4.26 43% | 4.12 44% |
| Idle Maximum * (Watt) | 7.47 | 7.62 -2% | 11.14 -49% | 7.1 5% | 4.33 42% | 4.15 44% |
| Load Average * (Watt) | 9.45 | 8.39 11% | 11.54 -22% | 7.5 21% | 9.82 -4% | 6.2 34% |
| Load Maximum * (Watt) | 12.31 | 12.08 2% | 12.8 -4% | 10.4 16% | 13.99 -14% | 9.27 25% |
* ... a kisebb jobb
| Apple iPad (2017) 8.827 mAh | Apple iPad Pro 9.7 7306 mAh | Apple iPad Pro 12.9 10307 mAh | Apple iPad Air 1 2013 mAh | Samsung Galaxy Tab S3 SM-T825 6000 mAh | Google Pixel C mAh | Huawei MediaPad T2 10.0 Pro 6600 mAh | |
|---|---|---|---|---|---|---|---|
| Akkumulátor üzemidő | -2% | -5% | -5% | 15% | 10% | -22% | |
| Reader / Idle (h) | 24.9 | 30.8 24% | 32.2 29% | 23.8 -4% | 31.7 27% | 34.8 40% | 20.5 -18% |
| H.264 (h) | 14.1 | 11.8 -16% | 10.5 -26% | 10.7 -24% | 9.2 -35% | 12.3 -13% | 9.9 -30% |
| WiFi v1.3 (h) | 12.7 | 13 2% | 11.6 -9% | 12.7 0% | 10.6 -17% | 6.9 -46% | |
| Load (h) | 3.8 | 3.1 -18% | 3.3 -13% | 4.3 13% | 6.3 66% | 4.9 29% | 4.1 8% |
| WiFi (h) | 9.2 |
Pro
Kontra
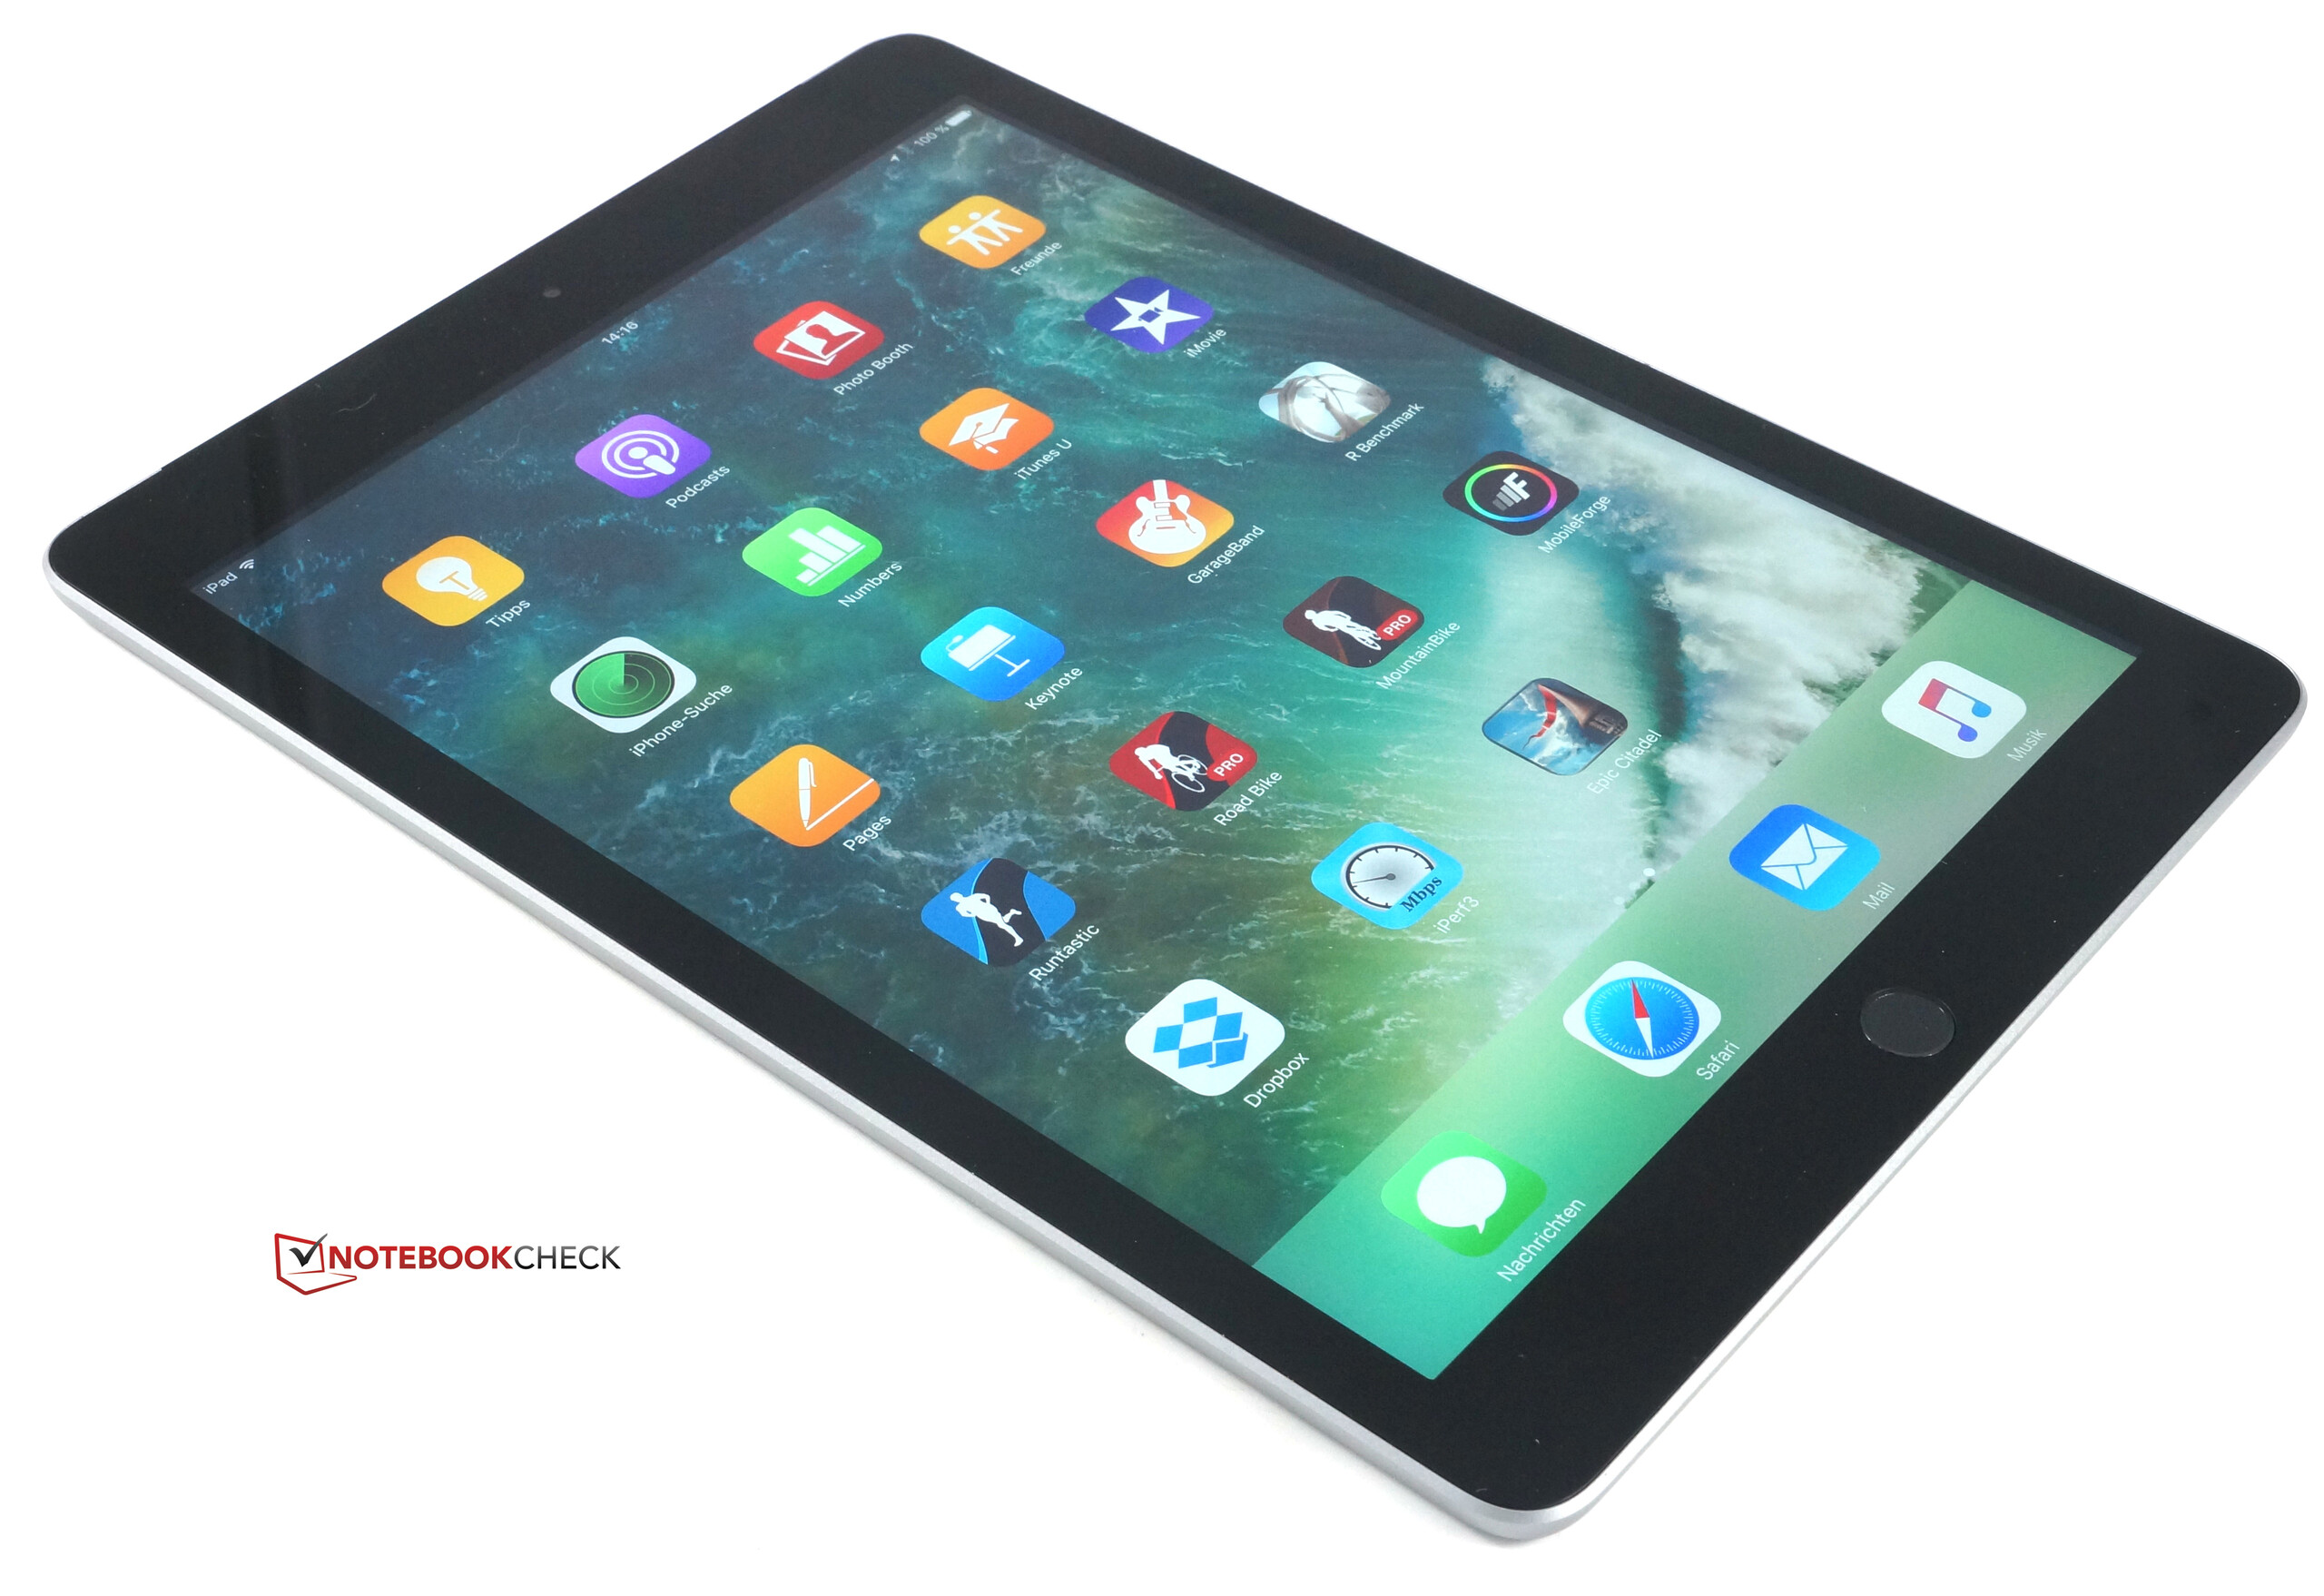
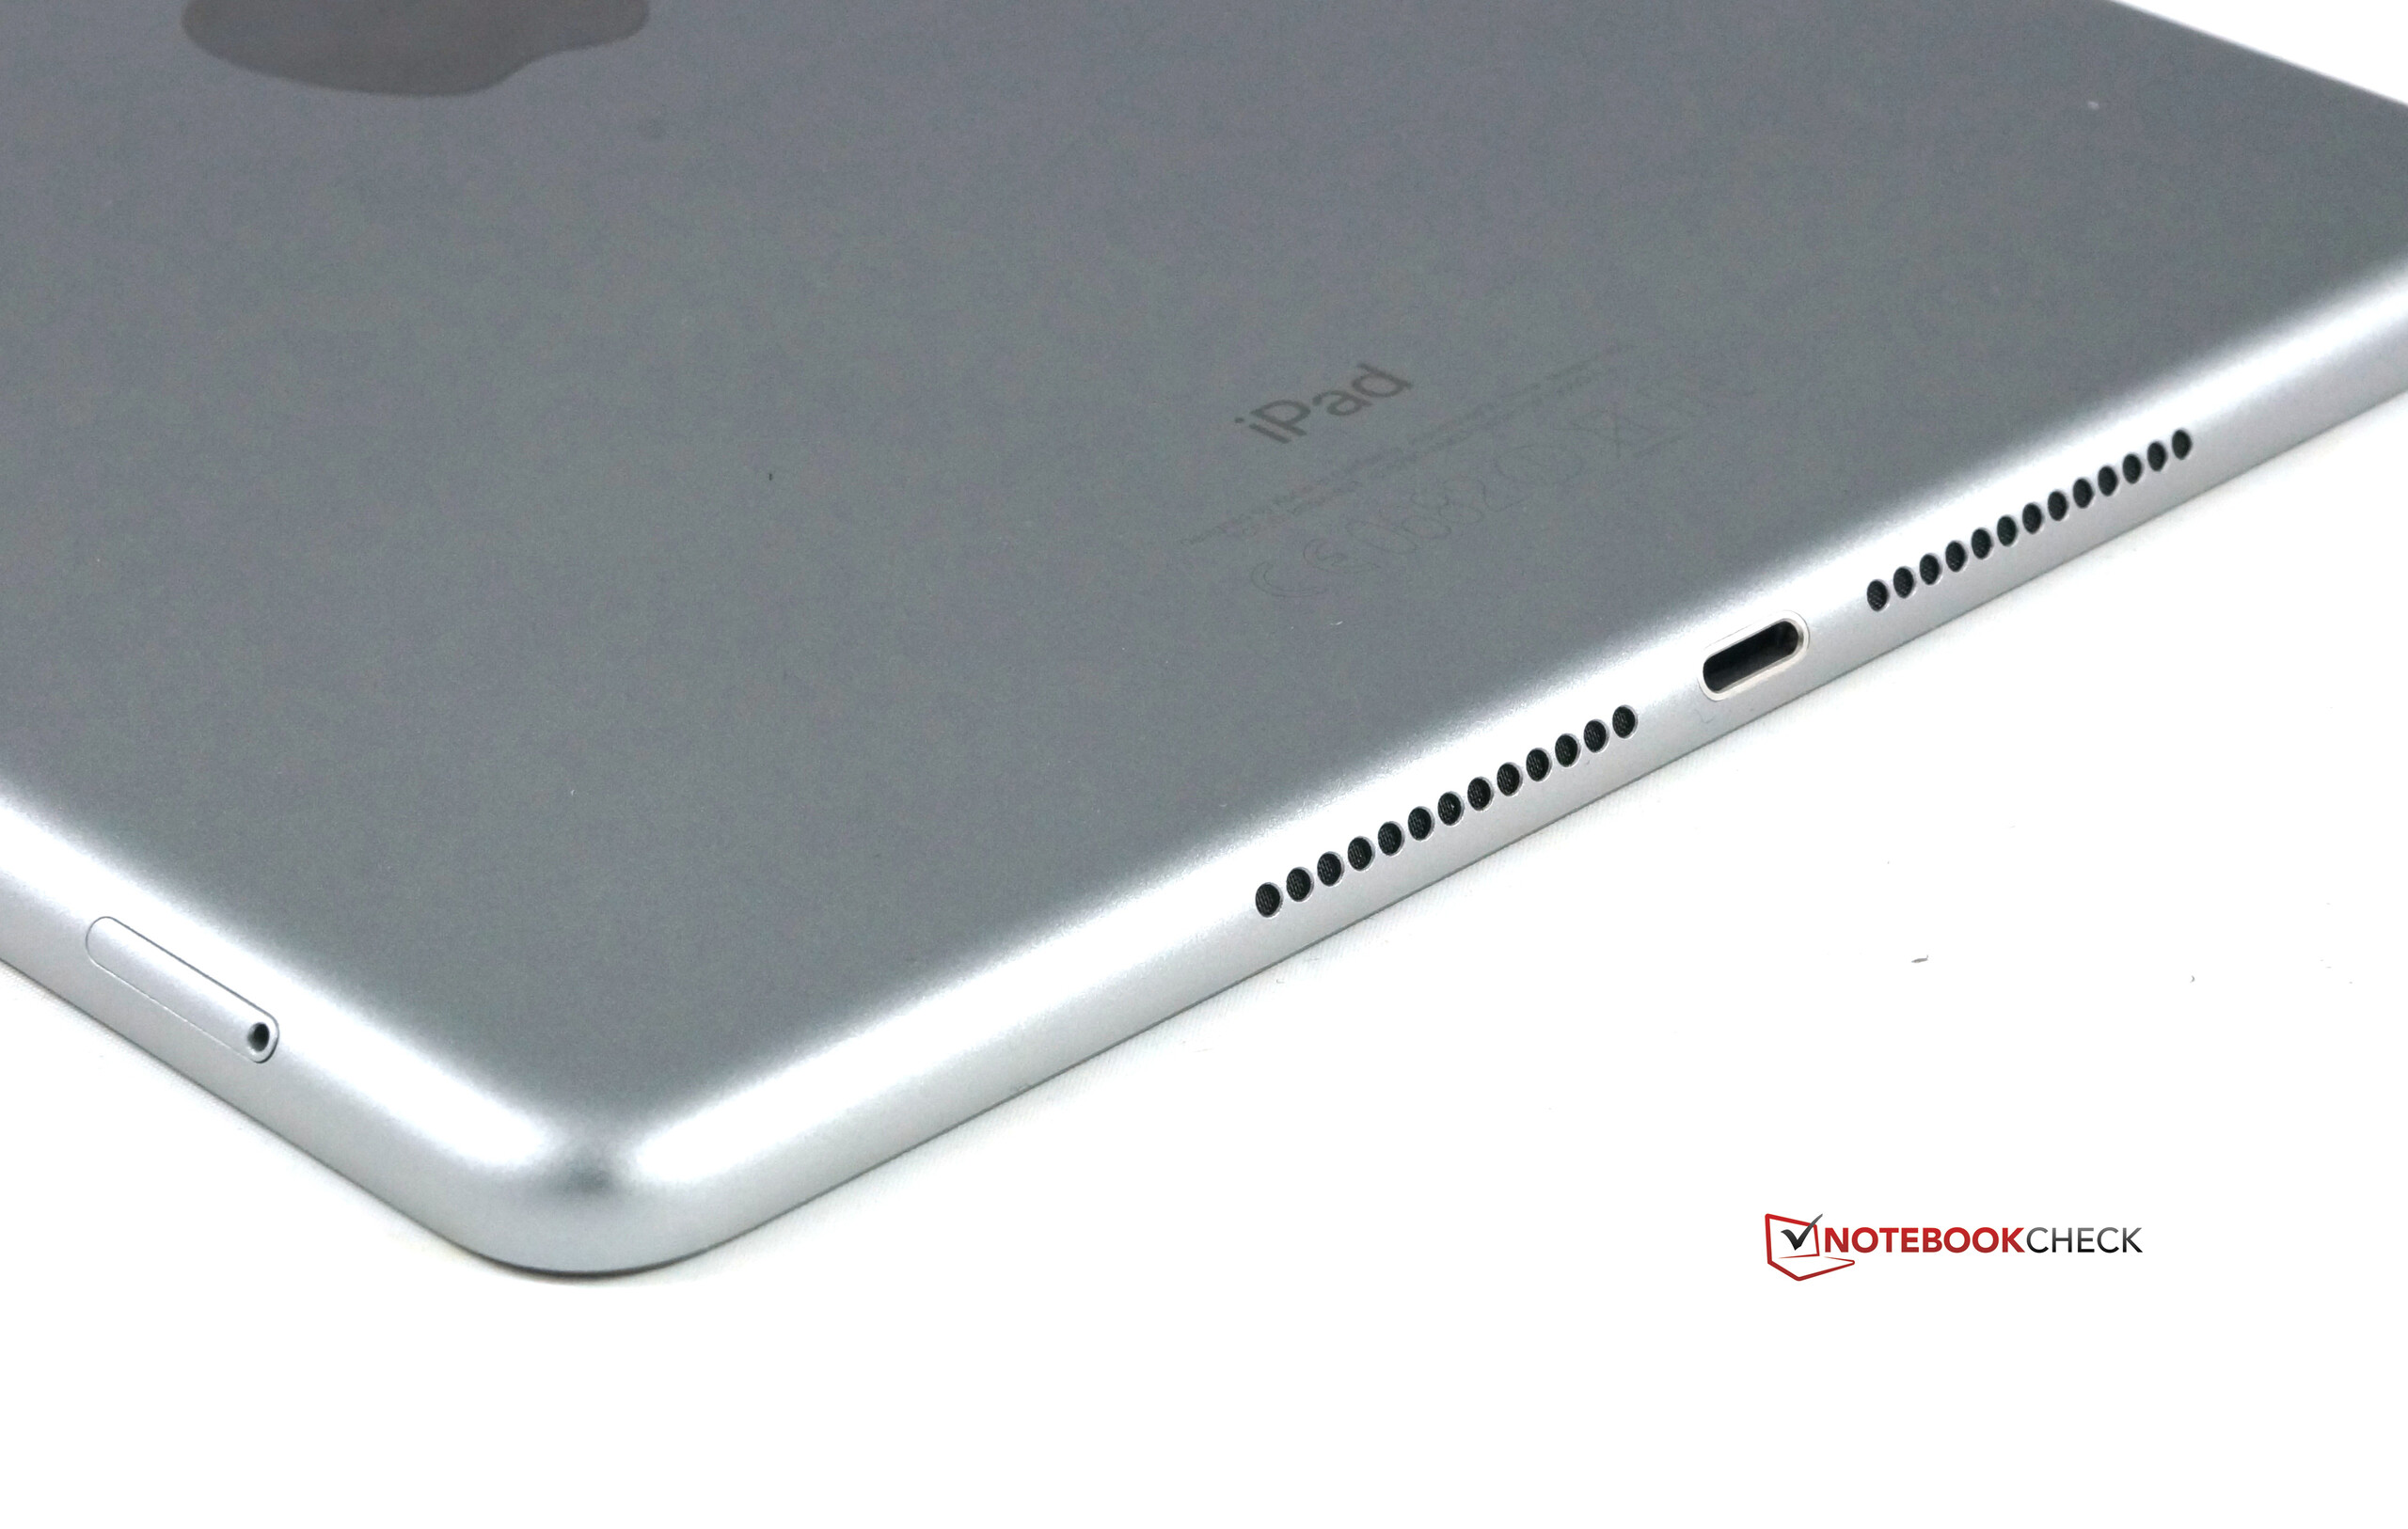
Régi bor, új palackban. Gyakran ez az érzésünk, amikor egy gyártó felfrissít egy öregnek számító terméket. Főleg, ha az régebbi technikai megoldásokat tartalmaz. A legújabb Apple iPad esetében is ez a helyzet.A 2017-es iOS tablet pontosan ez: újrahasznosított, régi hardver, még régibb házban. Viszont cserébe a belépő szintű verziója csak 400 euróba ($329) kerül, amely majdnem ingyen van az Apple tabletei között. Amennyiben csak felületesen néztük volna meg a dolgot, itt véget is érhetne az összefoglalás.
Közelebbről megvizsgálva azonban hamar eloszlik a kiemelt kételyeink nagy része. Igen, a lapkakészlet öregecske, de a tabletek között még mindig igen jól teljesít. Igen, a ház már pár éves, és közben leváltotta egy vékonyabb verzió. Ugyanakkor az anyaghasználat még mindig kiváló, és remekül is van összerakva. Úgy véljük, hogy vékonyabb, vagy könnyebb iPad-re senki nem vágyhat, hacsak az iPad Air 2-re, vagy az iPad Pro 9.7-re nem.
Az Apple ezen kívül javított az új iPad pár részletén, összehasonlítva a régi iPad Air-rel. Az első, egy gyorsabb chip. A kijelző is sokkal könnyebb, és az akku üzemideje még jobb. A gyors WiFi-vel, a gazdag LTE sávválasztékkal, kiváló GPS-szel, valamint egy használható kamerával ez a régi bor mindjárt inkább óbornak tűnik.
Azért hiányosságai így is vannak. A teljesen laminált kijelző hiánya visszahozza a régi tabletes problémát: a direkt napfény tükörré konvertálja a készüléket. Ez egy idegesítő visszalépés mindazoknak, akik már használták az iPad Mini 4-et vagy az Air 2-t. Az új iPad "csak" sRGB színeket hoz, de ez azért nem egy hatalmas hátrány. Ezen felül 400 euróért nem kapunk Apple Pencil támogatást - nos, erre vannak a drágább Pro modellek.
Összegezve: az új Apple iPad majdnem unalmasan jó. A régi hardver ellenére nem igazán van a többi Apple tableten kívül más riválisa a teljesítmény terén. Az összesített pontszám a "gyengébb fél" számára csodálatos, bár részben a gyenge felhozatalnak is köszönhető.
Ez az eredeti értékelés rövidített változata. A teljes, angol nyelvű cikk itt olvasható.
Apple iPad (2017)
- 03/31/2018 v6 (old)
Patrick Afschar Kaboli
Price comparison
