Apple iPad 7 2019 rövid értékelés: Apró változások nagy befolyással?
Értékelés | Dátum | Modell | Súly | Magasság | Méret | Felbontás | Legjobb ár |
|---|---|---|---|---|---|---|---|
| 85.4 % v7 (old) | 12/2019 | Apple iPad 7 2019 A10 Fusion, A10 Fusion GPU | 483 g | 7.5 mm | 10.20" | 2160x1620 | |
| 84.6 % v7 (old) | 04/2018 | Apple iPad 6 2018 A10 Fusion, A10 Fusion GPU | 469 g | 7.5 mm | 9.70" | 2048x1536 | |
| 87.5 % v7 (old) | 04/2019 | Apple iPad Air 3 2019 A12 Bionic, A12 Bionic GPU | 456 g | 6.1 mm | 10.50" | 2224x1668 | |
| 89.8 % v7 (old) | 11/2018 | Apple iPad Pro 11 2018 A12X Bionic, A12X Bionic GPU | 468 g | 5.9 mm | 11.00" | 2388x1668 | |
| 87.5 % v6 (old) | 04/2018 | Huawei MediaPad M5 10.8 Pro Kirin 960, Mali-G71 MP8 | 498 g | 7.3 mm | 10.80" | 2560x1600 | |
| 84.5 % v7 (old) | 07/2019 | Samsung Galaxy Tab S5e SM-T720 SD 670, Adreno 616 | 400 g | 5.5 mm | 10.50" | 2560x1600 |


| |||||||||||||||||||||||||
Fényerő megoszlás: 87 %
Centrumban: 499 cd/m²
Kontraszt: 1018:1 (Fekete: 0.49 cd/m²)
ΔE ColorChecker Calman: 0.97 | ∀{0.5-29.43 Ø4.71}
ΔE Greyscale Calman: 0.9 | ∀{0.09-98 Ø4.96}
97.8% sRGB (Calman 2D)
Gamma: 2.135
CCT: 6571 K
| Apple iPad 7 2019 IPS, 2160x1620, 10.2" | Apple iPad 6 2018 IPS, 2048x1536, 9.7" | Apple iPad Air 3 2019 IPS, 2224x1668, 10.5" | Apple iPad Pro 11 2018 IPS, 2388x1668, 11" | Huawei MediaPad M5 10.8 Pro IPS, 2560x1600, 10.8" | Samsung Galaxy Tab S5e SM-T720 Super AMOLED, 2560x1600, 10.5" | |
|---|---|---|---|---|---|---|
| Screen | -14% | -44% | 4% | -255% | -57% | |
| Brightness middle (cd/m²) | 499 | 530 6% | 515 3% | 639 28% | 384 -23% | 452 -9% |
| Brightness (cd/m²) | 470 | 513 9% | 483 3% | 591 26% | 360 -23% | 453 -4% |
| Brightness Distribution (%) | 87 | 92 6% | 90 3% | 87 0% | 84 -3% | 90 3% |
| Black Level * (cd/m²) | 0.49 | 0.61 -24% | 0.41 16% | 0.45 8% | 0.8 -63% | |
| Contrast (:1) | 1018 | 869 -15% | 1256 23% | 1420 39% | 480 -53% | |
| Colorchecker dE 2000 * | 0.97 | 1.2 -24% | 1.6 -65% | 0.92 5% | 6.83 -604% | 1.7 -75% |
| Colorchecker dE 2000 max. * | 1.98 | 3.2 -62% | 4.4 -122% | 2.59 -31% | 12.7 -541% | 3.7 -87% |
| Greyscale dE 2000 * | 0.9 | 1 -11% | 2.8 -211% | 1.3 -44% | 7.5 -733% | 2.4 -167% |
| Gamma | 2.135 103% | 2.28 96% | 2.21 100% | 2.22 99% | 2.199 100% | 2.07 106% |
| CCT | 6571 99% | 6588 99% | 6944 94% | 6656 98% | 8544 76% | 6337 103% |
* ... a kisebb jobb
Képernyő villogása / PWM (impulzusszélesség-moduláció)
| Képernyő villogása / PWM nem érzékelhető | 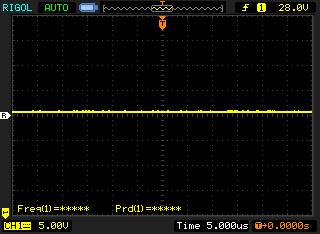 | ||
Összehasonlításképpen: az összes tesztelt eszköz 52 %-a nem használja a PWM-et a kijelző elsötétítésére. Ha PWM-et észleltek, akkor átlagosan 7741 (minimum: 5 - maximum: 343500) Hz-t mértek. | |||
Megjelenítési válaszidők
| ↔ Válaszidő Fekete-fehér | ||
|---|---|---|
| 18 ms ... emelkedés és süllyedés ↘ kombinálva | ↗ 7 ms emelkedés | 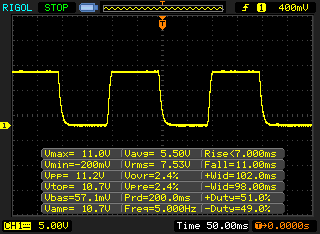 |
| ↘ 11 ms ősz | ||
| A képernyő jó reakciósebességet mutat tesztjeinkben, de túl lassú lehet a versenyképes játékosok számára. Összehasonlításképpen, az összes tesztelt eszköz 0.1 (minimum) és 240 (maximum) ms között mozog. » 40 % of all devices are better. Ez azt jelenti, hogy a mért válaszidő hasonló az összes vizsgált eszköz átlagához (19.8 ms). | ||
| ↔ Válaszidő 50% szürke és 80% szürke között | ||
| 38 ms ... emelkedés és süllyedés ↘ kombinálva | ↗ 19 ms emelkedés | 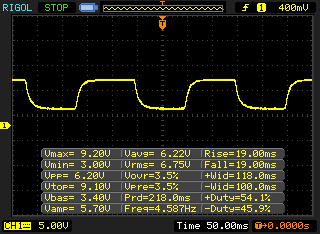 |
| ↘ 19 ms ősz | ||
| A képernyő lassú reakciósebességet mutat tesztjeinkben, és nem lesz kielégítő a játékosok számára. Összehasonlításképpen, az összes tesztelt eszköz 0.165 (minimum) és 636 (maximum) ms között mozog. » 55 % of all devices are better. Ez azt jelenti, hogy a mért válaszidő rosszabb, mint az összes vizsgált eszköz átlaga (30.9 ms). | ||
| Jetstream 2 - 2.0 Total | |
| Az osztály átlaga Tablet (35.8 - 420, n=55, az elmúlt 2 évben) | |
| Apple iPad Air 3 2019 (Safari Mobile 12) | |
| Apple iPad 7 2019 (Safari 13) | |
| Átlagos Apple A10 Fusion (54.2 - 76.2, n=2) | |
| Samsung Galaxy Tab S5e SM-T720 (Chrome 74.0.3729.136) | |
| JetStream 1.1 - 1.1 Total | |
| Apple iPad Pro 11 2018 (Safari 13) | |
| Apple iPad 7 2019 (Safari 13) | |
| Átlagos Apple A10 Fusion (165.9 - 172.6, n=4) | |
| Apple iPad 6 2018 (Safari Mobile 11.3) | |
| Huawei MediaPad M5 10.8 Pro (Chrome 68.0.3440.91) | |
| Samsung Galaxy Tab S5e SM-T720 (Chrome 74.0.3729.136) | |
| WebXPRT 3 - Overall | |
| Az osztály átlaga Tablet (168 - 520, n=10, az elmúlt 2 évben) | |
| Apple iPad Pro 11 2018 (Safari 13) | |
| Apple iPad Air 3 2019 (Safari Mobile 12) | |
| Apple iPad 7 2019 (Safari 13) | |
| Átlagos Apple A10 Fusion (79 - 111, n=2) | |
| Apple iPad 6 2018 (Safari Mobile 10) | |
| Huawei MediaPad M5 10.8 Pro (Chrome 68.0.3440.91) | |
| Samsung Galaxy Tab S5e SM-T720 (Chrome 74.0.3729.136) | |
| Speedometer 2.0 - Result 2.0 | |
| Az osztály átlaga Tablet (6.8 - 790, n=33, az elmúlt 2 évben) | |
| Apple iPad Pro 11 2018 (IOS 12.1.1) | |
| Apple iPad Air 3 2019 (Safari Mobile 12) | |
| Apple iPad 7 2019 (Safari 13) | |
| Átlagos Apple A10 Fusion (65.5 - 66.4, n=2) | |
| Apple iPad 6 2018 (IOS 12.1.1) | |
| Samsung Galaxy Tab S5e SM-T720 (Chrome 74.0.3729.136) | |
| Octane V2 - Total Score | |
| Az osztály átlaga Tablet (1633 - 138481, n=70, az elmúlt 2 évben) | |
| Apple iPad Pro 11 2018 (Safari 13) | |
| Apple iPad Air 3 2019 (Safari Mobile 12) | |
| Apple iPad 6 2018 (Safari Mobile 11.3) | |
| Apple iPad 7 2019 (Safari 13) | |
| Átlagos Apple A10 Fusion (19783 - 27967, n=5) | |
| Huawei MediaPad M5 10.8 Pro (Chrome 68.0.3440.91) | |
| Samsung Galaxy Tab S5e SM-T720 (Chrome 74.0.3729.136) | |
| Mozilla Kraken 1.1 - Total | |
| Huawei MediaPad M5 10.8 Pro (Chrome 68.0.3440.91) | |
| Samsung Galaxy Tab S5e SM-T720 (Chrome 74.0.3729.136) | |
| Az osztály átlaga Tablet (243 - 16233, n=65, az elmúlt 2 évben) | |
| Átlagos Apple A10 Fusion (1026 - 1531, n=5) | |
| Apple iPad 7 2019 (Safari 13) | |
| Apple iPad 6 2018 (Safari Mobile 11.3) | |
| Apple iPad Air 3 2019 (Safari Mobile 12) | |
| Apple iPad Pro 11 2018 (Safari 13) | |
* ... a kisebb jobb
#new_benchmarks
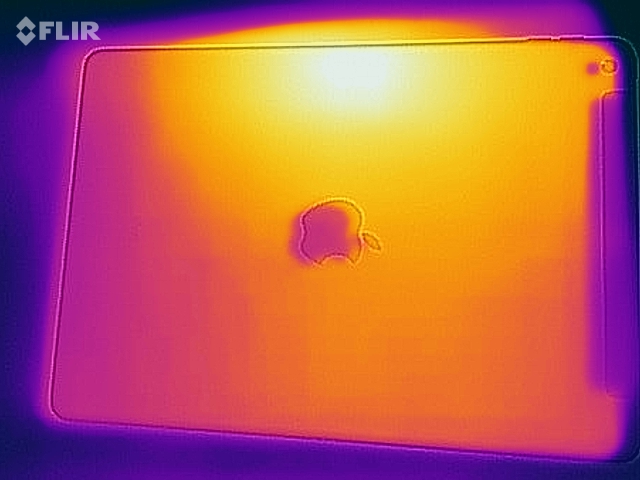
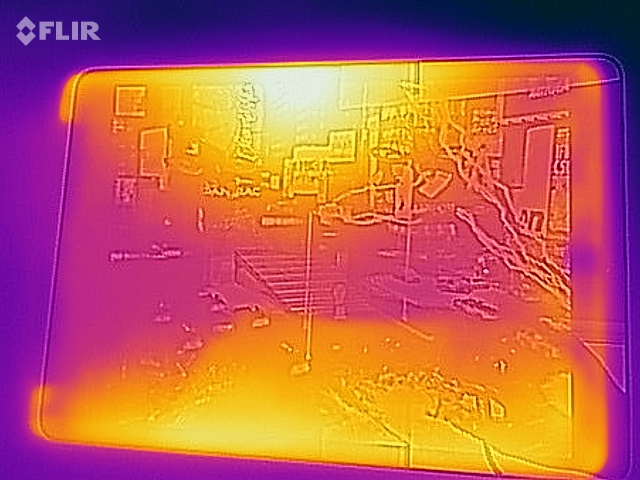
(+) A felső oldalon a maximális hőmérséklet 36.6 °C / 98 F, összehasonlítva a 33.7 °C / 93 F átlagával , 20.7 és 53.2 °C között a Tablet osztálynál.
(+) Az alsó maximum 36.8 °C / 98 F-ig melegszik fel, összehasonlítva a 33.2 °C / 92 F átlagával
(+) Üresjáratban a felső oldal átlagos hőmérséklete 29.5 °C / 85 F, összehasonlítva a 30 °C / ### eszközátlaggal class_avg_f### F.
Apple iPad 7 2019 hangelemzés
(±) | a hangszóró hangereje átlagos, de jó (81.6 dB)
Basszus 100 - 315 Hz
(-) | szinte nincs basszus – átlagosan 66.3%-kal alacsonyabb a mediánnál
(+) | a basszus lineáris (0% delta az előző frekvenciához)
Közepes 400-2000 Hz
(-) | szinte nincs középérték – átlagosan 66.3%-kal alacsonyabb a mediánnál
(+) | a középpontok lineárisak (0% delta az előző frekvenciához)
Maximum 2-16 kHz
(-) | szinte nincs csúcs – átlagosan 66.3%-kal alacsonyabb a mediánnál
(+) | a csúcsok lineárisak (0% delta az előző frekvenciához képest)
Összességében 100 - 16.000 Hz
(-) | az összhang nem lineáris (121.2% eltérés a mediánhoz képest)
Ugyanazon osztályhoz képest
» 99%Ebben az osztályban az összes tesztelt eszköz %-a jobb volt, 0% hasonló, 0%-kal rosszabb
» A legjobb delta értéke 7%, az átlag 20%, a legrosszabb 129% volt
Az összes tesztelt eszközzel összehasonlítva
» 97% az összes tesztelt eszköz jobb volt, 2% hasonló, 1%-kal rosszabb
» A legjobb delta értéke 4%, az átlag 23%, a legrosszabb 134% volt
Apple iPad 6 2018 hangelemzés
(±) | a hangszóró hangereje átlagos, de jó (75.7 dB)
Basszus 100 - 315 Hz
(±) | csökkentett basszus – átlagosan 11.2%-kal alacsonyabb, mint a medián
(±) | a basszus linearitása átlagos (11.9% delta az előző frekvenciához)
Közepes 400-2000 Hz
(+) | kiegyensúlyozott középpontok – csak 1.3% választja el a mediántól
(+) | a középpontok lineárisak (5.9% delta az előző frekvenciához)
Maximum 2-16 kHz
(+) | kiegyensúlyozott csúcsok – csak 3.3% választja el a mediántól
(±) | a csúcsok linearitása átlagos (11% delta az előző gyakorisághoz)
Összességében 100 - 16.000 Hz
(+) | általános hangzás lineáris (13.3% eltérés a mediánhoz képest)
Ugyanazon osztályhoz képest
» 24%Ebben az osztályban az összes tesztelt eszköz %-a jobb volt, 4% hasonló, 71%-kal rosszabb
» A legjobb delta értéke 7%, az átlag 20%, a legrosszabb 129% volt
Az összes tesztelt eszközzel összehasonlítva
» 14% az összes tesztelt eszköz jobb volt, 3% hasonló, 83%-kal rosszabb
» A legjobb delta értéke 4%, az átlag 23%, a legrosszabb 134% volt
| Kikapcsolt állapot / Készenlét | |
| Üresjárat | |
| Terhelés |
|
Kulcs:
min: | |
| Apple iPad 7 2019 mAh | Apple iPad 6 2018 mAh | Apple iPad Air 3 2019 8134 mAh | Apple iPad Pro 11 2018 7736 mAh | Huawei MediaPad M5 10.8 Pro 7500 mAh | Samsung Galaxy Tab S5e SM-T720 7040 mAh | |
|---|---|---|---|---|---|---|
| Power Consumption | -5% | 15% | 10% | 0% | 43% | |
| Idle Minimum * (Watt) | 2.2 | 2.2 -0% | 2.18 1% | 1.2 45% | 3.3 -50% | 2.07 6% |
| Idle Average * (Watt) | 6.7 | 7.8 -16% | 6.4 4% | 4.1 39% | 4.2 37% | 3.94 41% |
| Idle Maximum * (Watt) | 8.2 | 7.9 4% | 6.43 22% | 7.5 9% | 7 15% | 3.96 52% |
| Load Average * (Watt) | 11.3 | 12.6 -12% | 7.48 34% | 13.6 -20% | 10.4 8% | 4.07 64% |
| Load Maximum * (Watt) | 12.5 | 12.8 -2% | 10.65 15% | 15.2 -22% | 13.8 -10% | 5.73 54% |
* ... a kisebb jobb
| Apple iPad 7 2019 mAh | Apple iPad 6 2018 mAh | Apple iPad Air 3 2019 8134 mAh | Apple iPad Pro 11 2018 7736 mAh | Huawei MediaPad M5 10.8 Pro 7500 mAh | Samsung Galaxy Tab S5e SM-T720 7040 mAh | |
|---|---|---|---|---|---|---|
| Akkumulátor üzemidő | -3% | -0% | 24% | -8% | 8% | |
| Reader / Idle (h) | 24.8 | 25 1% | 34.3 38% | 20.9 -16% | 21.1 -15% | |
| H.264 (h) | 13.4 | 11.4 -15% | 16.4 22% | 10.5 -22% | 14.4 7% | |
| WiFi v1.3 (h) | 11.8 | 11.9 1% | 12.3 4% | 15.3 30% | 11.2 -5% | 10.4 -12% |
| Load (h) | 3.3 | 3.1 -6% | 3.6 9% | 3.5 6% | 3.7 12% | 5 52% |
Pro
Kontra
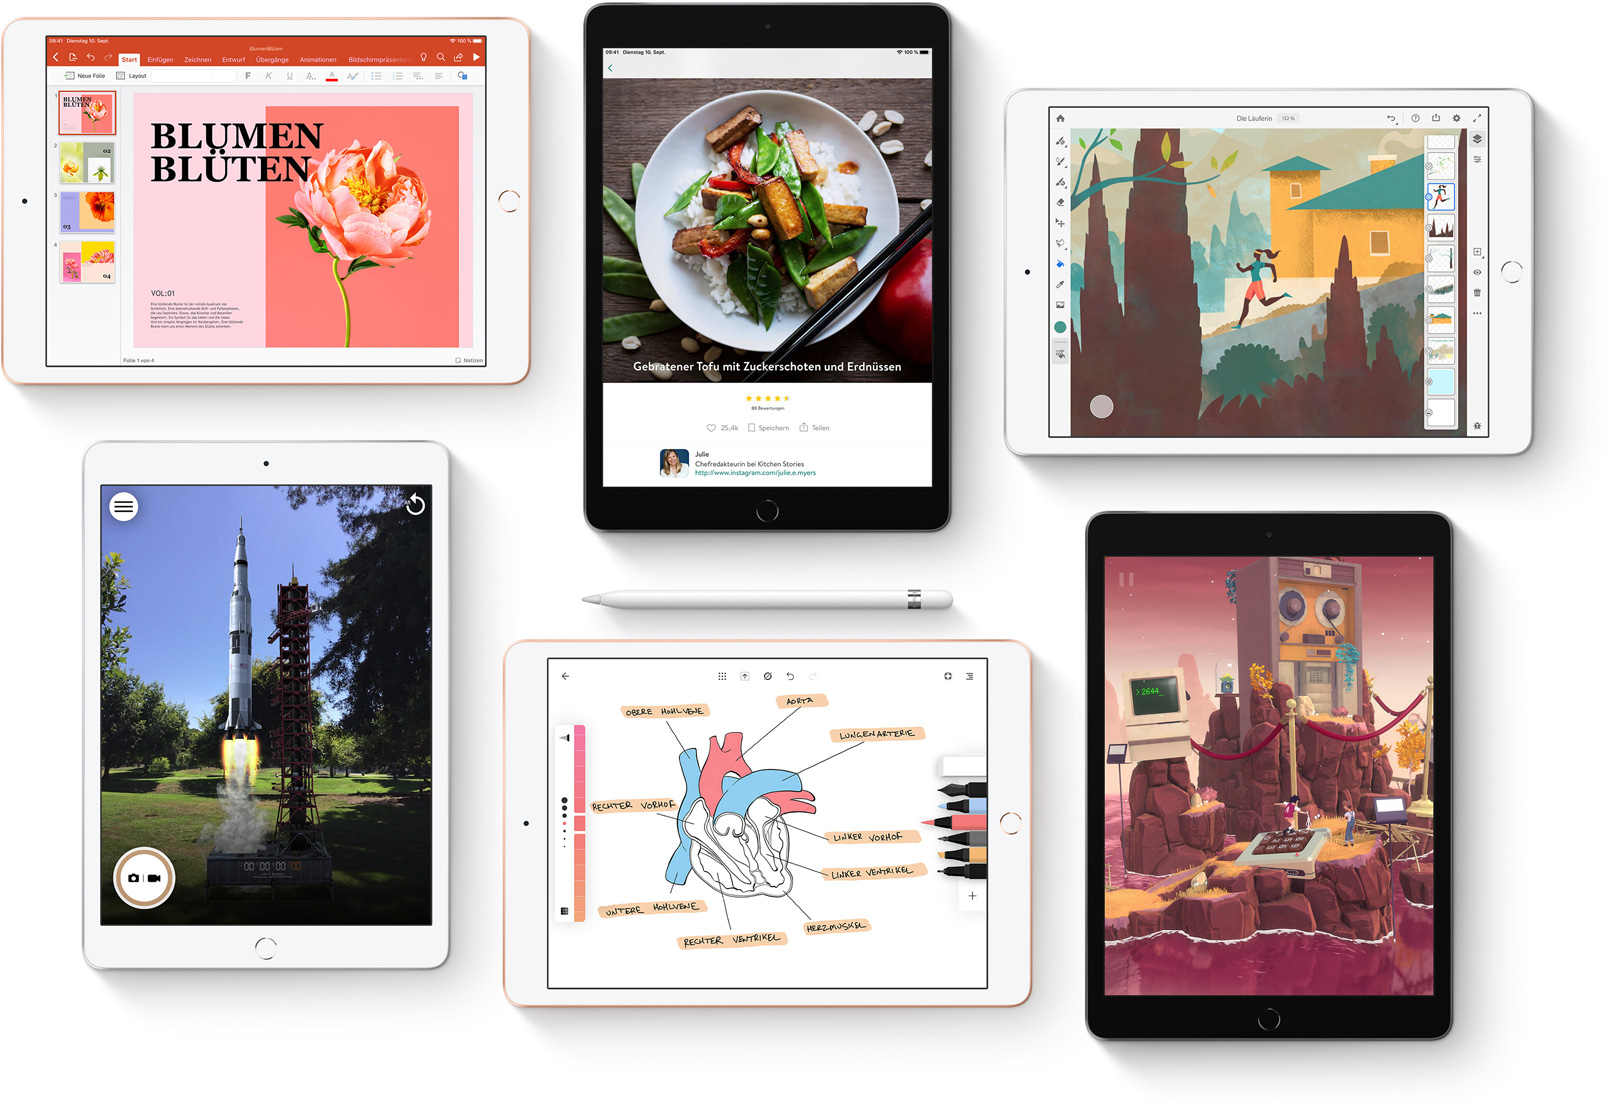
Verdict - A gentle facelift for Apple's budget iPad
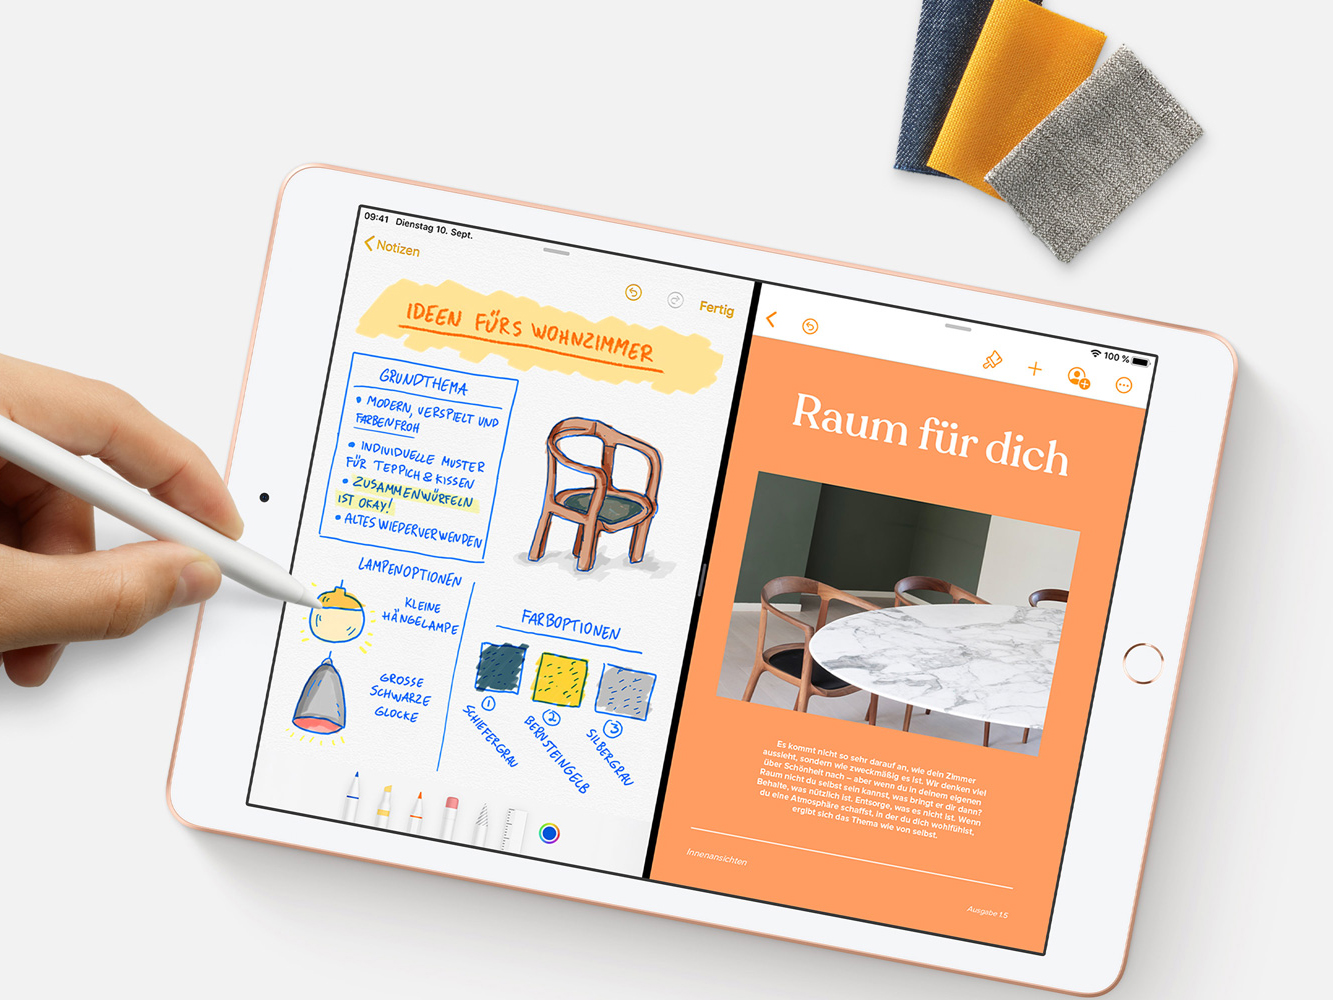
Jó-e használni az iPad 2019-et? Véleményünk szerint igen, de ez nagyrészt az új iPadOS miatt van, mintsem bármilyen jelentősebb hardver változásoknak köszönhetően, amelyeket az Apple ebben az évben végrehajtott.
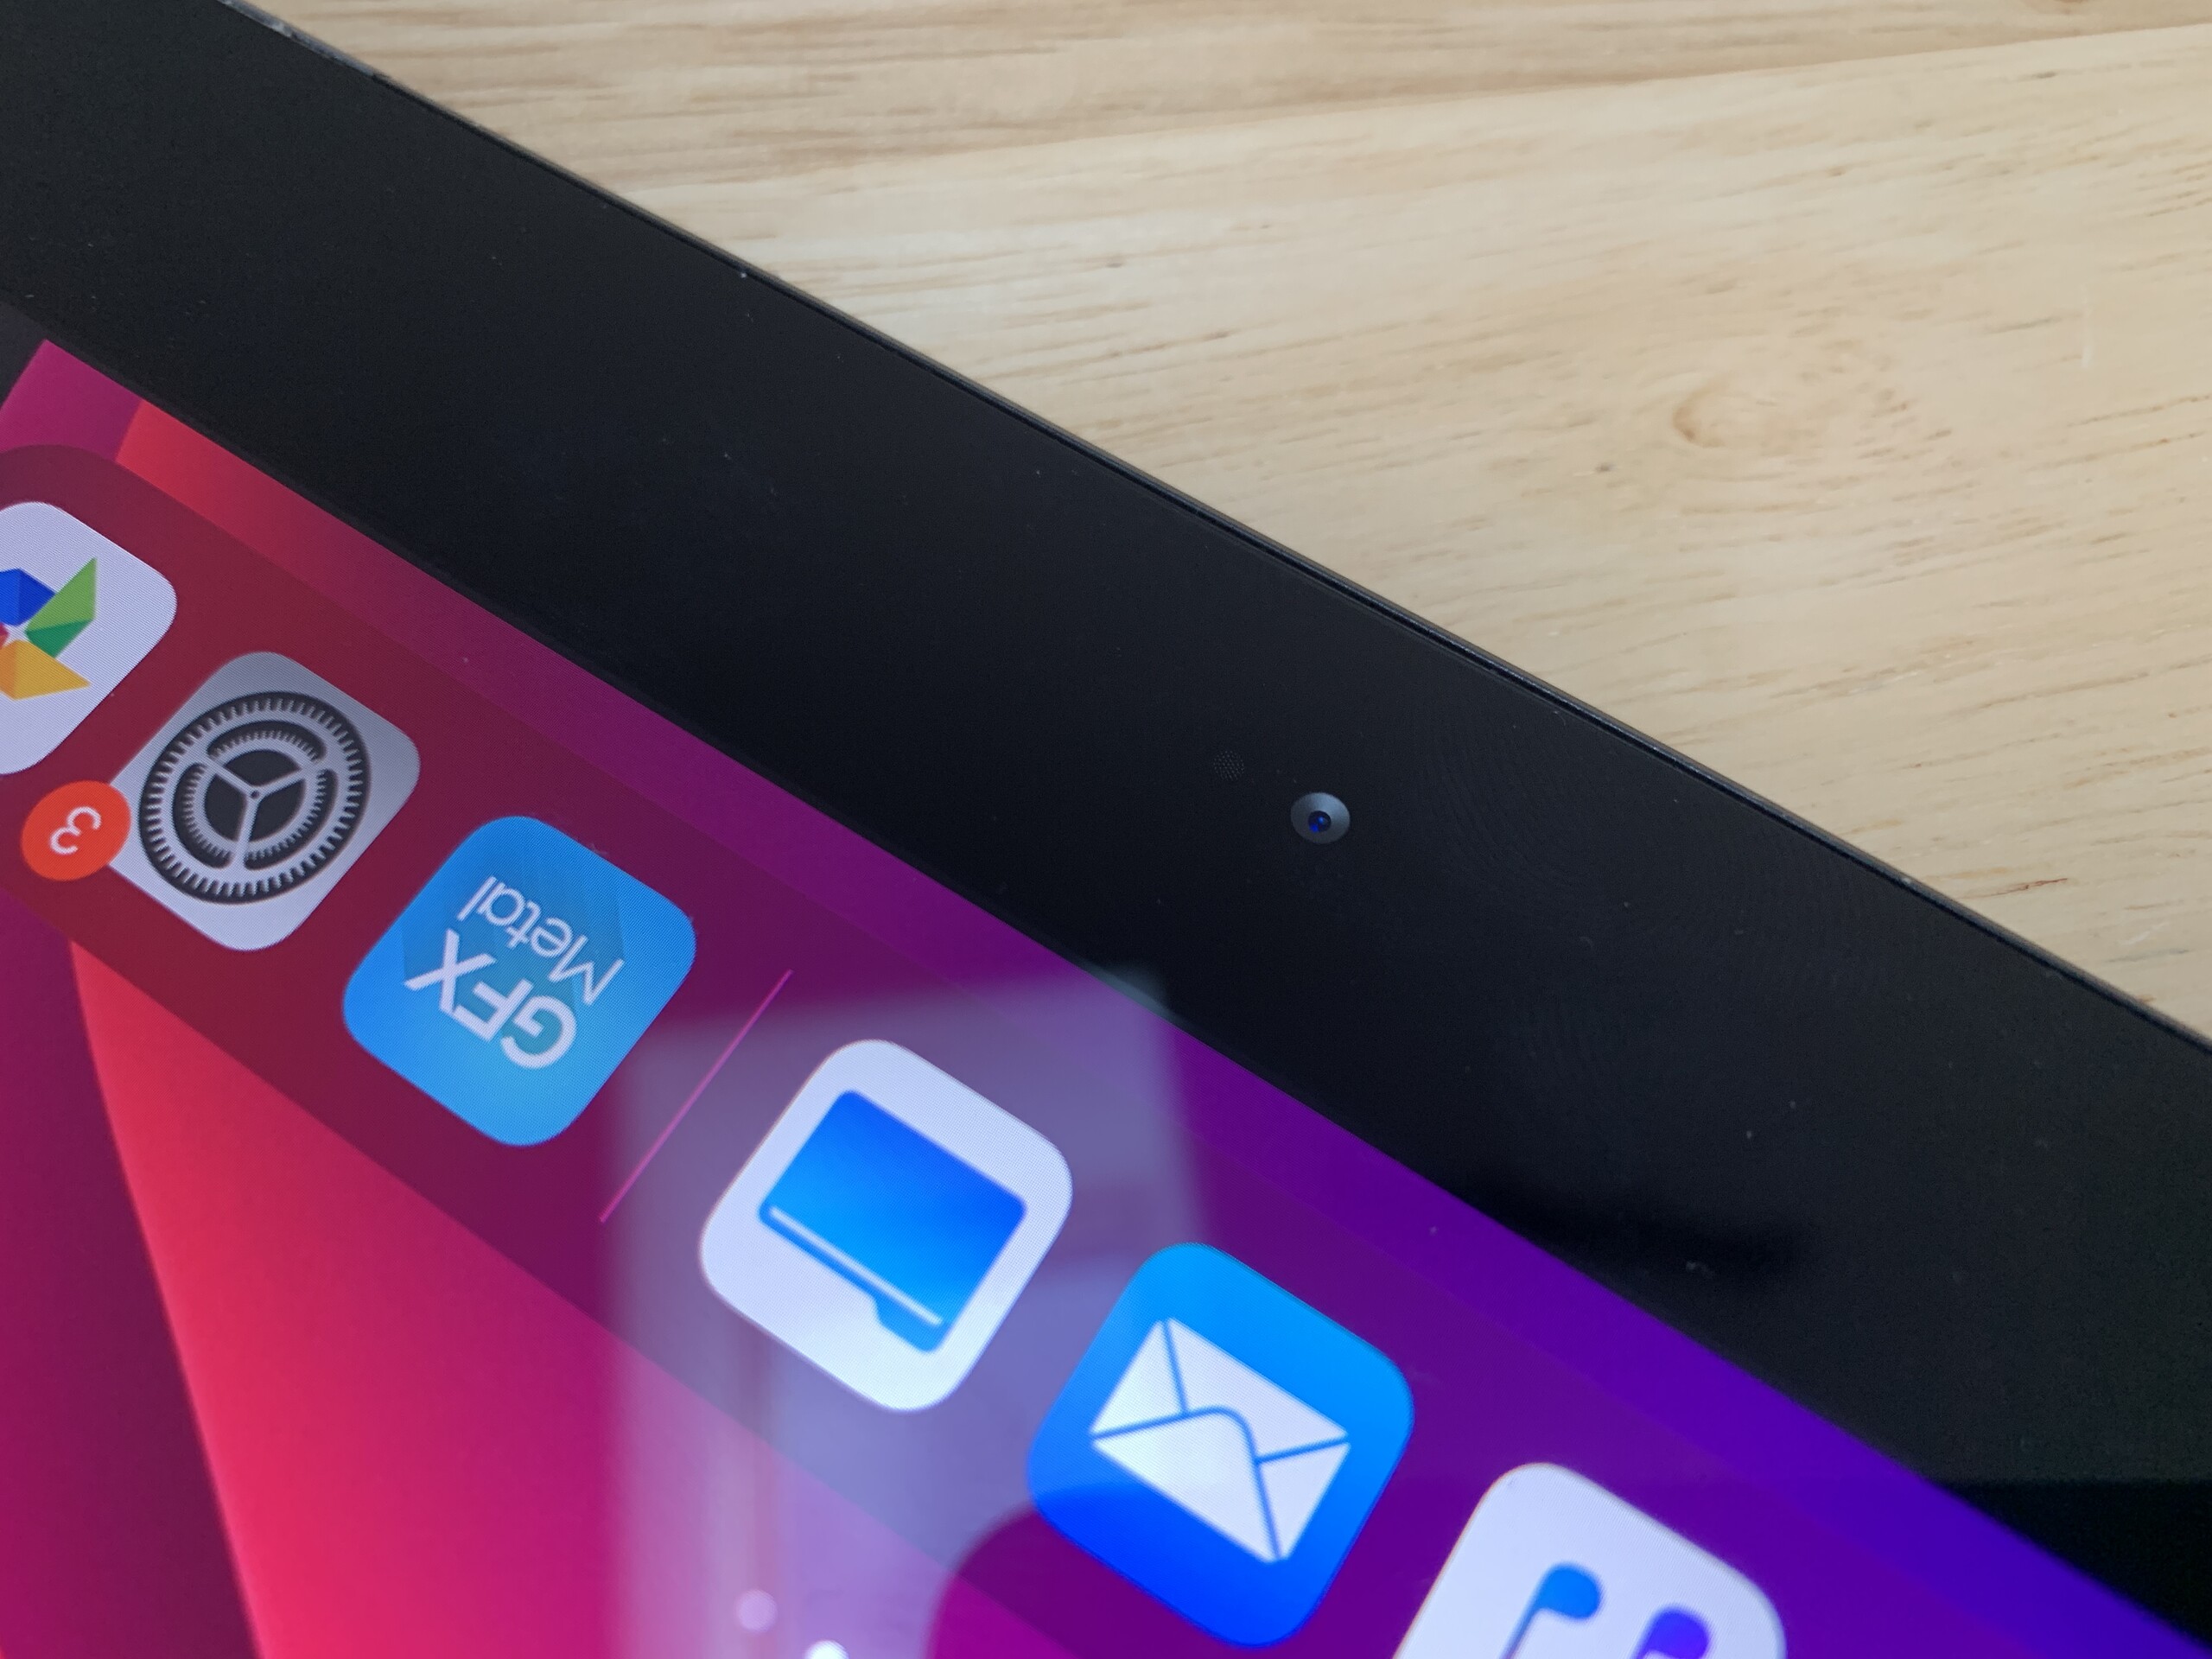
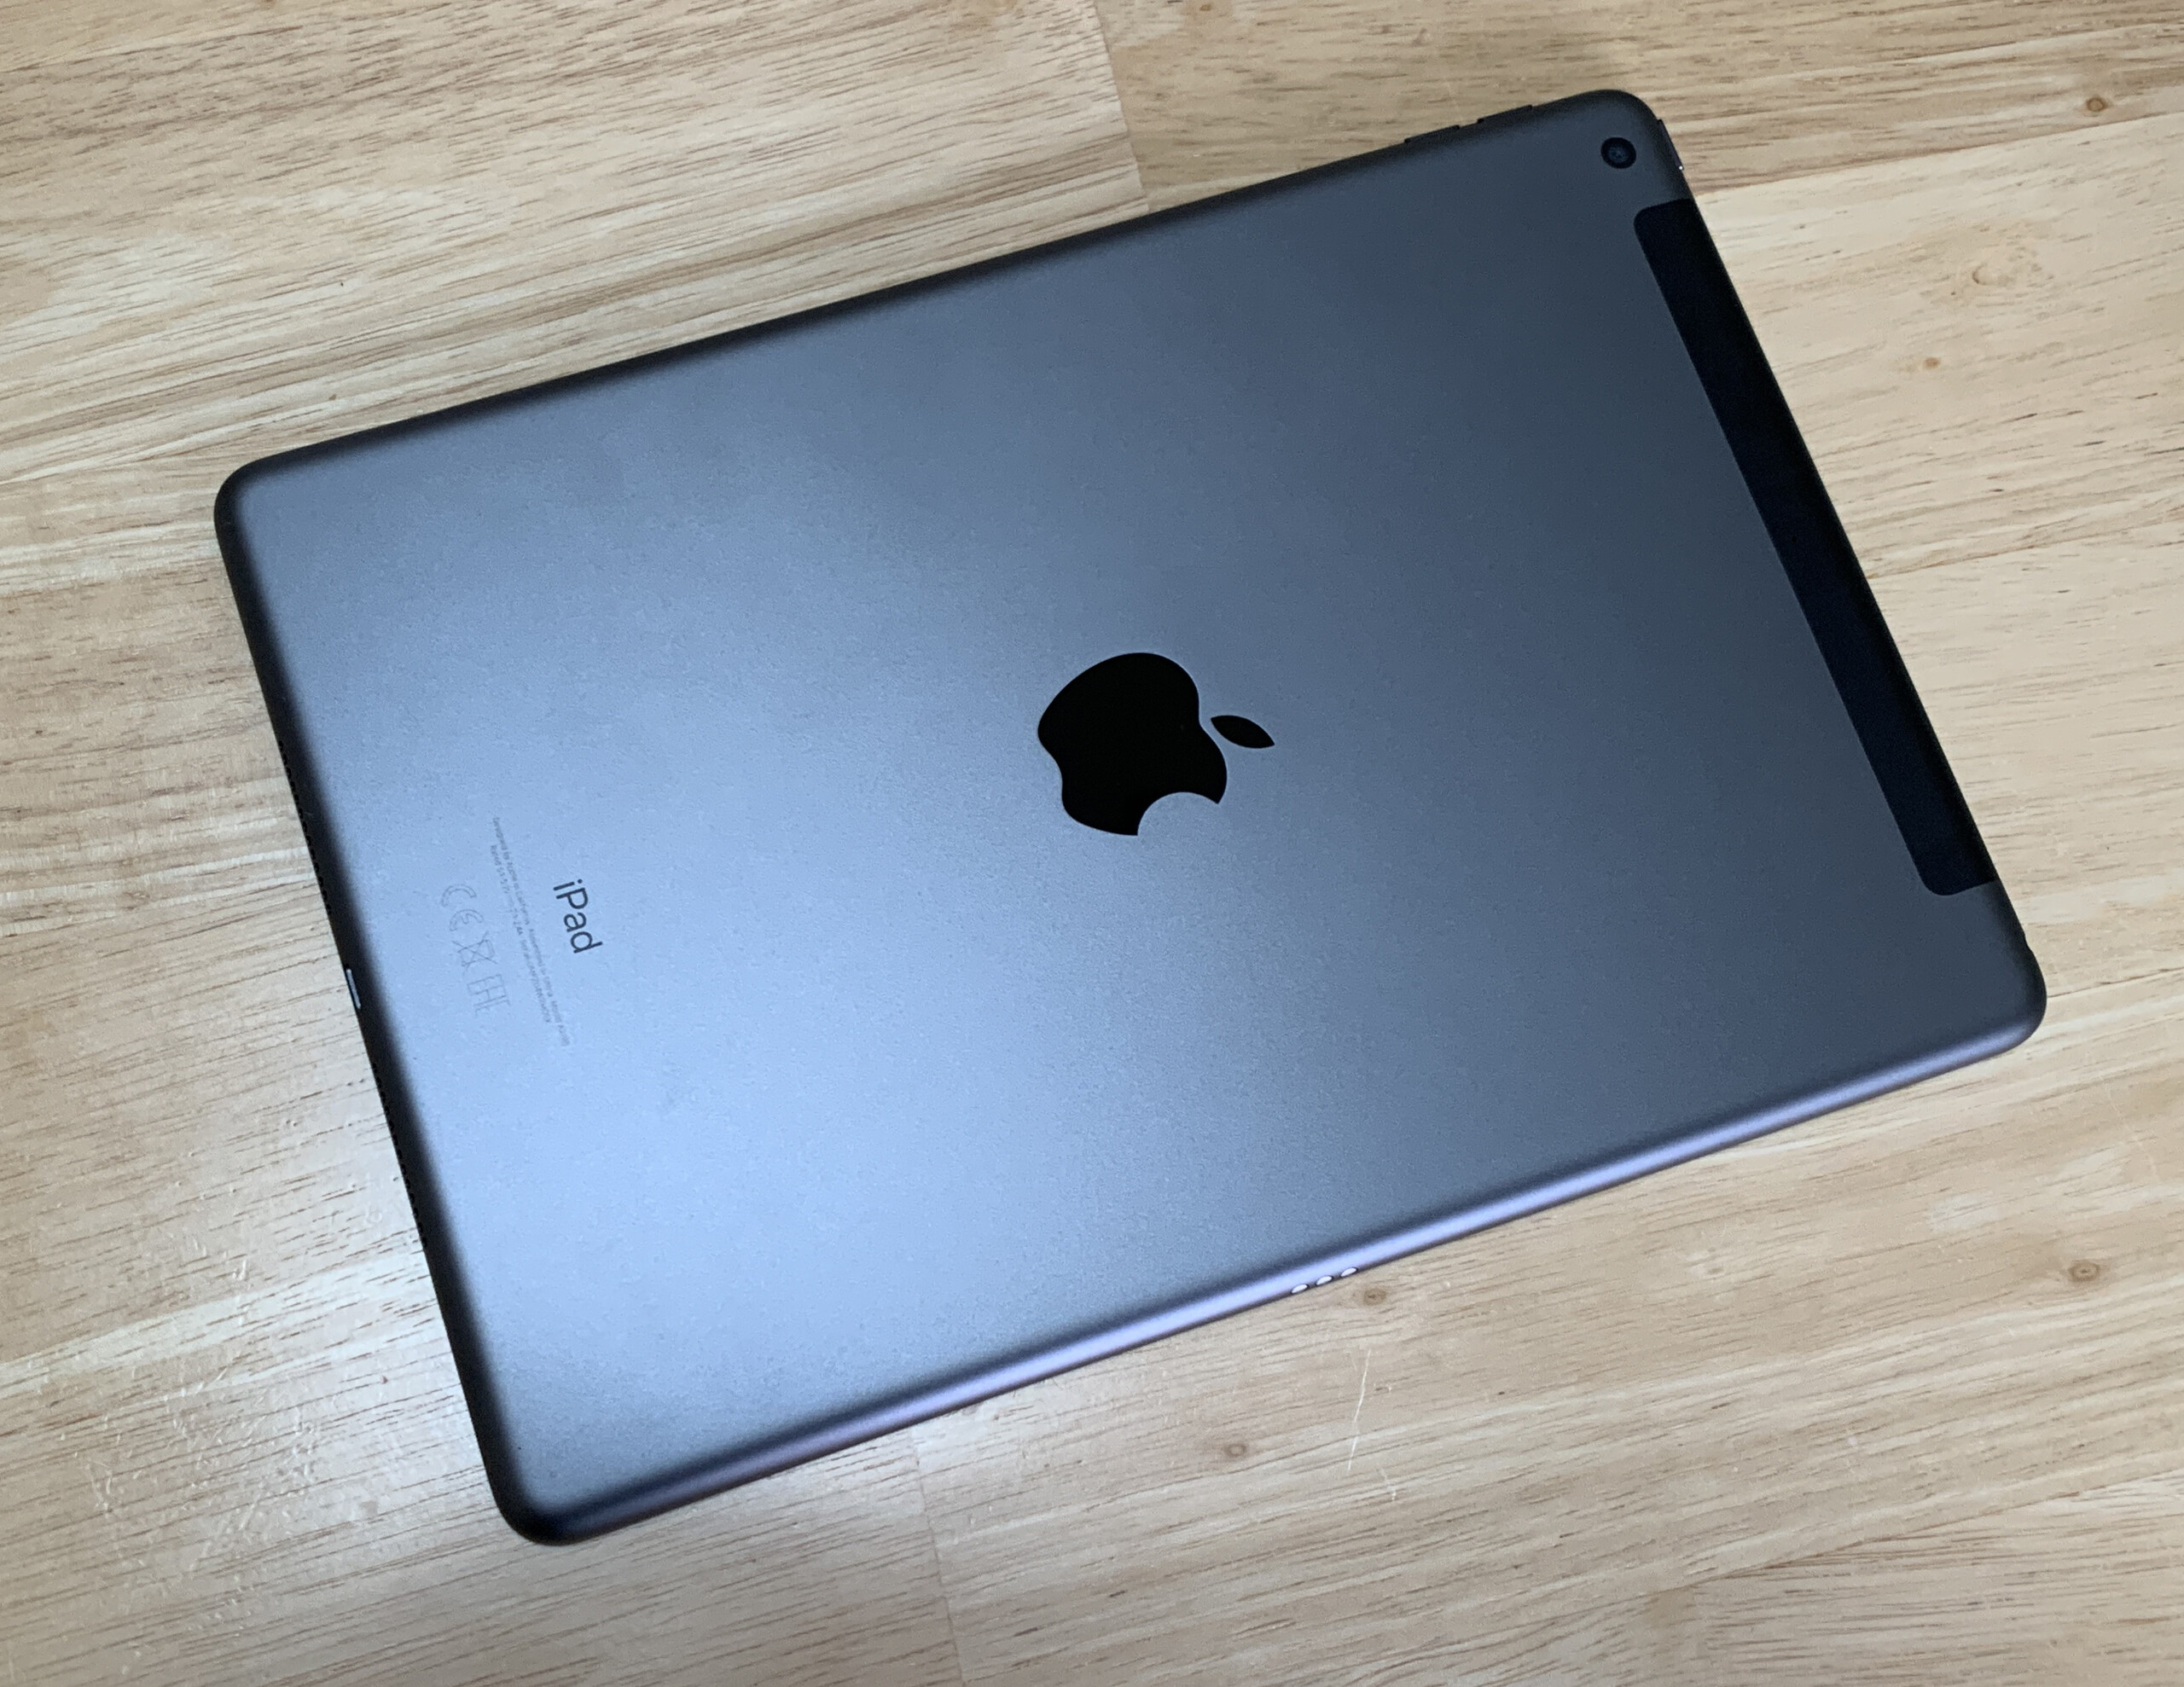
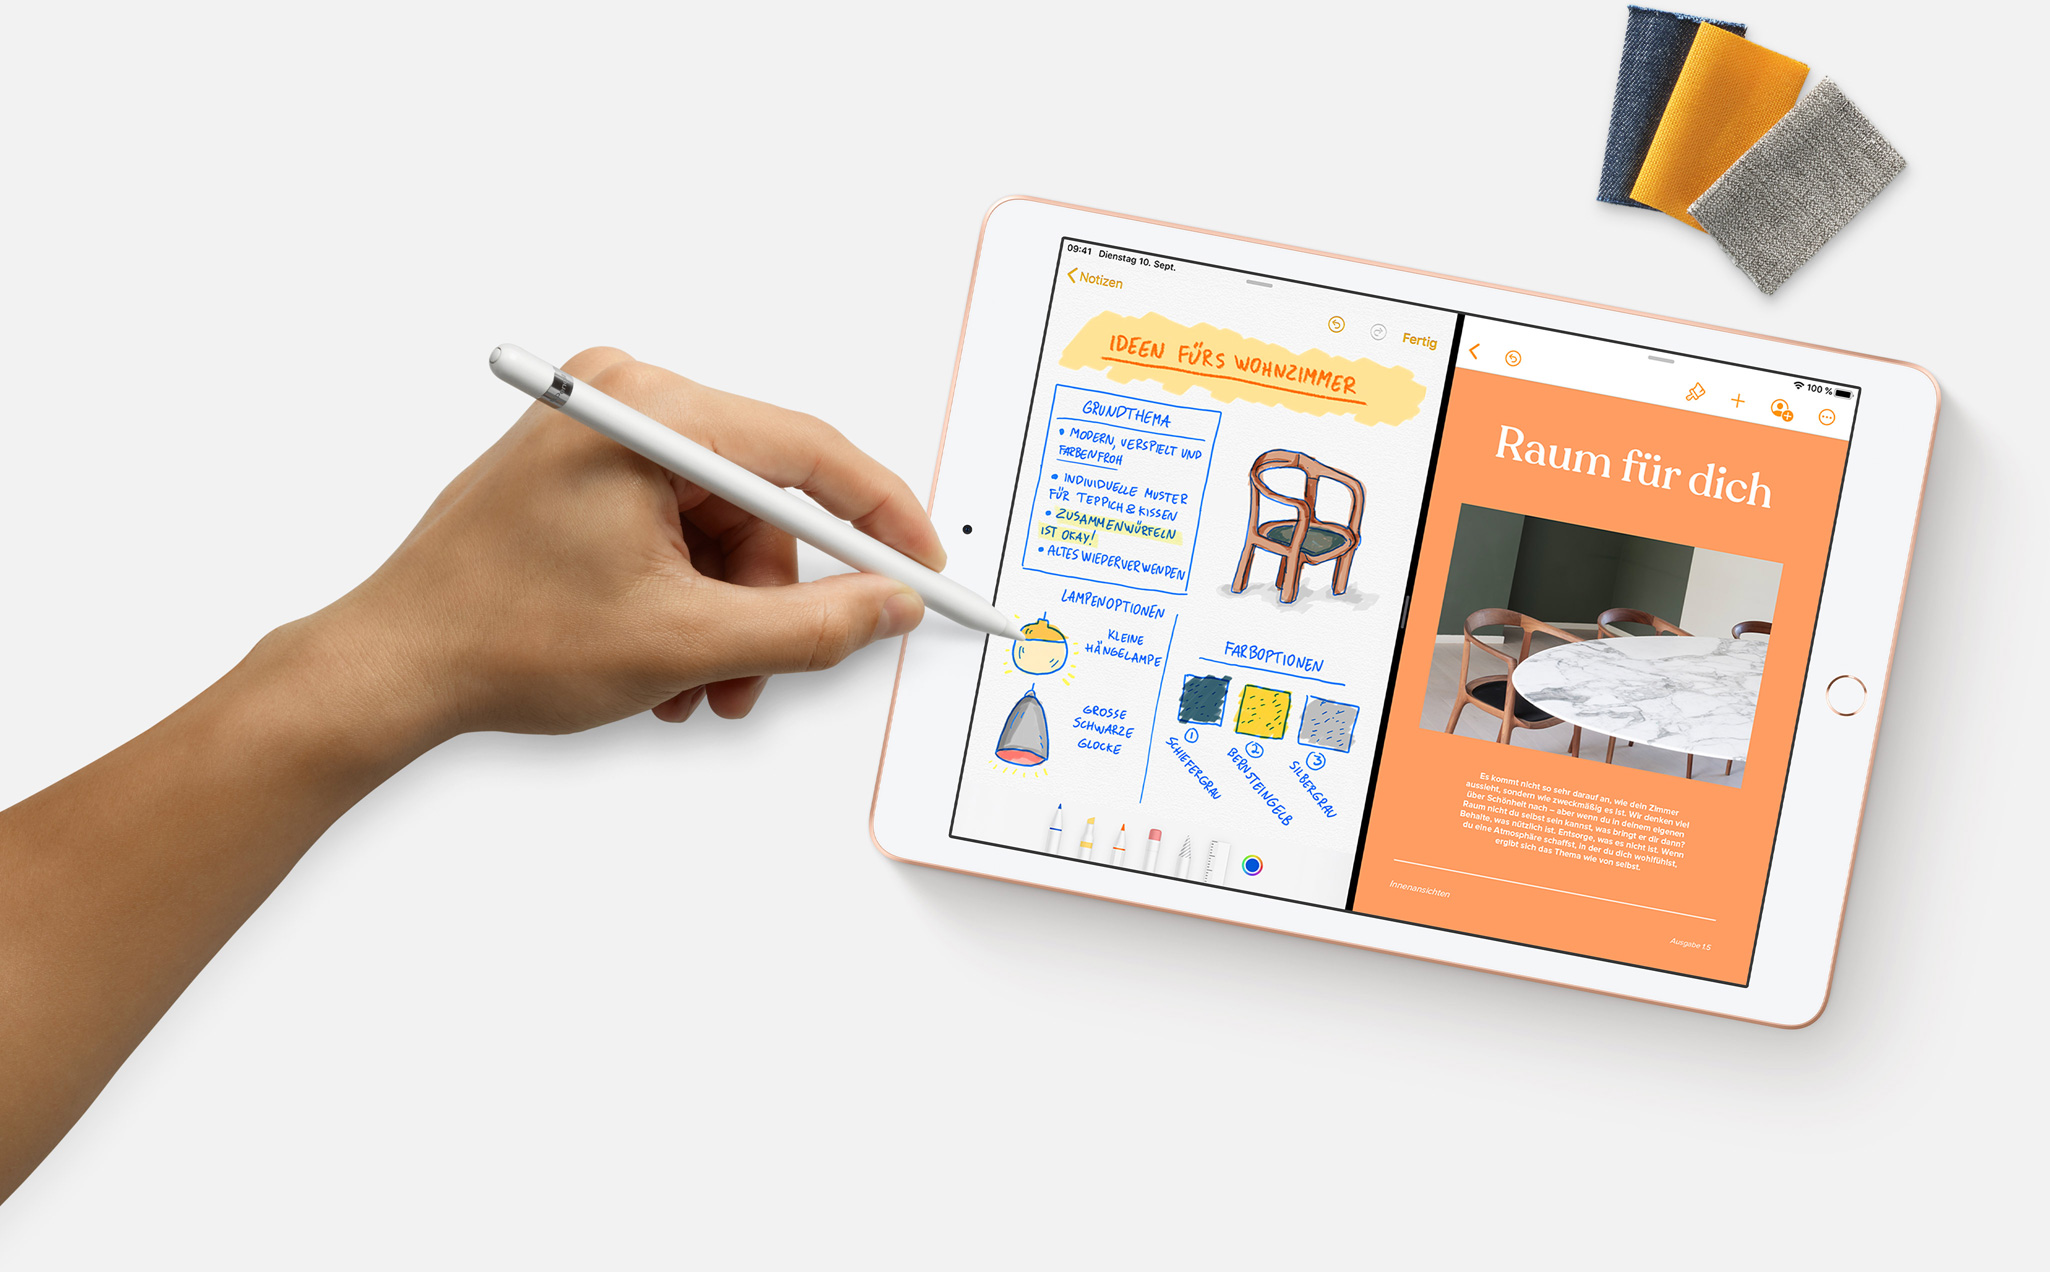
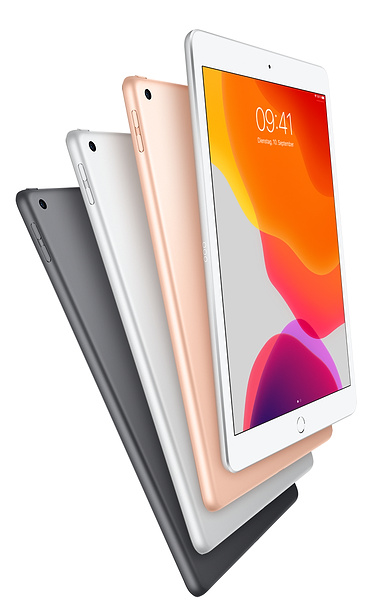
Röviden, az új iPad az iPad 6-nak egy valamivel nagyobb változata, amely Apple Pencil és Smart Keyboard trámogatással rendelkezik. A nagyobb méretű, illetve nagyobb felbontású panel szerintünk mindenképp jobb, és kedvező változásnak számít a klasszikus iPad-ek 9.7 hüvelykes kijelzőjéhez képest. Viszont a piacon már évek óta léteznek harmadik fél által gyártott iPad billentyűzetek, így a Smart Keyboard támogatás nem feltétlenül ok arra, hogy iPad 6-ról iPad 7-re váltsunk. A Smart Keyboard, bár jó minőségű, de rendkívül drága egy levehető billentyűzethez képest.
Kevés újdonság 2019-ben: az Apple kedvező árú iPad-je egy jó táblagép marad, de az iPad 7 frissítés nem éri meg azoknak, akik már rendelkeznek az iPad 6-tal.
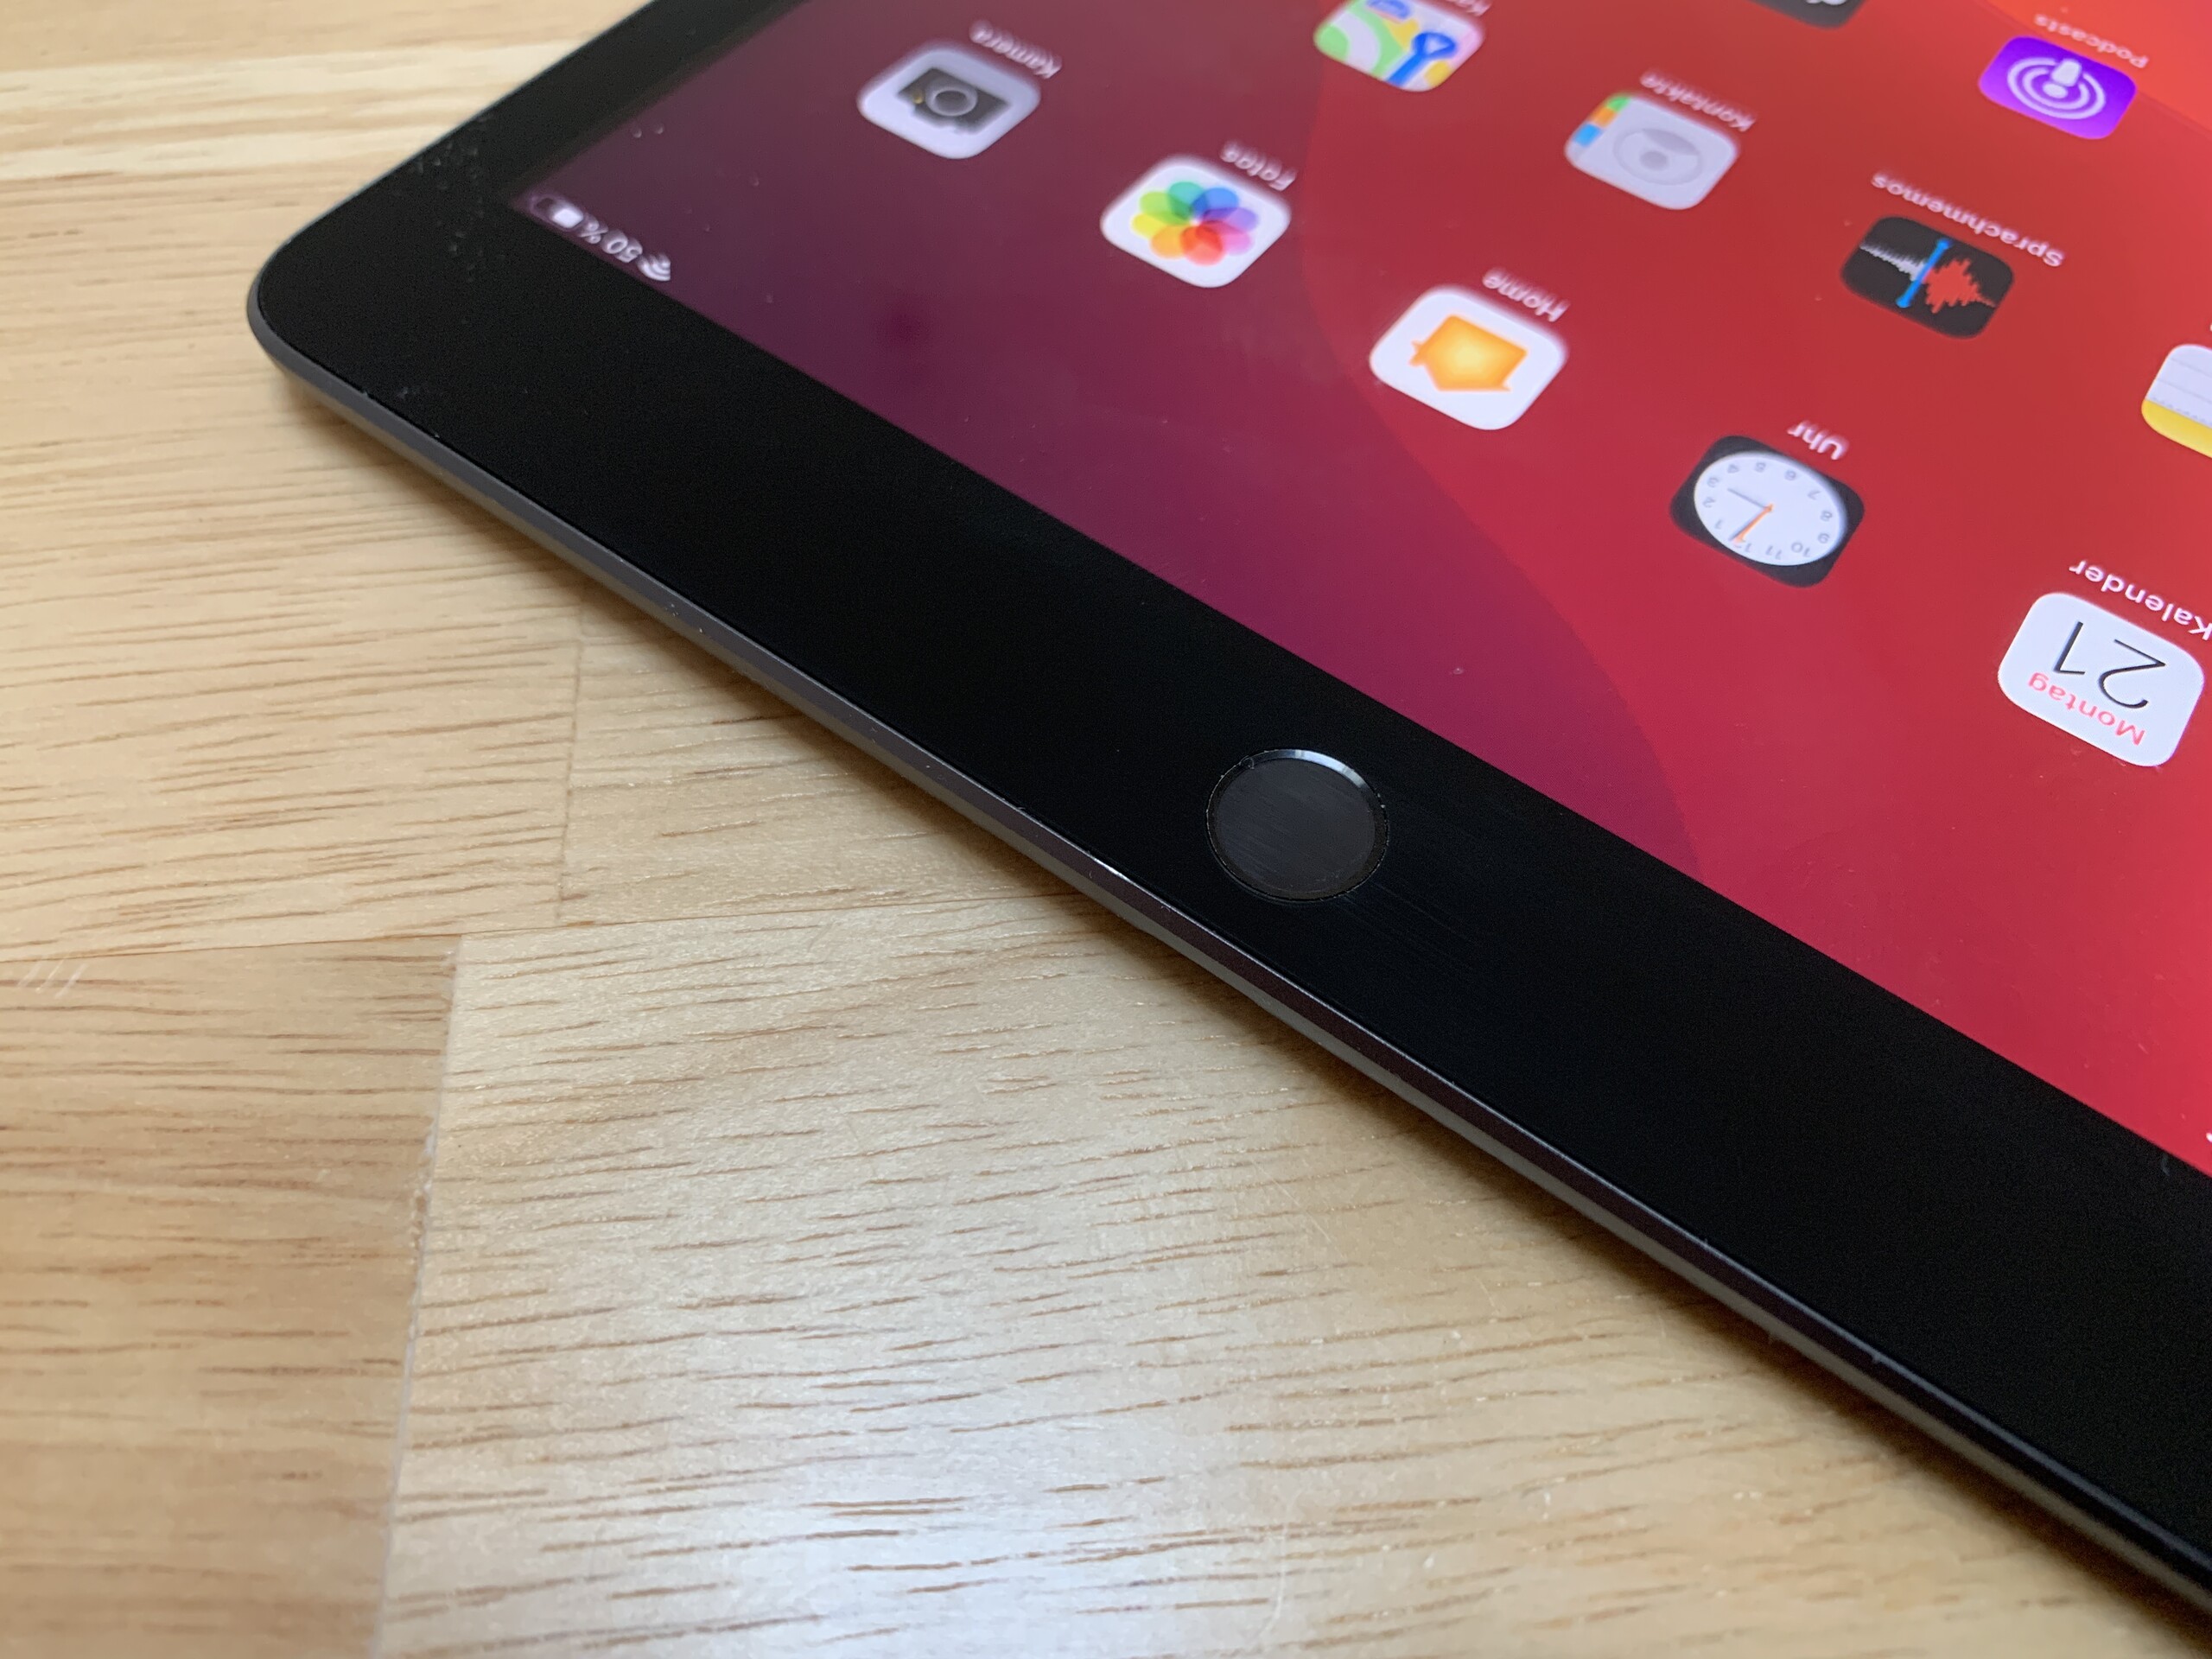
Az iPad 7 és az elődje gyakorlatilag megegyező üzemidővel, teljesítménnyel és hangszórókkal rendelkezik. Ugyanazon a vázon is osztoznak, így az iPad 7 csupán egy kisfokú frissítése az iPad 6-nak. Az előbbi ráadásul drága is, 329 dollárnál kezdődve. Érdemes észben tartani, hogy 329 dollárért csak egy 32 GB-os Wi-Fi SKU-t kapunk, míg a 128 GB-os Wi-Fi modellért az Apple 429 dollárt kér. Ezenfelül plusz 170 dollárba fog kerülni az LTE kapcsolat, aminek köszönhetően a legdrágább modell és a 256 GB-os Wi-Fi iPad Air közötti árkülönbség kevesebb mint 50 dollár lesz.
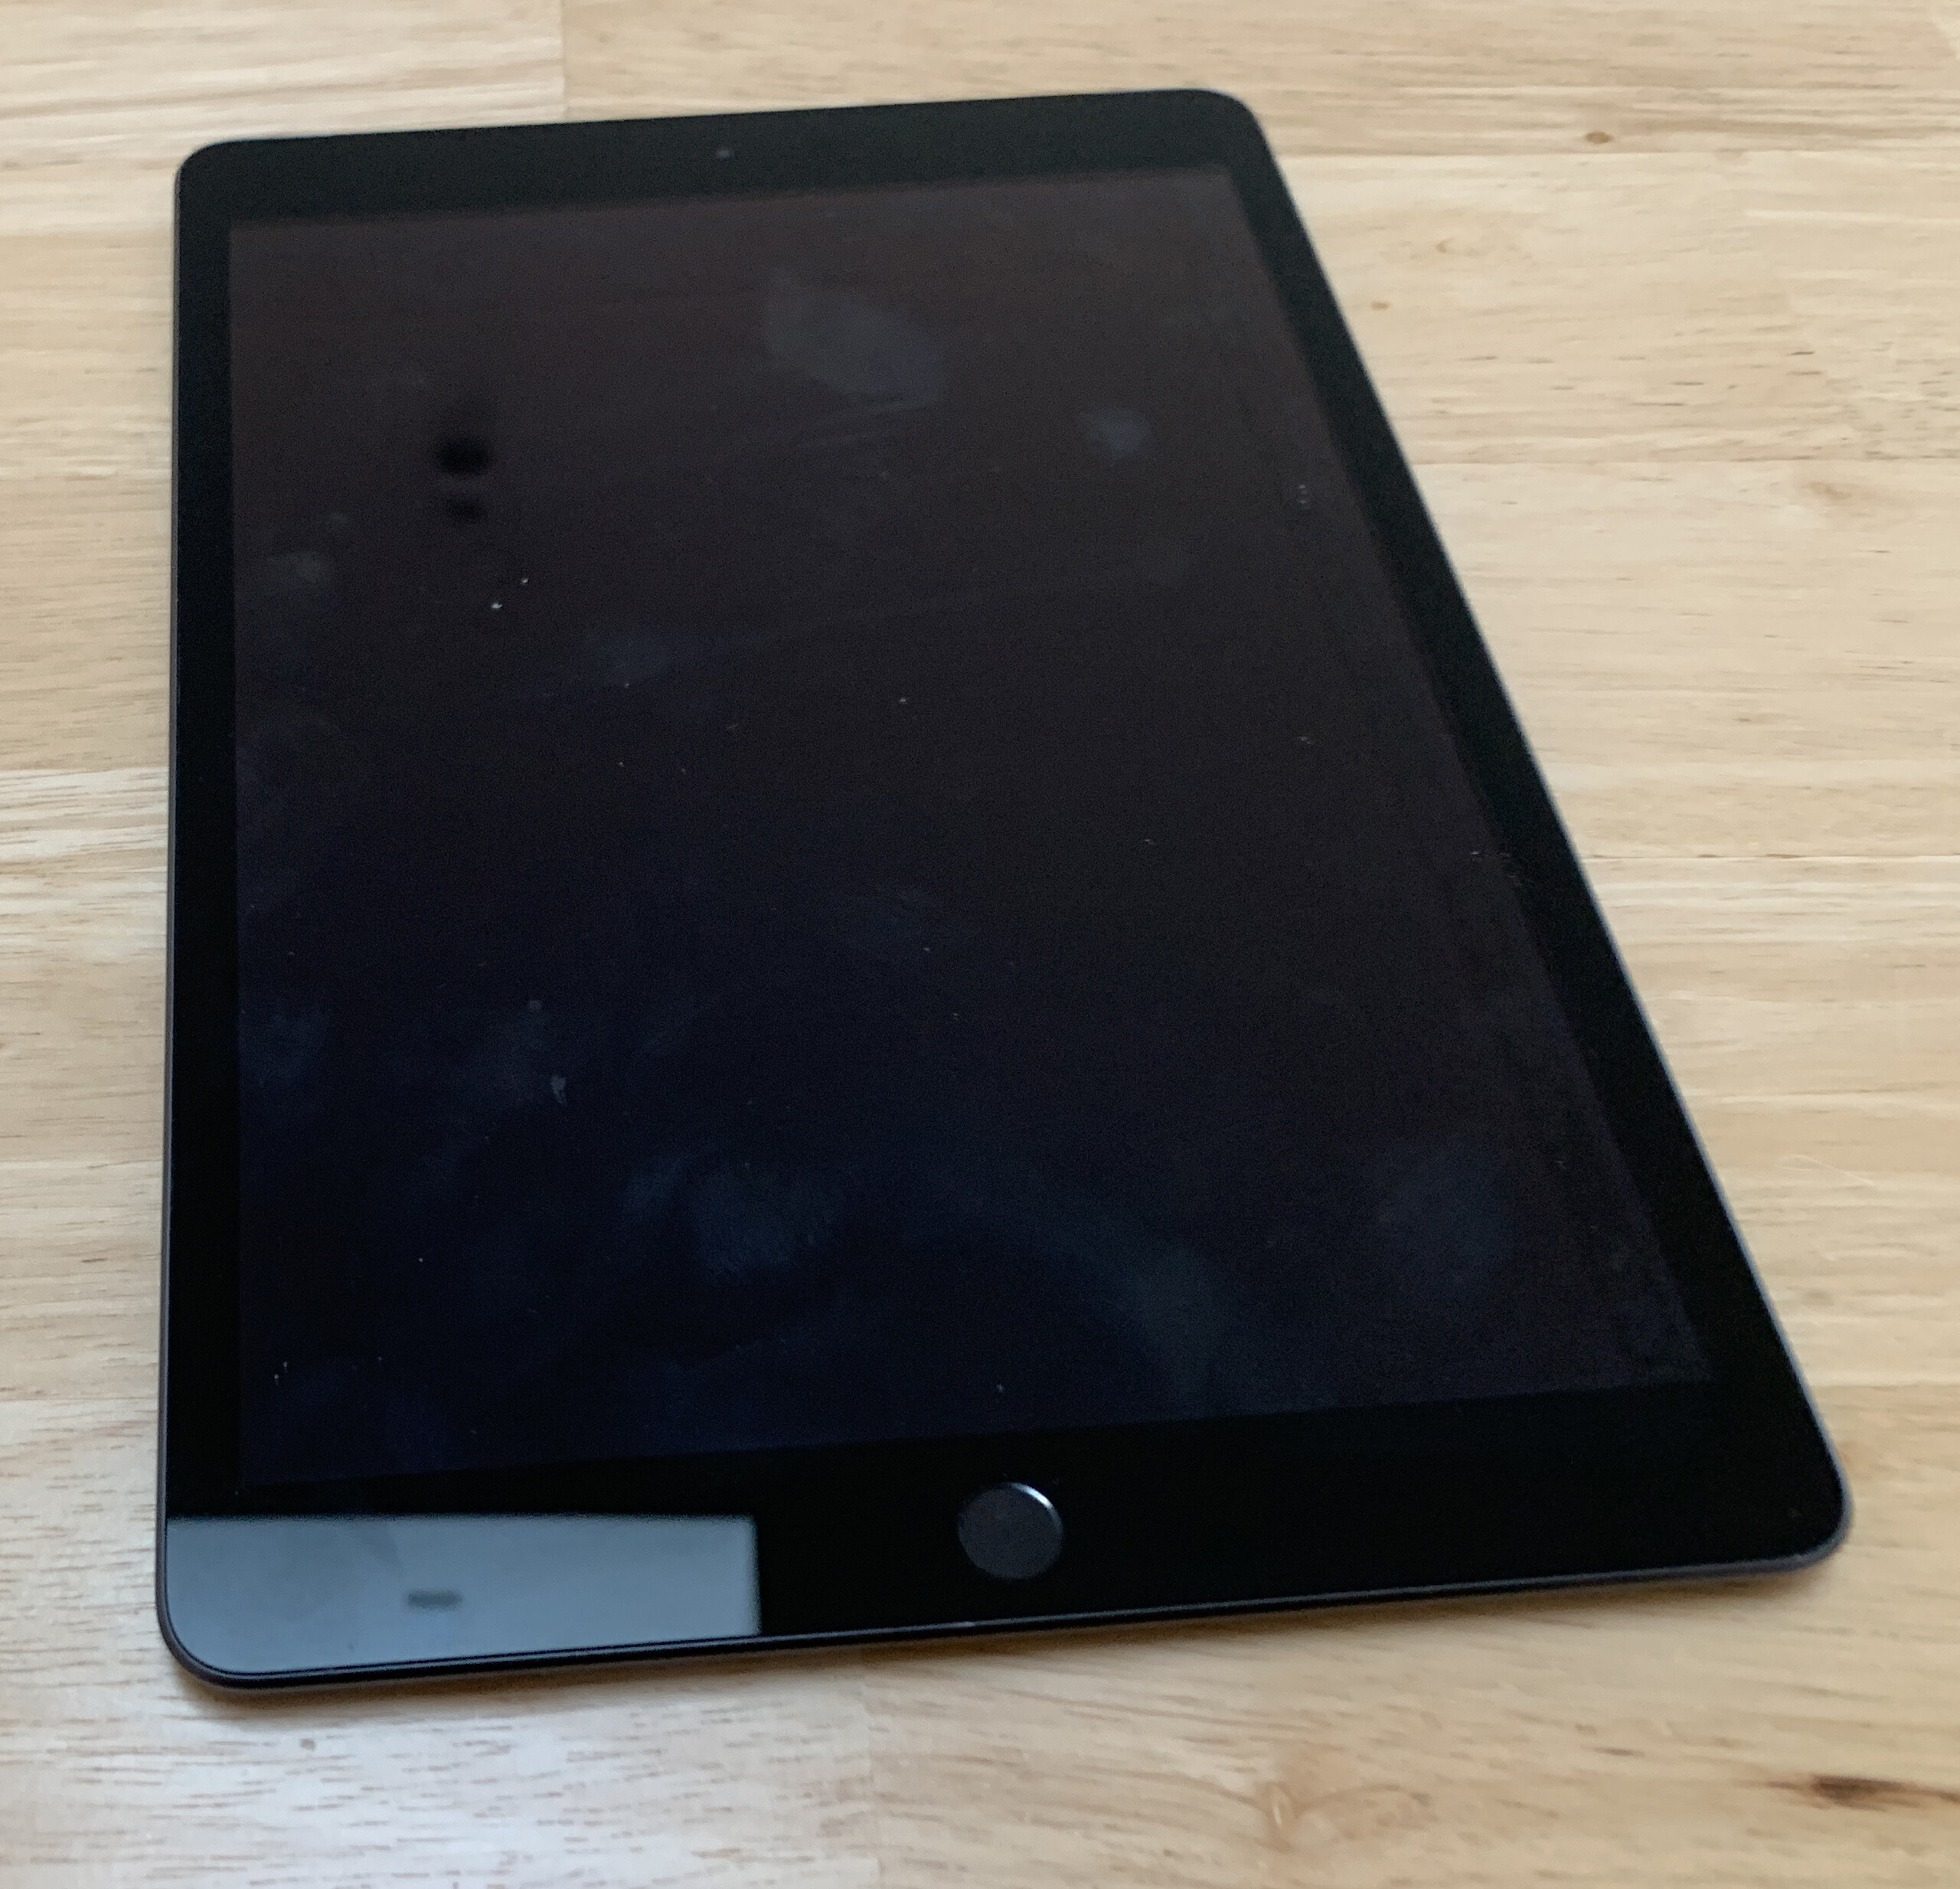
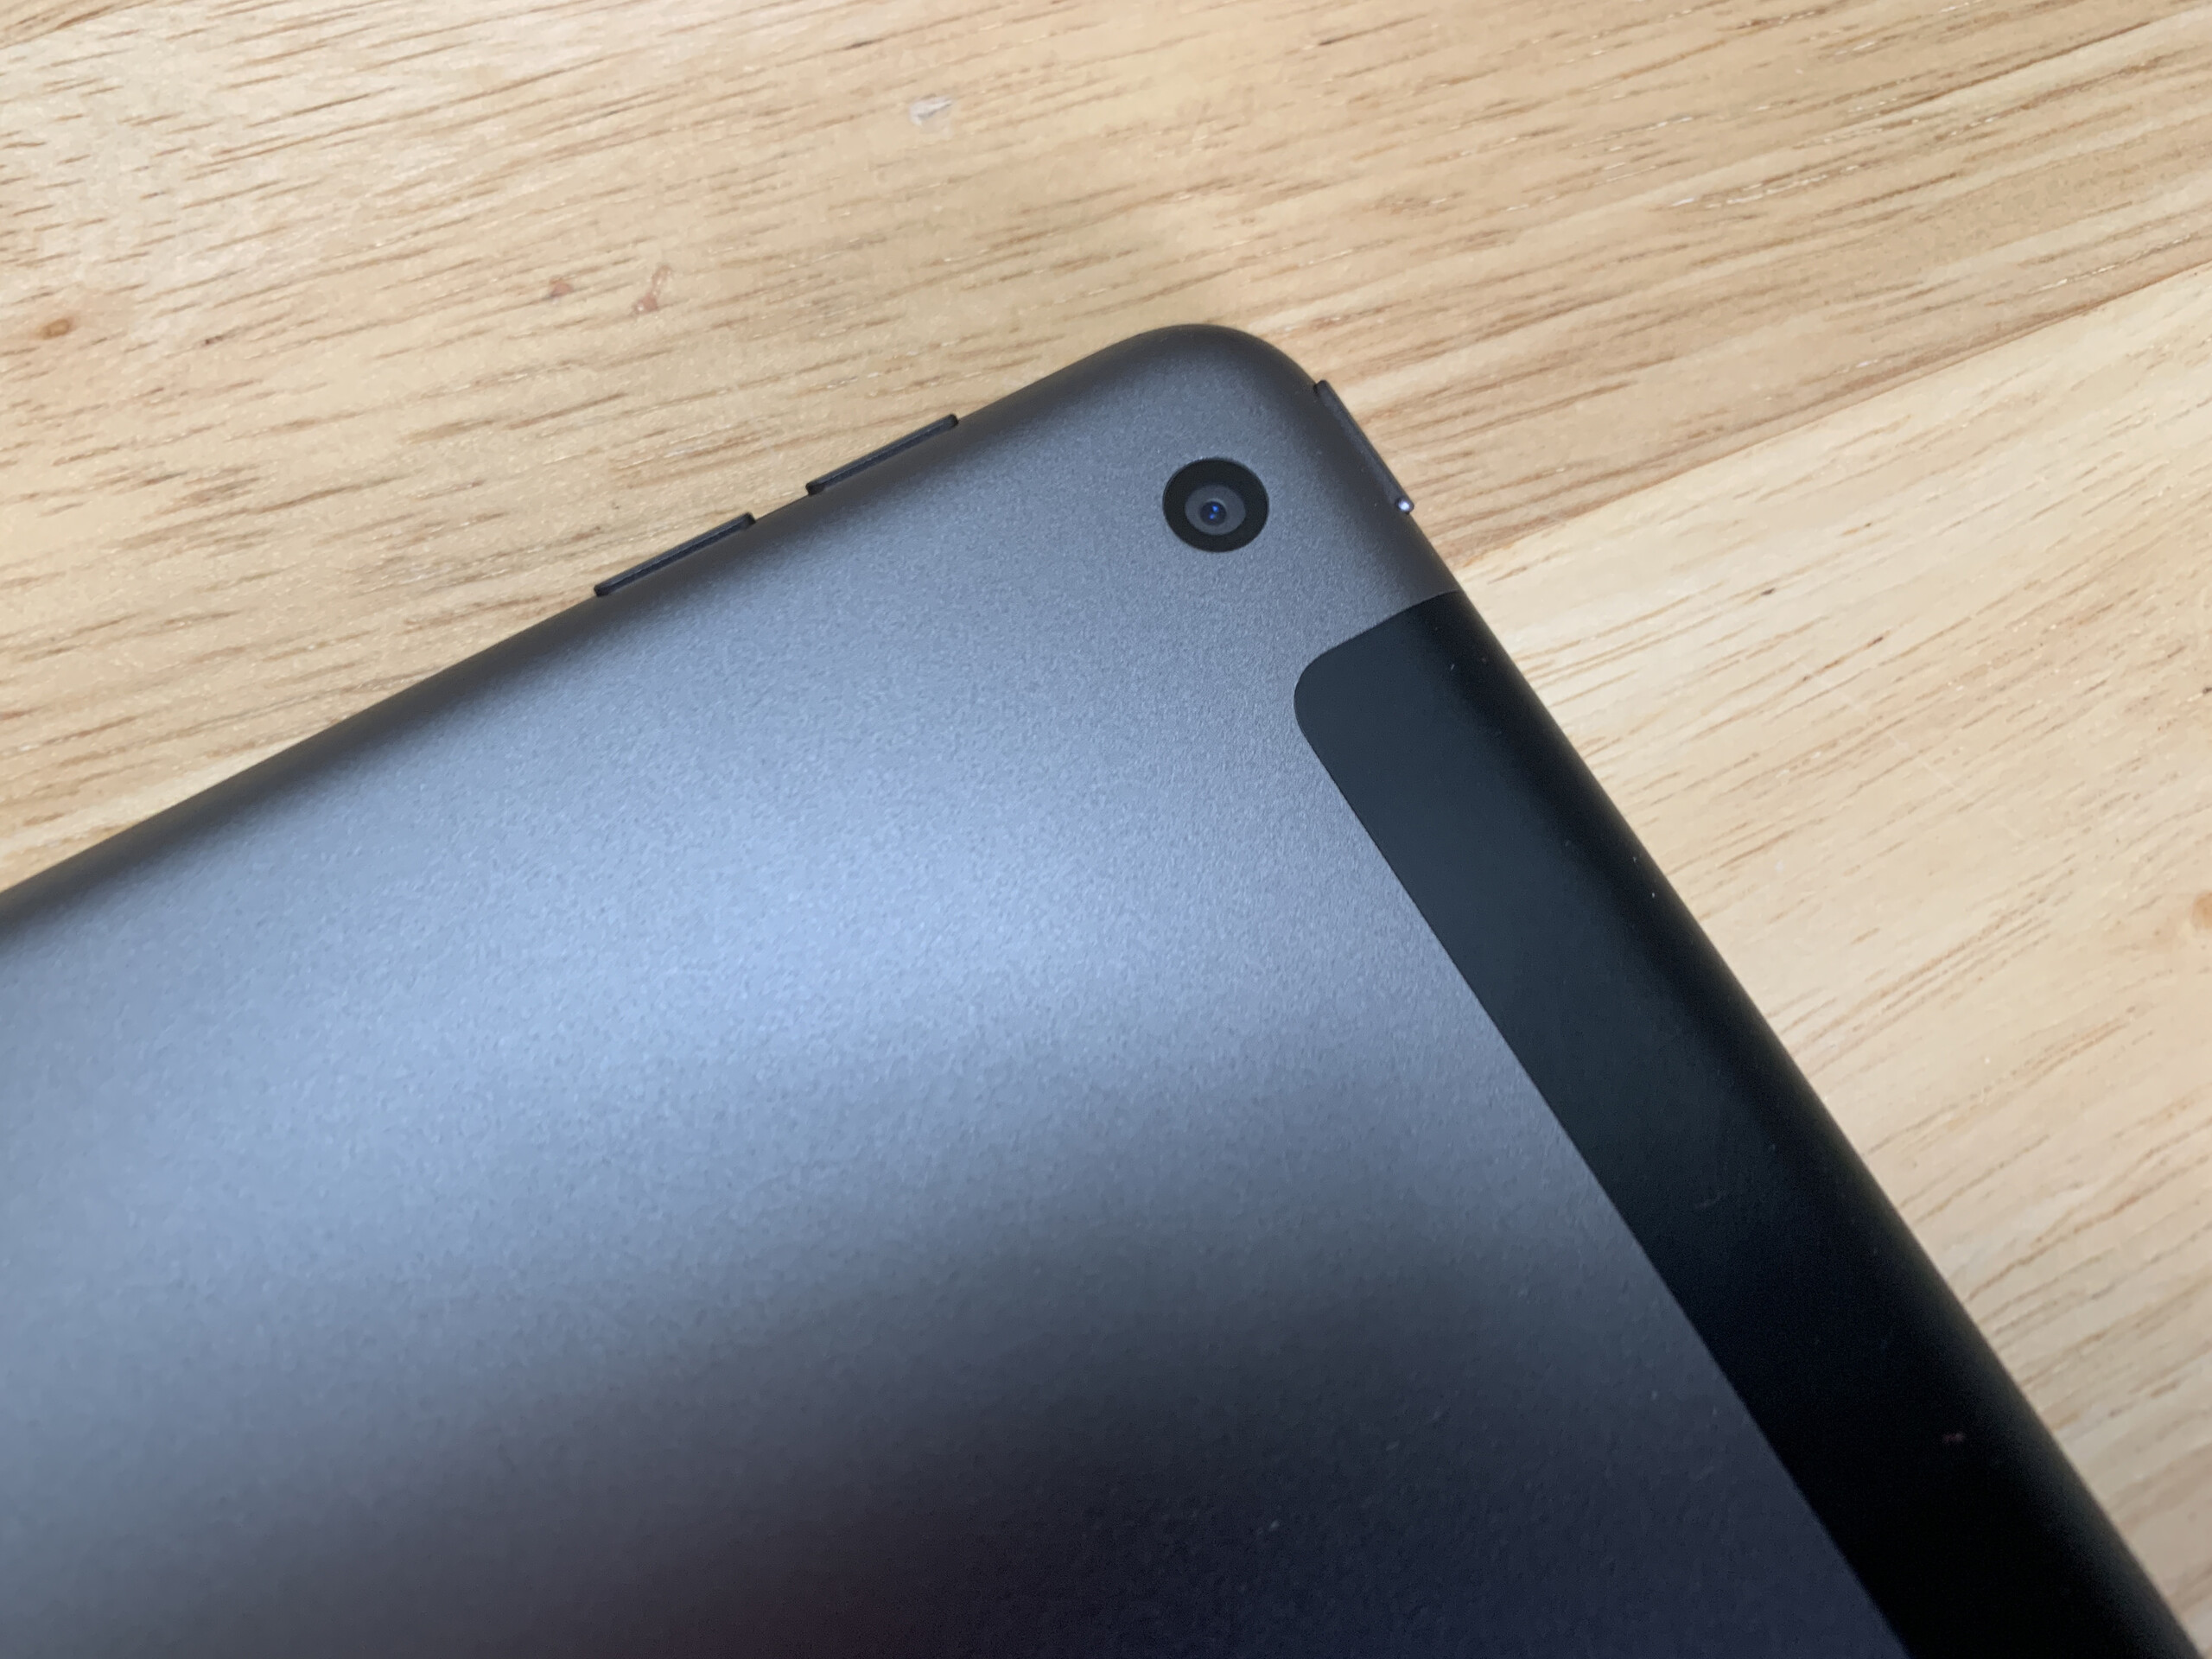
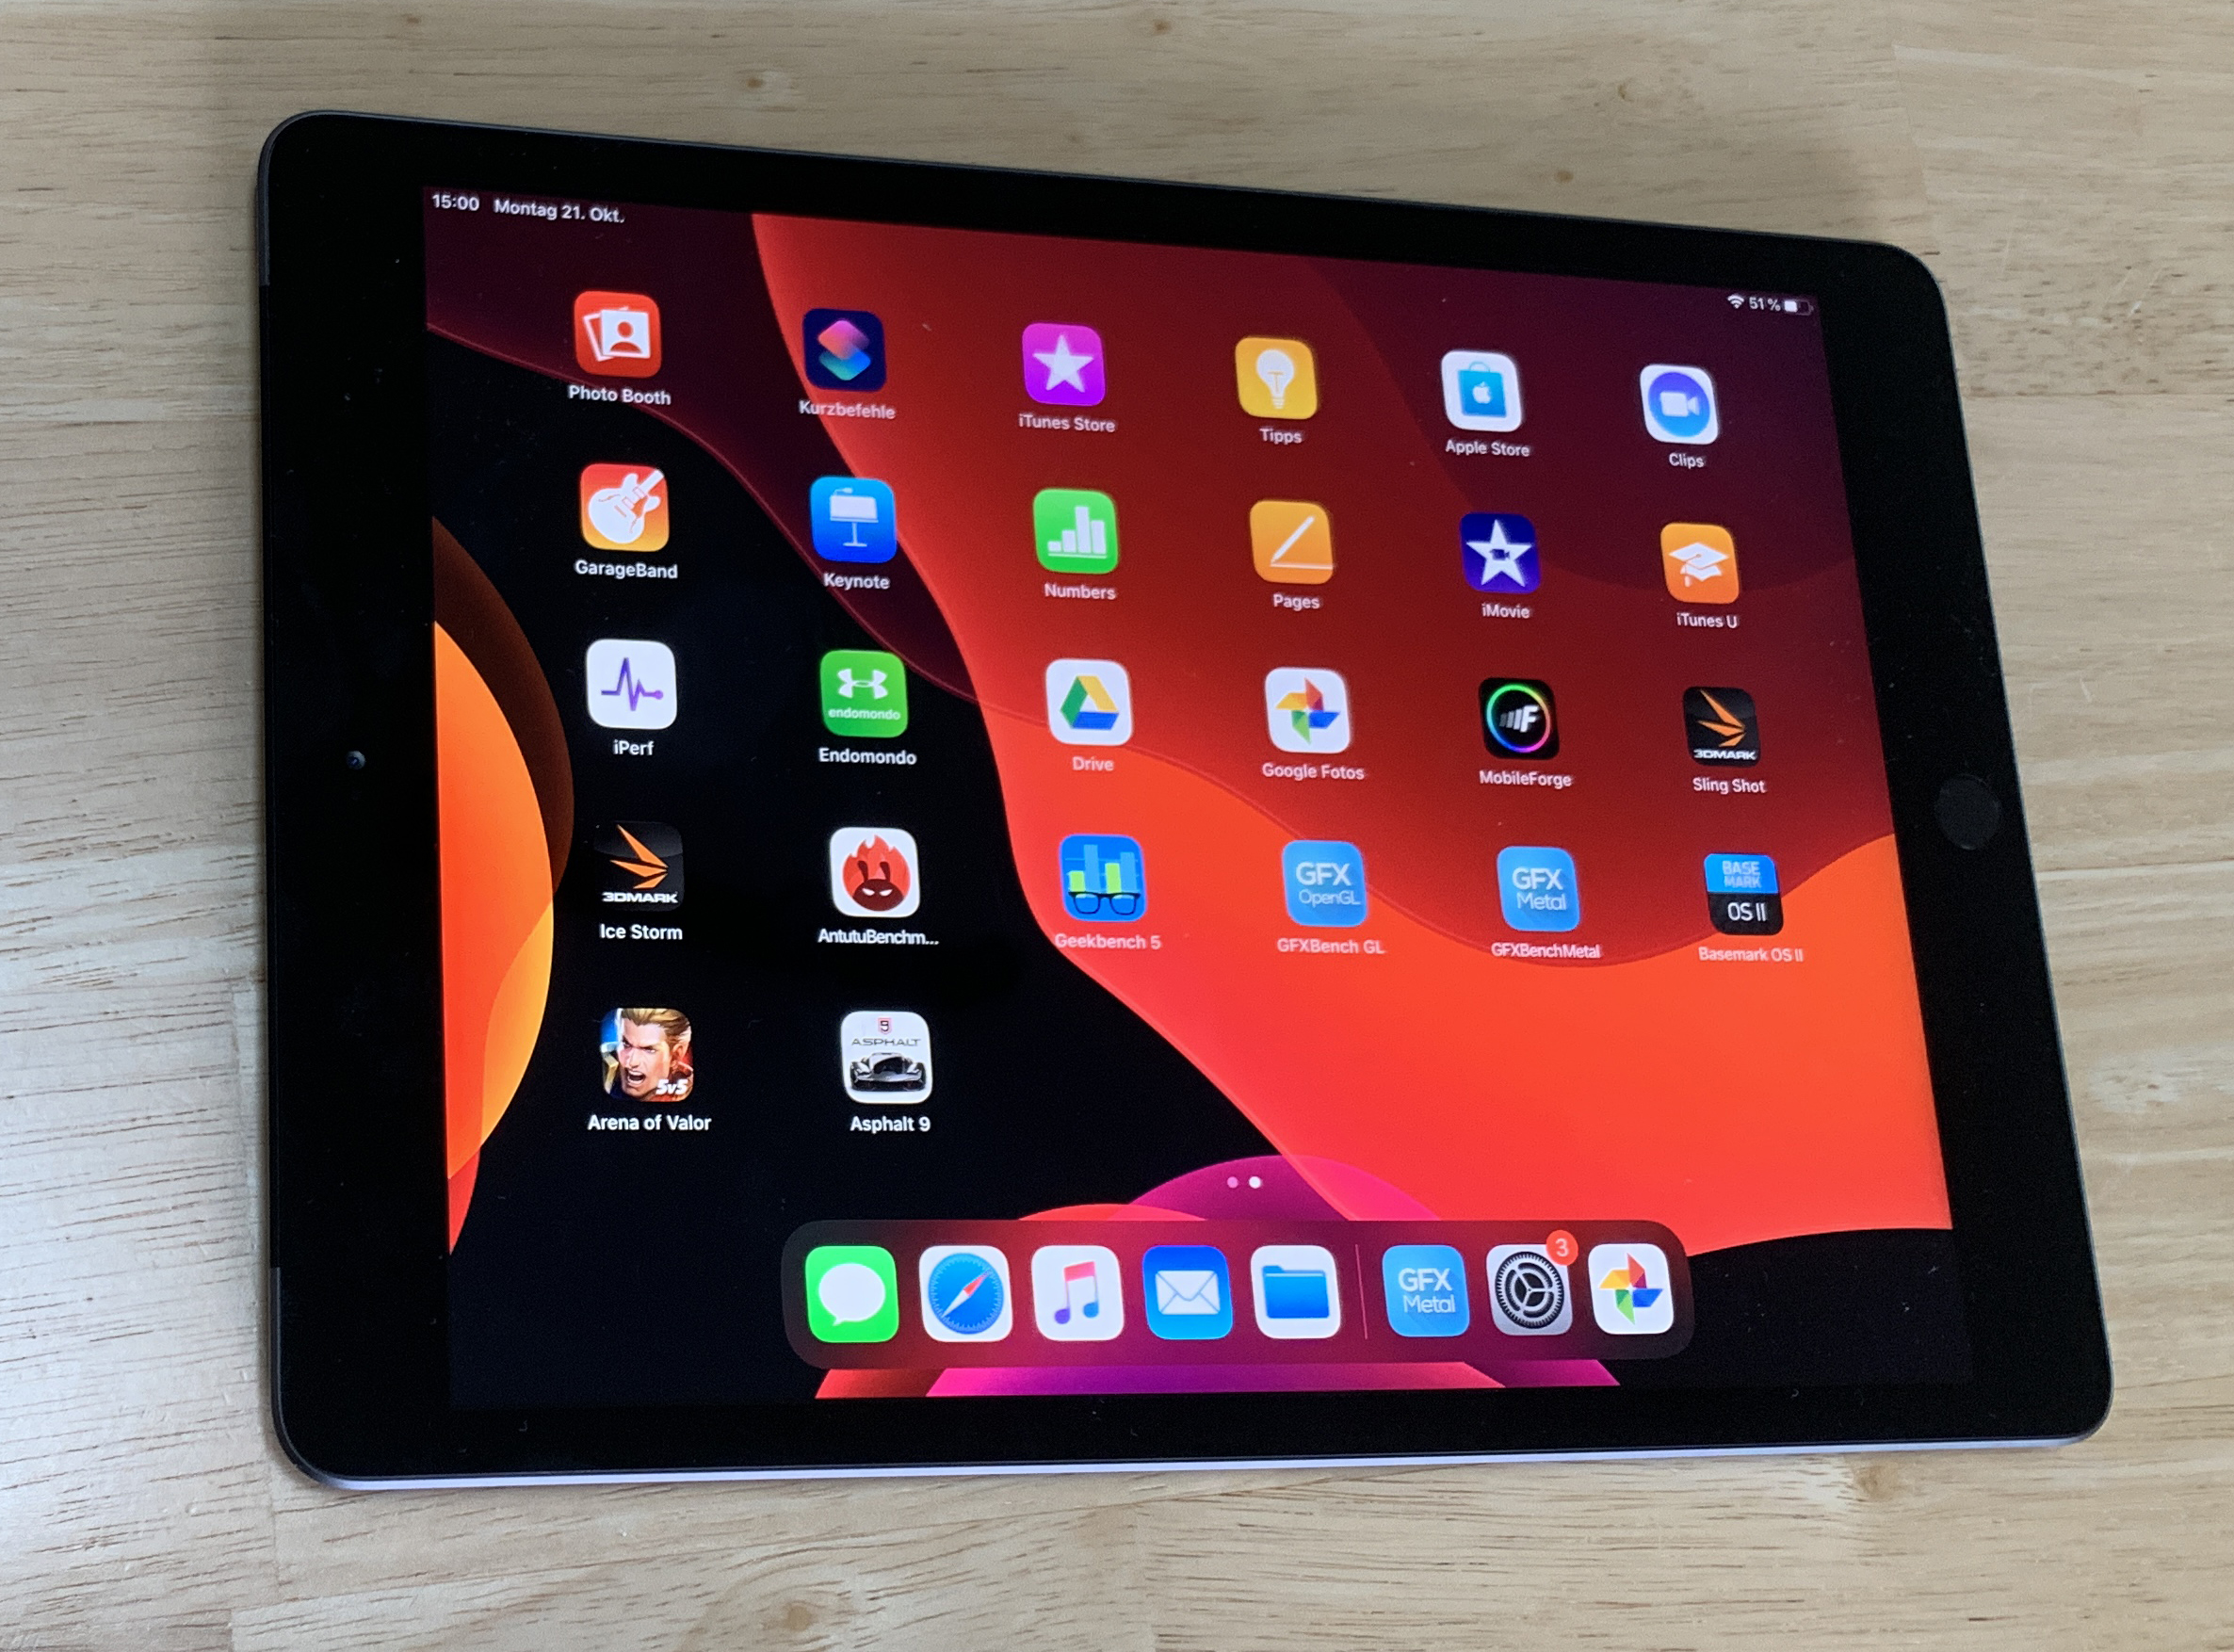
Az iPad 7 mégis egy nagyszerű otthoni és iskolai táblagép, amely bőven elegendő energiával rendelkezik az App Store minden egyes alkalmazásához. Prémium dizájnja, toll támogatása, jól optimalizált OS-je és jó kamerája valószínűleg mégis feltűnést fog kelteni.
Price comparison

