MSI GS65 Stealth 9SG (i7-9750H, RTX 2080 Max-Q) Laptop rövid értékelés
| |||||||||||||||||||||||||
Fényerő megoszlás: 90 %
Centrumban: 282.3 cd/m²
Kontraszt: 882:1 (Fekete: 0.32 cd/m²)
ΔE ColorChecker Calman: 1.17 | ∀{0.5-29.43 Ø4.72}
calibrated: 1.06
ΔE Greyscale Calman: 1.3 | ∀{0.09-98 Ø4.97}
97.5% sRGB (Argyll 1.6.3 3D)
63.8% AdobeRGB 1998 (Argyll 1.6.3 3D)
68.9% AdobeRGB 1998 (Argyll 3D)
97.5% sRGB (Argyll 3D)
67.6% Display P3 (Argyll 3D)
Gamma: 2.2
CCT: 6643 K
| MSI GS65 Stealth 9SG Sharp LQ156M1JW03 (SHP14C5), IPS, 15.6", 1920x1080 | Razer Blade 15 RTX 2080 Max-Q Sharp LQ156M1JW03 (SHP14C5), IPS, 15.6", 1920x1080 | Lenovo Legion Y740-15ICHg LP156WFG-SPB2, IPS, 15.6", 1920x1080 | Asus Zephyrus S GX531GX AU Optronics B156HAN08.2, IPS, 15.6", 1920x1080 | Gigabyte Aero 15 Classic-XA Sharp LQ156M1JW03 (SHP14C5), IGZO, 15.6", 1920x1080 | MSI GS65 8RF-019DE Stealth Thin AU Optronics B156HAN08.0 (AUO80ED), IPS, 15.6", 1920x1080 | |
|---|---|---|---|---|---|---|
| Display | -0% | -6% | -4% | -3% | -3% | |
| Display P3 Coverage (%) | 67.6 | 66.9 -1% | 63.5 -6% | 65.6 -3% | 65.3 -3% | 66.2 -2% |
| sRGB Coverage (%) | 97.5 | 98.1 1% | 92.4 -5% | 92.2 -5% | 95.5 -2% | 92.1 -6% |
| AdobeRGB 1998 Coverage (%) | 68.9 | 68.5 -1% | 64.7 -6% | 66.9 -3% | 66.5 -3% | 67.2 -2% |
| Response Times | 10% | -24% | 35% | -3% | -18% | |
| Response Time Grey 50% / Grey 80% * (ms) | 13.6 ? | 12.8 ? 6% | 18.8 ? -38% | 7 ? 49% | 15.2 ? -12% | 17.6 ? -29% |
| Response Time Black / White * (ms) | 12 ? | 10.4 ? 13% | 13.2 ? -10% | 9.6 ? 20% | 11.2 ? 7% | 12.8 ? -7% |
| PWM Frequency (Hz) | 23260 ? | 23810 ? | 23580 ? | |||
| Screen | -10% | -53% | -44% | -36% | -19% | |
| Brightness middle (cd/m²) | 282.3 | 293 4% | 320.4 13% | 323.6 15% | 266 -6% | 254 -10% |
| Brightness (cd/m²) | 269 | 270 0% | 298 11% | 315 17% | 248 -8% | 262 -3% |
| Brightness Distribution (%) | 90 | 87 -3% | 85 -6% | 91 1% | 89 -1% | 89 -1% |
| Black Level * (cd/m²) | 0.32 | 0.29 9% | 0.42 -31% | 0.29 9% | 0.31 3% | 0.22 31% |
| Contrast (:1) | 882 | 1010 15% | 763 -13% | 1116 27% | 858 -3% | 1155 31% |
| Colorchecker dE 2000 * | 1.17 | 1.69 -44% | 3.21 -174% | 3.31 -183% | 2.78 -138% | 2.37 -103% |
| Colorchecker dE 2000 max. * | 3.29 | 3.37 -2% | 5.54 -68% | 5.74 -74% | 5.96 -81% | 4.71 -43% |
| Colorchecker dE 2000 calibrated * | 1.06 | 1.24 -17% | 2.36 -123% | 2.73 -158% | 0.91 14% | 1.84 -74% |
| Greyscale dE 2000 * | 1.3 | 2.3 -77% | 3.6 -177% | 2.9 -123% | 3.58 -175% | 1.58 -22% |
| Gamma | 2.2 100% | 2.3 96% | 2.27 97% | 2.29 96% | 2.46 89% | 2.48 89% |
| CCT | 6643 98% | 6758 96% | 6503 100% | 6765 96% | 7186 90% | 6785 96% |
| Color Space (Percent of AdobeRGB 1998) (%) | 63.8 | 63 -1% | 59 -8% | 59.7 -6% | 62 -3% | 60 -6% |
| Color Space (Percent of sRGB) (%) | 97.5 | 98.5 1% | 92 -6% | 91.8 -6% | 96 -2% | 92 -6% |
| Teljes átlag (program / beállítások) | 0% /
-6% | -28% /
-40% | -4% /
-26% | -14% /
-26% | -13% /
-16% |
* ... a kisebb jobb
Megjelenítési válaszidők
| ↔ Válaszidő Fekete-fehér | ||
|---|---|---|
| 12 ms ... emelkedés és süllyedés ↘ kombinálva | ↗ 7.6 ms emelkedés | 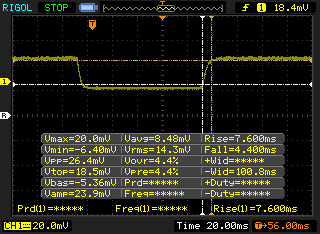 |
| ↘ 4.4 ms ősz | ||
| A képernyő jó reakciósebességet mutat tesztjeinkben, de túl lassú lehet a versenyképes játékosok számára. Összehasonlításképpen, az összes tesztelt eszköz 0.1 (minimum) és 240 (maximum) ms között mozog. » 32 % of all devices are better. Ez azt jelenti, hogy a mért válaszidő jobb, mint az összes vizsgált eszköz átlaga (19.8 ms). | ||
| ↔ Válaszidő 50% szürke és 80% szürke között | ||
| 13.6 ms ... emelkedés és süllyedés ↘ kombinálva | ↗ 8 ms emelkedés | 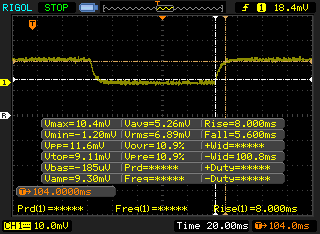 |
| ↘ 5.6 ms ősz | ||
| A képernyő jó reakciósebességet mutat tesztjeinkben, de túl lassú lehet a versenyképes játékosok számára. Összehasonlításképpen, az összes tesztelt eszköz 0.165 (minimum) és 636 (maximum) ms között mozog. » 27 % of all devices are better. Ez azt jelenti, hogy a mért válaszidő jobb, mint az összes vizsgált eszköz átlaga (31 ms). | ||
Képernyő villogása / PWM (impulzusszélesség-moduláció)
| Képernyő villogása / PWM észlelve | 23260 Hz | ≤ 19 % fényerő beállítása | 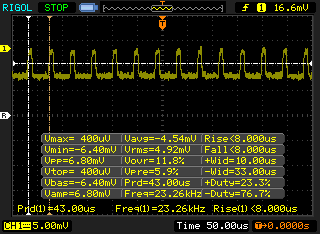 |
A kijelző háttérvilágítása 23260 Hz-en villog (a legrosszabb esetben, pl. PWM használatával) Villódzás észlelve a 19 % vagy annál kisebb fényerő-beállításnál. E fényerő-beállítás felett nem lehet villogás vagy PWM. A 23260 Hz frekvenciája meglehetősen magas, így a legtöbb PWM-re érzékeny felhasználó nem észlel semmilyen villogást. Összehasonlításképpen: az összes tesztelt eszköz 52 %-a nem használja a PWM-et a kijelző elsötétítésére. Ha PWM-et észleltek, akkor átlagosan 7763 (minimum: 5 - maximum: 343500) Hz-t mértek. | |||
| Cinebench R15 | |
| CPU Single 64Bit | |
| MSI GT75 8RG-090 Titan | |
| MSI GE75 9SG | |
| Átlagos Intel Core i7-9750H (170 - 194, n=82) | |
| Asus Zephyrus S GX502GW | |
| MSI GS65 Stealth Thin 8RE-051US | |
| MSI GS65 Stealth 9SG | |
| MSI GF63 8RC-040XPL | |
| Samsung Notebook 9 NP930QAA | |
| Acer Nitro 5 AN515-42-R6V0 | |
| MSI GF62VR 7RF-877 | |
| Asus ROG Zephyrus G15 GA502DU | |
| CPU Multi 64Bit | |
| MSI GE75 9SG | |
| MSI GT75 8RG-090 Titan | |
| MSI GS65 Stealth 9SG | |
| Asus Zephyrus S GX502GW | |
| Átlagos Intel Core i7-9750H (952 - 1306, n=85) | |
| MSI GS65 Stealth Thin 8RE-051US | |
| MSI GF63 8RC-040XPL | |
| Asus ROG Zephyrus G15 GA502DU | |
| MSI GF62VR 7RF-877 | |
| Acer Nitro 5 AN515-42-R6V0 | |
| Samsung Notebook 9 NP930QAA | |
| Cinebench R10 | |
| Rendering Multiple CPUs 32Bit | |
| MSI GE75 9SG | |
| Átlagos Intel Core i7-9750H (28251 - 36304, n=13) | |
| MSI GF62VR 7RF-877 | |
| Asus ROG Zephyrus G15 GA502DU | |
| Rendering Single 32Bit | |
| MSI GE75 9SG | |
| Átlagos Intel Core i7-9750H (6659 - 7214, n=13) | |
| MSI GF62VR 7RF-877 | |
| Asus ROG Zephyrus G15 GA502DU | |
| wPrime 2.10 - 1024m | |
| MSI GF63 8RC-040XPL | |
| MSI GF62VR 7RF-877 | |
| Asus ROG Zephyrus G15 GA502DU | |
| Átlagos Intel Core i7-9750H (n=1) | |
| MSI GE75 9SG | |
* ... a kisebb jobb
| PCMark 8 Home Score Accelerated v2 | 4454 pontok | |
| PCMark 8 Work Score Accelerated v2 | 5751 pontok | |
| PCMark 10 Score | 5725 pontok | |
Segítség | ||
| MSI GS65 Stealth 9SG Samsung SSD PM981 MZVLB512HAJQ | Razer Blade 15 RTX 2080 Max-Q Samsung SSD PM981 MZVLB512HAJQ | Lenovo Legion Y740-15ICHg Samsung SSD PM981 MZVLB256HAHQ | Asus Zephyrus S GX531GX Intel SSD 660p SSDPEKNW512G8 | MSI GS65 8RF-019DE Stealth Thin Samsung SSD PM981 MZVLB512HAJQ | Gigabyte Aero 15 Classic-XA Intel SSD 760p SSDPEKKW512G8 | |
|---|---|---|---|---|---|---|
| AS SSD | -5% | -23% | -42% | -6% | -21% | |
| Seq Read (MB/s) | 2005 | 1832 -9% | 1953 -3% | 1239 -38% | 1266 -37% | 2517 26% |
| Seq Write (MB/s) | 1580 | 1864 18% | 1629 3% | 920 -42% | 1834 16% | 924 -42% |
| 4K Read (MB/s) | 49.33 | 52.1 6% | 33.2 -33% | 45.74 -7% | 48.94 -1% | 59.1 20% |
| 4K Write (MB/s) | 103.8 | 108.3 4% | 88.1 -15% | 95.7 -8% | 107.2 3% | 126.5 22% |
| 4K-64 Read (MB/s) | 1241 | 1159 -7% | 757 -39% | 322 -74% | 1170 -6% | 876 -29% |
| 4K-64 Write (MB/s) | 1730 | 1807 4% | 1501 -13% | 722 -58% | 1760 2% | 922 -47% |
| Access Time Read * (ms) | 0.054 | 0.05 7% | 0.077 -43% | 0.073 -35% | 0.073 -35% | 0.042 22% |
| Access Time Write * (ms) | 0.036 | 0.034 6% | 0.043 -19% | 0.047 -31% | 0.035 3% | 0.065 -81% |
| Score Read (Points) | 1490 | 1394 -6% | 985 -34% | 492 -67% | 1346 -10% | 1186 -20% |
| Score Write (Points) | 1991 | 2102 6% | 1752 -12% | 910 -54% | 2051 3% | 1141 -43% |
| Score Total (Points) | 4230 | 4221 0% | 3230 -24% | 1654 -61% | 4122 -3% | 2870 -32% |
| Copy ISO MB/s (MB/s) | 3025 | 2083 -31% | 1872 -38% | 1236 -59% | 2086 -31% | |
| Copy Program MB/s (MB/s) | 713 | 496.5 -30% | 478.2 -33% | 703 -1% | 454.2 -36% | |
| Copy Game MB/s (MB/s) | 1554 | 977 -37% | 1165 -25% | 812 -48% | 1141 -27% |
* ... a kisebb jobb

| 3DMark 11 Performance | 20209 pontok | |
| 3DMark Cloud Gate Standard Score | 37220 pontok | |
| 3DMark Fire Strike Score | 16598 pontok | |
| 3DMark Time Spy Score | 7099 pontok | |
Segítség | ||
| The Witcher 3 - 1920x1080 Ultra Graphics & Postprocessing (HBAO+) | |
| MSI RTX 2080 Gaming X Trio | |
| MSI GE75 9SG | |
| Asus Zephyrus S GX531GX | |
| Átlagos NVIDIA GeForce RTX 2080 Max-Q (65.7 - 92.7, n=22) | |
| Asus Zephyrus S GX502GW | |
| Razer Blade 15 RTX 2070 Max-Q | |
| MSI GS65 Stealth 9SG | |
| HP Omen X 17-ap0xx | |
| Alienware 17 R5 | |
| Aorus 15 W9 | |
| MSI GS65 8RF-019DE Stealth Thin | |
| MSI GS65 Stealth Thin 8RE-051US | |
| Acer Nitro 5 AN515-42-R6V0 | |
| Shadow of the Tomb Raider - 1920x1080 Highest Preset AA:T | |
| MSI RTX 2080 Gaming X Trio | |
| MSI GE75 9SG | |
| Átlagos NVIDIA GeForce RTX 2080 Max-Q (71 - 105, n=8) | |
| MSI GS65 Stealth 9SG | |
| Asus Zephyrus S GX502GW | |
| Acer Nitro 5 AN515-42-R6V0 | |
| alacsony | közepes | magas | ultra | |
|---|---|---|---|---|
| BioShock Infinite (2013) | 306.4 | 273 | 254.1 | 156.9 |
| The Witcher 3 (2015) | 279 | 216 | 125.5 | 66.9 |
| Rise of the Tomb Raider (2016) | 223.3 | 176.7 | 139.8 | 108.6 |
| Shadow of the Tomb Raider (2018) | 133 | 102 | 97 | 84 |
| MSI GS65 Stealth 9SG GeForce RTX 2080 Max-Q, i7-9750H | Razer Blade 15 RTX 2080 Max-Q GeForce RTX 2080 Max-Q, i7-9750H | MSI GS65 8RF-019DE Stealth Thin GeForce GTX 1070 Max-Q, i7-8750H | Asus Zephyrus S GX531GX GeForce RTX 2080 Max-Q, i7-8750H | Gigabyte Aero 15 Classic-XA GeForce RTX 2070 Max-Q, i7-9750H | MSI GE75 9SG GeForce RTX 2080 Mobile, i9-9880H | |
|---|---|---|---|---|---|---|
| Noise | 7% | -0% | -8% | -12% | -4% | |
| off / környezet * (dB) | 28.3 | 28.3 -0% | 30 -6% | 28.7 -1% | 30 -6% | 28.2 -0% |
| Idle Minimum * (dB) | 30.4 | 28.8 5% | 30 1% | 29.8 2% | 31 -2% | 30.4 -0% |
| Idle Average * (dB) | 30.5 | 28.8 6% | 31 -2% | 32.4 -6% | 34 -11% | 30.4 -0% |
| Idle Maximum * (dB) | 30.6 | 29 5% | 34 -11% | 38 -24% | 39 -27% | 33.4 -9% |
| Load Average * (dB) | 37.6 | 33.5 11% | 43 -14% | 38.2 -2% | 46 -22% | 37.1 1% |
| Witcher 3 ultra * (dB) | 46 | 45 2% | 42 9% | 56.6 -23% | 53 -15% | 54.2 -18% |
| Load Maximum * (dB) | 55.1 | 45.2 18% | 44 20% | 56.6 -3% | 55 -0% | 56.4 -2% |
* ... a kisebb jobb
Zajszint
| Üresjárat |
| 30.4 / 30.5 / 30.6 dB(A) |
| Terhelés |
| 37.6 / 55.1 dB(A) |
 | ||
30 dB csendes 40 dB(A) hallható 50 dB(A) hangos |
||
min: | ||
(-) A felső oldalon a maximális hőmérséklet 45.6 °C / 114 F, összehasonlítva a 40.4 °C / 105 F átlagával , 21.2 és 68.8 °C között a Gaming osztálynál.
(-) Az alsó maximum 53.8 °C / 129 F-ig melegszik fel, összehasonlítva a 43.2 °C / 110 F átlagával
(+) Üresjáratban a felső oldal átlagos hőmérséklete 27.1 °C / 81 F, összehasonlítva a 33.9 °C / ### eszközátlaggal class_avg_f### F.
(±) A The Witcher 3 játék során a felső oldal átlaghőmérséklete 35.2 °C / 95 F, összehasonlítva a 33.9 °C / ## eszközátlaggal #class_avg_f### F.
(+) A csuklótámasz és az érintőpad hűvösebb, mint a bőr hőmérséklete, maximum 29 °C / 84.2 F, ezért hűvös tapintású.
(±) A hasonló eszközök csuklótámasz területének átlagos hőmérséklete 28.8 °C / 83.8 F volt (-0.2 °C / -0.4 F).
MSI GS65 Stealth 9SG hangelemzés
(+) | a hangszórók viszonylag hangosan tudnak játszani (89.4 dB)
Basszus 100 - 315 Hz
(-) | szinte nincs basszus – átlagosan 22.7%-kal alacsonyabb a mediánnál
(±) | a basszus linearitása átlagos (9% delta az előző frekvenciához)
Közepes 400-2000 Hz
(±) | magasabb középértékek – átlagosan 7%-kal magasabb, mint a medián
(+) | a középpontok lineárisak (6.4% delta az előző frekvenciához)
Maximum 2-16 kHz
(+) | kiegyensúlyozott csúcsok – csak 2.7% választja el a mediántól
(±) | a csúcsok linearitása átlagos (10.6% delta az előző gyakorisághoz)
Összességében 100 - 16.000 Hz
(±) | az általános hang linearitása átlagos (23.1% eltérés a mediánhoz képest)
Ugyanazon osztályhoz képest
» 84%Ebben az osztályban az összes tesztelt eszköz %-a jobb volt, 4% hasonló, 12%-kal rosszabb
» A legjobb delta értéke 6%, az átlag 18%, a legrosszabb 132% volt
Az összes tesztelt eszközzel összehasonlítva
» 69% az összes tesztelt eszköz jobb volt, 5% hasonló, 26%-kal rosszabb
» A legjobb delta értéke 4%, az átlag 23%, a legrosszabb 134% volt
Apple MacBook 12 (Early 2016) 1.1 GHz hangelemzés
(+) | a hangszórók viszonylag hangosan tudnak játszani (83.6 dB)
Basszus 100 - 315 Hz
(±) | csökkentett basszus – átlagosan 11.3%-kal alacsonyabb, mint a medián
(±) | a basszus linearitása átlagos (14.2% delta az előző frekvenciához)
Közepes 400-2000 Hz
(+) | kiegyensúlyozott középpontok – csak 2.4% választja el a mediántól
(+) | a középpontok lineárisak (5.5% delta az előző frekvenciához)
Maximum 2-16 kHz
(+) | kiegyensúlyozott csúcsok – csak 2% választja el a mediántól
(+) | a csúcsok lineárisak (4.5% delta az előző frekvenciához képest)
Összességében 100 - 16.000 Hz
(+) | általános hangzás lineáris (10.2% eltérés a mediánhoz képest)
Ugyanazon osztályhoz képest
» 7%Ebben az osztályban az összes tesztelt eszköz %-a jobb volt, 2% hasonló, 91%-kal rosszabb
» A legjobb delta értéke 5%, az átlag 18%, a legrosszabb 53% volt
Az összes tesztelt eszközzel összehasonlítva
» 5% az összes tesztelt eszköz jobb volt, 1% hasonló, 94%-kal rosszabb
» A legjobb delta értéke 4%, az átlag 23%, a legrosszabb 134% volt
| Kikapcsolt állapot / Készenlét | |
| Üresjárat | |
| Terhelés |
|
Kulcs:
min: | |
| MSI GS65 Stealth 9SG i7-9750H, GeForce RTX 2080 Max-Q, Samsung SSD PM981 MZVLB512HAJQ, IPS, 1920x1080, 15.6" | Razer Blade 15 RTX 2080 Max-Q i7-9750H, GeForce RTX 2080 Max-Q, Samsung SSD PM981 MZVLB512HAJQ, IPS, 1920x1080, 15.6" | MSI GS65 8RF-019DE Stealth Thin i7-8750H, GeForce GTX 1070 Max-Q, Samsung SSD PM981 MZVLB512HAJQ, IPS, 1920x1080, 15.6" | Lenovo Legion Y740-15ICHg i7-8750H, GeForce RTX 2070 Max-Q, Samsung SSD PM981 MZVLB256HAHQ, IPS, 1920x1080, 15.6" | Aorus 15 W9 i7-8750H, GeForce RTX 2060 Mobile, Intel SSD 760p SSDPEKKW512G8, IPS, 1920x1080, 15.6" | MSI GE75 9SG i9-9880H, GeForce RTX 2080 Mobile, Samsung SSD PM981 MZVLB1T0HALR, AHVA, 1920x1080, 17.3" | |
|---|---|---|---|---|---|---|
| Power Consumption | 14% | 27% | -2% | 7% | -10% | |
| Idle Minimum * (Watt) | 18.3 | 12.5 32% | 7 62% | 22.9 -25% | 18 2% | 13.9 24% |
| Idle Average * (Watt) | 22 | 15.3 30% | 11 50% | 27.2 -24% | 20 9% | 18.8 15% |
| Idle Maximum * (Watt) | 28.8 | 20.7 28% | 20 31% | 27.5 5% | 28 3% | 23.1 20% |
| Load Average * (Watt) | 93 | 90.2 3% | 98 -5% | 83.4 10% | 87 6% | 112.3 -21% |
| Witcher 3 ultra * (Watt) | 142.6 | 162 -14% | 132 7% | 143.6 -1% | 135 5% | 231 -62% |
| Load Maximum * (Watt) | 215.9 | 209.3 3% | 182 16% | 160.5 26% | 175 19% | 291.5 -35% |
* ... a kisebb jobb
| MSI GS65 Stealth 9SG i7-9750H, GeForce RTX 2080 Max-Q, 82 Wh | Razer Blade 15 RTX 2080 Max-Q i7-9750H, GeForce RTX 2080 Max-Q, 80 Wh | Lenovo Legion Y740-15ICHg i7-8750H, GeForce RTX 2070 Max-Q, 57 Wh | Alienware m15 GTX 1070 Max-Q i7-8750H, GeForce GTX 1070 Max-Q, 90 Wh | MSI GS65 8RF-019DE Stealth Thin i7-8750H, GeForce GTX 1070 Max-Q, 82 Wh | Asus Zephyrus S GX531GX i7-8750H, GeForce RTX 2080 Max-Q, 50 Wh | |
|---|---|---|---|---|---|---|
| Akkumulátor üzemidő | 10% | -53% | 28% | 0% | -50% | |
| WiFi v1.3 (h) | 6 | 6.6 10% | 2.8 -53% | 7.7 28% | 6 0% | 3 -50% |
| Reader / Idle (h) | 15.9 | 3.9 | 10.5 | 8.5 | ||
| Load (h) | 1.7 | 0.8 | 1.7 | 1.4 |
Pro
Kontra

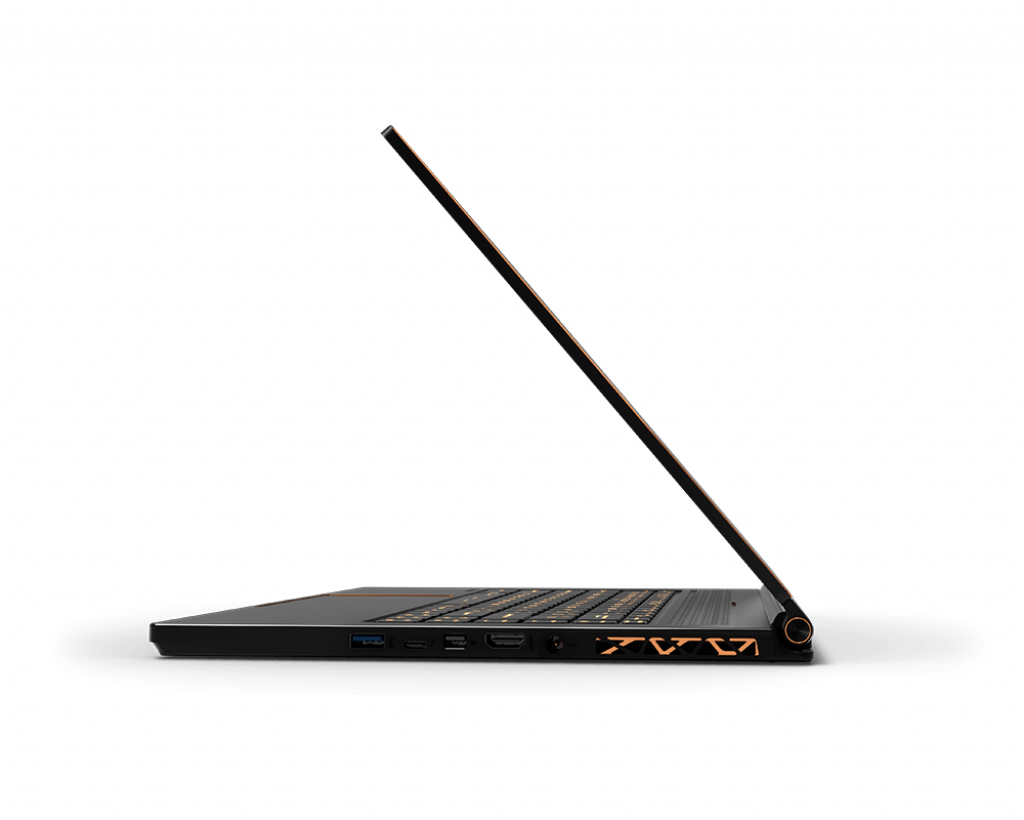
Ha a legjobb játékélményt szeretnénk kihozni a GS65-ből, akkor nem kérdés, hogy a 240 Hz-es kijelző SKU és az RTX 2080 Max-Q grafika megfelelő lesz. Minden, amit a múltban dícsértünk és kritizáltunk a GS65-tel kapcsolatban, érvényes a legújabb, 2019-es frissítésre is, beleértve a könnyű dizájnt, a nehéz szervízelhetőséget, a jó üzemidőt és a közepes merevséget.
A legjobb ár-érték arányt elérése érdekében azonban nem valószínű, hogy a 240 Hz-es kijelző és az RTX 2080 Max-Q GPU lenne a legjobb választás. Az alap 144 Hz-es panel és a gyorsabb 240 Hz-es panel közötti különbség nehezen érzékelhető, míg az RTX 2080 Max-Q csak legtöbb 8 százalékkal gyorsabb, mint az RTX 2070 Max-Q. Közel 900 dollárt lehet megtakarítani azzal, hogy a 144 Hz-es, RTX 2070 Max-Q és i7-8750H SKU-t választjuk a 240 Hz-es, RTX 2080 Max-Q és i7-9750H SKU helyett anélkül, hogy túl nagy játékteljesítményt áldoznánk fel.
Az RTX 2080 Max-Q kevesebb, mint 10 százalékkal gyorsabb, mint az RTX 2070 Max-Q, és mégis 500 dollárral többe kerül. Ez nagy ár azért, hogy a lehető leggyorsabb GPU teljesítményt kapjuk a GS65-től.
MSI GS65 Stealth 9SG
- 09/20/2019 v7 (old)
Allen Ngo
Price comparison

