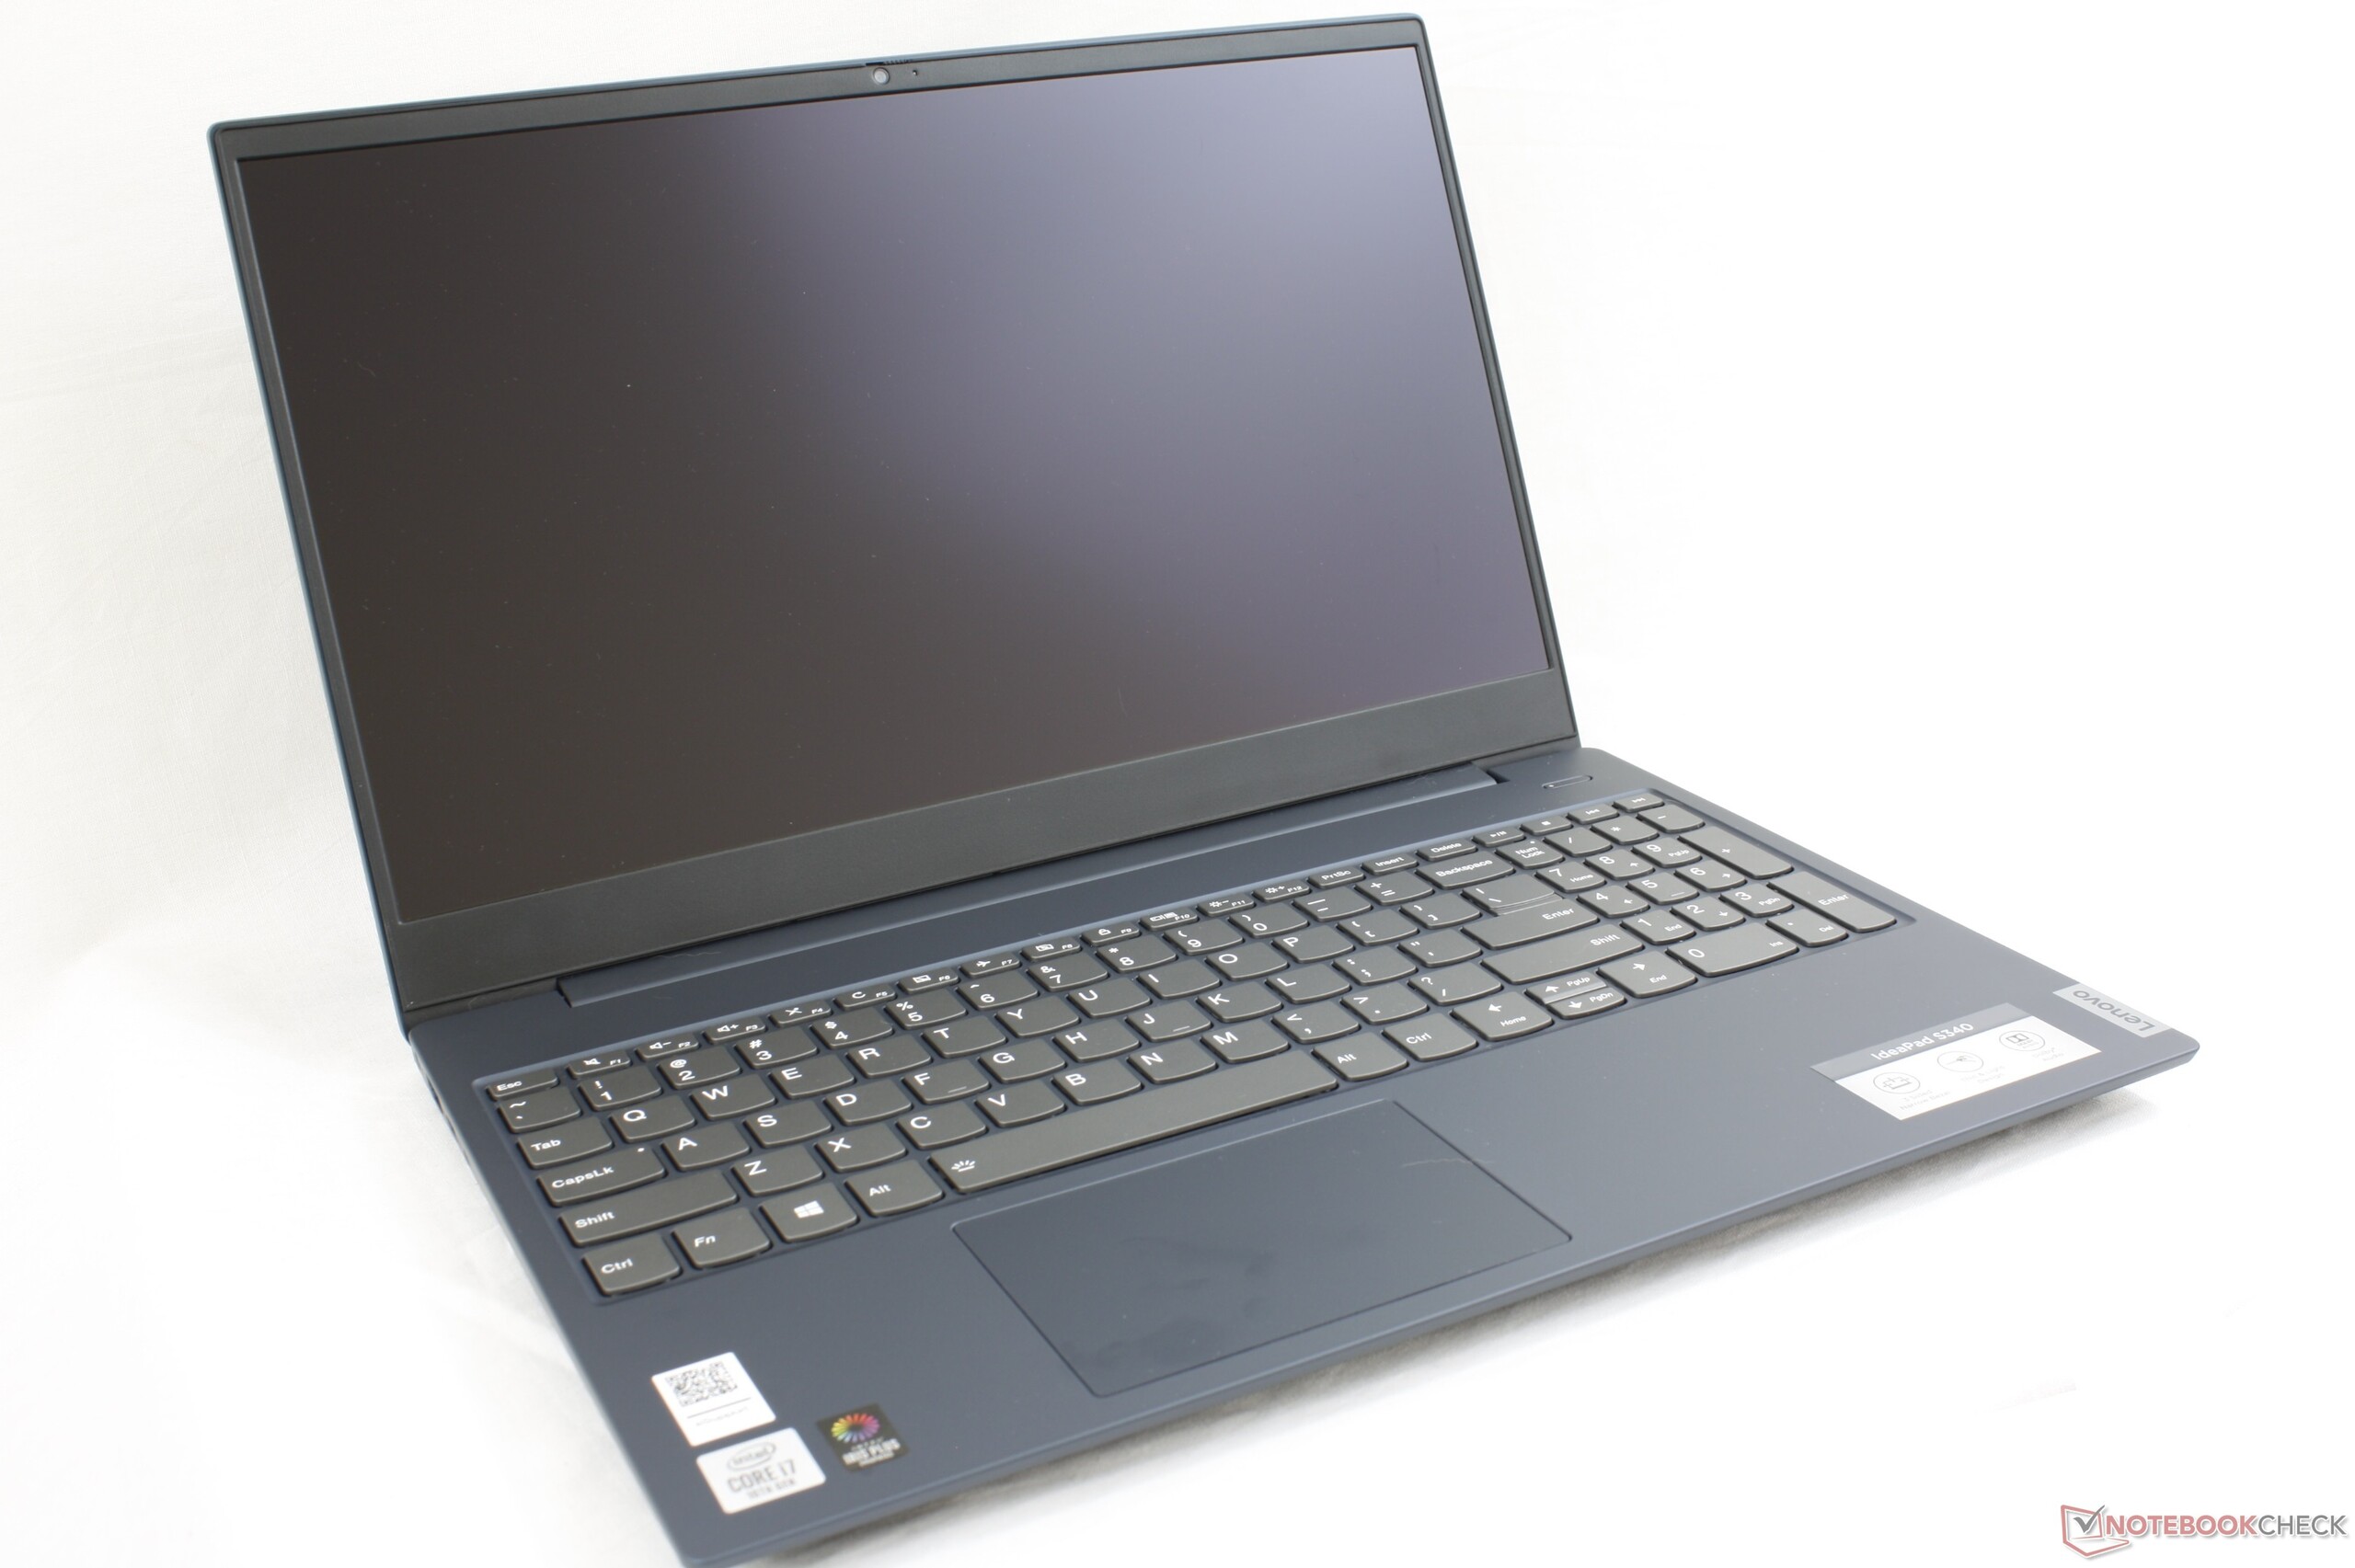
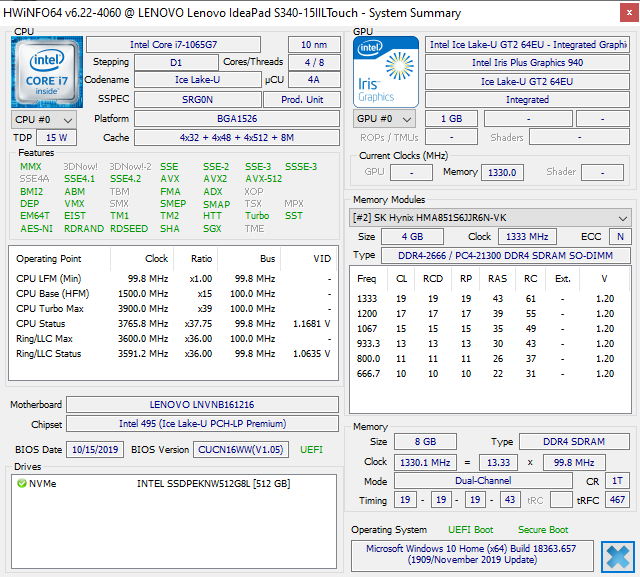
Lenovo IdeaPad S340-15 Laptop rövid értékelés: Az Olcsó Core i7 Ice Lake Teljesítményének Ára Van
Értékelés | Dátum | Modell | Súly | Magasság | Méret | Felbontás | Legjobb ár |
|---|---|---|---|---|---|---|---|
| 79.4 % v7 (old) | 06/2020 | Lenovo Ideapad S340-15IIL i7-1065G7, Iris Plus Graphics G7 (Ice Lake 64 EU) | 1.8 kg | 17.9 mm | 15.60" | 1920x1080 | |
| 86.3 % v7 (old) | 12/2019 | Dell XPS 15 7590 i5 iGPU FHD i5-9300H, UHD Graphics 630 | 1.9 kg | 17 mm | 15.60" | 1920x1080 | |
| 83 % v6 (old) | 05/2019 | HP Pavilion 15-cs2019ng i5-8265U, GeForce MX250 | 1.9 kg | 18 mm | 15.60" | 1920x1080 | |
| 80.7 % v6 (old) | Asus VivoBook 15 X542UF-DM143T i5-8250U, GeForce MX130 | 2.3 kg | 23 mm | 15.60" | 1920x1080 | ||
| 84.1 % v6 (old) | 09/2023 | Lenovo Yoga 530-14ARR-81H9000VGE R7 2700U, Vega 10 | 1.7 kg | 17.6 mm | 14.00" | 1920x1080 |
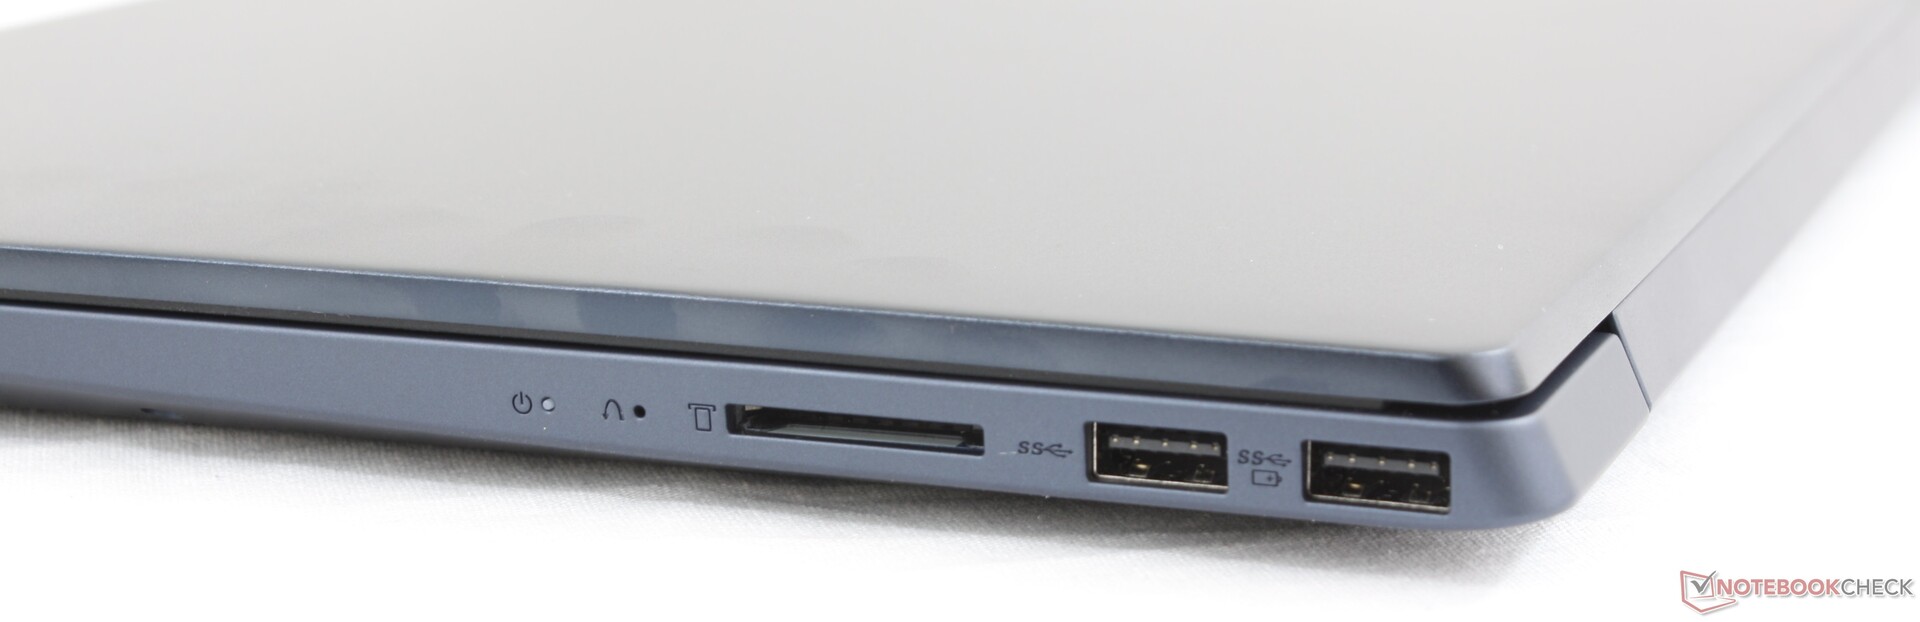
| SD Card Reader | |
| average JPG Copy Test (av. of 3 runs) | |
| Dell XPS 15 7590 i5 iGPU FHD (Toshiba Exceria Pro SDXC 64 GB UHS-II) | |
| Lenovo Ideapad S540-15IML (Toshiba Exceria Pro SDXC 64 GB UHS-II) | |
| Lenovo Ideapad S340-15IIL (Toshiba Exceria Pro SDXC 64 GB UHS-II) | |
| Dell Inspiron 15 5000 5585 (Toshiba Exceria Pro SDXC 64 GB UHS-II) | |
| maximum AS SSD Seq Read Test (1GB) | |
| Dell XPS 15 7590 i5 iGPU FHD (Toshiba Exceria Pro SDXC 64 GB UHS-II) | |
| Lenovo Ideapad S340-15IIL (Toshiba Exceria Pro SDXC 64 GB UHS-II) | |
| Lenovo Ideapad S540-15IML (Toshiba Exceria Pro SDXC 64 GB UHS-II) | |
| Dell Inspiron 15 5000 5585 (Toshiba Exceria Pro SDXC 64 GB UHS-II) | |
| Networking | |
| iperf3 transmit AX12 | |
| Lenovo ThinkPad T490 20RY0002US | |
| Lenovo Yoga C740-14IML | |
| Lenovo Ideapad S340-15IIL | |
| Alienware m17 R2 P41E | |
| iperf3 receive AX12 | |
| Lenovo ThinkPad T490 20RY0002US | |
| Lenovo Ideapad S340-15IIL | |
| Lenovo Yoga C740-14IML | |
| Alienware m17 R2 P41E | |

| |||||||||||||||||||||||||
Fényerő megoszlás: 87 %
Centrumban: 320.8 cd/m²
Kontraszt: 1188:1 (Fekete: 0.27 cd/m²)
ΔE ColorChecker Calman: 7.68 | ∀{0.5-29.43 Ø4.73}
calibrated: 4.65
ΔE Greyscale Calman: 7.3 | ∀{0.09-98 Ø4.97}
58.3% sRGB (Argyll 1.6.3 3D)
37.8% AdobeRGB 1998 (Argyll 1.6.3 3D)
41.77% AdobeRGB 1998 (Argyll 3D)
58.8% sRGB (Argyll 3D)
40.43% Display P3 (Argyll 3D)
Gamma: 2.12
CCT: 6213 K
| Lenovo Ideapad S340-15IIL BOE CQ NV156FHM-T03, IPS, 15.6", 1920x1080 | Dell XPS 15 7590 i5 iGPU FHD LQ156M1, IPS, 15.6", 1920x1080 | Dell Inspiron 15 5000 5585 LG Philips 156WFC, IPS, 15.6", 1920x1080 | Lenovo Ideapad S540-15IML BOEhydis NV156FHM-N61 (BOE06FB), IPS, 15.6", 1920x1080 | HP Pavilion 15-cs2019ng BOE080D, IPS, 15.6", 1920x1080 | Asus VivoBook 15 X542UF-DM143T BOE CQ NT156FHM-N41, TN LED, 15.6", 1920x1080 | |
|---|---|---|---|---|---|---|
| Display | 65% | -7% | 54% | 57% | -6% | |
| Display P3 Coverage (%) | 40.43 | 66.5 64% | 37.31 -8% | 66.8 65% | 67.2 66% | 37.47 -7% |
| sRGB Coverage (%) | 58.8 | 98 67% | 56.2 -4% | 86.5 47% | 88.1 50% | 56.4 -4% |
| AdobeRGB 1998 Coverage (%) | 41.77 | 68.4 64% | 38.55 -8% | 63.2 51% | 64.4 54% | 38.71 -7% |
| Response Times | -3% | 31% | -3% | 13% | 29% | |
| Response Time Grey 50% / Grey 80% * (ms) | 46.4 ? | 52.8 ? -14% | 28.4 ? 39% | 49.6 ? -7% | 43 ? 7% | 41 ? 12% |
| Response Time Black / White * (ms) | 35.2 ? | 32 ? 9% | 27.2 ? 23% | 34.8 ? 1% | 29 ? 18% | 19 ? 46% |
| PWM Frequency (Hz) | 1020 ? | 202 ? | 208 ? | 7000 ? | ||
| Screen | 49% | 2% | 25% | 24% | 0% | |
| Brightness middle (cd/m²) | 320.8 | 588 83% | 253.6 -21% | 299 -7% | 320 0% | 230 -28% |
| Brightness (cd/m²) | 309 | 555 80% | 227 -27% | 278 -10% | 293 -5% | 221 -28% |
| Brightness Distribution (%) | 87 | 89 2% | 84 -3% | 87 0% | 86 -1% | 91 5% |
| Black Level * (cd/m²) | 0.27 | 0.4 -48% | 0.27 -0% | 0.25 7% | 0.26 4% | 0.45 -67% |
| Contrast (:1) | 1188 | 1470 24% | 939 -21% | 1196 1% | 1231 4% | 511 -57% |
| Colorchecker dE 2000 * | 7.68 | 2.5 67% | 6.05 21% | 4.32 44% | 4.5 41% | 3.6 53% |
| Colorchecker dE 2000 max. * | 21.97 | 6.3 71% | 14.03 36% | 9.3 58% | 8.81 60% | 5.59 75% |
| Colorchecker dE 2000 calibrated * | 4.65 | 0.6 87% | 4.97 -7% | 2.58 45% | ||
| Greyscale dE 2000 * | 7.3 | 4.5 38% | 3.2 56% | 4.21 42% | 4.71 35% | 3.13 57% |
| Gamma | 2.12 104% | 2.2 100% | 2 110% | 2.39 92% | 2.45 90% | 2.45 90% |
| CCT | 6213 105% | 6836 95% | 6820 95% | 6799 96% | 7085 92% | 7244 90% |
| Color Space (Percent of AdobeRGB 1998) (%) | 37.8 | 63.2 67% | 35.5 -6% | 57 51% | 58 53% | 36 -5% |
| Color Space (Percent of sRGB) (%) | 58.3 | 98 68% | 55.6 -5% | 86 48% | 88 51% | 56 -4% |
| Teljes átlag (program / beállítások) | 37% /
46% | 9% /
4% | 25% /
27% | 31% /
29% | 8% /
3% |
* ... a kisebb jobb
Megjelenítési válaszidők
| ↔ Válaszidő Fekete-fehér | ||
|---|---|---|
| 35.2 ms ... emelkedés és süllyedés ↘ kombinálva | ↗ 20.4 ms emelkedés | 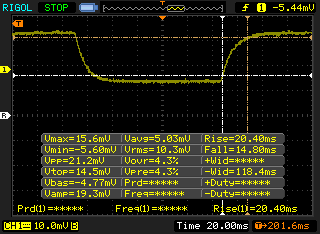 |
| ↘ 14.8 ms ősz | ||
| A képernyő lassú reakciósebességet mutat tesztjeinkben, és nem lesz kielégítő a játékosok számára. Összehasonlításképpen, az összes tesztelt eszköz 0.1 (minimum) és 240 (maximum) ms között mozog. » 93 % of all devices are better. Ez azt jelenti, hogy a mért válaszidő rosszabb, mint az összes vizsgált eszköz átlaga (19.9 ms). | ||
| ↔ Válaszidő 50% szürke és 80% szürke között | ||
| 46.4 ms ... emelkedés és süllyedés ↘ kombinálva | ↗ 26 ms emelkedés | 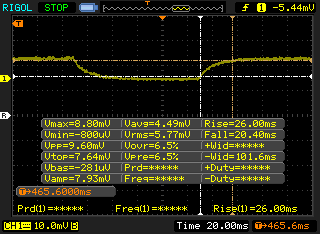 |
| ↘ 20.4 ms ősz | ||
| A képernyő lassú reakciósebességet mutat tesztjeinkben, és nem lesz kielégítő a játékosok számára. Összehasonlításképpen, az összes tesztelt eszköz 0.165 (minimum) és 636 (maximum) ms között mozog. » 80 % of all devices are better. Ez azt jelenti, hogy a mért válaszidő rosszabb, mint az összes vizsgált eszköz átlaga (31.1 ms). | ||
Képernyő villogása / PWM (impulzusszélesség-moduláció)
| Képernyő villogása / PWM nem érzékelhető |  | ||
Összehasonlításképpen: az összes tesztelt eszköz 52 %-a nem használja a PWM-et a kijelző elsötétítésére. Ha PWM-et észleltek, akkor átlagosan 7794 (minimum: 5 - maximum: 343500) Hz-t mértek. | |||
| Cinebench R20 | |
| CPU (Single Core) | |
| MSI Prestige 15 A10SC | |
| Lenovo ThinkPad T490 20RY0002US | |
| Asus ZenBook 15 UX534FT-DB77 | |
| Lenovo Ideapad S340-15IIL | |
| Microsoft Surface Laptop 3 13 Core i5-1035G7 | |
| Átlagos Intel Core i7-1065G7 (358 - 474, n=31) | |
| Lenovo Yoga C740-14IML | |
| MSI GF63 Thin 9SC | |
| Dynabook Portege A30-E-174 | |
| Lenovo Yoga 530-14ARR-81H9000VGE | |
| Dell Inspiron 15 5000 5585 | |
| CPU (Multi Core) | |
| MSI Prestige 15 A10SC | |
| MSI GF63 Thin 9SC | |
| Asus ZenBook 15 UX534FT-DB77 | |
| Microsoft Surface Laptop 3 13 Core i5-1035G7 | |
| Lenovo Ideapad S340-15IIL | |
| Lenovo ThinkPad T490 20RY0002US | |
| Átlagos Intel Core i7-1065G7 (1081 - 2024, n=31) | |
| Lenovo Yoga 530-14ARR-81H9000VGE | |
| Dell Inspiron 15 5000 5585 | |
| Lenovo Yoga C740-14IML | |
| Dynabook Portege A30-E-174 | |
| Cinebench R15 | |
| CPU Single 64Bit | |
| MSI Prestige 15 A10SC | |
| Lenovo ThinkPad T490 20RY0002US | |
| Lenovo Ideapad S340-15IIL | |
| Asus ZenBook 15 UX534FT-DB77 | |
| Átlagos Intel Core i7-1065G7 (141 - 190, n=35) | |
| MSI GF63 Thin 9SC | |
| Microsoft Surface Laptop 3 13 Core i5-1035G7 | |
| Lenovo Yoga C740-14IML | |
| Dynabook Portege A30-E-174 | |
| Lenovo Yoga 530-14ARR-81H9000VGE | |
| Dell Inspiron 15 5000 5585 | |
| CPU Multi 64Bit | |
| MSI Prestige 15 A10SC | |
| MSI GF63 Thin 9SC | |
| Lenovo Ideapad S340-15IIL | |
| Microsoft Surface Laptop 3 13 Core i5-1035G7 | |
| Asus ZenBook 15 UX534FT-DB77 | |
| Lenovo Yoga C740-14IML | |
| Dell Inspiron 15 5000 5585 | |
| Lenovo ThinkPad T490 20RY0002US | |
| Lenovo Yoga 530-14ARR-81H9000VGE | |
| Átlagos Intel Core i7-1065G7 (288 - 836, n=36) | |
| Dynabook Portege A30-E-174 | |
| Cinebench R11.5 | |
| CPU Single 64Bit | |
| Átlagos Intel Core i7-1065G7 (2.09 - 2.17, n=4) | |
| Microsoft Surface Laptop 3 13 Core i5-1035G7 | |
| Dell Inspiron 15 5000 5585 | |
| CPU Multi 64Bit | |
| Microsoft Surface Laptop 3 13 Core i5-1035G7 | |
| Dell Inspiron 15 5000 5585 | |
| Átlagos Intel Core i7-1065G7 (5.69 - 9.37, n=4) | |
| Cinebench R10 | |
| Rendering Multiple CPUs 32Bit | |
| Microsoft Surface Laptop 3 13 Core i5-1035G7 | |
| Átlagos Intel Core i7-1065G7 (16551 - 26481, n=4) | |
| Lenovo Yoga 530-14ARR-81H9000VGE | |
| Dynabook Portege A30-E-174 | |
| Rendering Single 32Bit | |
| Átlagos Intel Core i7-1065G7 (7083 - 7390, n=4) | |
| Microsoft Surface Laptop 3 13 Core i5-1035G7 | |
| Dynabook Portege A30-E-174 | |
| Lenovo Yoga 530-14ARR-81H9000VGE | |
| wPrime 2.10 - 1024m | |
| Átlagos Intel Core i7-1065G7 (233 - 354, n=3) | |
| Microsoft Surface Laptop 3 13 Core i5-1035G7 | |
* ... a kisebb jobb
| PCMark 8 | |
| Home Score Accelerated v2 | |
| Dell XPS 15 7590 i5 iGPU FHD | |
| Asus VivoBook 15 X512FL-EJ205T | |
| Lenovo Ideapad S340-15IIL | |
| Átlagos Intel Core i7-1065G7, Intel Iris Plus Graphics G7 (Ice Lake 64 EU) (3305 - 4275, n=17) | |
| Dell Inspiron 15 5000 5585 | |
| HP Pavilion 15-cw1212ng | |
| Work Score Accelerated v2 | |
| Lenovo Ideapad S340-15IIL | |
| Dell XPS 15 7590 i5 iGPU FHD | |
| Asus VivoBook 15 X512FL-EJ205T | |
| HP Pavilion 15-cw1212ng | |
| Dell Inspiron 15 5000 5585 | |
| Átlagos Intel Core i7-1065G7, Intel Iris Plus Graphics G7 (Ice Lake 64 EU) (2460 - 5291, n=17) | |
| PCMark 8 Home Score Accelerated v2 | 3791 pontok | |
| PCMark 8 Work Score Accelerated v2 | 5291 pontok | |
| PCMark 10 Score | 4679 pontok | |
Segítség | ||
| Lenovo Ideapad S340-15IIL Intel SSD 660p SSDPEKNW512G8 | Dell XPS 15 7590 i5 iGPU FHD Toshiba XG6 KXG60ZNV512G | Dell Inspiron 15 5000 5585 WDC PC SN520 SDAPNUW-512G | Asus VivoBook 15 X512FL-EJ205T Kingston RBUSNS8154P3512GJ | Lenovo Ideapad S540-15IML Samsung SSD PM981a MZVLB512HBJQ | |
|---|---|---|---|---|---|
| AS SSD | 71% | 9% | -31% | 128% | |
| Seq Read (MB/s) | 1447 | 2357 63% | 398.9 -72% | 1348 -7% | 2642 83% |
| Seq Write (MB/s) | 926 | 1235 33% | 884 -5% | 685 -26% | 2433 163% |
| 4K Read (MB/s) | 40.06 | 43.29 8% | 34.54 -14% | 29.15 -27% | 58 45% |
| 4K Write (MB/s) | 97.9 | 99.7 2% | 82.1 -16% | 90.3 -8% | 145.3 48% |
| 4K-64 Read (MB/s) | 323.7 | 1020 215% | 647 100% | 650 101% | 1431 342% |
| 4K-64 Write (MB/s) | 791 | 1502 90% | 985 25% | 514 -35% | 1753 122% |
| Access Time Read * (ms) | 0.06 | 0.07 -17% | 0.072 -20% | 0.31 -417% | 0.072 -20% |
| Access Time Write * (ms) | 0.144 | 0.039 73% | 0.047 67% | 0.044 69% | 0.027 81% |
| Score Read (Points) | 508 | 1299 156% | 721 42% | 814 60% | 1753 245% |
| Score Write (Points) | 982 | 1726 76% | 1155 18% | 673 -31% | 2142 118% |
| Score Total (Points) | 1738 | 3640 109% | 2279 31% | 1876 8% | 4790 176% |
| Copy ISO MB/s (MB/s) | 943 | 2145 127% | 862 -9% | 763 -19% | |
| Copy Program MB/s (MB/s) | 612 | 565 -8% | 457 -25% | 350.3 -43% | |
| Copy Game MB/s (MB/s) | 826 | 1320 60% | 902 9% | 310 -62% | |
| CrystalDiskMark 5.2 / 6 | 35% | -24% | -34% | 44% | |
| Write 4K (MB/s) | 130.8 | 93.6 -28% | 105.9 -19% | 63.6 -51% | 170.7 31% |
| Read 4K (MB/s) | 54.8 | 41.87 -24% | 36.56 -33% | 28.58 -48% | 49.51 -10% |
| Write Seq (MB/s) | 978 | 1698 74% | 1165 19% | 688 -30% | 1156 18% |
| Read Seq (MB/s) | 1627 | 1978 22% | 423.2 -74% | 1032 -37% | 1136 -30% |
| Write 4K Q32T1 (MB/s) | 450.1 | 383.1 -15% | 332.1 -26% | 266.7 -41% | 420.5 -7% |
| Read 4K Q32T1 (MB/s) | 345.9 | 326.9 -5% | 229.3 -34% | 321.5 -7% | 527 52% |
| Write Seq Q32T1 (MB/s) | 982 | 2778 183% | 1460 49% | 606 -38% | 2984 204% |
| Read Seq Q32T1 (MB/s) | 1842 | 3119 69% | 472.5 -74% | 1508 -18% | 3550 93% |
| Write 4K Q8T8 (MB/s) | 410.8 | ||||
| Read 4K Q8T8 (MB/s) | 331.4 | ||||
| Teljes átlag (program / beállítások) | 53% /
57% | -8% /
-3% | -33% /
-32% | 86% /
92% |
* ... a kisebb jobb

| 3DMark 11 | |
| 1280x720 Performance GPU | |
| Acer ConceptD 5 CN515-51-73Z7 | |
| MSI Modern 15 A10RB | |
| Microsoft Surface Laptop 3 15 Ryzen 5 3580U | |
| Microsoft Surface Laptop 3 13 Core i5-1035G7 | |
| Dell Inspiron 15 5000 5585 | |
| Átlagos Intel Iris Plus Graphics G7 (Ice Lake 64 EU) (2112 - 4630, n=28) | |
| Lenovo Ideapad S340-15IIL | |
| Asus ZenBook S13 UX392FN | |
| Walmart Motile M142 | |
| Lenovo ThinkPad T490 20RY0002US | |
| 1280x720 Performance Combined | |
| Acer ConceptD 5 CN515-51-73Z7 | |
| MSI Modern 15 A10RB | |
| Asus ZenBook S13 UX392FN | |
| Microsoft Surface Laptop 3 13 Core i5-1035G7 | |
| Dell Inspiron 15 5000 5585 | |
| Átlagos Intel Iris Plus Graphics G7 (Ice Lake 64 EU) (1319 - 4163, n=28) | |
| Microsoft Surface Laptop 3 15 Ryzen 5 3580U | |
| Lenovo Ideapad S340-15IIL | |
| Lenovo ThinkPad T490 20RY0002US | |
| Walmart Motile M142 | |
| 3DMark 11 Performance | 3762 pontok | |
| 3DMark Ice Storm Standard Score | 65852 pontok | |
| 3DMark Cloud Gate Standard Score | 9962 pontok | |
| 3DMark Fire Strike Score | 2171 pontok | |
| 3DMark Time Spy Score | 701 pontok | |
Segítség | ||
| Rocket League | |
| 1280x720 Performance | |
| MSI Modern 15 A10RB | |
| Huawei MateBook 13 i7 | |
| Dell Inspiron 15 5000 5585 | |
| Átlagos Intel Iris Plus Graphics G7 (Ice Lake 64 EU) (22.1 - 123, n=16) | |
| Microsoft Surface Laptop 3 13 Core i5-1035G7 | |
| Lenovo Yoga C740-14IML | |
| Lenovo Ideapad 720S-13ARR | |
| Lenovo Ideapad S340-15IIL | |
| 1920x1080 Performance | |
| MSI Modern 15 A10RB | |
| Dell Inspiron 15 5000 5585 | |
| Átlagos Intel Iris Plus Graphics G7 (Ice Lake 64 EU) (43.1 - 112.6, n=11) | |
| Microsoft Surface Laptop 3 13 Core i5-1035G7 | |
| Lenovo Yoga C740-14IML | |
| Lenovo Ideapad S340-15IIL | |
| 1920x1080 Quality AA:Medium FX | |
| MSI Modern 15 A10RB | |
| Huawei MateBook 13 i7 | |
| Dell Inspiron 15 5000 5585 | |
| Átlagos Intel Iris Plus Graphics G7 (Ice Lake 64 EU) (24.9 - 71.3, n=16) | |
| Microsoft Surface Laptop 3 13 Core i5-1035G7 | |
| Lenovo Yoga C740-14IML | |
| Lenovo Ideapad S340-15IIL | |
| Lenovo Ideapad 720S-13ARR | |
| The Witcher 3 - 1024x768 Low Graphics & Postprocessing | |
| Huawei MateBook 13 i7 | |
| MSI Modern 15 A10RB | |
| Dell Inspiron 15 5000 5585 | |
| Microsoft Surface Laptop 3 13 Core i5-1035G7 | |
| Átlagos Intel Iris Plus Graphics G7 (Ice Lake 64 EU) (28.2 - 58, n=20) | |
| Lenovo Ideapad S340-15IIL | |
| alacsony | közepes | magas | ultra | |
|---|---|---|---|---|
| BioShock Infinite (2013) | 81.9 | 48.9 | 39.9 | 13.5 |
| The Witcher 3 (2015) | 29.9 | 20.8 | 10.9 | 5.9 |
| Rocket League (2017) | 45.5 | 30 | 21.1 | |
| Shadow of the Tomb Raider (2018) | 19 |
| Lenovo Ideapad S340-15IIL Iris Plus Graphics G7 (Ice Lake 64 EU), i7-1065G7, Intel SSD 660p SSDPEKNW512G8 | Dell XPS 15 7590 i5 iGPU FHD UHD Graphics 630, i5-9300H, Toshiba XG6 KXG60ZNV512G | Dell Inspiron 15 5000 5585 Vega 10, R7 3700U, WDC PC SN520 SDAPNUW-512G | Lenovo Ideapad S540-15IML GeForce MX250, i5-10210U, Samsung SSD PM981a MZVLB512HBJQ | HP Pavilion 15-cs2019ng GeForce MX250, i5-8265U, Toshiba KBG30ZMV256G | Asus VivoBook 15 X542UF-DM143T GeForce MX130, i5-8250U, Micron 1100 MTFDDAV256TBN | |
|---|---|---|---|---|---|---|
| Noise | -4% | -3% | -18% | -17% | -11% | |
| off / környezet * (dB) | 28.5 | 29.3 -3% | 28.3 1% | 30 -5% | 30.5 -7% | 30 -5% |
| Idle Minimum * (dB) | 28.5 | 29.3 -3% | 28.3 1% | 30 -5% | 31.5 -11% | 30.9 -8% |
| Idle Average * (dB) | 28.5 | 29.3 -3% | 28.3 1% | 32 -12% | 31.5 -11% | 30.9 -8% |
| Idle Maximum * (dB) | 28.5 | 29.8 -5% | 28.3 1% | 37 -30% | 31.5 -11% | 30.9 -8% |
| Load Average * (dB) | 30.3 | 32.4 -7% | 31.4 -4% | 41 -35% | 42.5 -40% | 39 -29% |
| Load Maximum * (dB) | 35.5 | 37.2 -5% | 41.4 -17% | 42 -18% | 42.5 -20% | 38 -7% |
| Witcher 3 ultra * (dB) | 41.4 | 39 |
* ... a kisebb jobb
Zajszint
| Üresjárat |
| 28.5 / 28.5 / 28.5 dB(A) |
| Terhelés |
| 30.3 / 35.5 dB(A) |
 | ||
30 dB csendes 40 dB(A) hallható 50 dB(A) hangos |
||
min: | ||
(+) A felső oldalon a maximális hőmérséklet 35 °C / 95 F, összehasonlítva a 36.8 °C / 98 F átlagával , 21 és 71 °C között a Multimedia osztálynál.
(±) Az alsó maximum 44 °C / 111 F-ig melegszik fel, összehasonlítva a 39.1 °C / 102 F átlagával
(+) Üresjáratban a felső oldal átlagos hőmérséklete 24.3 °C / 76 F, összehasonlítva a 31.3 °C / ### eszközátlaggal class_avg_f### F.
(+) A csuklótámasz és az érintőpad hűvösebb, mint a bőr hőmérséklete, maximum 25 °C / 77 F, ezért hűvös tapintású.
(+) A hasonló eszközök csuklótámasz területének átlagos hőmérséklete 28.7 °C / 83.7 F volt (+3.7 °C / 6.7 F).
Lenovo Ideapad S340-15IIL hangelemzés
(+) | a hangszórók viszonylag hangosan tudnak játszani (83.4 dB)
Basszus 100 - 315 Hz
(-) | szinte nincs basszus – átlagosan 21.2%-kal alacsonyabb a mediánnál
(±) | a basszus linearitása átlagos (11.4% delta az előző frekvenciához)
Közepes 400-2000 Hz
(+) | kiegyensúlyozott középpontok – csak 4.8% választja el a mediántól
(±) | a középpontok linearitása átlagos (7% delta az előző gyakorisághoz)
Maximum 2-16 kHz
(+) | kiegyensúlyozott csúcsok – csak 2.5% választja el a mediántól
(+) | a csúcsok lineárisak (4% delta az előző frekvenciához képest)
Összességében 100 - 16.000 Hz
(±) | az általános hang linearitása átlagos (22% eltérés a mediánhoz képest)
Ugyanazon osztályhoz képest
» 78%Ebben az osztályban az összes tesztelt eszköz %-a jobb volt, 4% hasonló, 18%-kal rosszabb
» A legjobb delta értéke 5%, az átlag 17%, a legrosszabb 45% volt
Az összes tesztelt eszközzel összehasonlítva
» 63% az összes tesztelt eszköz jobb volt, 6% hasonló, 30%-kal rosszabb
» A legjobb delta értéke 4%, az átlag 24%, a legrosszabb 134% volt
Apple MacBook 12 (Early 2016) 1.1 GHz hangelemzés
(+) | a hangszórók viszonylag hangosan tudnak játszani (83.6 dB)
Basszus 100 - 315 Hz
(±) | csökkentett basszus – átlagosan 11.3%-kal alacsonyabb, mint a medián
(±) | a basszus linearitása átlagos (14.2% delta az előző frekvenciához)
Közepes 400-2000 Hz
(+) | kiegyensúlyozott középpontok – csak 2.4% választja el a mediántól
(+) | a középpontok lineárisak (5.5% delta az előző frekvenciához)
Maximum 2-16 kHz
(+) | kiegyensúlyozott csúcsok – csak 2% választja el a mediántól
(+) | a csúcsok lineárisak (4.5% delta az előző frekvenciához képest)
Összességében 100 - 16.000 Hz
(+) | általános hangzás lineáris (10.2% eltérés a mediánhoz képest)
Ugyanazon osztályhoz képest
» 7%Ebben az osztályban az összes tesztelt eszköz %-a jobb volt, 2% hasonló, 91%-kal rosszabb
» A legjobb delta értéke 5%, az átlag 18%, a legrosszabb 53% volt
Az összes tesztelt eszközzel összehasonlítva
» 5% az összes tesztelt eszköz jobb volt, 1% hasonló, 94%-kal rosszabb
» A legjobb delta értéke 4%, az átlag 24%, a legrosszabb 134% volt
| Kikapcsolt állapot / Készenlét | |
| Üresjárat | |
| Terhelés |
|
Kulcs:
min: | |
| Lenovo Ideapad S340-15IIL i7-1065G7, Iris Plus Graphics G7 (Ice Lake 64 EU), Intel SSD 660p SSDPEKNW512G8, IPS, 1920x1080, 15.6" | Dell XPS 15 7590 i5 iGPU FHD i5-9300H, UHD Graphics 630, Toshiba XG6 KXG60ZNV512G, IPS, 1920x1080, 15.6" | Dell Inspiron 15 5000 5585 R7 3700U, Vega 10, WDC PC SN520 SDAPNUW-512G, IPS, 1920x1080, 15.6" | Lenovo Ideapad S540-15IML i5-10210U, GeForce MX250, Samsung SSD PM981a MZVLB512HBJQ, IPS, 1920x1080, 15.6" | HP Pavilion 15-cs2019ng i5-8265U, GeForce MX250, Toshiba KBG30ZMV256G, IPS, 1920x1080, 15.6" | Asus VivoBook 15 X542UF-DM143T i5-8250U, GeForce MX130, Micron 1100 MTFDDAV256TBN, TN LED, 1920x1080, 15.6" | |
|---|---|---|---|---|---|---|
| Power Consumption | -38% | 5% | -27% | -19% | -15% | |
| Idle Minimum * (Watt) | 3.8 | 3.79 -0% | 4.2 -11% | 5 -32% | 4.9 -29% | 4.75 -25% |
| Idle Average * (Watt) | 6.9 | 6.9 -0% | 6.8 1% | 7 -1% | 7.9 -14% | 6.9 -0% |
| Idle Maximum * (Watt) | 7.7 | 9.2 -19% | 7 9% | 10 -30% | 10.1 -31% | 7 9% |
| Load Average * (Watt) | 43.3 | 62 -43% | 36.5 16% | 64 -48% | 60 -39% | 53 -22% |
| Witcher 3 ultra * (Watt) | 40.4 | 37.9 6% | 44 -9% | |||
| Load Maximum * (Watt) | 47.5 | 108 -127% | 44 7% | 67 -41% | 38 20% | 65.3 -37% |
* ... a kisebb jobb
| Lenovo Ideapad S340-15IIL i7-1065G7, Iris Plus Graphics G7 (Ice Lake 64 EU), 36 Wh | Dell XPS 15 7590 i5 iGPU FHD i5-9300H, UHD Graphics 630, 97 Wh | Dell Inspiron 15 5000 5585 R7 3700U, Vega 10, 42 Wh | Lenovo Ideapad S540-15IML i5-10210U, GeForce MX250, 70 Wh | HP Pavilion 15-cs2019ng i5-8265U, GeForce MX250, 41 Wh | Asus VivoBook 15 X542UF-DM143T i5-8250U, GeForce MX130, 38 Wh | |
|---|---|---|---|---|---|---|
| Akkumulátor üzemidő | 142% | 44% | 137% | 5% | 58% | |
| Reader / Idle (h) | 10 | 14.3 43% | 30.2 202% | 8 -20% | ||
| WiFi v1.3 (h) | 4.3 | 14.1 228% | 7 63% | 12.1 181% | 5 16% | 6.8 58% |
| Load (h) | 1.1 | 1.7 55% | 1.4 27% | 1.4 27% | 1.3 18% |
Pro
Kontra
Néhány hete azt írtuk a Lenovo IdeaPad S340-15-ről, hogy az egyik legolcsóbb laptop, amely az új, 10. generációs Core i7-1065G7 CPU-val van felszerelve. Ugyanez a processzor található meg a jóval drágább alternatívákban, mint a Dell XPS 13 2-in-1 vagy a Razer Blade Stealth, amelyek akár kétszer olyan drágák is lehetnek, mint ez a Lenovo. Bár papíron jól mutat a Lenovo-nál, de a valóság az, hogy az IdeaPad S340-15 CPU teljesítménye átlag alatti, az említett alternatívákhoz képest, főként ha játékokról van szó, vagy egyéb, igényesebb terhelésekről. Aki a legjobbat szeretné az Ice Lake-től, annak körül kell néznie, túl az IdeaPad sorozaton.
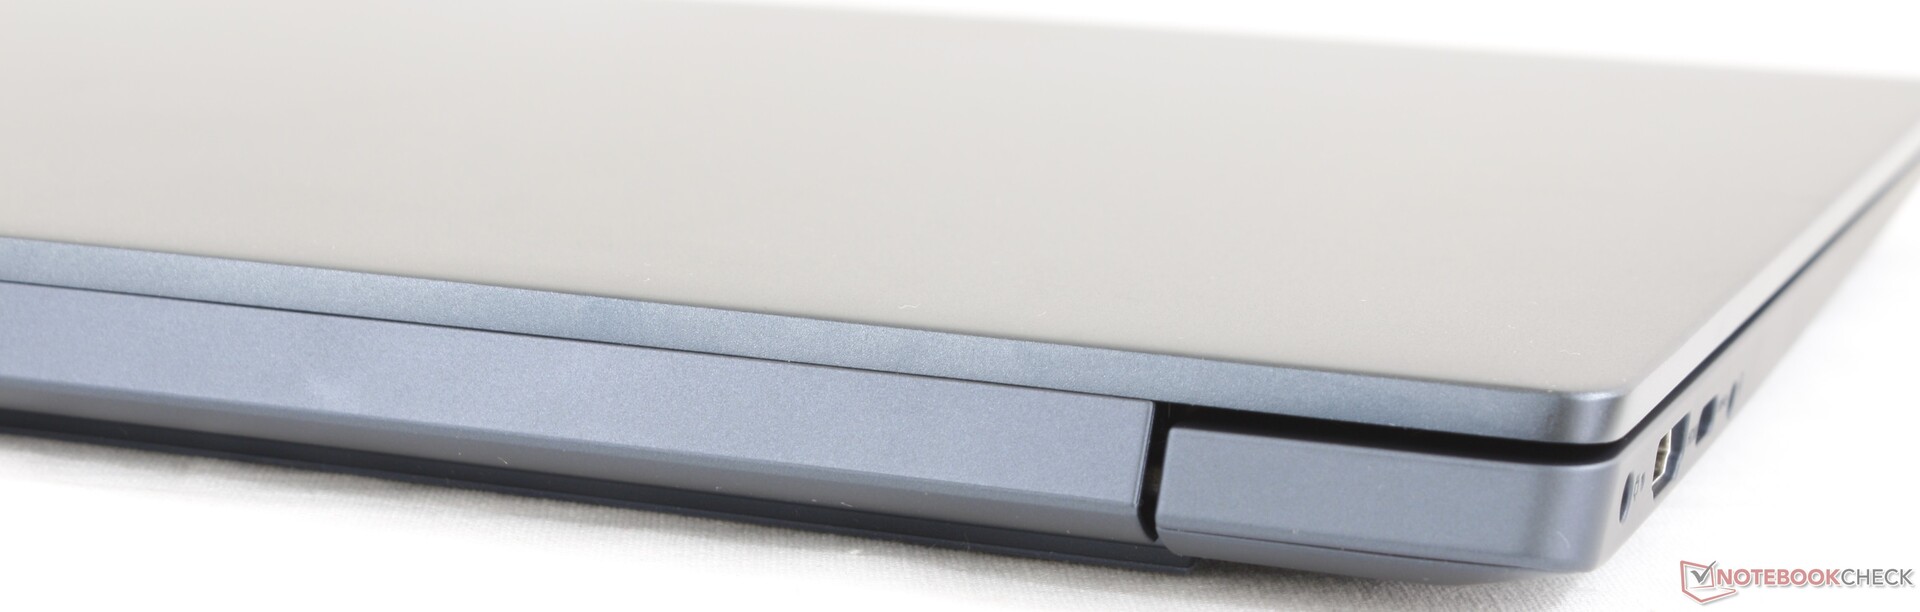
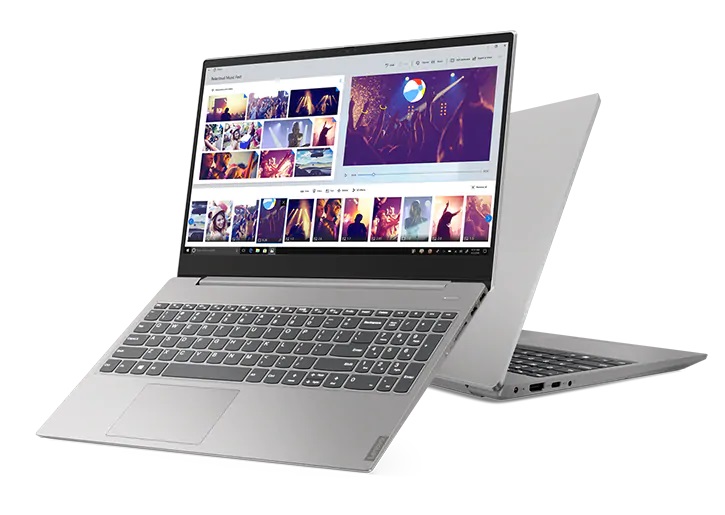
Ami magát a laptopot illeti, az modernebb és vizuálisan vonzóbb, mint a versenytárs Dell Inspiron, az Asus VivoBook vagy a HP Pavilion sorozat. A matt érintőképernyő és a hozzáférhető kettős tárolóhely szintén kellemes meglepetés, mivel ezek a jellemzők nem gyakoriak az olcsóbb laptopokban. Máskülönben, a rendszerben szinte minden más elégséges vagy elfogadható. A szűk színtér, a könnyű billentyűk és a középszerű akkumulátor mind az árkategóriájához mérhetőek. Ajánljuk az olcsóbb Core i5 vagy Core i7 Whiskey Lake-U SKU-kat választását, mivel az Ice Lake, nagyon kevés extrát kínál az IdeaPad S340 esetében.
A Lenovo IdeaPad S340-15 az otthoni multimédiás felhasználásra a legalkalmasabb, és az alkalmi utazásra is, mivel könnyű. Ne várjunk jó Core i7 teljesítményt, mikor nagyobb terhelésnek tesszük ki, mint pl. játszás esetén.
Lenovo Ideapad S340-15IIL
- 03/14/2020 v7 (old)
Allen Ngo
Price comparison

