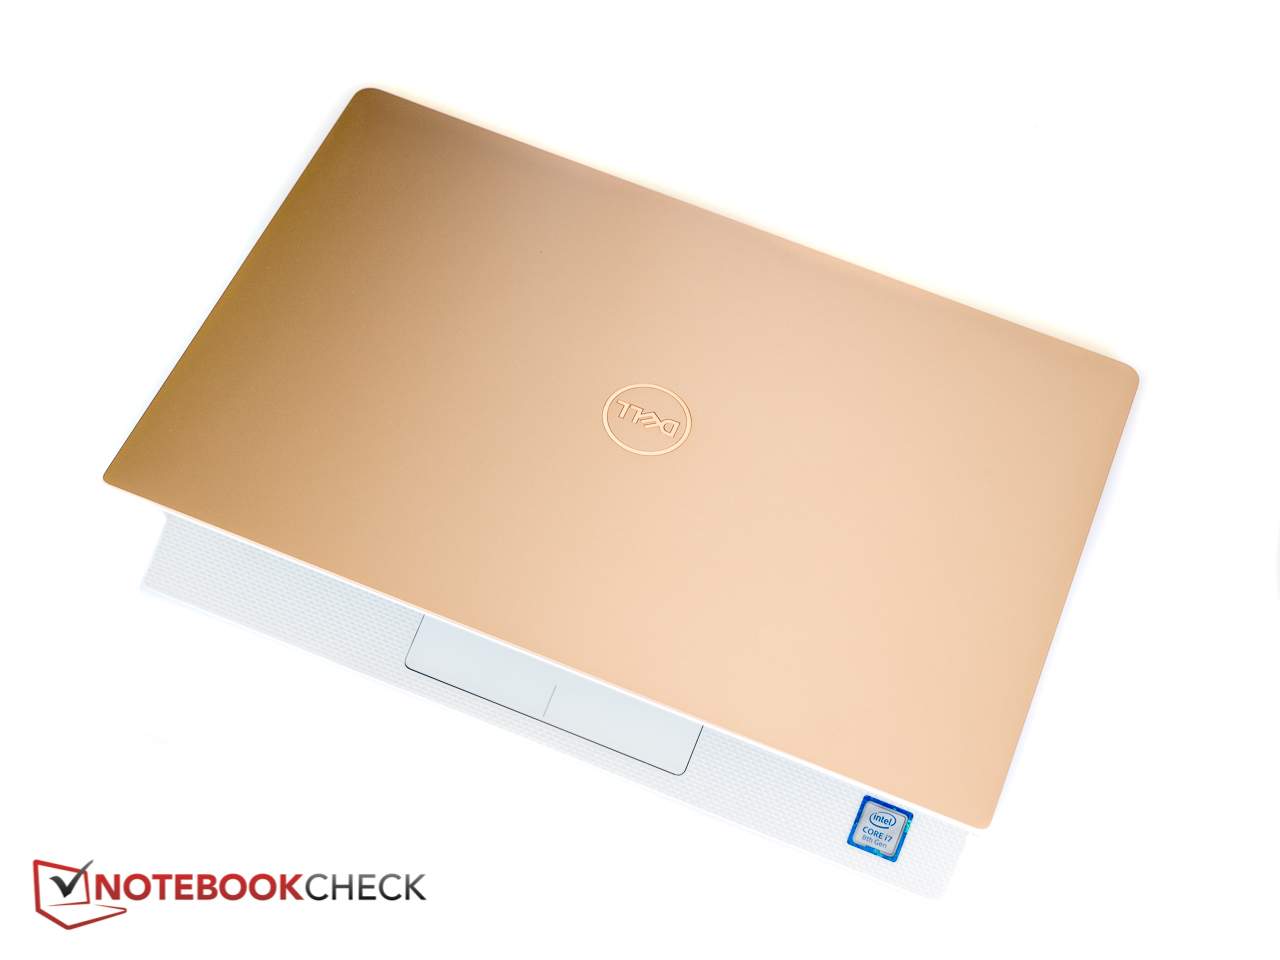
Dell XPS 13 9370 (i7-8550U, 4K UHD) Laptop rövid értékelés
| SD Card Reader | |
| average JPG Copy Test (av. of 3 runs) | |
| Lenovo ThinkPad X1 Carbon 2018-20KGS03900 (Toshiba Exceria Pro M501) | |
| Dell XPS 13 9370 i5 UHD (Toshiba Exceria Pro M501 64 GB UHS-II) | |
| Dell XPS 13 9370 i7 UHD (Toshiba Exceria Pro UHS-II) | |
| Lenovo IdeaPad 320S-13IKB (Toshiba Exceria Pro M501) | |
| Az osztály átlaga Subnotebook (23.7 - 188, n=9, az elmúlt 2 évben) | |
| Asus ZenBook 13 UX331UN (Toshiba Exceria Pro M501 microSDXC 64GB) | |
| maximum AS SSD Seq Read Test (1GB) | |
| Lenovo ThinkPad X1 Carbon 2018-20KGS03900 (Toshiba Exceria Pro M501) | |
| Dell XPS 13 9370 i5 UHD (Toshiba Exceria Pro M501 64 GB UHS-II) | |
| Dell XPS 13 9370 i7 UHD (Toshiba Exceria Pro UHS-II) | |
| Az osztály átlaga Subnotebook (24.9 - 195, n=8, az elmúlt 2 évben) | |
| Lenovo IdeaPad 320S-13IKB (Toshiba Exceria Pro M501) | |
| Asus ZenBook 13 UX331UN (Toshiba Exceria Pro M501 microSDXC 64GB) | |
| |||||||||||||||||||||||||
Fényerő megoszlás: 86 %
Centrumban: 478.5 cd/m²
Kontraszt: 1113:1 (Fekete: 0.43 cd/m²)
ΔE ColorChecker Calman: 3.09 | ∀{0.5-29.43 Ø4.71}
calibrated: 2.06
ΔE Greyscale Calman: 2.4 | ∀{0.09-98 Ø4.96}
98.36% sRGB (Argyll 1.6.3 3D)
69.47% AdobeRGB 1998 (Argyll 1.6.3 3D)
69.5% AdobeRGB 1998 (Argyll 3D)
98.4% sRGB (Argyll 3D)
68.9% Display P3 (Argyll 3D)
Gamma: 2.063
CCT: 6883 K
| Dell XPS 13 9370 i7 UHD ID: Sharp SHP148B, Name: LQ133D1, Dell P/N: 8XDHY, IPS, 13.3", 3840x2160 | Dell XPS 13 9370 i5 UHD ID: Sharp SHP148B, Name: LQ133D1, Dell P/N: 8XDHY, IPS, 13.3", 3840x2160 | Asus ZenBook 13 UX331UN AU Optronics B133HAN04.9, IPS, 13.3", 1920x1080 | Lenovo IdeaPad 320S-13IKB InfoVision M133NWF4R0, IPS LED, 13.3", 1920x1080 | Lenovo ThinkPad X1 Carbon 2018-20KGS03900 B140QAN02.0, IPS, 14", 2560x1440 | Samsung Notebook 9 NP900X3N-K01US ID: BOE06E1, Name: NV133FHB-N31, IPS, 13.3", 1920x1080 | |
|---|---|---|---|---|---|---|
| Display | 0% | -10% | -2% | 24% | -9% | |
| Display P3 Coverage (%) | 68.9 | 68.9 0% | 63.3 -8% | 66.3 -4% | 87.7 27% | 63.4 -8% |
| sRGB Coverage (%) | 98.4 | 98.4 0% | 86.7 -12% | 97.4 -1% | 100 2% | 88.6 -10% |
| AdobeRGB 1998 Coverage (%) | 69.5 | 69.5 0% | 63.4 -9% | 68.1 -2% | 99.9 44% | 64 -8% |
| Response Times | 4% | 41% | 23% | 19% | 32% | |
| Response Time Grey 50% / Grey 80% * (ms) | 69.6 ? | 67.2 ? 3% | 44 ? 37% | 56.8 ? 18% | 59.2 ? 15% | 41.6 ? 40% |
| Response Time Black / White * (ms) | 44 ? | 41.6 ? 5% | 24 ? 45% | 31.6 ? 28% | 34.4 ? 22% | 34 ? 23% |
| PWM Frequency (Hz) | 3759 ? | 2500 ? | 198.4 ? | 210.1 ? | ||
| Screen | -8% | -13% | 5% | 20% | -10% | |
| Brightness middle (cd/m²) | 478.5 | 496.4 4% | 329 -31% | 330 -31% | 578 21% | 510.7 7% |
| Brightness (cd/m²) | 466 | 469 1% | 306 -34% | 304 -35% | 533 14% | 481 3% |
| Brightness Distribution (%) | 86 | 84 -2% | 86 0% | 88 2% | 84 -2% | 90 5% |
| Black Level * (cd/m²) | 0.43 | 0.5 -16% | 0.3 30% | 0.25 42% | 0.38 12% | 0.66 -53% |
| Contrast (:1) | 1113 | 993 -11% | 1097 -1% | 1320 19% | 1521 37% | 774 -30% |
| Colorchecker dE 2000 * | 3.09 | 2.9 6% | 4.07 -32% | 1.8 42% | 1.9 39% | 2.4 22% |
| Colorchecker dE 2000 max. * | 5.94 | 5.26 11% | 7.05 -19% | 4.3 28% | 3.8 36% | 7.3 -23% |
| Colorchecker dE 2000 calibrated * | 2.06 | 0.8 61% | ||||
| Greyscale dE 2000 * | 2.4 | 3.9 -63% | 2.76 -15% | 2.5 -4% | 3 -25% | 2.4 -0% |
| Gamma | 2.063 107% | 2.066 106% | 2.56 86% | 2.11 104% | 2.14 103% | 2.23 99% |
| CCT | 6883 94% | 7169 91% | 6915 94% | 6588 99% | 6377 102% | 6747 96% |
| Color Space (Percent of AdobeRGB 1998) (%) | 69.47 | 63.9 -8% | 56 -19% | 61.8 -11% | 88.8 28% | 57 -18% |
| Color Space (Percent of sRGB) (%) | 98.36 | 98.2 0% | 86 -13% | 97.3 -1% | 100 2% | 88.1 -10% |
| Teljes átlag (program / beállítások) | -1% /
-5% | 6% /
-5% | 9% /
6% | 21% /
21% | 4% /
-4% |
* ... a kisebb jobb
Megjelenítési válaszidők
| ↔ Válaszidő Fekete-fehér | ||
|---|---|---|
| 44 ms ... emelkedés és süllyedés ↘ kombinálva | ↗ 24.4 ms emelkedés | 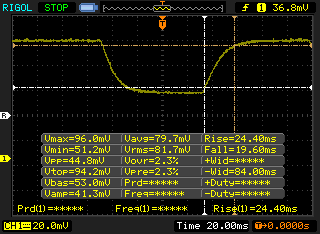 |
| ↘ 19.6 ms ősz | ||
| A képernyő lassú reakciósebességet mutat tesztjeinkben, és nem lesz kielégítő a játékosok számára. Összehasonlításképpen, az összes tesztelt eszköz 0.1 (minimum) és 240 (maximum) ms között mozog. » 98 % of all devices are better. Ez azt jelenti, hogy a mért válaszidő rosszabb, mint az összes vizsgált eszköz átlaga (19.8 ms). | ||
| ↔ Válaszidő 50% szürke és 80% szürke között | ||
| 69.6 ms ... emelkedés és süllyedés ↘ kombinálva | ↗ 32.4 ms emelkedés | 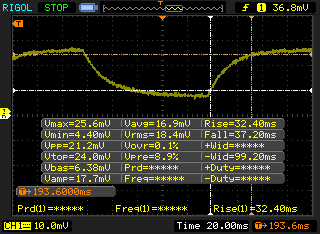 |
| ↘ 37.2 ms ősz | ||
| A képernyő lassú reakciósebességet mutat tesztjeinkben, és nem lesz kielégítő a játékosok számára. Összehasonlításképpen, az összes tesztelt eszköz 0.165 (minimum) és 636 (maximum) ms között mozog. » 99 % of all devices are better. Ez azt jelenti, hogy a mért válaszidő rosszabb, mint az összes vizsgált eszköz átlaga (31 ms). | ||
Képernyő villogása / PWM (impulzusszélesség-moduláció)
| Képernyő villogása / PWM észlelve | 3759 Hz | ≤ 20 % fényerő beállítása | 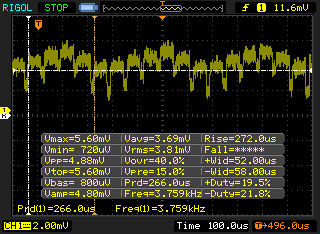 |
A kijelző háttérvilágítása 3759 Hz-en villog (a legrosszabb esetben, pl. PWM használatával) Villódzás észlelve a 20 % vagy annál kisebb fényerő-beállításnál. E fényerő-beállítás felett nem lehet villogás vagy PWM. A 3759 Hz frekvenciája meglehetősen magas, így a legtöbb PWM-re érzékeny felhasználó nem észlel semmilyen villogást. Összehasonlításképpen: az összes tesztelt eszköz 52 %-a nem használja a PWM-et a kijelző elsötétítésére. Ha PWM-et észleltek, akkor átlagosan 7754 (minimum: 5 - maximum: 343500) Hz-t mértek. | |||
XPS 13 9370 i7-8550U
XPS 13 9360 i7-8550U
XPS 13 9370 i5-8250U
* ... a kisebb jobb
| PCMark 8 Home Score Accelerated v2 | 3371 pontok | |
| PCMark 8 Creative Score Accelerated v2 | 4865 pontok | |
| PCMark 8 Work Score Accelerated v2 | 4125 pontok | |
| PCMark 10 Score | 3728 pontok | |
Segítség | ||
| Dell XPS 13 9370 i7 UHD Toshiba XG5 KXG50ZNV512G | Dell XPS 13 9370 i5 UHD Toshiba XG5 KXG50ZNV256G | Asus ZenBook 13 UX331UN SK Hynix HFS256G39TND-N210A | Lenovo ThinkPad X1 Carbon 2018-20KGS03900 Samsung SSD PM981 MZVLB512HAJQ | HP Spectre 13-af033ng Samsung PM961 NVMe MZVLW512HMJP | |
|---|---|---|---|---|---|
| AS SSD | 16% | -71% | 88% | -310% | |
| Copy Game MB/s (MB/s) | 503 | 291.4 -42% | 154.1 -69% | 1107 120% | 381.2 -24% |
| Copy Program MB/s (MB/s) | 570 | 207 -64% | 129.7 -77% | 460.2 -19% | 337.8 -41% |
| Copy ISO MB/s (MB/s) | 585 | 357.4 -39% | 192.4 -67% | 1247 113% | 695 19% |
| Score Total (Points) | 1911 | 2437 28% | 991 -48% | 3529 85% | 1879 -2% |
| Score Write (Points) | 596 | 1135 90% | 323 -46% | 1801 202% | 105 -82% |
| Score Read (Points) | 926 | 894 -3% | 445 -52% | 1168 26% | 1201 30% |
| Access Time Write * (ms) | 0.055 | 0.038 31% | 0.23 -318% | 0.027 51% | 2.294 -4071% |
| Access Time Read * (ms) | 0.059 | 0.063 -7% | 0.09 -53% | 0.029 51% | 0.073 -24% |
| 4K-64 Write (MB/s) | 444.8 | 937 111% | 233.1 -48% | 1529 244% | 69.7 -84% |
| 4K-64 Read (MB/s) | 678 | 657 -3% | 368.4 -46% | 876 29% | 1020 50% |
| 4K Write (MB/s) | 107.4 | 107.2 0% | 68.9 -36% | 134.3 25% | 1.07 -99% |
| 4K Read (MB/s) | 29.36 | 33.81 15% | 27.98 -5% | 52.4 78% | 45.86 56% |
| Seq Write (MB/s) | 435.8 | 907 108% | 213.7 -51% | 1376 216% | 337.5 -23% |
| Seq Read (MB/s) | 2205 | 2037 -8% | 483.7 -78% | 2396 9% | 1351 -39% |
* ... a kisebb jobb

| 3DMark 11 Performance | 2117 pontok | |
| 3DMark Ice Storm Standard Score | 71022 pontok | |
| 3DMark Cloud Gate Standard Score | 8813 pontok | |
| 3DMark Fire Strike Score | 1182 pontok | |
Segítség | ||
| alacsony | közepes | magas | ultra | |
|---|---|---|---|---|
| BioShock Infinite (2013) | 71.2 | 34.6 | 30.2 | 10 |
| Rise of the Tomb Raider (2016) | 22 | 12.2 |
Zajszint
| Üresjárat |
| 28 / 28 / 28 dB(A) |
| Terhelés |
| 32.5 / 42.2 dB(A) |
 | ||
30 dB csendes 40 dB(A) hallható 50 dB(A) hangos |
||
min: | ||
| Dell XPS 13 9370 i7 UHD UHD Graphics 620, i5-8550U, Toshiba XG5 KXG50ZNV512G | Dell XPS 13 9370 i5 UHD UHD Graphics 620, i5-8250U, Toshiba XG5 KXG50ZNV256G | Asus ZenBook 13 UX331UN GeForce MX150, i5-8550U, SK Hynix HFS256G39TND-N210A | Lenovo IdeaPad 320S-13IKB GeForce MX150, i5-8250U, Samsung PM961 NVMe MZVLW512HMJP | Lenovo ThinkPad X1 Carbon 2018-20KGS03900 UHD Graphics 620, i5-8550U, Samsung SSD PM981 MZVLB512HAJQ | Samsung Notebook 9 NP900X3N-K01US HD Graphics 620, i5-7200U, Samsung CM871a MZNTY256HDHP | HP Spectre 13-af033ng UHD Graphics 620, i5-8550U, Samsung PM961 NVMe MZVLW512HMJP | |
|---|---|---|---|---|---|---|---|
| Noise | -2% | -8% | -3% | -3% | 2% | -1% | |
| off / környezet * (dB) | 28 | 29 -4% | 30.13 -8% | 29.4 -5% | 28.9 -3% | 28.4 -1% | 30.13 -8% |
| Idle Minimum * (dB) | 28 | 29 -4% | 30.13 -8% | 30 -7% | 28.9 -3% | 28.4 -1% | 30.13 -8% |
| Idle Average * (dB) | 28 | 29 -4% | 30.3 -8% | 30 -7% | 28.9 -3% | 28.4 -1% | 30.13 -8% |
| Idle Maximum * (dB) | 28 | 29 -4% | 30.3 -8% | 30 -7% | 32.5 -16% | 28.4 -1% | 30.13 -8% |
| Load Average * (dB) | 32.5 | 32 2% | 39.2 -21% | 32.2 1% | 35.1 -8% | 33.2 -2% | 31.5 3% |
| Load Maximum * (dB) | 42.2 | 40.1 5% | 41 3% | 38.8 8% | 35.1 17% | 35.2 17% | 33.5 21% |
| Witcher 3 ultra * (dB) | 35.2 |
* ... a kisebb jobb
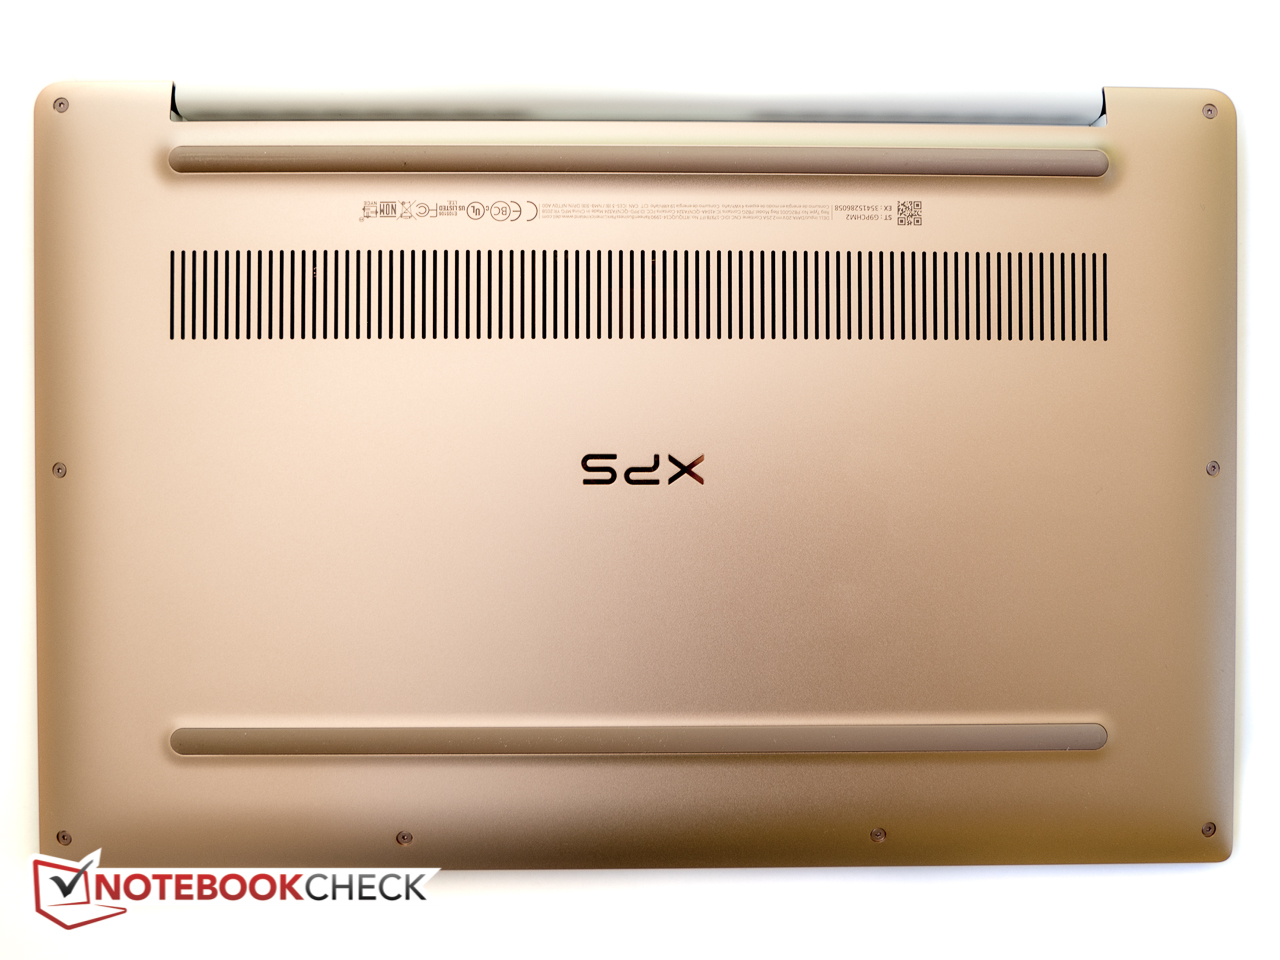
(-) A felső oldalon a maximális hőmérséklet 45.2 °C / 113 F, összehasonlítva a 35.9 °C / 97 F átlagával , 21.4 és 59 °C között a Subnotebook osztálynál.
(-) Az alsó maximum 47.4 °C / 117 F-ig melegszik fel, összehasonlítva a 39.2 °C / 103 F átlagával
(+) Üresjáratban a felső oldal átlagos hőmérséklete 25.4 °C / 78 F, összehasonlítva a 30.8 °C / ### eszközátlaggal class_avg_f### F.
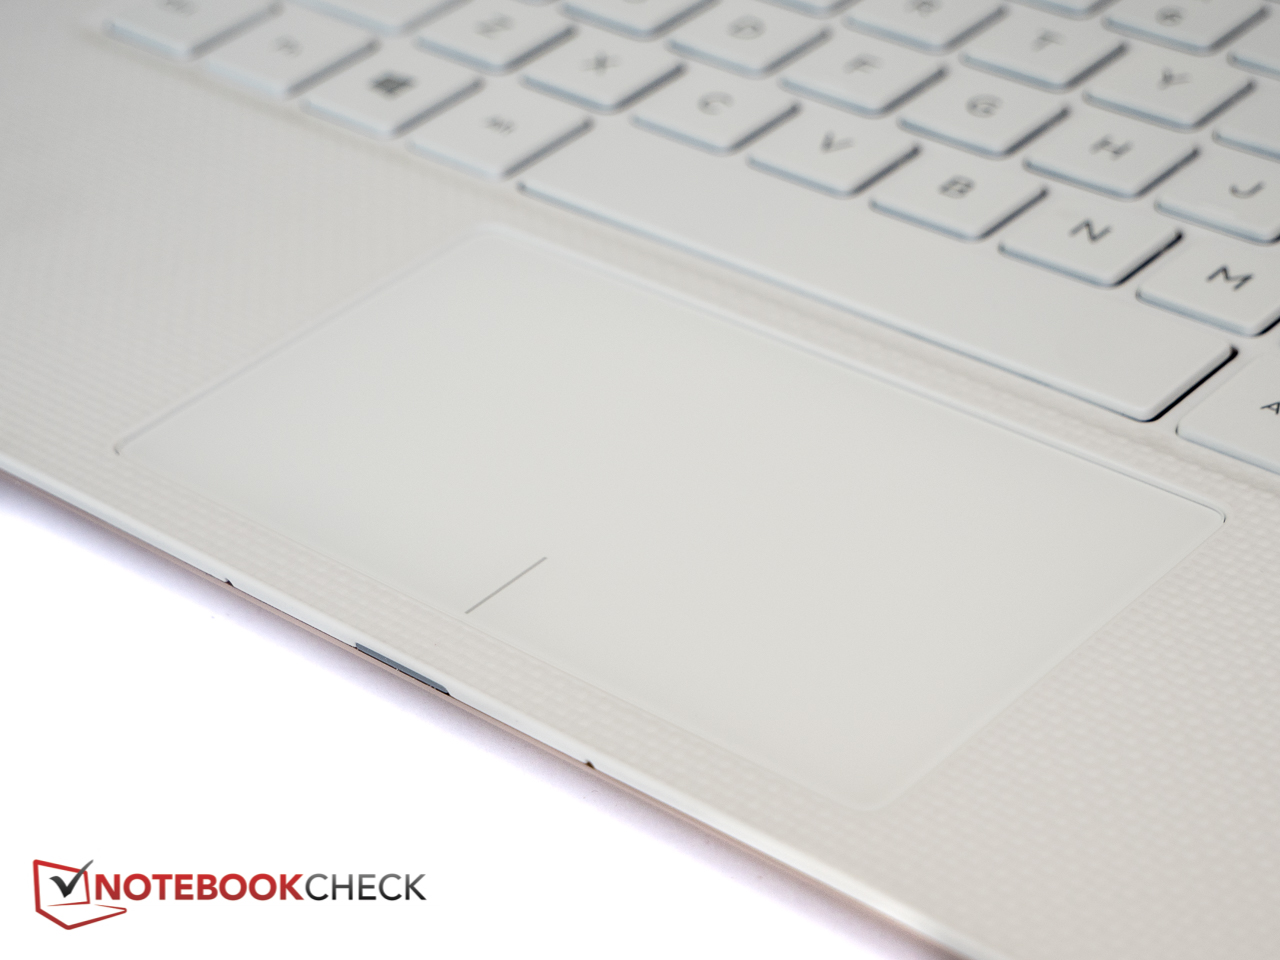
(+) A csuklótámasz és az érintőpad hűvösebb, mint a bőr hőmérséklete, maximum 28 °C / 82.4 F, ezért hűvös tapintású.
(±) A hasonló eszközök csuklótámasz területének átlagos hőmérséklete 28.2 °C / 82.8 F volt (+0.2 °C / 0.4 F).
Dell XPS 13 9370 i7 UHD hangelemzés
(±) | a hangszóró hangereje átlagos, de jó (72.6 dB)
Basszus 100 - 315 Hz
(-) | szinte nincs basszus – átlagosan 15.3%-kal alacsonyabb a mediánnál
(±) | a basszus linearitása átlagos (11.5% delta az előző frekvenciához)
Közepes 400-2000 Hz
(+) | kiegyensúlyozott középpontok – csak 4.5% választja el a mediántól
(+) | a középpontok lineárisak (4.9% delta az előző frekvenciához)
Maximum 2-16 kHz
(+) | kiegyensúlyozott csúcsok – csak 2.6% választja el a mediántól
(±) | a csúcsok linearitása átlagos (7.1% delta az előző gyakorisághoz)
Összességében 100 - 16.000 Hz
(±) | az általános hang linearitása átlagos (18.9% eltérés a mediánhoz képest)
Ugyanazon osztályhoz képest
» 57%Ebben az osztályban az összes tesztelt eszköz %-a jobb volt, 6% hasonló, 36%-kal rosszabb
» A legjobb delta értéke 5%, az átlag 18%, a legrosszabb 53% volt
Az összes tesztelt eszközzel összehasonlítva
» 44% az összes tesztelt eszköz jobb volt, 8% hasonló, 48%-kal rosszabb
» A legjobb delta értéke 4%, az átlag 23%, a legrosszabb 134% volt
Apple MacBook 12 (Early 2016) 1.1 GHz hangelemzés
(+) | a hangszórók viszonylag hangosan tudnak játszani (83.6 dB)
Basszus 100 - 315 Hz
(±) | csökkentett basszus – átlagosan 11.3%-kal alacsonyabb, mint a medián
(±) | a basszus linearitása átlagos (14.2% delta az előző frekvenciához)
Közepes 400-2000 Hz
(+) | kiegyensúlyozott középpontok – csak 2.4% választja el a mediántól
(+) | a középpontok lineárisak (5.5% delta az előző frekvenciához)
Maximum 2-16 kHz
(+) | kiegyensúlyozott csúcsok – csak 2% választja el a mediántól
(+) | a csúcsok lineárisak (4.5% delta az előző frekvenciához képest)
Összességében 100 - 16.000 Hz
(+) | általános hangzás lineáris (10.2% eltérés a mediánhoz képest)
Ugyanazon osztályhoz képest
» 7%Ebben az osztályban az összes tesztelt eszköz %-a jobb volt, 2% hasonló, 90%-kal rosszabb
» A legjobb delta értéke 5%, az átlag 18%, a legrosszabb 53% volt
Az összes tesztelt eszközzel összehasonlítva
» 5% az összes tesztelt eszköz jobb volt, 1% hasonló, 94%-kal rosszabb
» A legjobb delta értéke 4%, az átlag 23%, a legrosszabb 134% volt
| Kikapcsolt állapot / Készenlét | |
| Üresjárat | |
| Terhelés |
|
Kulcs:
min: | |
| Dell XPS 13 9370 i7 UHD i5-8550U, UHD Graphics 620, Toshiba XG5 KXG50ZNV512G, IPS, 3840x2160, 13.3" | Dell XPS 13 9370 i5 UHD i5-8250U, UHD Graphics 620, Toshiba XG5 KXG50ZNV256G, IPS, 3840x2160, 13.3" | Asus ZenBook 13 UX331UN i5-8550U, GeForce MX150, SK Hynix HFS256G39TND-N210A, IPS, 1920x1080, 13.3" | Lenovo IdeaPad 320S-13IKB i5-8250U, GeForce MX150, Samsung PM961 NVMe MZVLW512HMJP, IPS LED, 1920x1080, 13.3" | Lenovo ThinkPad X1 Carbon 2018-20KGS03900 i5-8550U, UHD Graphics 620, Samsung SSD PM981 MZVLB512HAJQ, IPS, 2560x1440, 14" | Xiaomi Mi Notebook Air 13.3 2018 i5-8250U, GeForce MX150, Samsung PM961 MZVLW256HEHP, IPS, 1920x1080, 13.3" | HP Spectre 13-af033ng i5-8550U, UHD Graphics 620, Samsung PM961 NVMe MZVLW512HMJP, IPS, 1920x1080, 13.3" | |
|---|---|---|---|---|---|---|---|
| Power Consumption | 5% | 26% | 10% | -6% | 9% | 24% | |
| Idle Minimum * (Watt) | 5 | 4.3 14% | 2.2 56% | 3.4 32% | 3.8 24% | 3.9 22% | 2.8 44% |
| Idle Average * (Watt) | 8.3 | 8 4% | 5 40% | 6.1 27% | 8.9 -7% | 7 16% | 6.2 25% |
| Idle Maximum * (Watt) | 8.8 | 8.1 8% | 8 9% | 7.7 12% | 11.9 -35% | 7.5 15% | 9.4 -7% |
| Load Average * (Watt) | 46.4 | 46.6 -0% | 33 29% | 44.2 5% | 47.5 -2% | 44.4 4% | 32.2 31% |
| Load Maximum * (Watt) | 48.6 | 49.8 -2% | 49.4 -2% | 60.3 -24% | 52.5 -8% | 55.1 -13% | 36.6 25% |
| Witcher 3 ultra * (Watt) | 37.6 | 32.8 |
* ... a kisebb jobb
| Dell XPS 13 9370 i7 UHD i5-8550U, UHD Graphics 620, 52 Wh | Dell XPS 13 9370 i5 UHD i5-8250U, UHD Graphics 620, 52 Wh | Asus ZenBook 13 UX331UN i5-8550U, GeForce MX150, 50 Wh | Lenovo IdeaPad 320S-13IKB i5-8250U, GeForce MX150, 36 Wh | Lenovo ThinkPad X1 Carbon 2018-20KGS03900 i5-8550U, UHD Graphics 620, 57 Wh | Samsung Notebook 9 NP900X3N-K01US i5-7200U, HD Graphics 620, 30 Wh | HP Spectre 13-af033ng i5-8550U, UHD Graphics 620, 43 Wh | Xiaomi Mi Notebook Air 13.3 2018 i5-8250U, GeForce MX150, 39 Wh | |
|---|---|---|---|---|---|---|---|---|
| Akkumulátor üzemidő | -2% | 22% | -23% | 24% | -33% | -15% | -18% | |
| Reader / Idle (h) | 13.7 | 14.5 6% | 20.7 51% | 12.3 -10% | 22.1 61% | 11.6 -15% | 13 -5% | |
| WiFi v1.3 (h) | 7.8 | 6.8 -13% | 9 15% | 5.7 -27% | 8.7 12% | 4.7 -40% | 5.9 -24% | 6.1 -22% |
| Load (h) | 1.8 | 1.8 0% | 1.8 0% | 1.2 -33% | 1.8 0% | 1 -44% | 1.7 -6% | 1.3 -28% |
| Witcher 3 ultra (h) | 1.4 |
Pro
Kontra
Szóval, az i7-es processzorral felszerelt XPS 13 9370 jobb választás, mint olcsóbb, i5 CPU-s testvére? Jelenleg a válaszunk egyértelműen: nem. Az üzemidőt leszámítva - amelyben meglepő módon megveri az i5 UHD modellt - a most tesztelt XPS 13 némileg kiábrándítóan teljesített. Azt nem mondanánk, hogy az i7-8550U itt rosszabbul teljesít, mint más notebookokban, de az tény, hogy az i7-alapú XPS 13 9370 nem lép meg eléggé a korábban tesztelt i5 CPU-stól, amely néhány száz euróval olcsóbb. Lehetséges, hogy a tesztpéldánynak volt valami gondja - a "kékhalálok" és rendszer összeomlások miatt ez is hihető magyarázat. Ha tehát sikerül egy második példányt is megvizsgálnunk, frissíteni fogjuk ezt a cikket is.
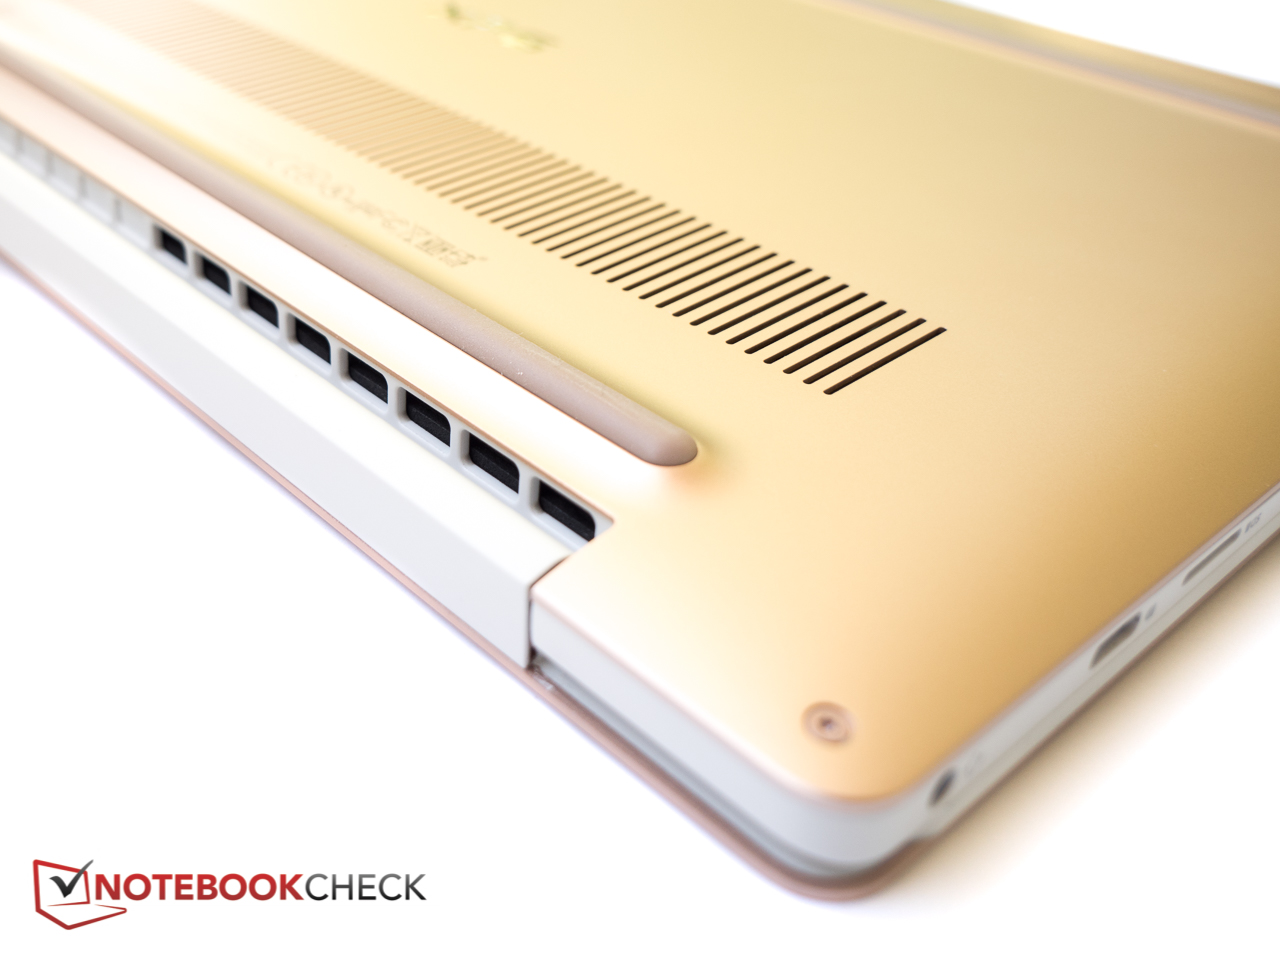
Ettől eltekintve az XPS 13 9370 kellemes mindennapi társ, remek kijelzővel - a lassú válaszidőt nem említve - és ergonomikus kialakítással. A ventilátorvezérlés különösen jól sikerült, mivel a felszín normál használat, és kis-közepes terhelés mellett kellemes hőmérsékletű maradt, és a zajszint is egyenletesebb és kevésbé zavaró, mint azt egy vékony géptől várnánk.
Az XPS 13 9370 az i7-8550U-s változatában csak akkor igazán vonzó, ha a nagyobb SSD és maximális mennyiségű RAM a fő szempontjaink. Egy i5-ös modell, 16 GB RAM-mal és 512 GB SSD-vel biztos befutó lenne, de jelenleg ilyen konfigurációt nem árul a Dell.
Ez az eredeti értékelés rövidített változata. A teljes, angol nyelvű cikk itt olvasható.
Dell XPS 13 9370 i7 UHD
- 04/20/2018 v6 (old)
Bernie Pechlaner
Price comparison
