Dell Precision 5690 munkaállomás felülvizsgálata: Készen áll a mesterséges intelligencia forradalmára

A Precision 5690 a tavalyi Precision 5680 utódja, amely a régebbi Raptor Lake-H CPU-kat az újabb, integrált NPU-kkal kiegészített Meteor Lake-H CPU-kra cseréli. A két modell egyébként megegyezik, azonos kijelző és GPU opciókkal. Javasoljuk, hogy nézze meg a a Precision 5680 véleményét a sorozat XPS 16 által inspirált fizikai jellemzőiről.
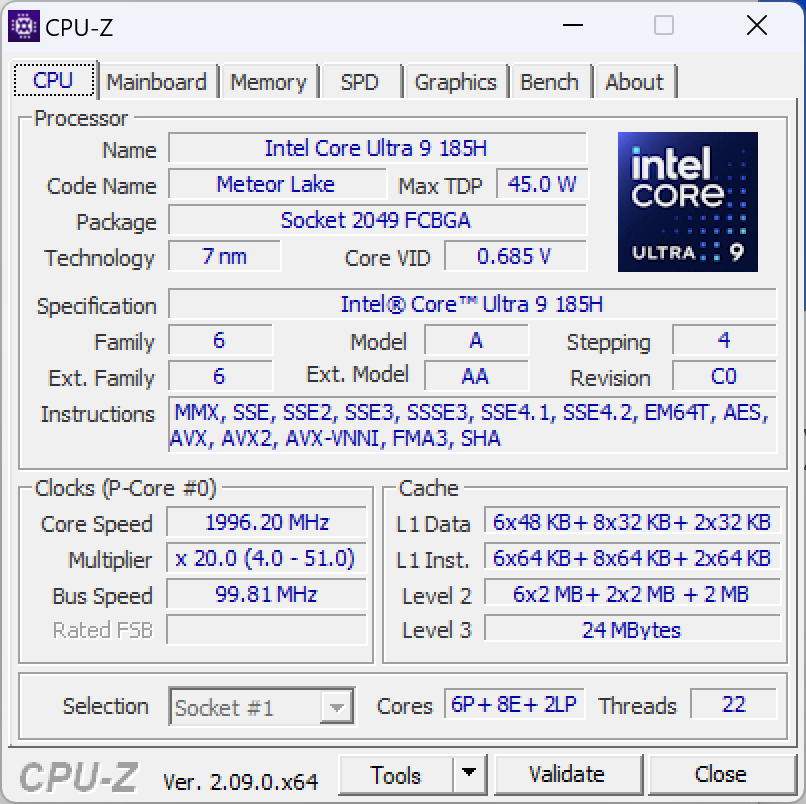
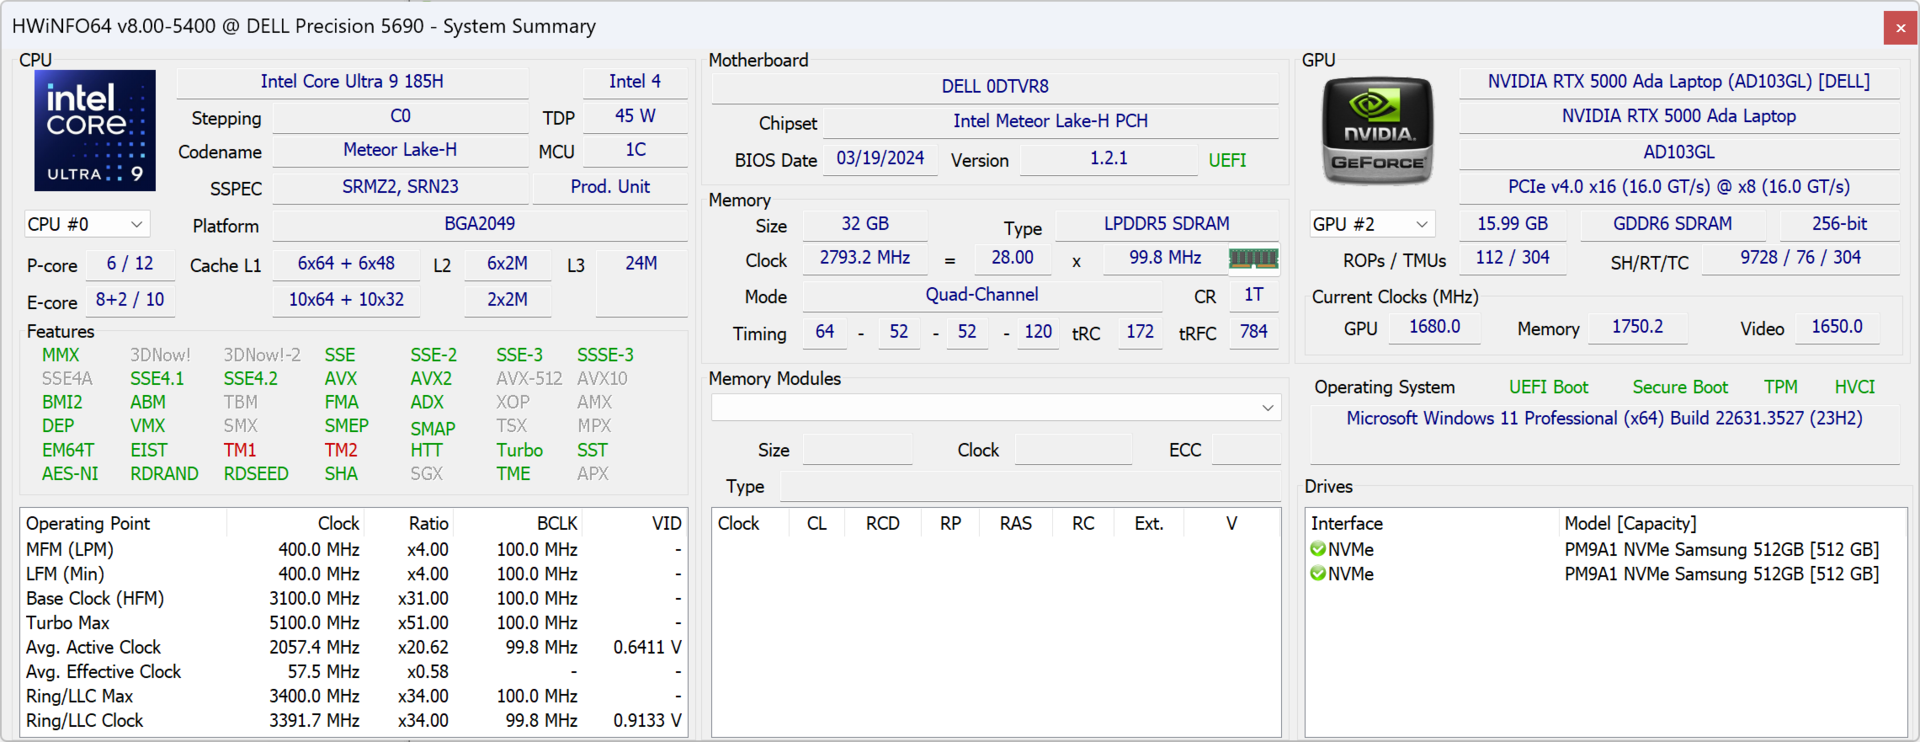
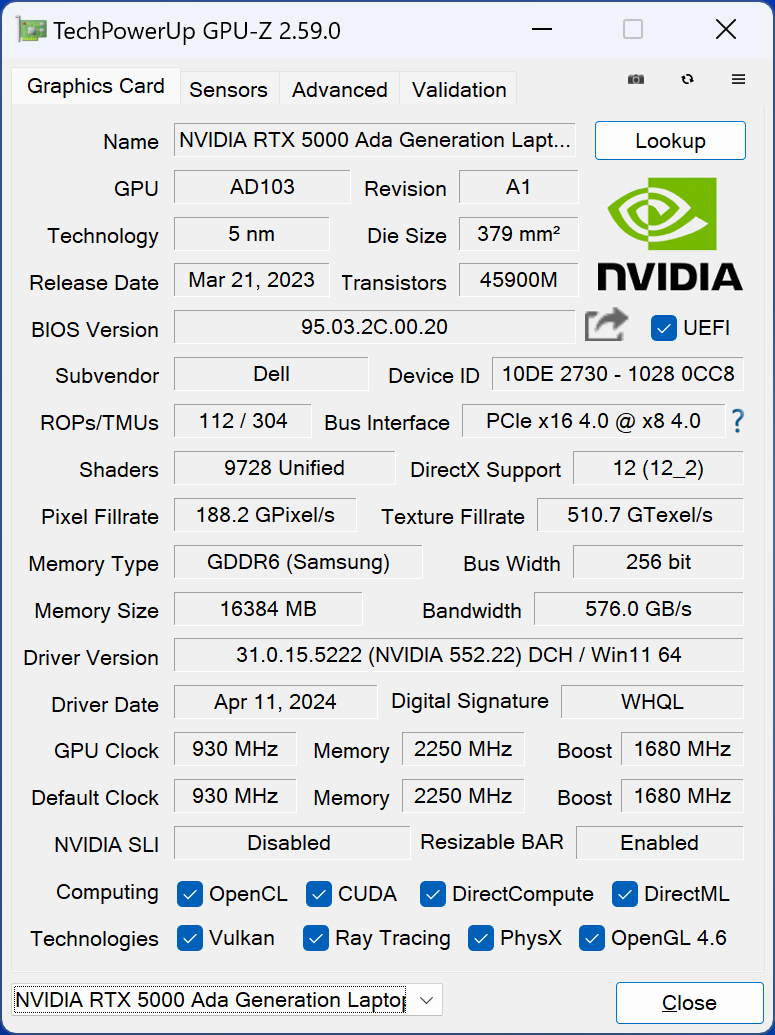
Az általunk vizsgált készülék a legmagasabb szintű konfiguráció Core Ultra 9 185H vPro CPU-val, Nvidia 5000 Ada GPU-val és 16 hüvelykes 2400p OLED érintőképernyővel, körülbelül 5900 USD-ért. A kisebb SKU-k a Core Ultra 5 135H vPro-val, csak integrált Arc grafikával és 1200p IPS kijelzővel kezdődnek, mindössze 2300 dollárért.
A Precision 5690 alternatívái közé tartoznak más 16 hüvelykes munkaállomások, mint például a Lenovo ThinkPad P16 G2, HP ZBook Fury 16 G10vagy a MSI CreatorPro Z16P.
További Dell-értékelések:
Lehetséges versenytársak összehasonlítása
Értékelés | Dátum | Modell | Súly | Magasság | Méret | Felbontás | Legjobb ár |
|---|---|---|---|---|---|---|---|
| 88.3 % v7 (old) | 05/2024 | Dell Precision 5690 Ultra 9 185H, RTX 5000 Ada Generation Laptop | 2.3 kg | 22.17 mm | 16.00" | 3840x2400 | |
| 89 % v7 (old) | 09/2023 | Dell Precision 5000 5680 i9-13900H, RTX 5000 Ada Generation Laptop | 2.3 kg | 22.17 mm | 16.00" | 3840x2400 | |
| 90.2 % v7 (old) | Lenovo ThinkPad P16 G2 21FA000FGE i7-13700HX, RTX 2000 Ada Generation Laptop | 3 kg | 30.23 mm | 16.00" | 2560x1600 | ||
| 91.7 % v7 (old) | 12/2023 | Lenovo ThinkPad P1 G6-21FV000DGE i9-13900H, RTX 2000 Ada Generation Laptop | 1.9 kg | 17.5 mm | 16.00" | 2560x1600 | |
| 92.3 % v7 (old) | 03/2024 | HP ZBook Fury 16 G10 i9-13950HX, RTX 5000 Ada Generation Laptop | 2.6 kg | 28.5 mm | 16.00" | 3840x2400 | |
| 84.3 % v7 (old) | MSI CreatorPro Z16P B12UKST i7-12700H, RTX A3000 Laptop GPU | 2.4 kg | 19 mm | 16.00" | 2560x1600 |
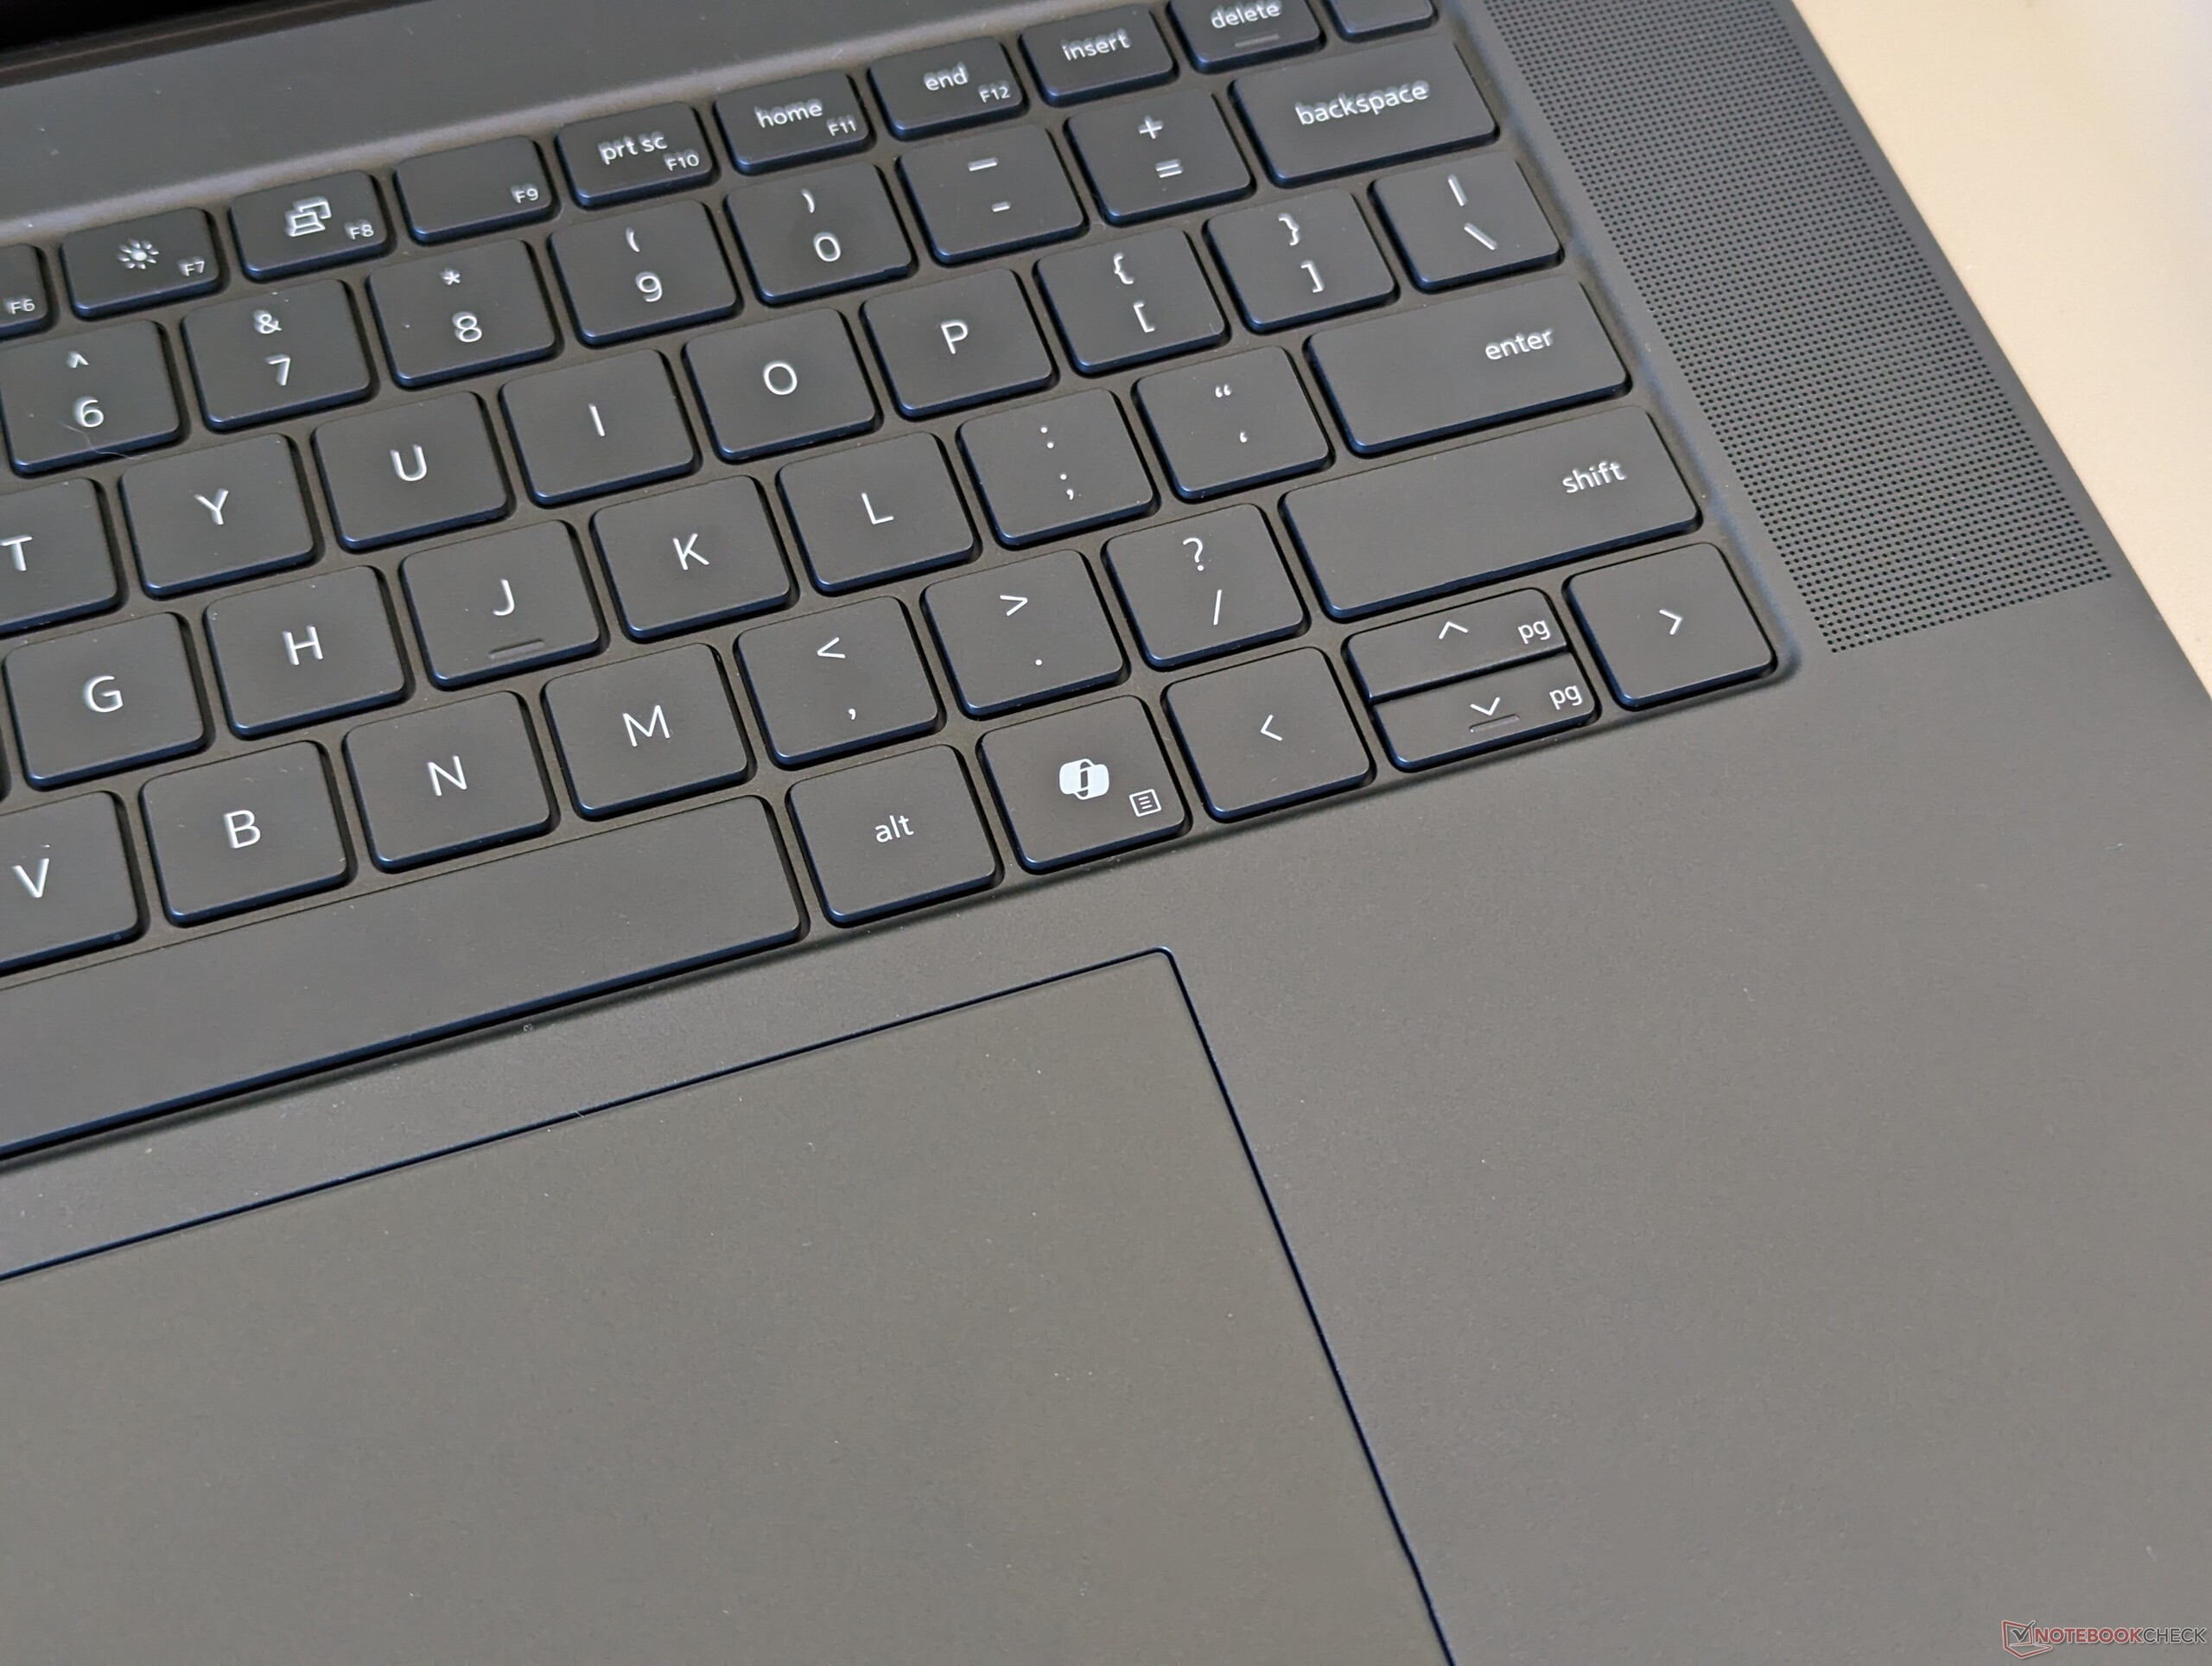
Tok - XPS 16 által inspirálva
A billentyűzet mostantól a jobb oldali Ctrl billentyű helyett egy külön Microsoft Co-Pilot billentyűt is tartalmaz, hogy vizuálisan is elkülönítse a Precision 5690 és az 5680 billentyűzetet.
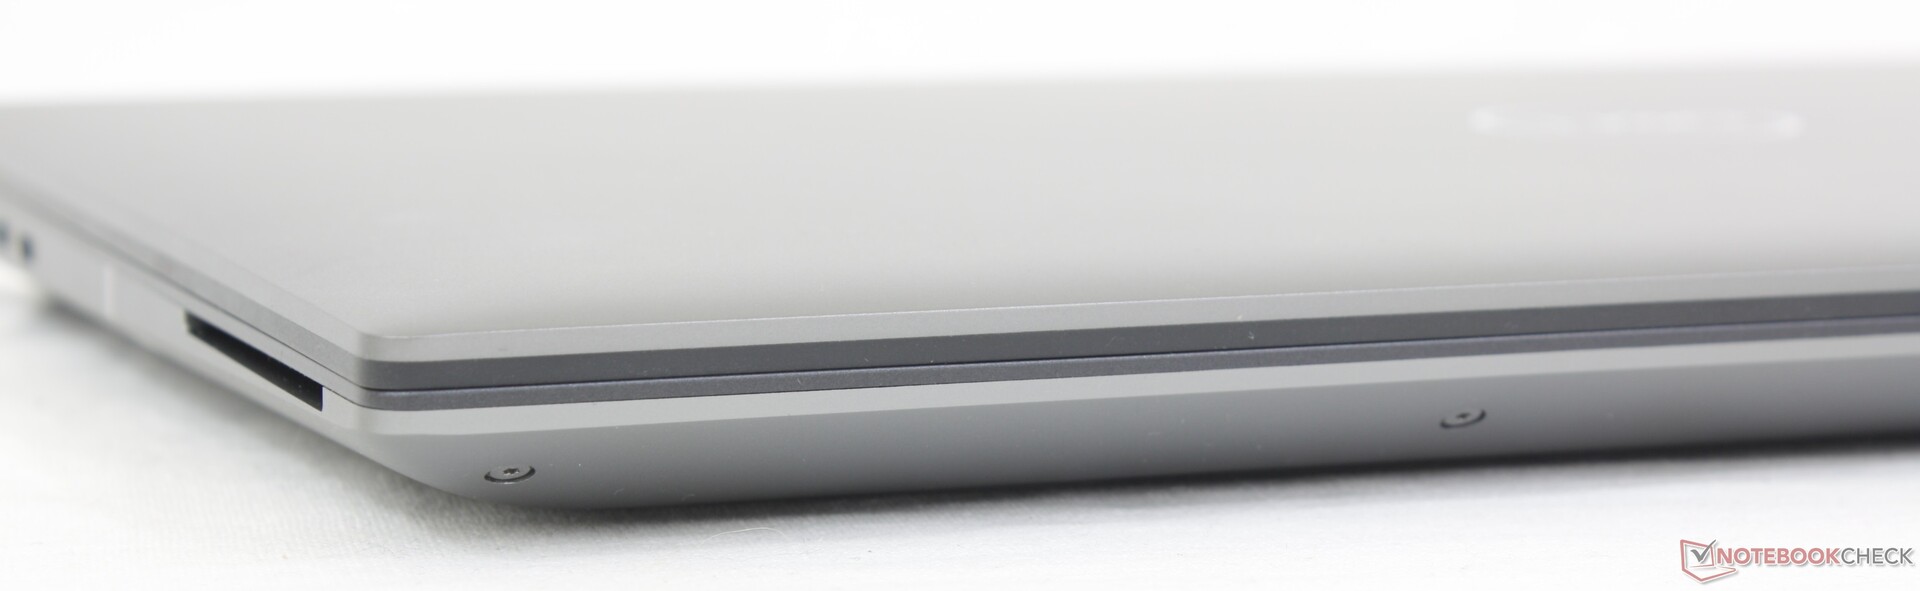
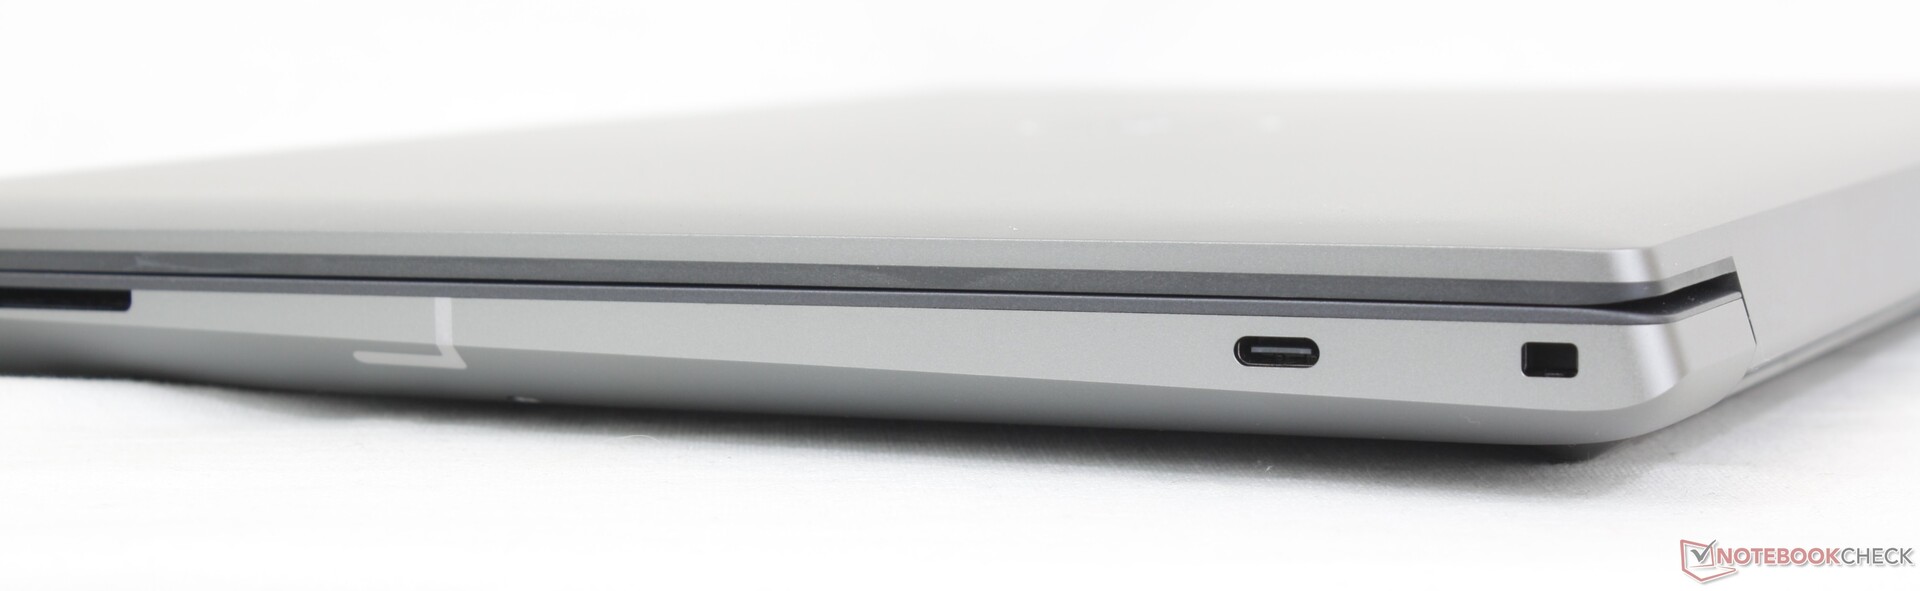
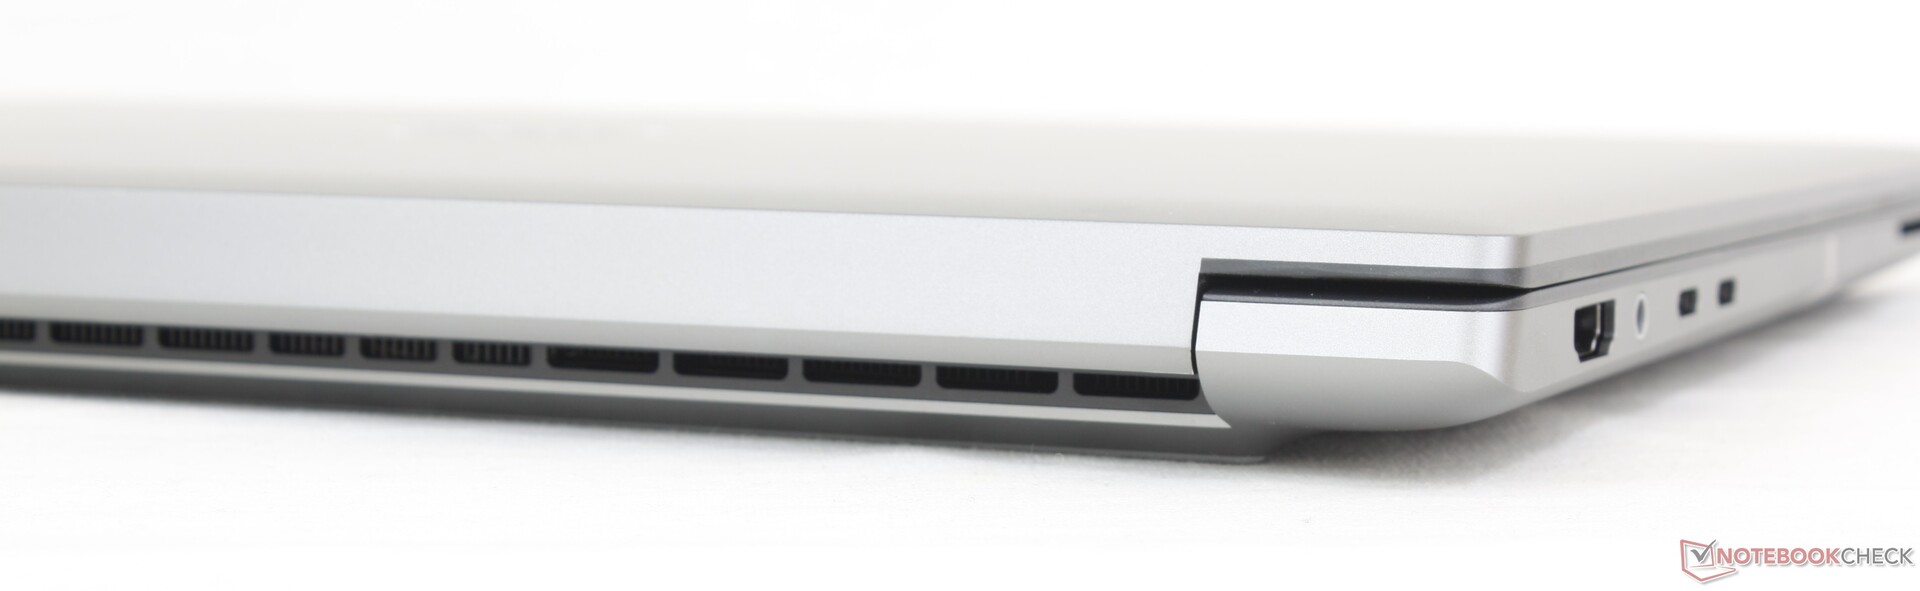
Csatlakoztathatóság
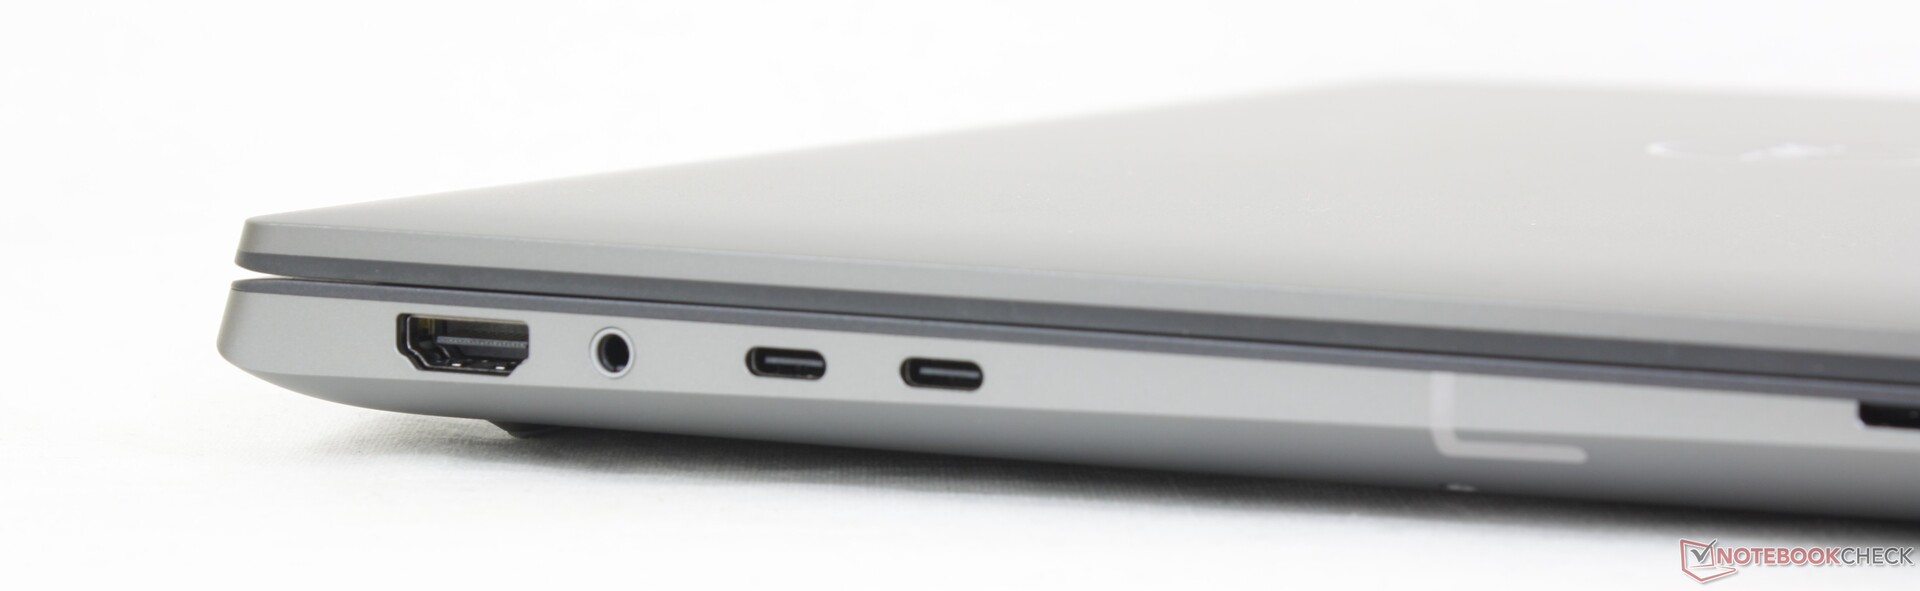
Kommunikáció
A WLAN-t az Intel AX211-ről az Intel BE200-ra frissítették, hogy támogassa a Wi-Fi 7 csatlakozást. A felhasználók túlnyomó többsége azonban még mindig a Wi-Fi 6E vagy régebbi hálózatokra korlátozódik, így a legtöbb felhasználó egyelőre nem fog teljesítménybeli előnyöket észrevenni.
| Networking | |
| iperf3 transmit AXE11000 | |
| Lenovo ThinkPad P1 G6-21FV000DGE | |
| HP ZBook Fury 16 G10 | |
| Dell Precision 5000 5680 | |
| Dell Precision 5690 | |
| Lenovo ThinkPad P16 G2 21FA000FGE | |
| iperf3 receive AXE11000 | |
| Lenovo ThinkPad P1 G6-21FV000DGE | |
| Lenovo ThinkPad P16 G2 21FA000FGE | |
| Dell Precision 5690 | |
| HP ZBook Fury 16 G10 | |
| Dell Precision 5000 5680 | |
| iperf3 transmit AXE11000 6GHz | |
| MSI CreatorPro Z16P B12UKST | |
| HP ZBook Fury 16 G10 | |
| Dell Precision 5000 5680 | |
| Dell Precision 5690 | |
| Lenovo ThinkPad P16 G2 21FA000FGE | |
| iperf3 receive AXE11000 6GHz | |
| Lenovo ThinkPad P16 G2 21FA000FGE | |
| MSI CreatorPro Z16P B12UKST | |
| Dell Precision 5690 | |
| HP ZBook Fury 16 G10 | |
| Dell Precision 5000 5680 | |
Webkamera

")
")
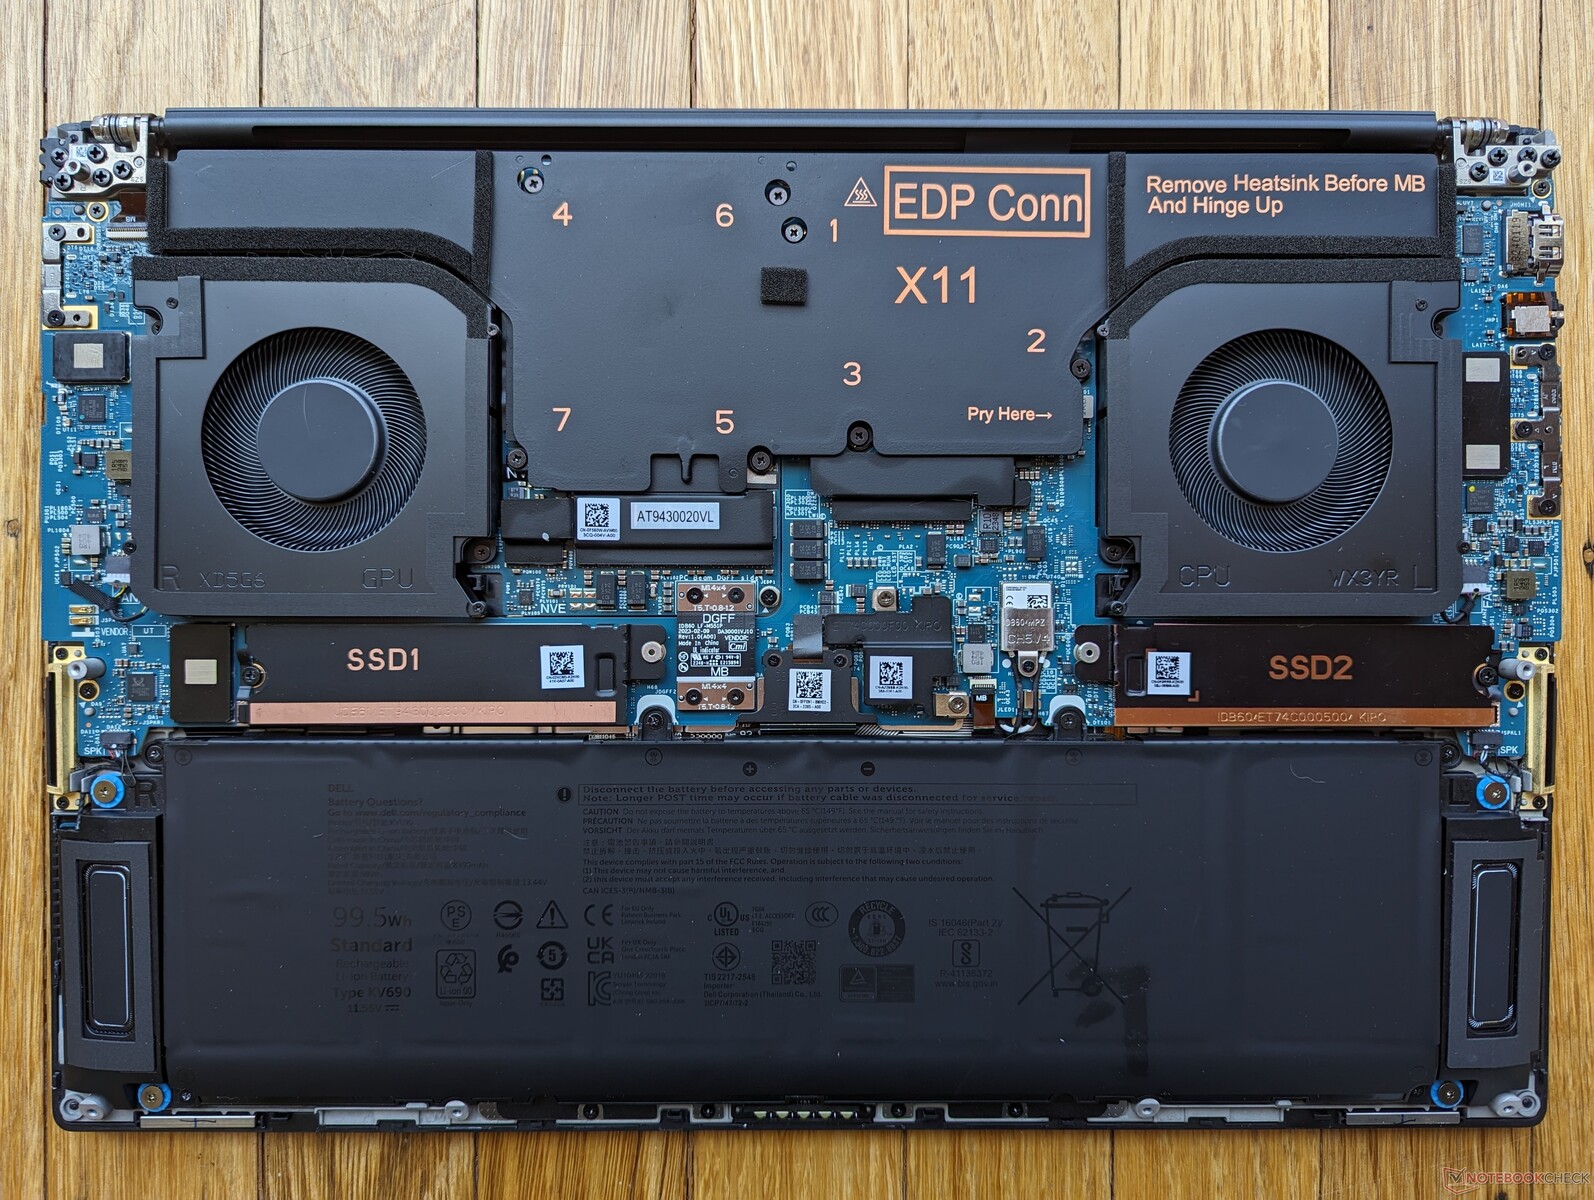
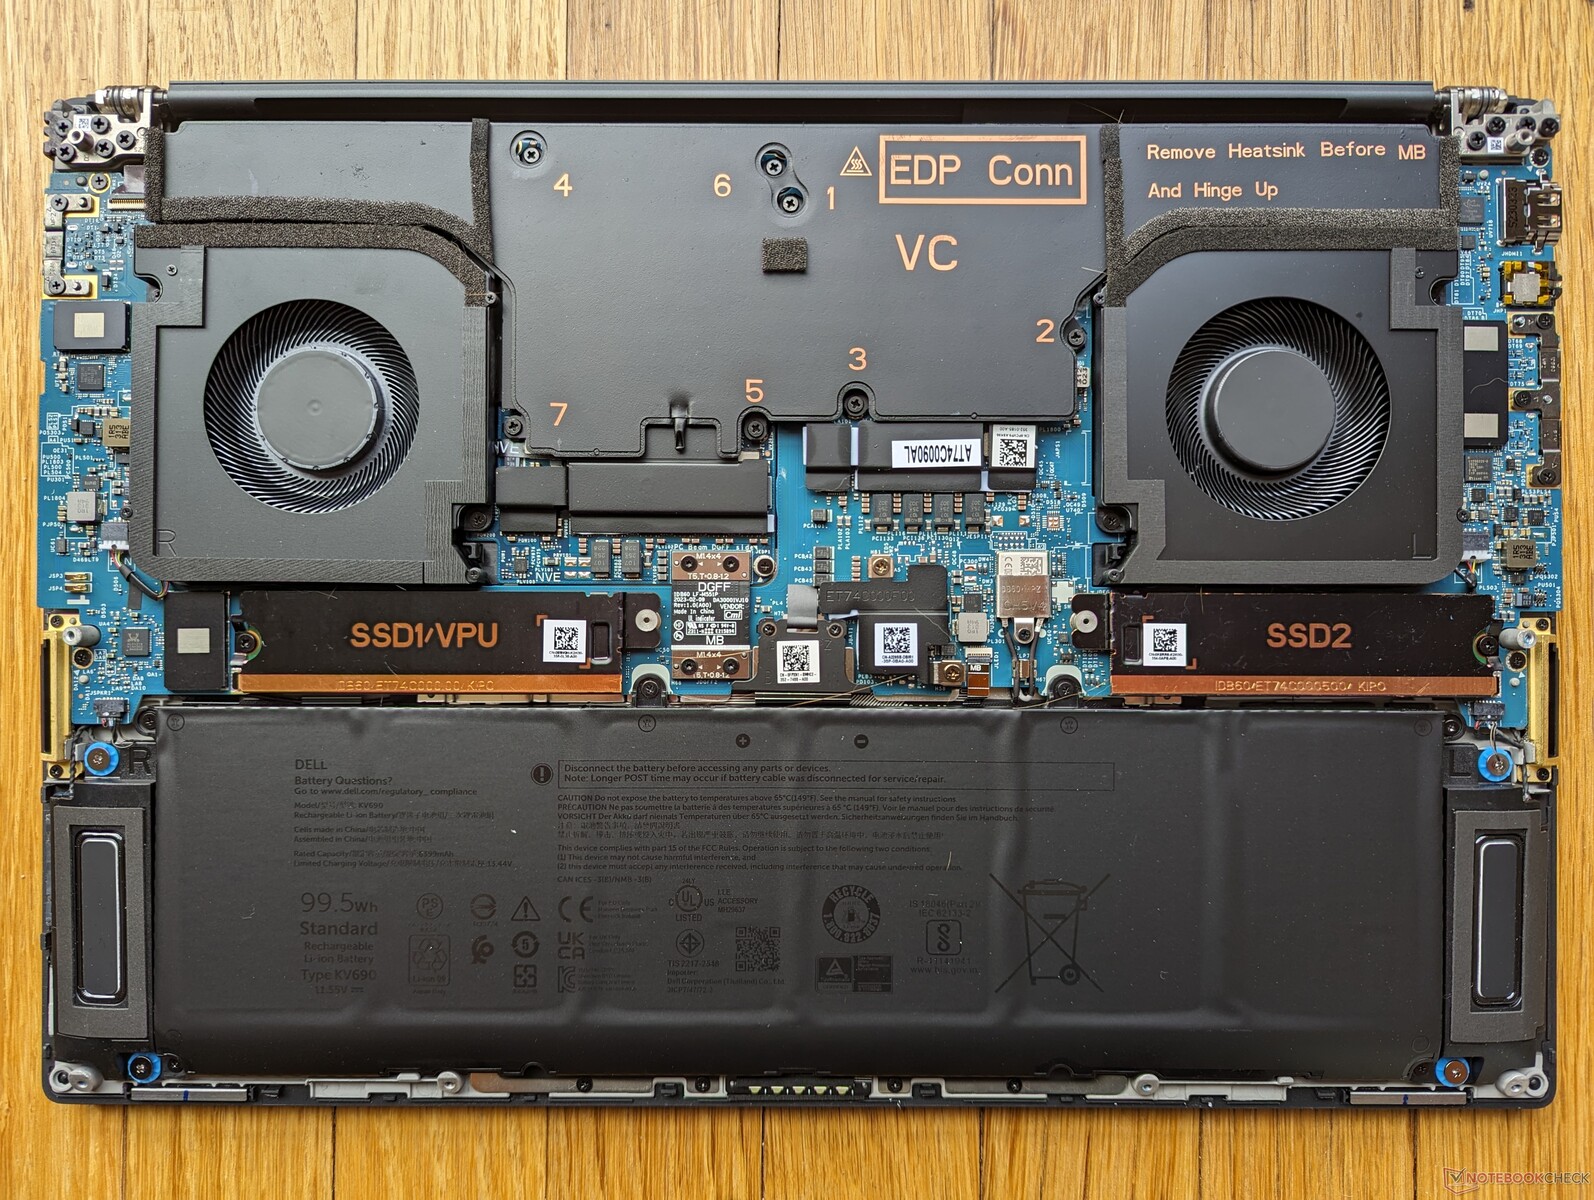
Karbantartás
A Precision 5690 és a régebbi 5680 között nincsenek említésre méltó belső különbségek.
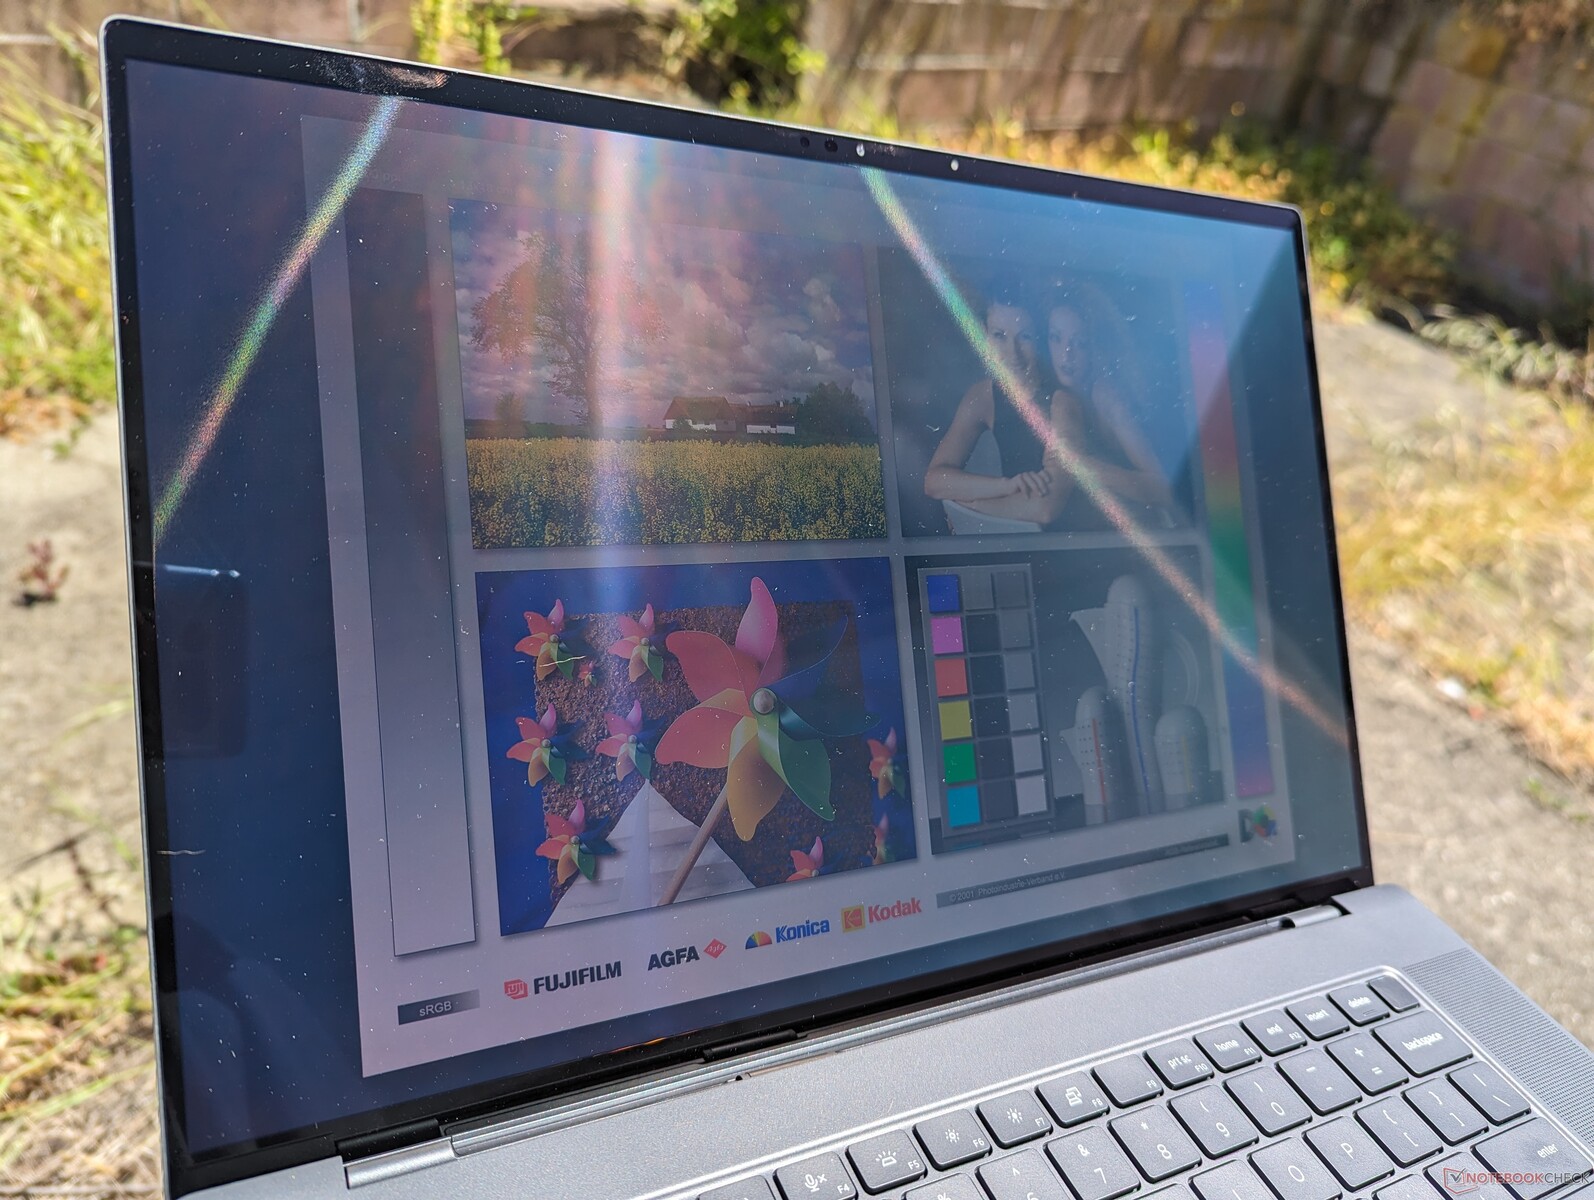
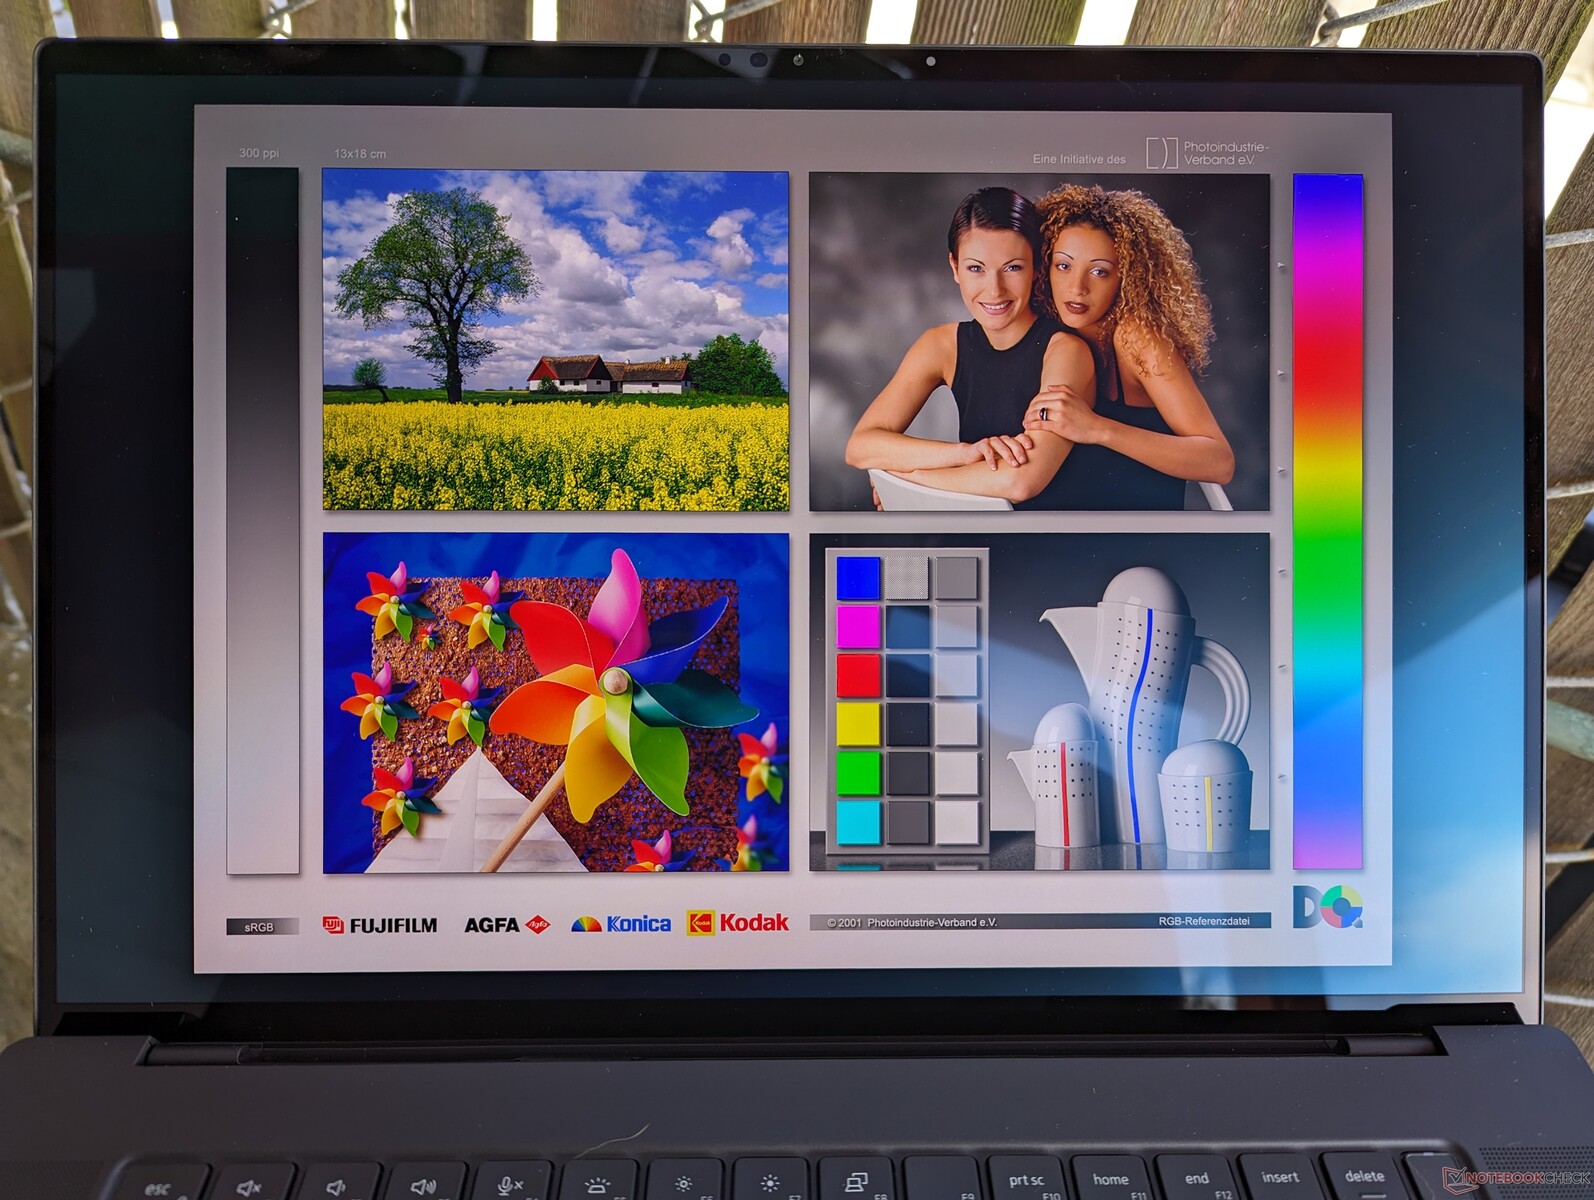
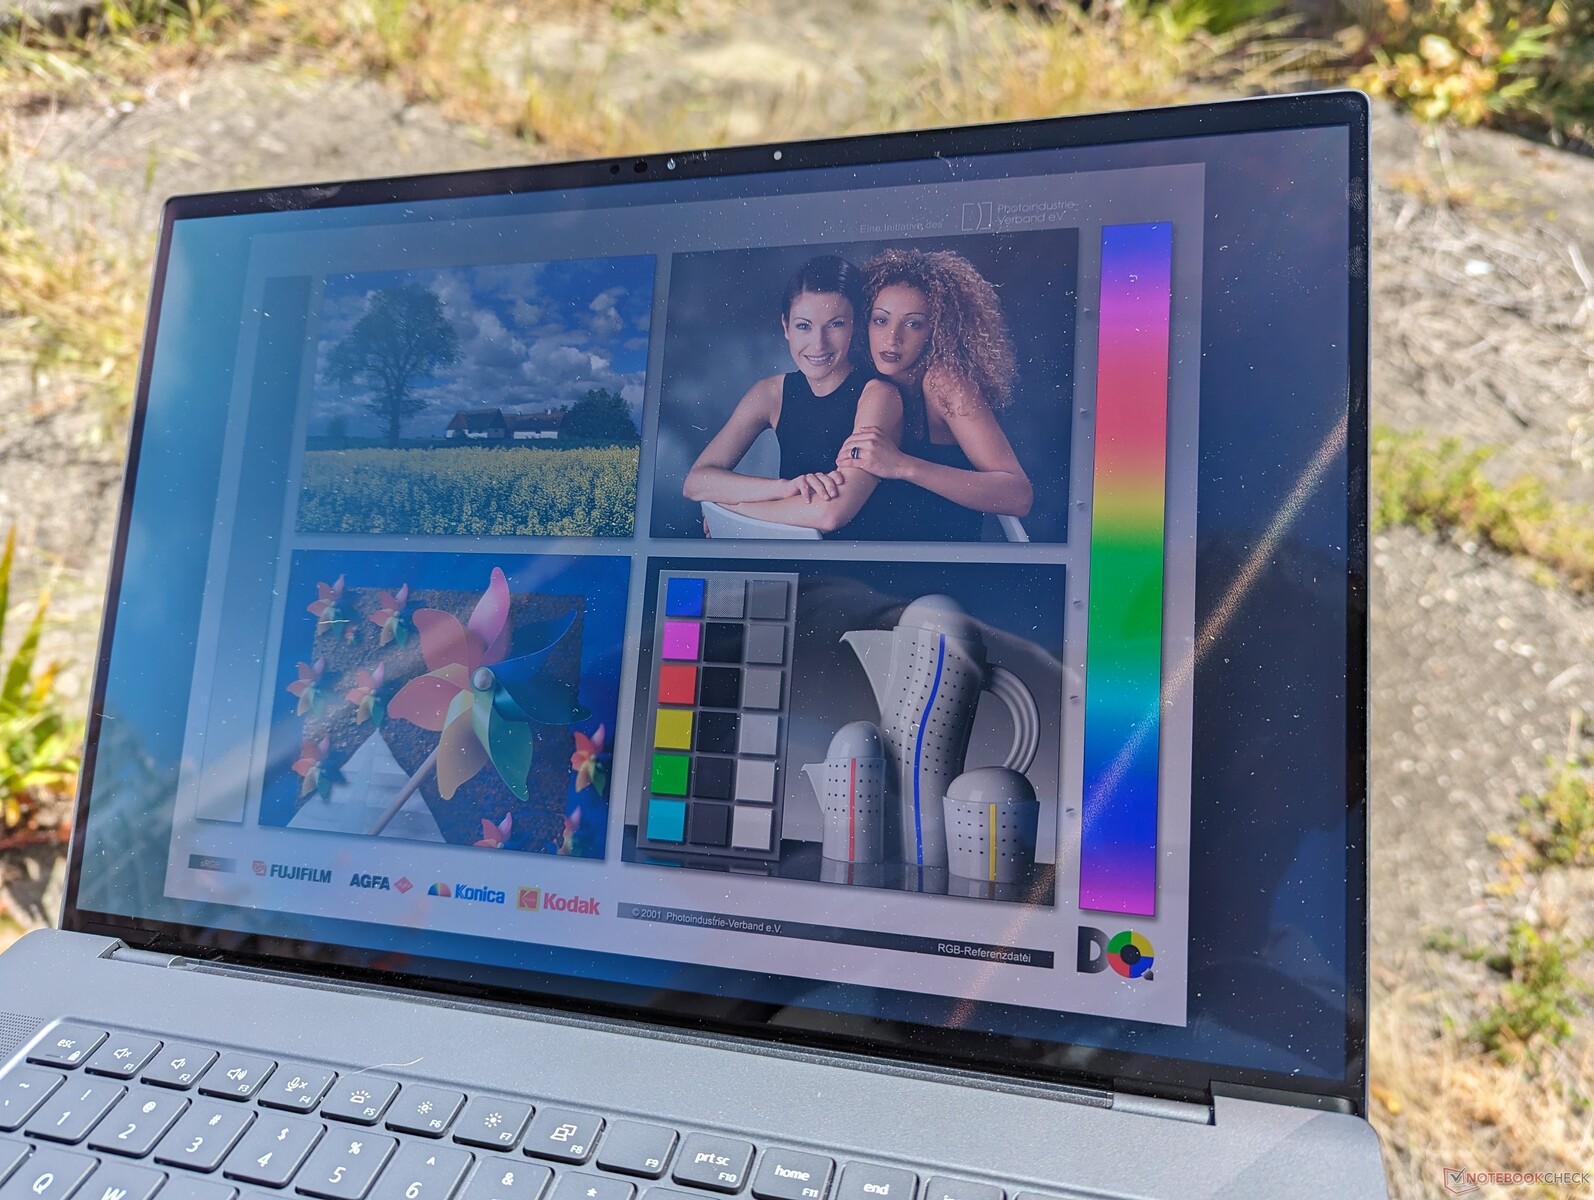
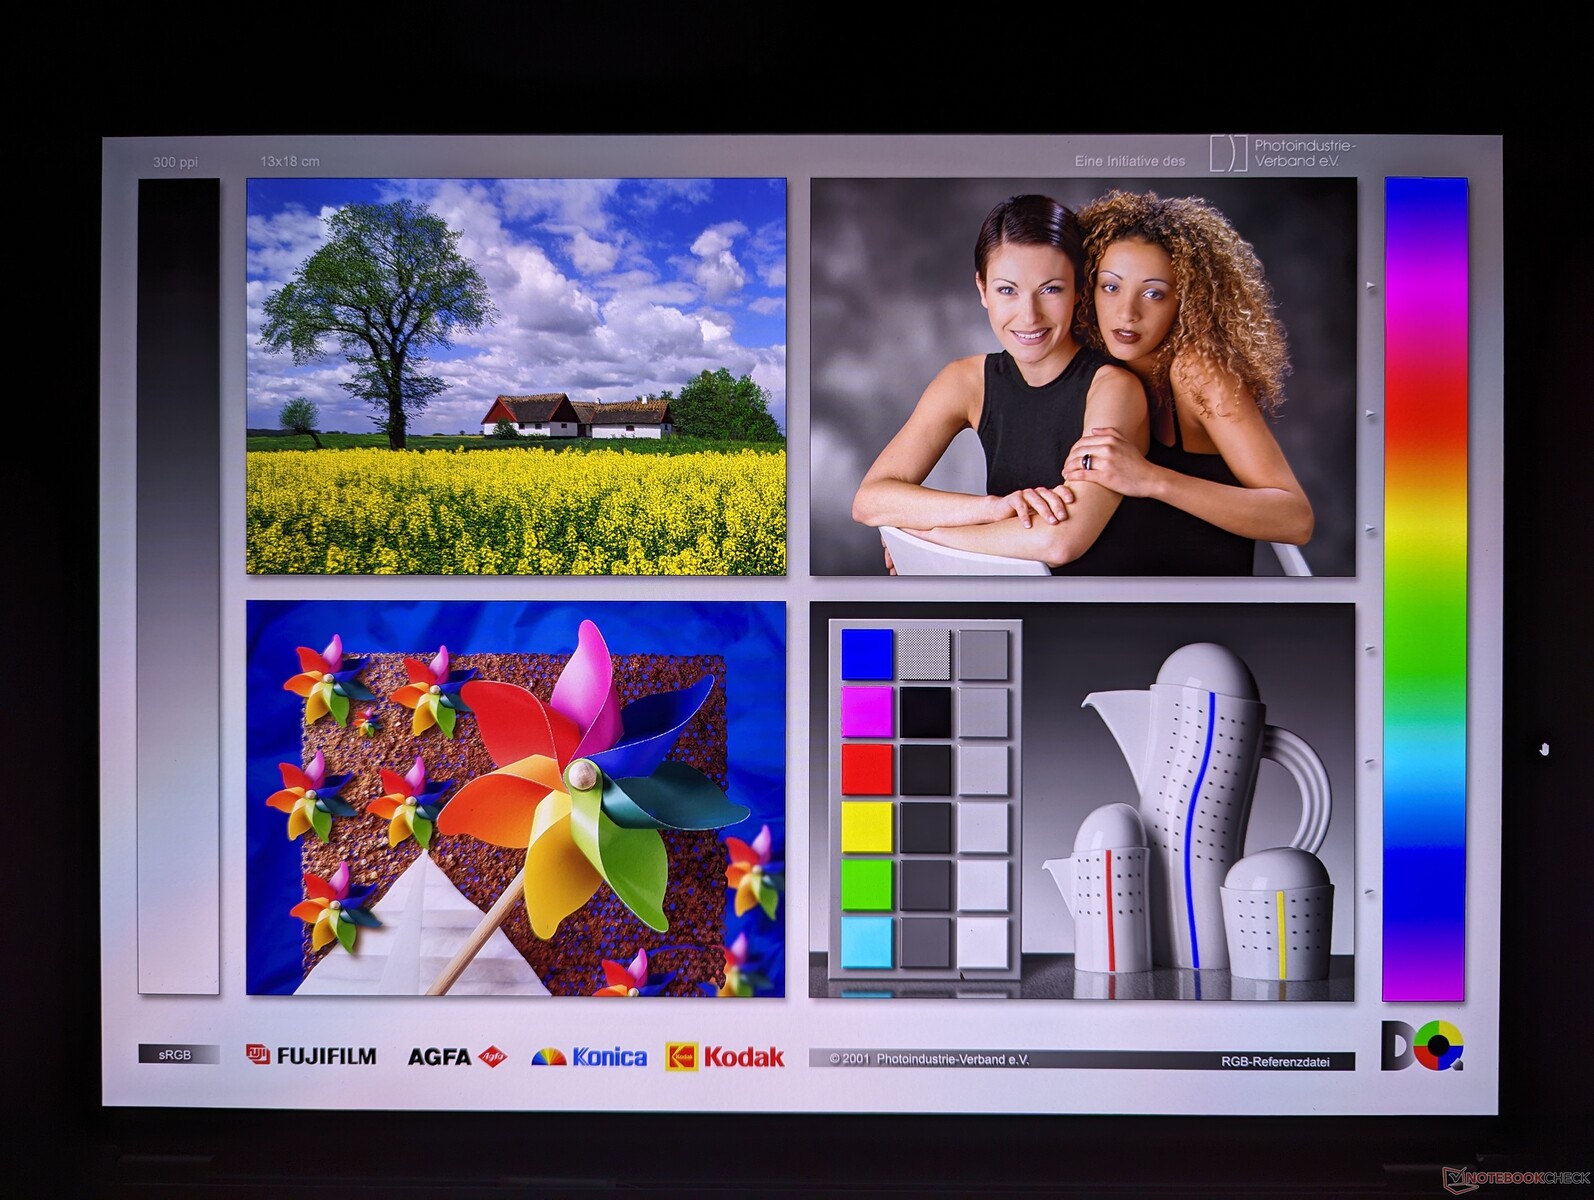
Kijelző - HDR OLED 60 Hz-en
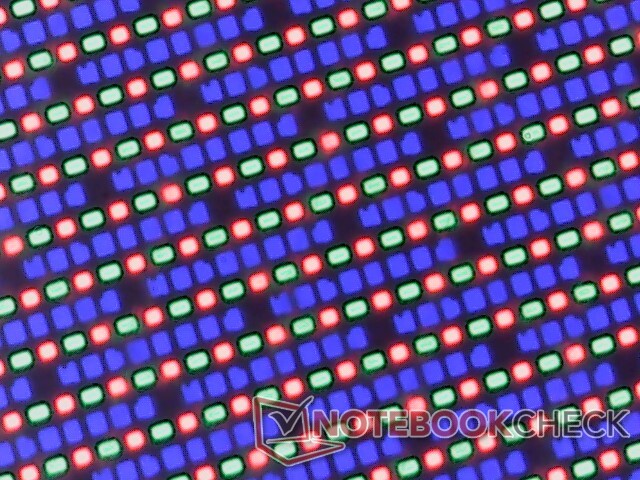
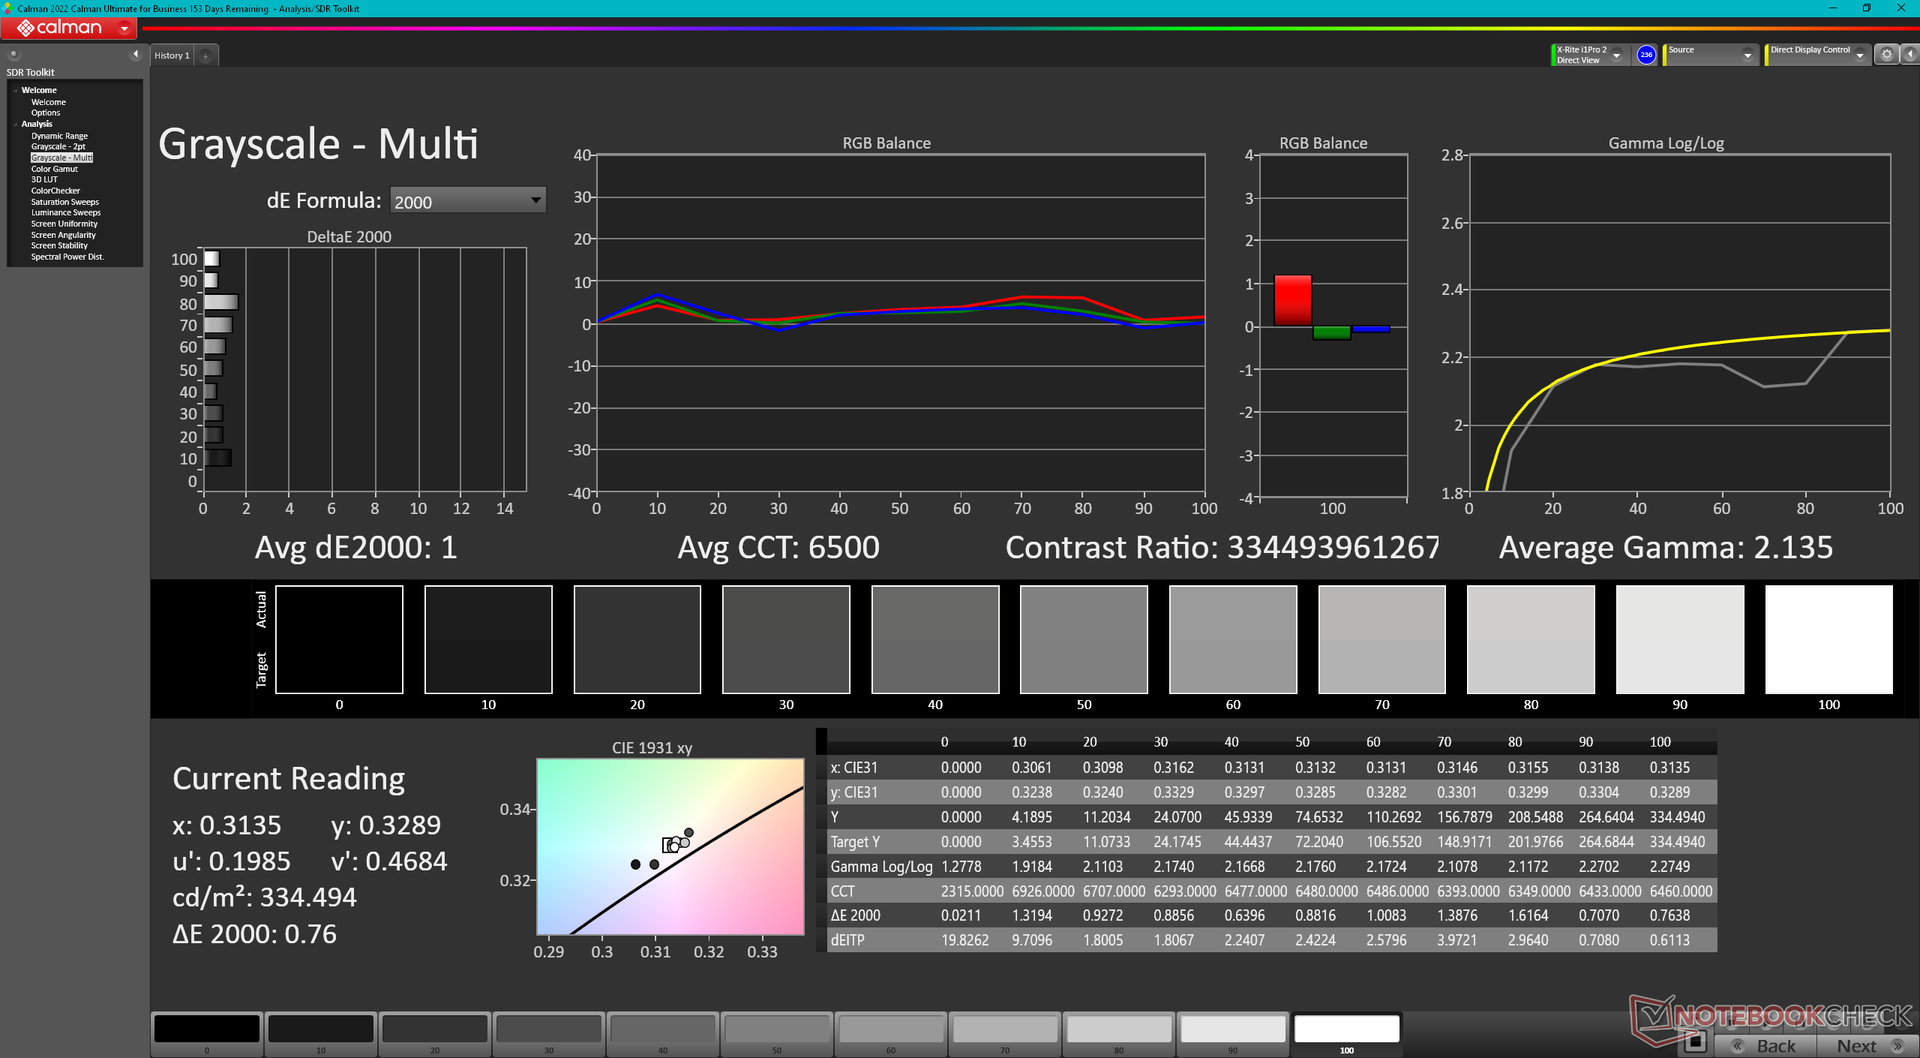
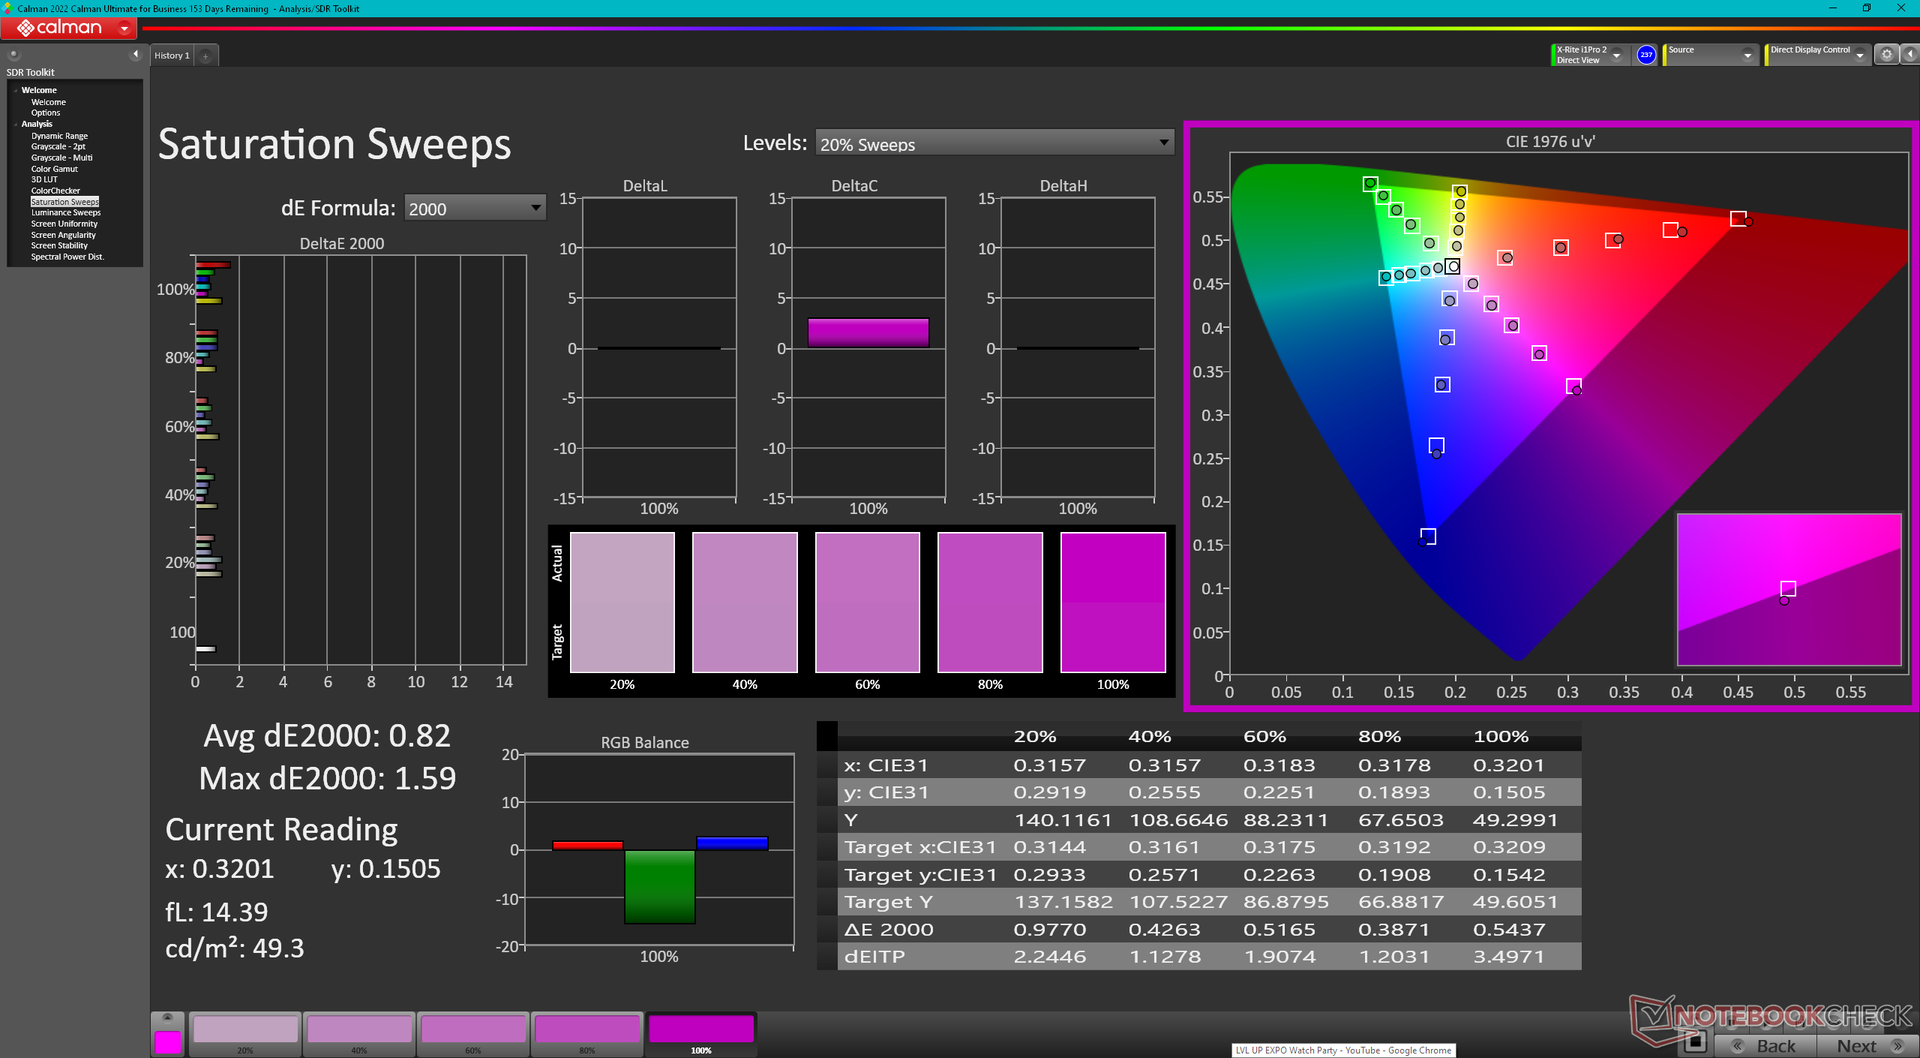
A 2024-es modell ugyanazt a 4K Samsung 160YV03 OLED panelt és D3KJF cikkszámot használja, mint az előző évben, így a vizuális élmény nem változik. Ez egyrészt kiváló, mivel az OLED panel előre kalibrált, teljes DCI-P3 színekkel és érintés támogatással érkezik. Másrészt jó lett volna magasabb képfrissítési frekvenciát látni adaptív lehetőségekkel, mivel a szabványos 60 Hz-es képfrissítési frekvencia kezd kiöregedni.
A maximális fényerő SDR és HDR módban 350 nits, illetve 600 nits lehet.
| |||||||||||||||||||||||||
Fényerő megoszlás: 97 %
Centrumban: 348.1 cd/m²
Kontraszt: ∞:1 (Fekete: 0 cd/m²)
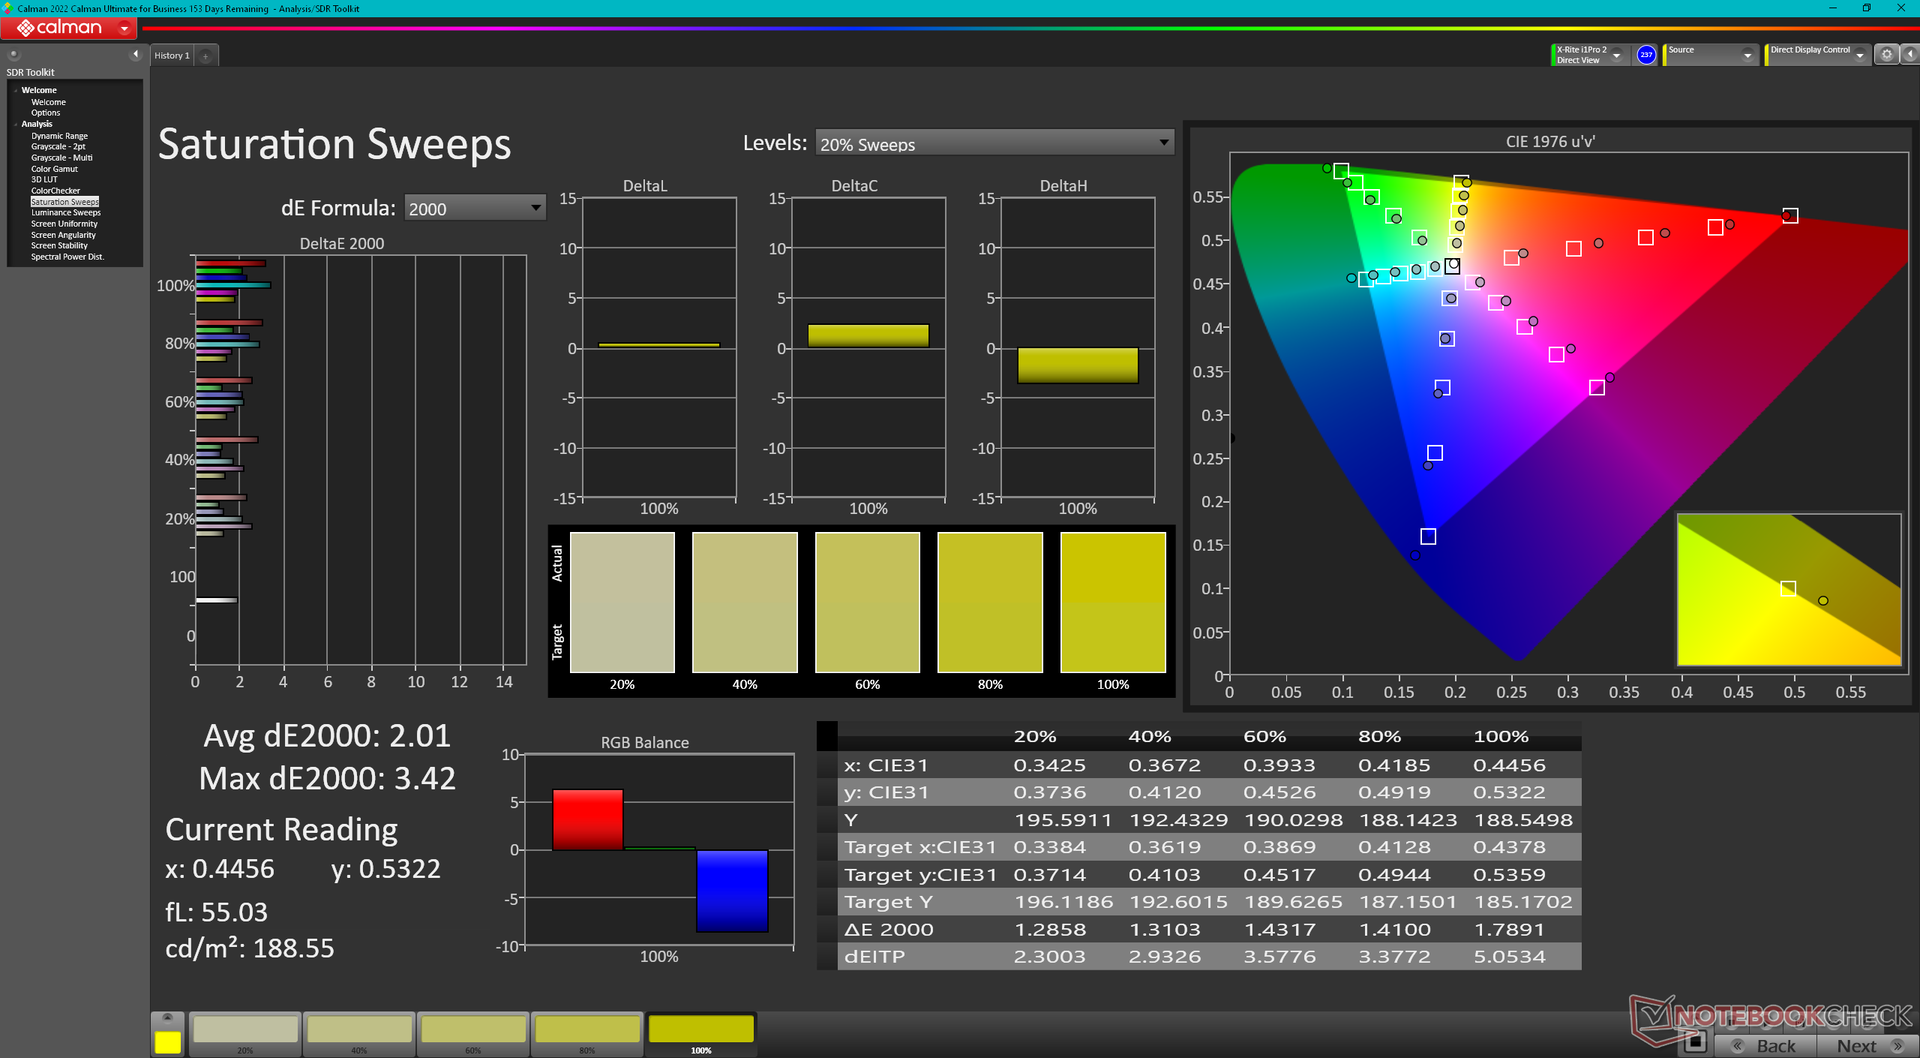
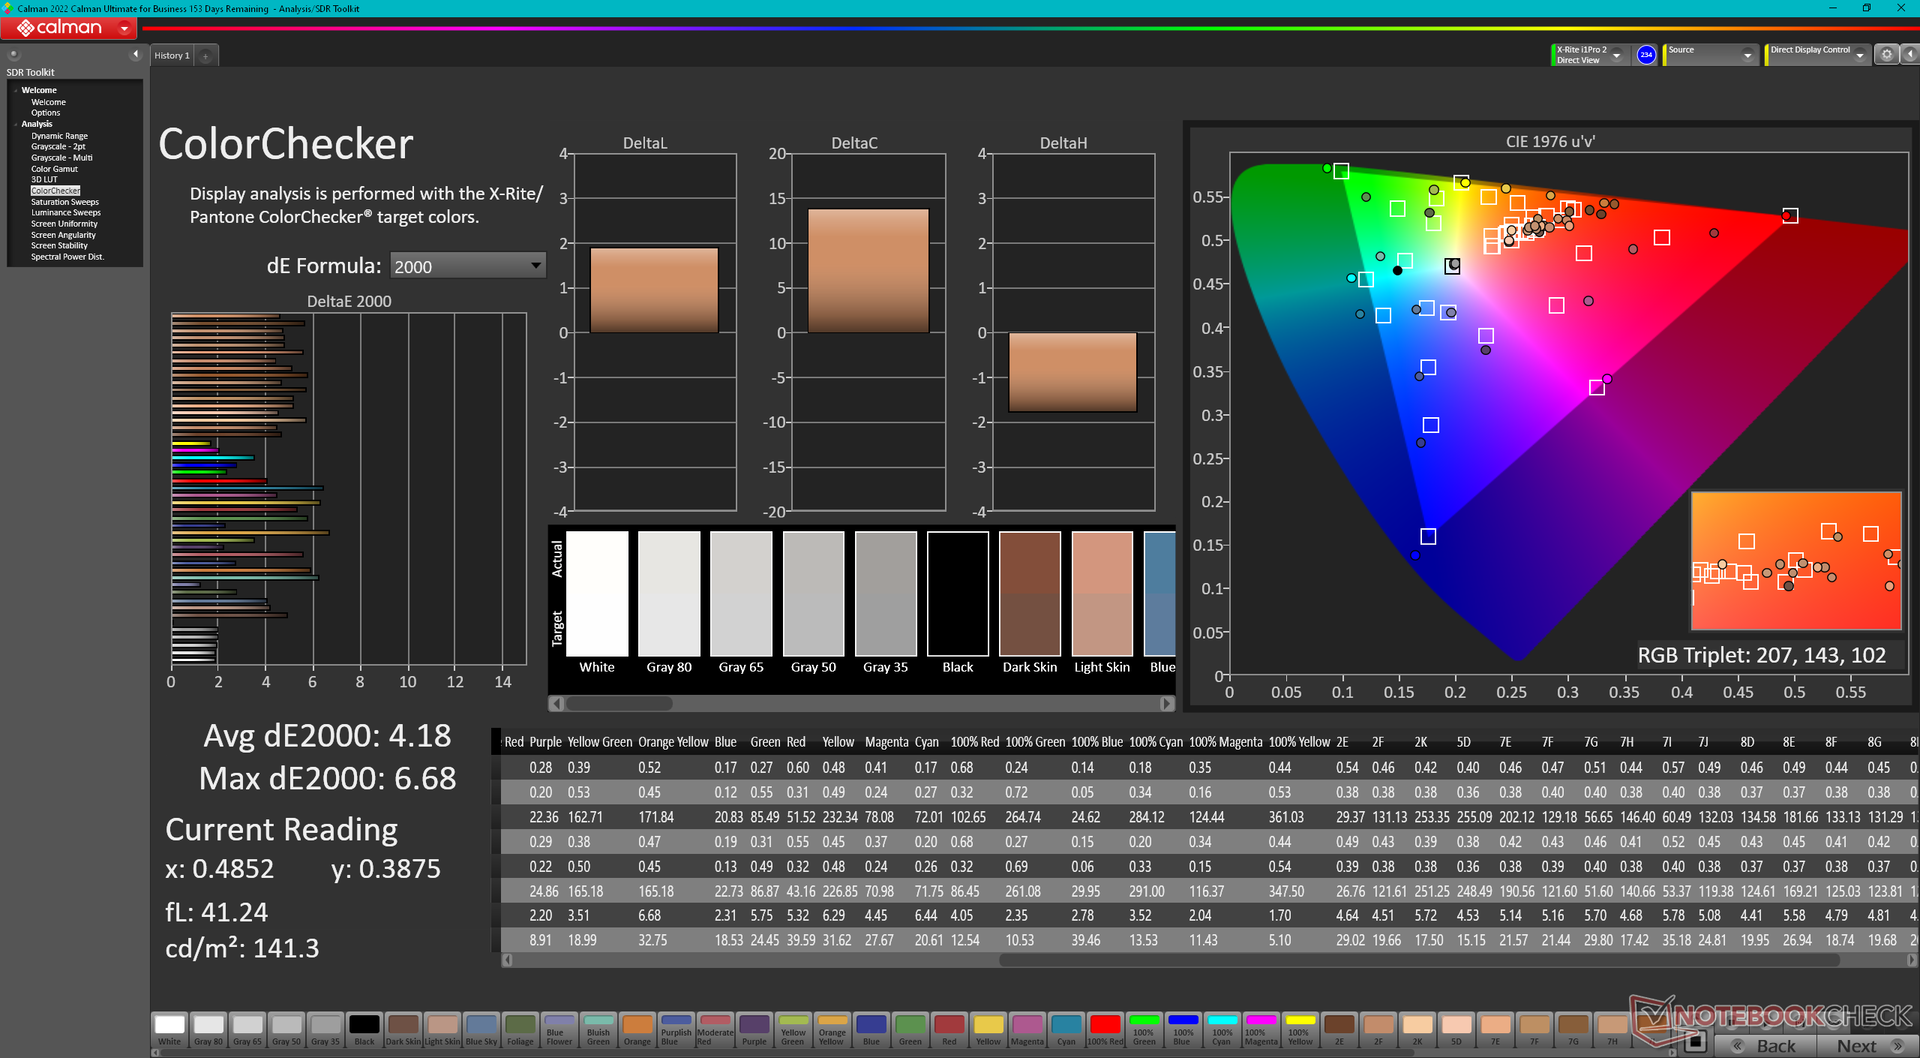
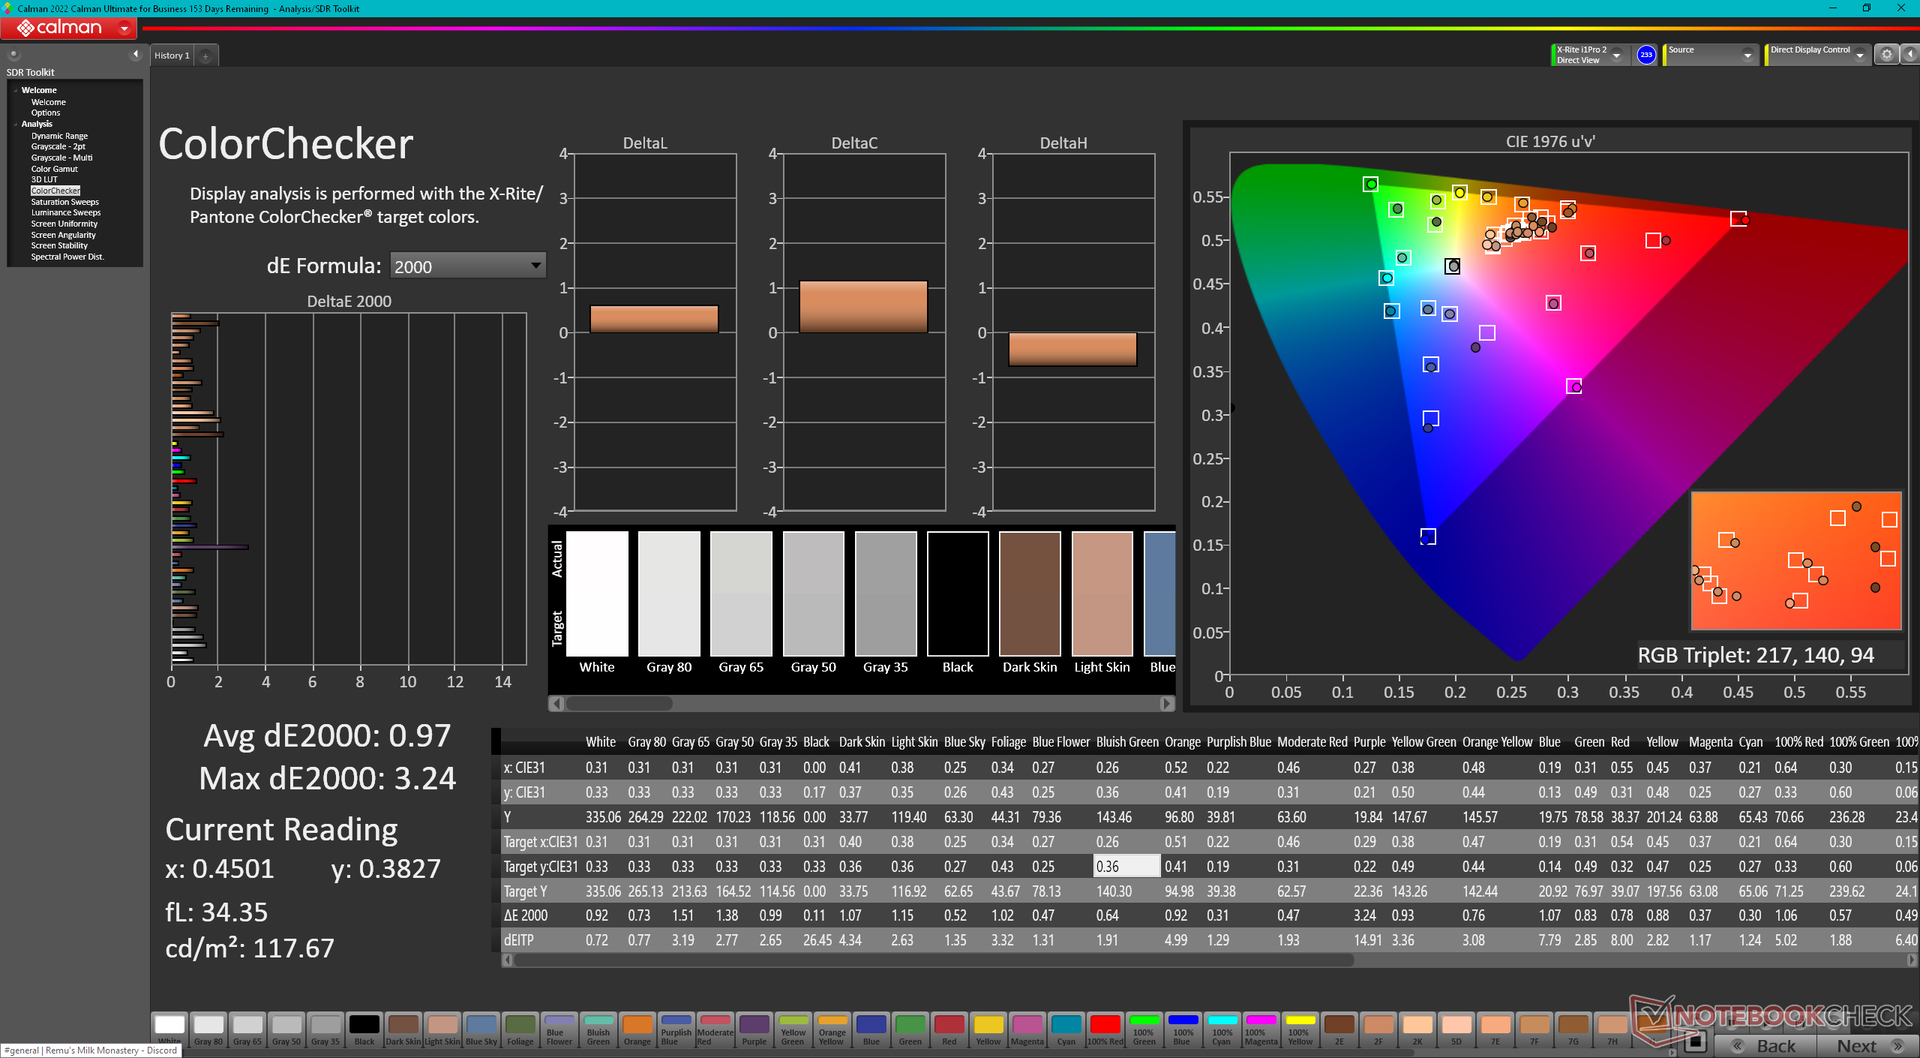
ΔE ColorChecker Calman: 4.18 | ∀{0.5-29.43 Ø4.73}
calibrated: 0.97
ΔE Greyscale Calman: 1.7 | ∀{0.09-98 Ø4.97}
96.6% AdobeRGB 1998 (Argyll 3D)
100% sRGB (Argyll 3D)
99.8% Display P3 (Argyll 3D)
Gamma: 2.2
CCT: 6198 K
| Dell Precision 5690 Samsung 160YV03, OLED, 3840x2400, 16" | Dell Precision 5000 5680 Samsung 160YV03, OLED, 3840x2400, 16" | Lenovo ThinkPad P16 G2 21FA000FGE MNG007DA1-9, IPS LED, 2560x1600, 16" | Lenovo ThinkPad P1 G6-21FV000DGE NE160QDM-NY1, IPS, 2560x1600, 16" | HP ZBook Fury 16 G10 AUO87A8, IPS, 3840x2400, 16" | MSI CreatorPro Z16P B12UKST B160QAN02.N, IPS, 2560x1600, 16" | |
|---|---|---|---|---|---|---|
| Display | 0% | -18% | -20% | -4% | -4% | |
| Display P3 Coverage (%) | 99.8 | 99.9 0% | 71 -29% | 68.1 -32% | 98 -2% | 97.6 -2% |
| sRGB Coverage (%) | 100 | 100 0% | 99.2 -1% | 97.5 -2% | 99.9 0% | 99.9 0% |
| AdobeRGB 1998 Coverage (%) | 96.6 | 97.5 1% | 73.2 -24% | 70.2 -27% | 86.2 -11% | 87.4 -10% |
| Response Times | -2% | -574% | -586% | -533% | -494% | |
| Response Time Grey 50% / Grey 80% * (ms) | 1.7 ? | 1.68 ? 1% | 12.8 ? -653% | 13.7 ? -706% | 11.9 ? -600% | 12.8 ? -653% |
| Response Time Black / White * (ms) | 1.7 ? | 1.77 ? -4% | 10.1 ? -494% | 9.6 ? -465% | 9.6 ? -465% | 7.4 ? -335% |
| PWM Frequency (Hz) | 60 ? | 60 ? | ||||
| Screen | -11% | -15% | 33% | 36% | 22% | |
| Brightness middle (cd/m²) | 348.1 | 345.7 -1% | 510 47% | 521 50% | 514.6 48% | 407 17% |
| Brightness (cd/m²) | 351 | 349 -1% | 517 47% | 484 38% | 495 41% | 388 11% |
| Brightness Distribution (%) | 97 | 98 1% | 89 -8% | 89 -8% | 90 -7% | 88 -9% |
| Black Level * (cd/m²) | 0.37 | 0.36 | 0.46 | 0.36 | ||
| Colorchecker dE 2000 * | 4.18 | 3.59 14% | 2.6 38% | 1.2 71% | 2.4 43% | 1.3 69% |
| Colorchecker dE 2000 max. * | 6.68 | 7.02 -5% | 5.2 22% | 2.5 63% | 4.86 27% | 2.5 63% |
| Colorchecker dE 2000 calibrated * | 0.97 | 0.99 -2% | 2.3 -137% | 1 -3% | 0.4 59% | 0.7 28% |
| Greyscale dE 2000 * | 1.7 | 3.1 -82% | 3.6 -112% | 1.4 18% | 1 41% | 2.1 -24% |
| Gamma | 2.2 100% | 2.13 103% | 2.26 97% | 2.25 98% | 2.3 96% | 2.26 97% |
| CCT | 6198 105% | 6448 101% | 5969 109% | 6682 97% | 6553 99% | 6437 101% |
| Contrast (:1) | 1378 | 1447 | 1119 | 1131 | ||
| Teljes átlag (program / beállítások) | -4% /
-7% | -202% /
-109% | -191% /
-84% | -167% /
-69% | -159% /
-70% |
* ... a kisebb jobb
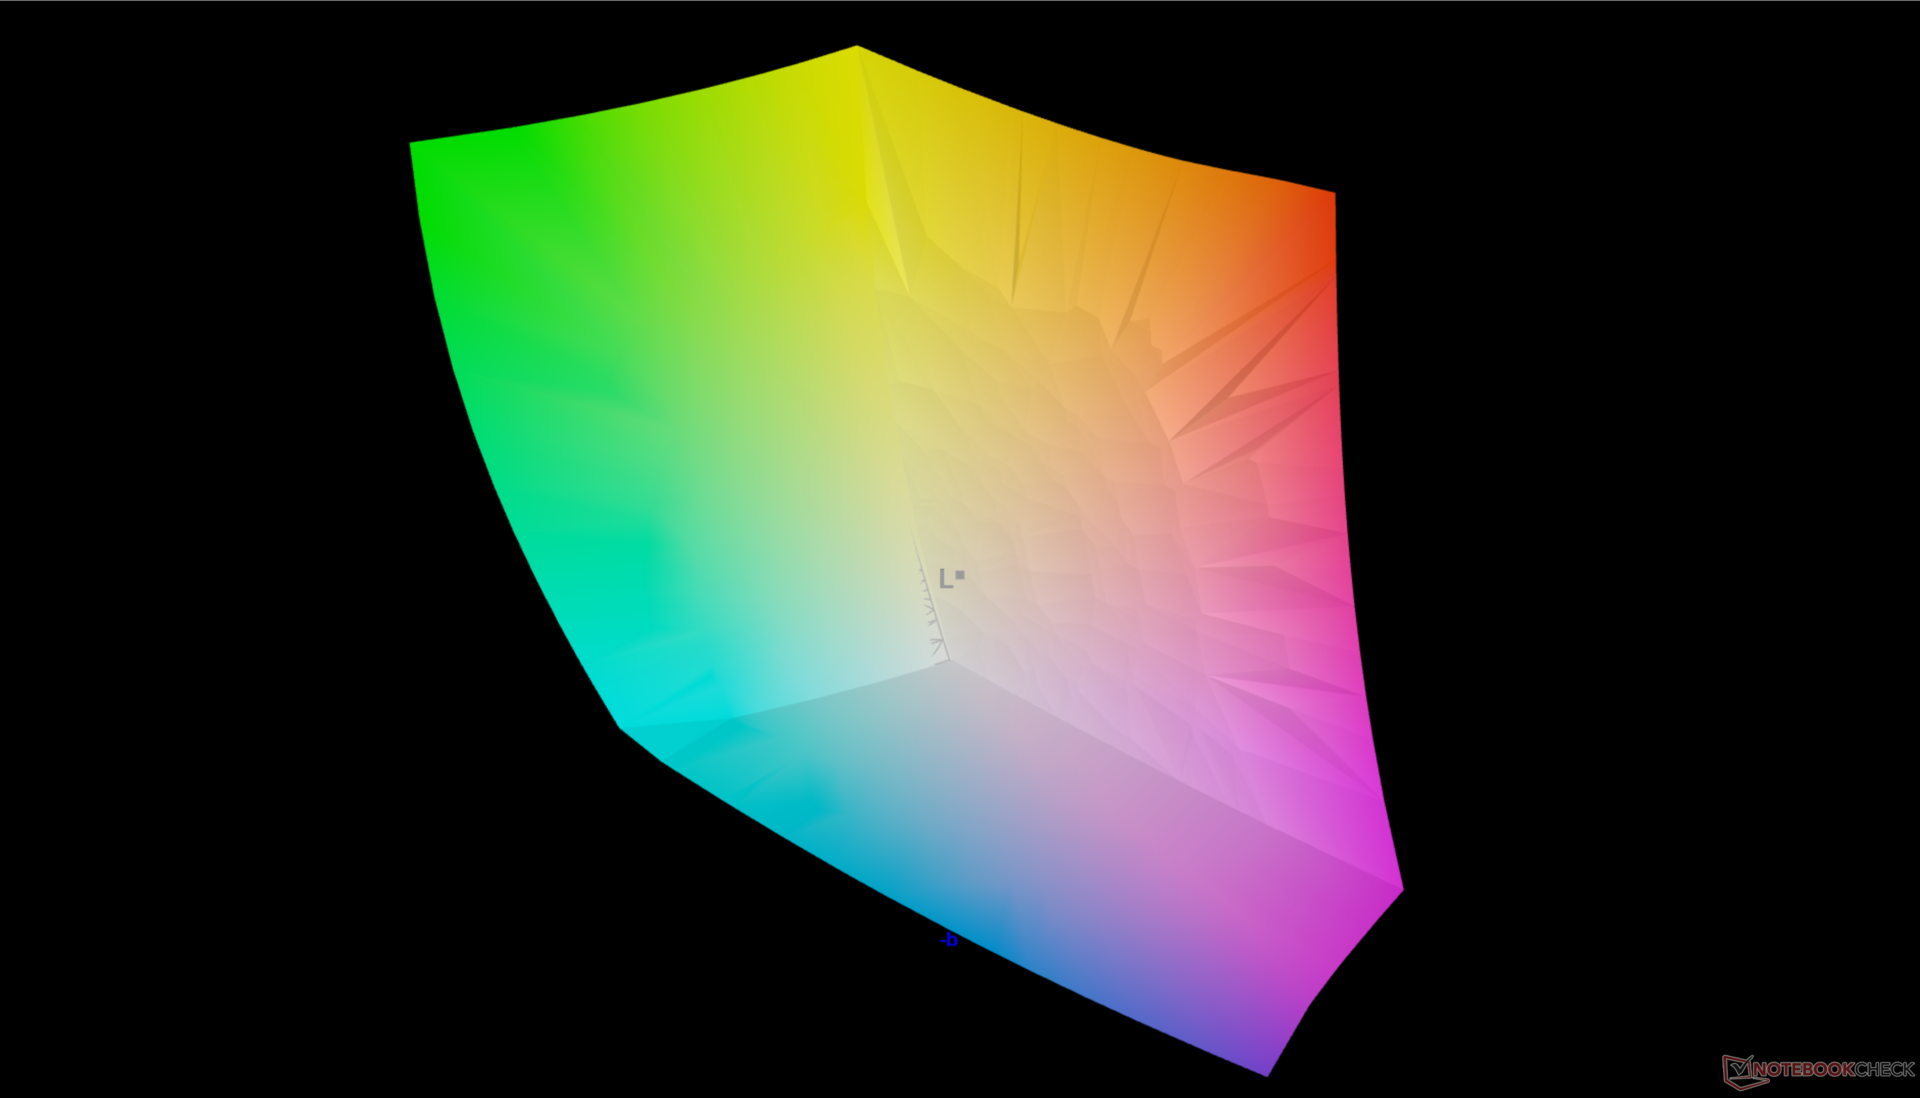
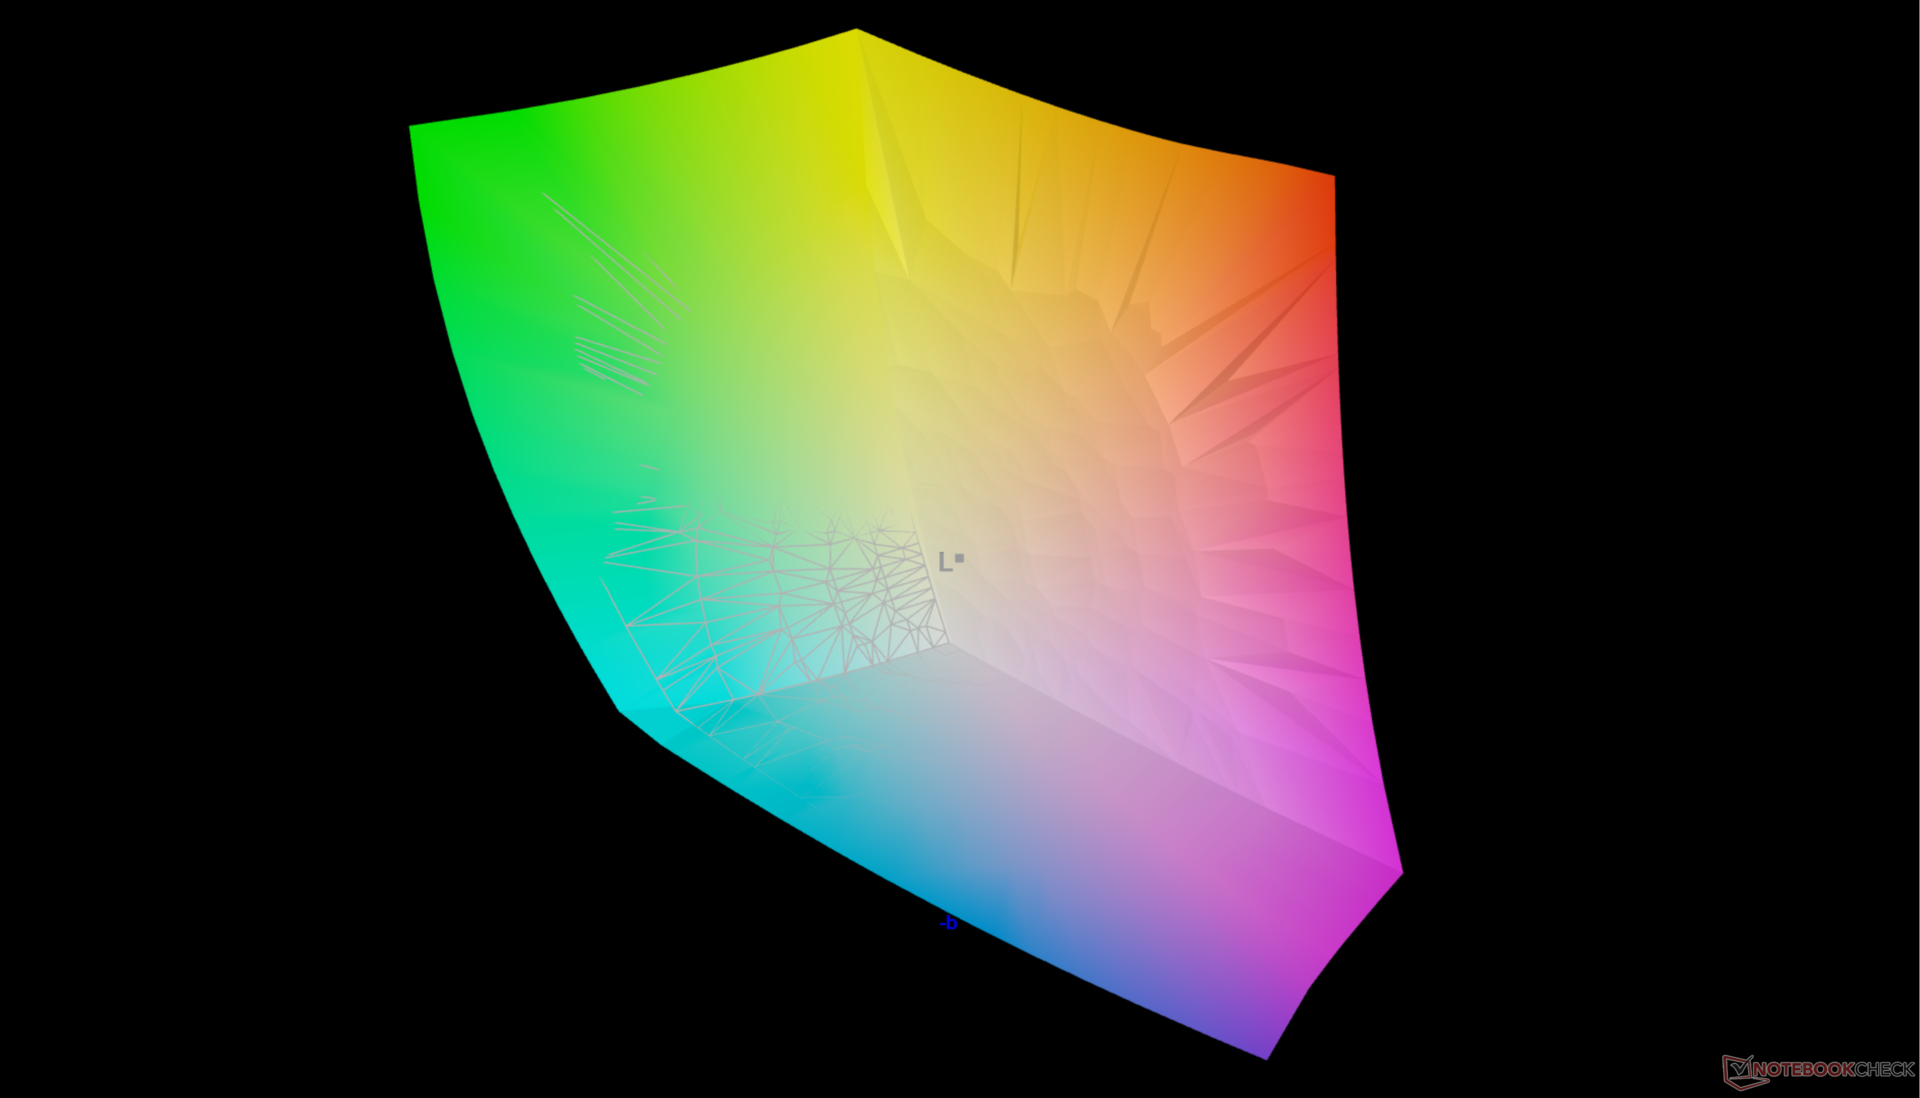
A kijelző jól kalibrált a P3 szabványhoz képest, az átlagos szürkeárnyalatos és színes DeltaE-értékek mindössze 1,7, illetve 4,18 értéket mutatnak.

Megjelenítési válaszidők
| ↔ Válaszidő Fekete-fehér | ||
|---|---|---|
| 1.7 ms ... emelkedés és süllyedés ↘ kombinálva | ↗ 0.74 ms emelkedés | 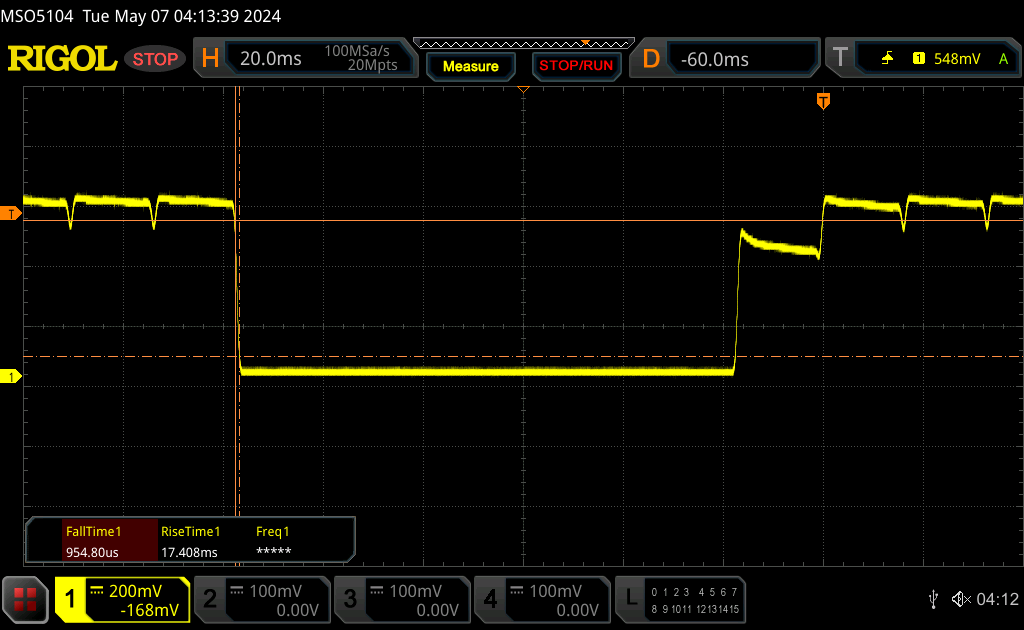 |
| ↘ 0.96 ms ősz | ||
| A képernyő tesztjeinkben nagyon gyors reakciósebességet mutatott, és nagyon jól használható gyors tempójú játékokhoz. Összehasonlításképpen, az összes tesztelt eszköz 0.1 (minimum) és 240 (maximum) ms között mozog. » 10 % of all devices are better. Ez azt jelenti, hogy a mért válaszidő jobb, mint az összes vizsgált eszköz átlaga (19.9 ms). | ||
| ↔ Válaszidő 50% szürke és 80% szürke között | ||
| 1.7 ms ... emelkedés és süllyedés ↘ kombinálva | ↗ 0.88 ms emelkedés | 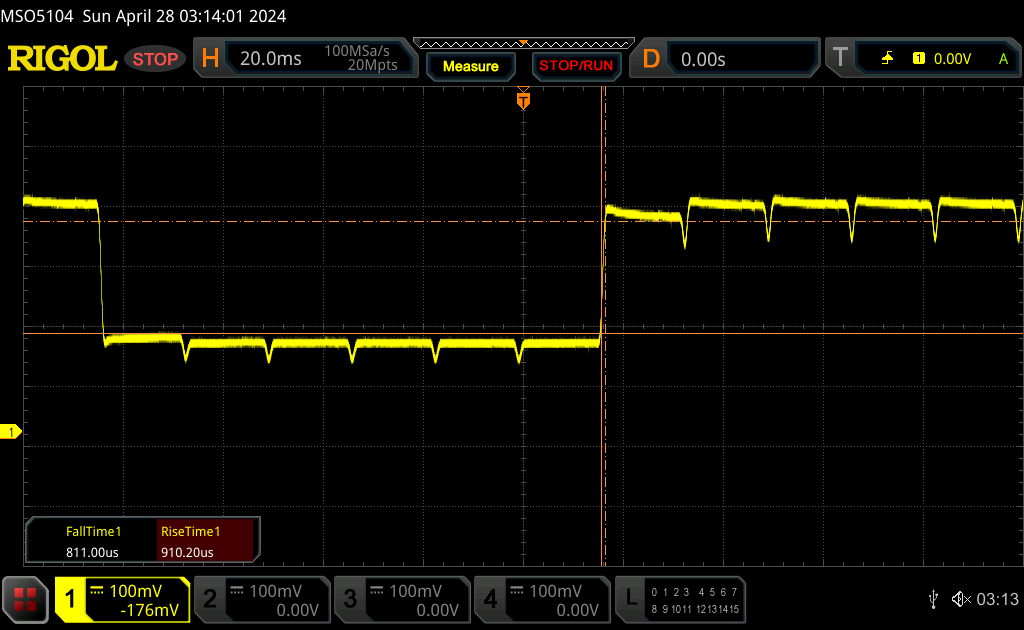 |
| ↘ 0.82 ms ősz | ||
| A képernyő tesztjeinkben nagyon gyors reakciósebességet mutatott, és nagyon jól használható gyors tempójú játékokhoz. Összehasonlításképpen, az összes tesztelt eszköz 0.165 (minimum) és 636 (maximum) ms között mozog. » 8 % of all devices are better. Ez azt jelenti, hogy a mért válaszidő jobb, mint az összes vizsgált eszköz átlaga (31.1 ms). | ||
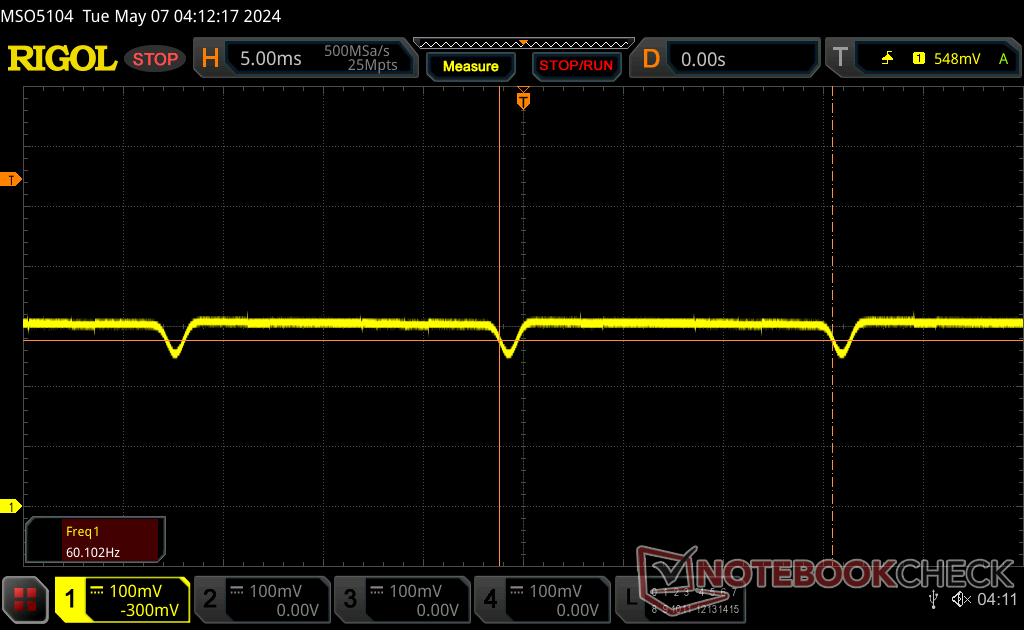
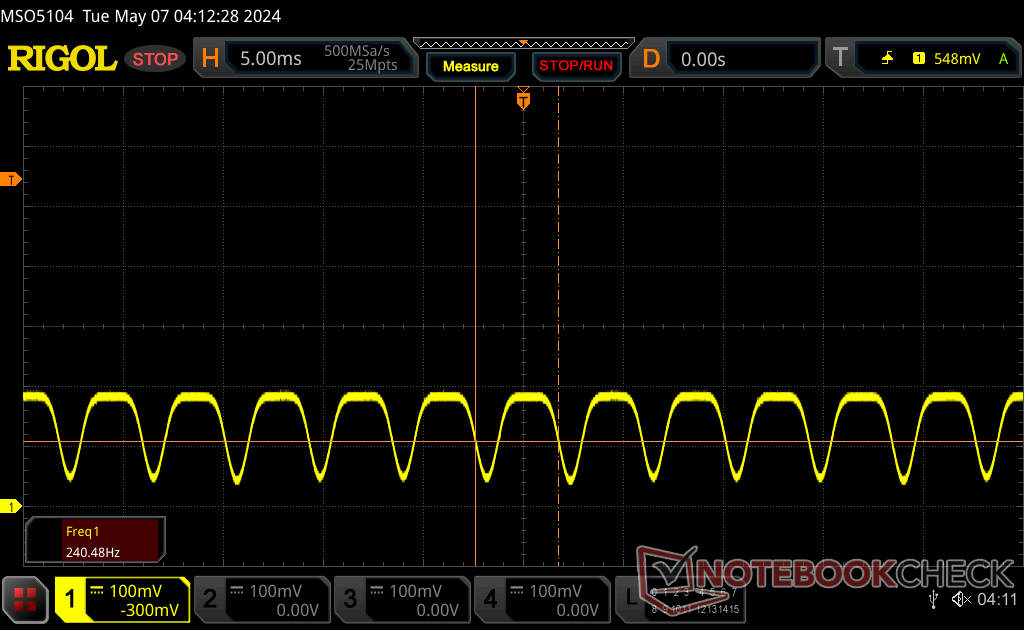
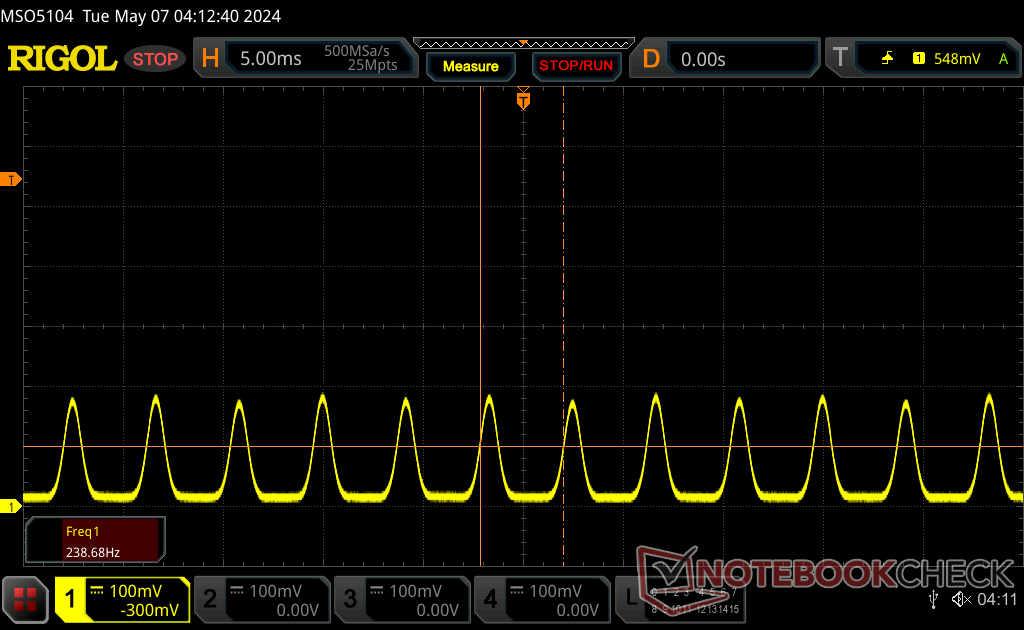
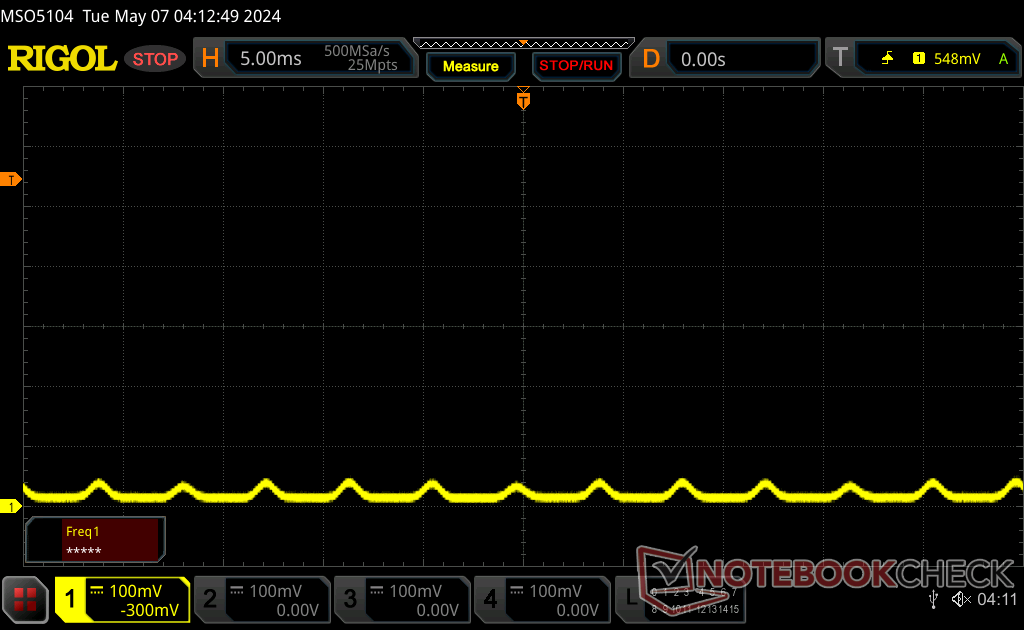
Képernyő villogása / PWM (impulzusszélesség-moduláció)
| Képernyő villogása / PWM észlelve | 60 Hz | ≤ 100 % fényerő beállítása | 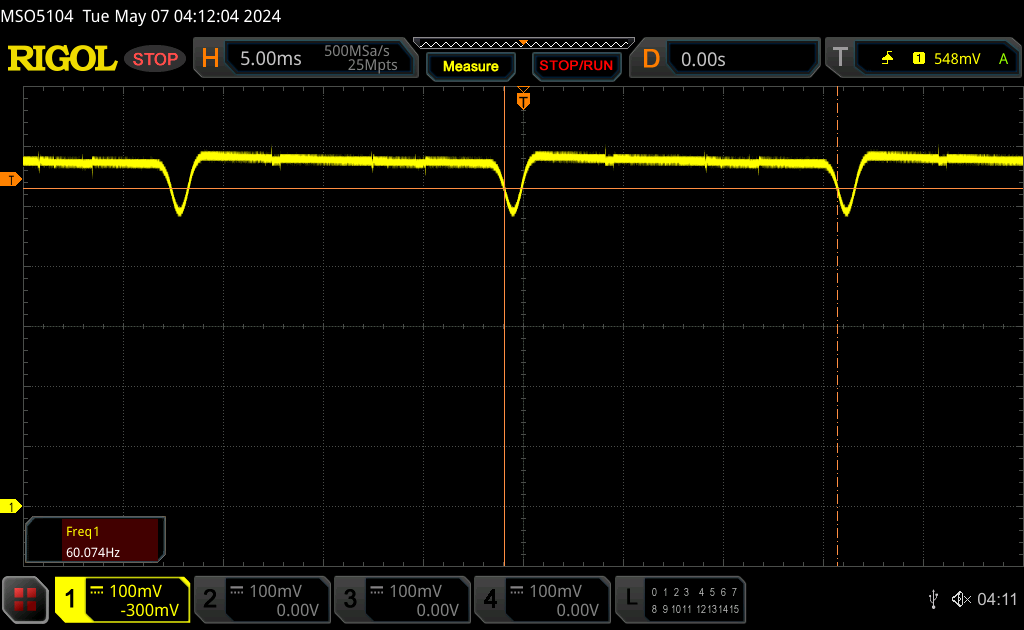 |
A kijelző háttérvilágítása 60 Hz-en villog (a legrosszabb esetben, pl. PWM használatával) Villódzás észlelve a 100 % vagy annál kisebb fényerő-beállításnál. E fényerő-beállítás felett nem lehet villogás vagy PWM. A 60 Hz frekvenciája nagyon alacsony, így a villogás hosszabb használat után szemfájdalmat és fejfájást okozhat. Összehasonlításképpen: az összes tesztelt eszköz 52 %-a nem használja a PWM-et a kijelző elsötétítésére. Ha PWM-et észleltek, akkor átlagosan 7784 (minimum: 5 - maximum: 343500) Hz-t mértek. | |||

Teljesítmény
Vizsgálati feltételek
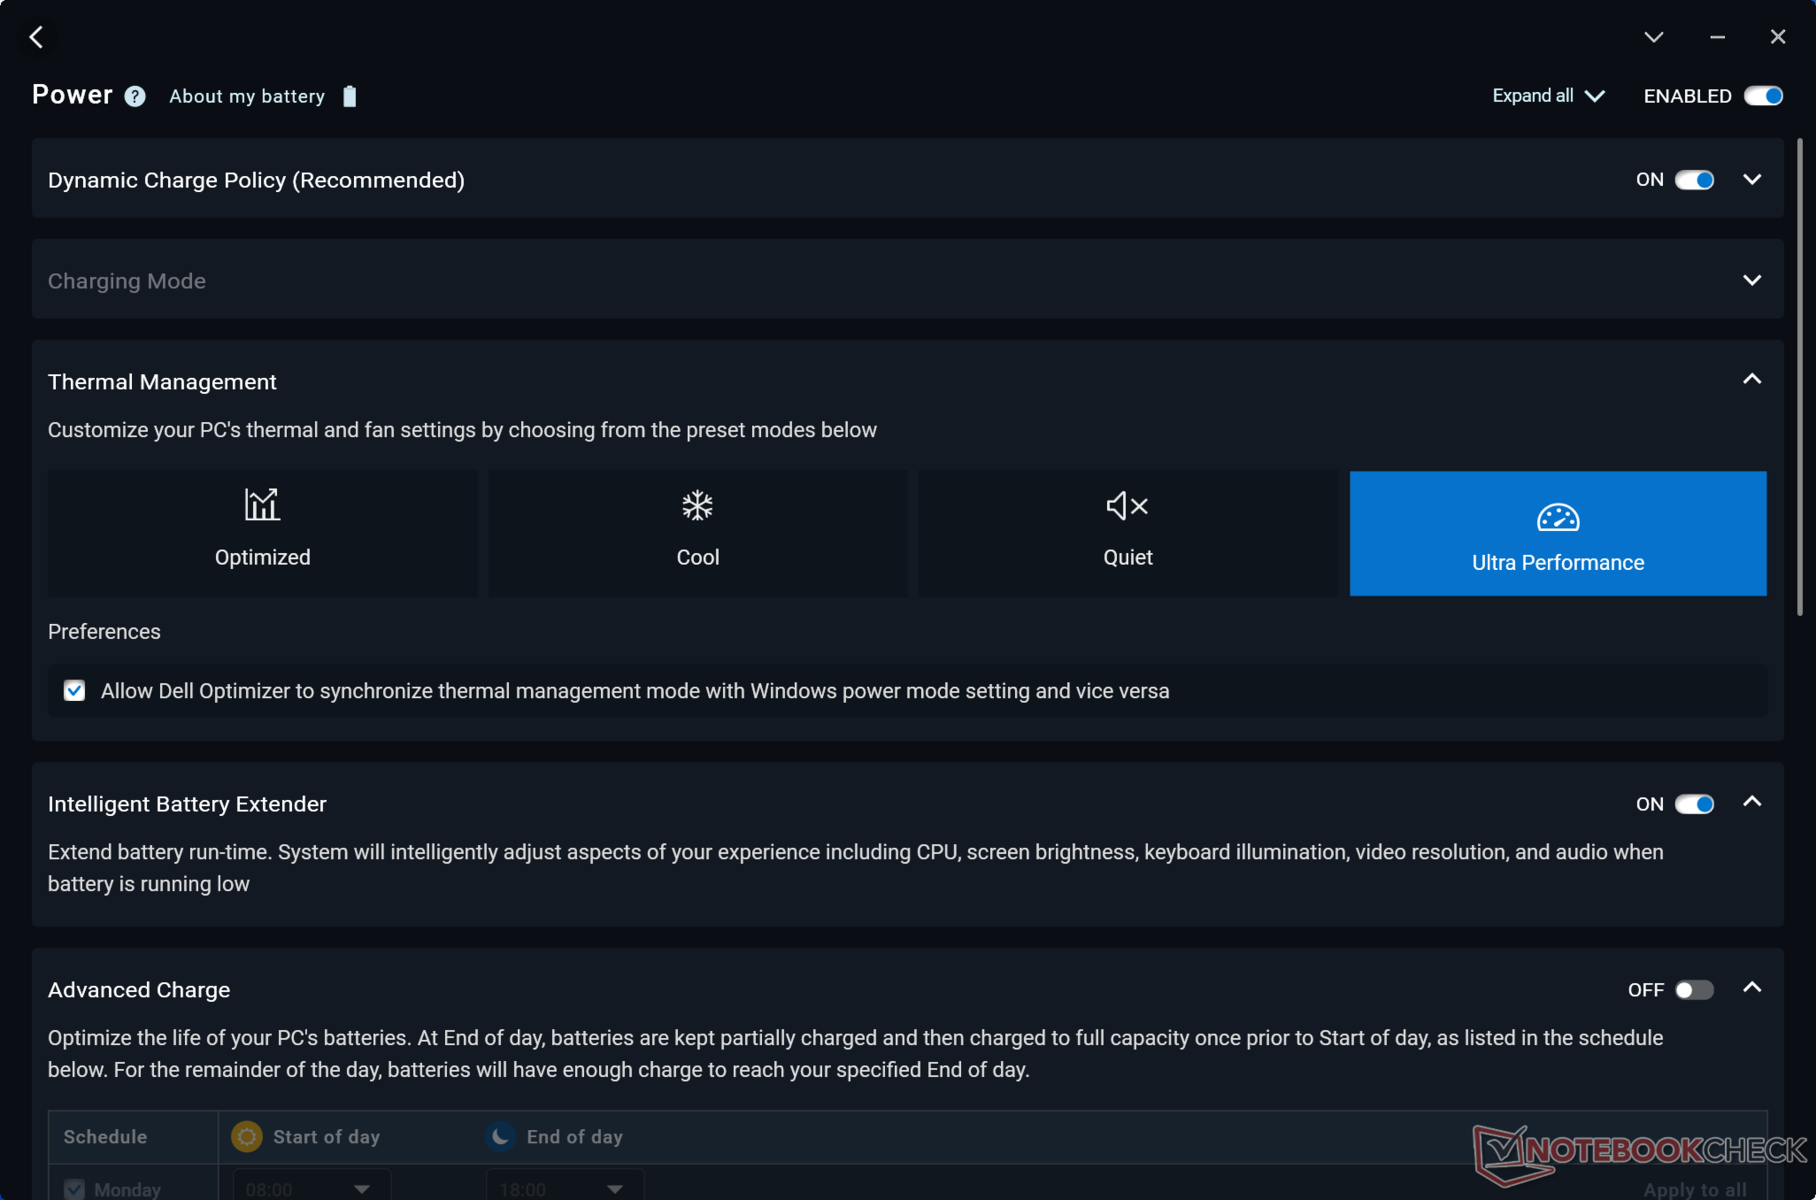
Az alábbi benchmarkok futtatása előtt a Dell Optimizer-t Ultra Performance módba állítottuk. Az ECC VRAM-ot is kikapcsoltuk az Nvidia Control Panel segítségével. Az ECC VRAM bekapcsolása körülbelül 1 GB-tal csökkenti az elérhető memóriát.

Processzor
A Core Ultra 9 185H szinte azonos teljesítményt nyújt a Core i9-13900H mind az egy-, mind a többszálas munkamenetekben. A Turbo Boostnak ugyan nagyobb hasznát veszi a gyorsabb kezdeti sebességkitörés érdekében, de ez az előny csak átmeneti, mielőtt a régebbi Core i9 Precision 5680 teljesítményszintre kerülne, amint azt az alábbi összehasonlító grafikon is mutatja.
Visszaminősítés a Core Ultra 7 165H-ra és Ultra 5 135H-ra várhatóan 5-10 százalékkal, illetve 40-50 százalékkal befolyásolja a processzor teljesítményét, ami azt jelenti, hogy a Core Ultra 5 és az Ultra 7 között lényegesen nagyobb a teljesítménykülönbség, mint a Core Ultra 7 és az Ultra 9 között. A Precision 5690 nem tartalmaz 14. generációs Raptor Lake-HX CPU-kat, amelyek a Core Ultra 9 185H-nál is gyorsabban növelték volna a teljesítményt. Cserébe viszont a Core Ultra CPU-k integrált NPU-kat tartalmaznak a helyi AI feladatok gyorsítására, ha azok a közeljövőben elérhetőbbé válnak.
Cinebench R15 Multi Loop
Cinebench R23: Multi Core | Single Core
Cinebench R20: CPU (Multi Core) | CPU (Single Core)
Cinebench R15: CPU Multi 64Bit | CPU Single 64Bit
Blender: v2.79 BMW27 CPU
7-Zip 18.03: 7z b 4 | 7z b 4 -mmt1
Geekbench 6.7: Multi-Core | Single-Core
Geekbench 5.5: Multi-Core | Single-Core
HWBOT x265 Benchmark v2.2: 4k Preset
LibreOffice : 20 Documents To PDF
R Benchmark 2.5: Overall mean
| CPU Performance rating | |
| Lenovo Legion Pro 7 RTX4090 -2! | |
| HP ZBook Fury 16 G10 | |
| Dell Precision 5000 5680 | |
| Lenovo ThinkPad P1 G6-21FV000DGE | |
| Lenovo ThinkPad P16 G2 21FA000FGE -2! | |
| Dell Precision 5690 | |
| Dell XPS 16 9640 | |
| HP ZBook Fury 16 G9 -2! | |
| Átlagos Intel Core Ultra 9 185H | |
| Lenovo ThinkPad P16 G1 21D6001DMB -2! | |
| MSI CreatorPro Z16P B12UKST -2! | |
| Lenovo ThinkPad P16v G1 AMD | |
| Lenovo ThinkPad P16s G2 21K9000CGE | |
| Samsung Galaxy Book4 Pro 360 -1! | |
| Asus ProArt StudioBook 16 W7600H5A-2BL2 -2! | |
| Lenovo ThinkPad P1 G4-20Y30017GE -2! | |
| Cinebench R23 / Multi Core | |
| Lenovo Legion Pro 7 RTX4090 | |
| HP ZBook Fury 16 G10 | |
| Lenovo ThinkPad P16 G2 21FA000FGE | |
| Dell Precision 5690 | |
| HP ZBook Fury 16 G9 | |
| Dell Precision 5000 5680 | |
| Lenovo ThinkPad P1 G6-21FV000DGE | |
| Dell XPS 16 9640 | |
| Lenovo ThinkPad P16 G1 21D6001DMB | |
| Átlagos Intel Core Ultra 9 185H (11072 - 19851, n=20) | |
| MSI CreatorPro Z16P B12UKST | |
| Lenovo ThinkPad P16s G2 21K9000CGE | |
| Lenovo ThinkPad P16v G1 AMD | |
| Asus ProArt StudioBook 16 W7600H5A-2BL2 | |
| Samsung Galaxy Book4 Pro 360 | |
| Lenovo ThinkPad P1 G4-20Y30017GE | |
| Cinebench R23 / Single Core | |
| HP ZBook Fury 16 G10 | |
| Lenovo Legion Pro 7 RTX4090 | |
| Lenovo ThinkPad P1 G6-21FV000DGE | |
| Dell Precision 5000 5680 | |
| HP ZBook Fury 16 G9 | |
| Lenovo ThinkPad P16 G2 21FA000FGE | |
| Dell Precision 5690 | |
| Lenovo ThinkPad P16 G1 21D6001DMB | |
| Dell XPS 16 9640 | |
| Átlagos Intel Core Ultra 9 185H (1166 - 1912, n=20) | |
| MSI CreatorPro Z16P B12UKST | |
| Lenovo ThinkPad P16s G2 21K9000CGE | |
| Samsung Galaxy Book4 Pro 360 | |
| Lenovo ThinkPad P16v G1 AMD | |
| Asus ProArt StudioBook 16 W7600H5A-2BL2 | |
| Lenovo ThinkPad P1 G4-20Y30017GE | |
| Cinebench R20 / CPU (Multi Core) | |
| Lenovo Legion Pro 7 RTX4090 | |
| HP ZBook Fury 16 G10 | |
| Lenovo ThinkPad P16 G2 21FA000FGE | |
| Dell Precision 5690 | |
| HP ZBook Fury 16 G9 | |
| Dell Precision 5000 5680 | |
| Dell XPS 16 9640 | |
| Lenovo ThinkPad P1 G6-21FV000DGE | |
| Lenovo ThinkPad P16 G1 21D6001DMB | |
| MSI CreatorPro Z16P B12UKST | |
| Átlagos Intel Core Ultra 9 185H (4198 - 7651, n=20) | |
| Lenovo ThinkPad P16s G2 21K9000CGE | |
| Lenovo ThinkPad P16v G1 AMD | |
| Asus ProArt StudioBook 16 W7600H5A-2BL2 | |
| Samsung Galaxy Book4 Pro 360 | |
| Lenovo ThinkPad P1 G4-20Y30017GE | |
| Cinebench R20 / CPU (Single Core) | |
| HP ZBook Fury 16 G10 | |
| Lenovo ThinkPad P1 G6-21FV000DGE | |
| Dell Precision 5000 5680 | |
| Lenovo Legion Pro 7 RTX4090 | |
| HP ZBook Fury 16 G9 | |
| Lenovo ThinkPad P16 G2 21FA000FGE | |
| Lenovo ThinkPad P16 G1 21D6001DMB | |
| Dell Precision 5690 | |
| Átlagos Intel Core Ultra 9 185H (442 - 735, n=20) | |
| MSI CreatorPro Z16P B12UKST | |
| Dell XPS 16 9640 | |
| Lenovo ThinkPad P16s G2 21K9000CGE | |
| Samsung Galaxy Book4 Pro 360 | |
| Lenovo ThinkPad P16v G1 AMD | |
| Asus ProArt StudioBook 16 W7600H5A-2BL2 | |
| Lenovo ThinkPad P1 G4-20Y30017GE | |
| Cinebench R15 / CPU Multi 64Bit | |
| Lenovo Legion Pro 7 RTX4090 | |
| HP ZBook Fury 16 G10 | |
| Dell Precision 5690 | |
| Lenovo ThinkPad P16 G2 21FA000FGE | |
| Lenovo ThinkPad P16 G1 21D6001DMB | |
| Dell XPS 16 9640 | |
| Átlagos Intel Core Ultra 9 185H (1582 - 3165, n=22) | |
| Lenovo ThinkPad P1 G6-21FV000DGE | |
| HP ZBook Fury 16 G9 | |
| Lenovo ThinkPad P16s G2 21K9000CGE | |
| Lenovo ThinkPad P16v G1 AMD | |
| Dell Precision 5000 5680 | |
| MSI CreatorPro Z16P B12UKST | |
| Asus ProArt StudioBook 16 W7600H5A-2BL2 | |
| Samsung Galaxy Book4 Pro 360 | |
| Lenovo ThinkPad P1 G4-20Y30017GE | |
| Cinebench R15 / CPU Single 64Bit | |
| HP ZBook Fury 16 G10 | |
| Lenovo Legion Pro 7 RTX4090 | |
| Dell Precision 5000 5680 | |
| Lenovo ThinkPad P1 G6-21FV000DGE | |
| Lenovo ThinkPad P16 G2 21FA000FGE | |
| Dell Precision 5690 | |
| Lenovo ThinkPad P16 G1 21D6001DMB | |
| Lenovo ThinkPad P16s G2 21K9000CGE | |
| Lenovo ThinkPad P16v G1 AMD | |
| Átlagos Intel Core Ultra 9 185H (191.9 - 281, n=20) | |
| Dell XPS 16 9640 | |
| Samsung Galaxy Book4 Pro 360 | |
| MSI CreatorPro Z16P B12UKST | |
| Asus ProArt StudioBook 16 W7600H5A-2BL2 | |
| Lenovo ThinkPad P1 G4-20Y30017GE | |
| HP ZBook Fury 16 G9 | |
| Blender / v2.79 BMW27 CPU | |
| Samsung Galaxy Book4 Pro 360 | |
| Lenovo ThinkPad P1 G4-20Y30017GE | |
| Asus ProArt StudioBook 16 W7600H5A-2BL2 | |
| Lenovo ThinkPad P16s G2 21K9000CGE | |
| Dell Precision 5690 | |
| Lenovo ThinkPad P16v G1 AMD | |
| MSI CreatorPro Z16P B12UKST | |
| Dell Precision 5000 5680 | |
| Átlagos Intel Core Ultra 9 185H (163 - 285, n=20) | |
| Lenovo ThinkPad P1 G6-21FV000DGE | |
| Lenovo ThinkPad P16 G1 21D6001DMB | |
| Dell XPS 16 9640 | |
| HP ZBook Fury 16 G9 | |
| Lenovo ThinkPad P16 G2 21FA000FGE | |
| HP ZBook Fury 16 G10 | |
| Lenovo Legion Pro 7 RTX4090 | |
| 7-Zip 18.03 / 7z b 4 | |
| Lenovo Legion Pro 7 RTX4090 | |
| HP ZBook Fury 16 G10 | |
| Lenovo ThinkPad P16 G2 21FA000FGE | |
| HP ZBook Fury 16 G9 | |
| Dell Precision 5690 | |
| Lenovo ThinkPad P1 G6-21FV000DGE | |
| Dell Precision 5000 5680 | |
| Dell XPS 16 9640 | |
| Lenovo ThinkPad P16 G1 21D6001DMB | |
| Átlagos Intel Core Ultra 9 185H (51289 - 76331, n=20) | |
| MSI CreatorPro Z16P B12UKST | |
| Lenovo ThinkPad P16v G1 AMD | |
| Lenovo ThinkPad P16s G2 21K9000CGE | |
| Asus ProArt StudioBook 16 W7600H5A-2BL2 | |
| Lenovo ThinkPad P1 G4-20Y30017GE | |
| 7-Zip 18.03 / 7z b 4 -mmt1 | |
| Lenovo Legion Pro 7 RTX4090 | |
| HP ZBook Fury 16 G10 | |
| Lenovo ThinkPad P1 G6-21FV000DGE | |
| Lenovo ThinkPad P16v G1 AMD | |
| Lenovo ThinkPad P16 G2 21FA000FGE | |
| Dell Precision 5000 5680 | |
| HP ZBook Fury 16 G9 | |
| Lenovo ThinkPad P16 G1 21D6001DMB | |
| Lenovo ThinkPad P16s G2 21K9000CGE | |
| MSI CreatorPro Z16P B12UKST | |
| Lenovo ThinkPad P1 G4-20Y30017GE | |
| Dell XPS 16 9640 | |
| Átlagos Intel Core Ultra 9 185H (4199 - 5781, n=20) | |
| Asus ProArt StudioBook 16 W7600H5A-2BL2 | |
| Samsung Galaxy Book4 Pro 360 | |
| Dell Precision 5690 | |
| Geekbench 6.7 / Multi-Core | |
| HP ZBook Fury 16 G10 | |
| Dell Precision 5000 5680 | |
| Dell Precision 5690 | |
| Dell XPS 16 9640 | |
| Átlagos Intel Core Ultra 9 185H (9140 - 14540, n=20) | |
| Lenovo ThinkPad P1 G6-21FV000DGE | |
| Lenovo ThinkPad P16s G2 21K9000CGE | |
| Samsung Galaxy Book4 Pro 360 | |
| Lenovo ThinkPad P16v G1 AMD | |
| Geekbench 6.7 / Single-Core | |
| HP ZBook Fury 16 G10 | |
| Lenovo ThinkPad P1 G6-21FV000DGE | |
| Dell Precision 5000 5680 | |
| Lenovo ThinkPad P16v G1 AMD | |
| Dell Precision 5690 | |
| Lenovo ThinkPad P16s G2 21K9000CGE | |
| Dell XPS 16 9640 | |
| Átlagos Intel Core Ultra 9 185H (1490 - 2573, n=20) | |
| Samsung Galaxy Book4 Pro 360 | |
| Geekbench 5.5 / Multi-Core | |
| Lenovo Legion Pro 7 RTX4090 | |
| HP ZBook Fury 16 G10 | |
| Dell Precision 5000 5680 | |
| Lenovo ThinkPad P16 G2 21FA000FGE | |
| Dell Precision 5690 | |
| HP ZBook Fury 16 G9 | |
| Dell XPS 16 9640 | |
| Átlagos Intel Core Ultra 9 185H (9330 - 14230, n=20) | |
| Lenovo ThinkPad P16 G1 21D6001DMB | |
| MSI CreatorPro Z16P B12UKST | |
| Lenovo ThinkPad P1 G6-21FV000DGE | |
| Lenovo ThinkPad P16s G2 21K9000CGE | |
| Lenovo ThinkPad P16v G1 AMD | |
| Samsung Galaxy Book4 Pro 360 | |
| Asus ProArt StudioBook 16 W7600H5A-2BL2 | |
| Lenovo ThinkPad P1 G4-20Y30017GE | |
| Geekbench 5.5 / Single-Core | |
| HP ZBook Fury 16 G10 | |
| Dell Precision 5000 5680 | |
| Lenovo Legion Pro 7 RTX4090 | |
| Lenovo ThinkPad P1 G6-21FV000DGE | |
| HP ZBook Fury 16 G9 | |
| Lenovo ThinkPad P16 G2 21FA000FGE | |
| Dell Precision 5690 | |
| Lenovo ThinkPad P16v G1 AMD | |
| MSI CreatorPro Z16P B12UKST | |
| Lenovo ThinkPad P16 G1 21D6001DMB | |
| Dell XPS 16 9640 | |
| Átlagos Intel Core Ultra 9 185H (986 - 1902, n=20) | |
| Lenovo ThinkPad P16s G2 21K9000CGE | |
| Samsung Galaxy Book4 Pro 360 | |
| Lenovo ThinkPad P1 G4-20Y30017GE | |
| Asus ProArt StudioBook 16 W7600H5A-2BL2 | |
| HWBOT x265 Benchmark v2.2 / 4k Preset | |
| Lenovo Legion Pro 7 RTX4090 | |
| HP ZBook Fury 16 G10 | |
| Lenovo ThinkPad P16 G2 21FA000FGE | |
| Dell Precision 5690 | |
| Dell XPS 16 9640 | |
| Dell Precision 5000 5680 | |
| HP ZBook Fury 16 G9 | |
| Átlagos Intel Core Ultra 9 185H (13.7 - 22.7, n=20) | |
| MSI CreatorPro Z16P B12UKST | |
| Lenovo ThinkPad P1 G6-21FV000DGE | |
| Lenovo ThinkPad P16v G1 AMD | |
| Lenovo ThinkPad P16s G2 21K9000CGE | |
| Lenovo ThinkPad P16 G1 21D6001DMB | |
| Asus ProArt StudioBook 16 W7600H5A-2BL2 | |
| Lenovo ThinkPad P1 G4-20Y30017GE | |
| Samsung Galaxy Book4 Pro 360 | |
| LibreOffice / 20 Documents To PDF | |
| Lenovo ThinkPad P16s G2 21K9000CGE | |
| Lenovo ThinkPad P1 G4-20Y30017GE | |
| Lenovo ThinkPad P16 G2 21FA000FGE | |
| Lenovo ThinkPad P1 G6-21FV000DGE | |
| Lenovo ThinkPad P16 G1 21D6001DMB | |
| Átlagos Intel Core Ultra 9 185H (34.5 - 73.5, n=20) | |
| Lenovo ThinkPad P16v G1 AMD | |
| Dell XPS 16 9640 | |
| HP ZBook Fury 16 G10 | |
| Samsung Galaxy Book4 Pro 360 | |
| Dell Precision 5690 | |
| Lenovo Legion Pro 7 RTX4090 | |
| Dell Precision 5000 5680 | |
| MSI CreatorPro Z16P B12UKST | |
| HP ZBook Fury 16 G9 | |
| Asus ProArt StudioBook 16 W7600H5A-2BL2 | |
| R Benchmark 2.5 / Overall mean | |
| Lenovo ThinkPad P1 G4-20Y30017GE | |
| Asus ProArt StudioBook 16 W7600H5A-2BL2 | |
| Samsung Galaxy Book4 Pro 360 | |
| Dell XPS 16 9640 | |
| Átlagos Intel Core Ultra 9 185H (0.4313 - 0.759, n=21) | |
| Lenovo ThinkPad P16s G2 21K9000CGE | |
| Dell Precision 5690 | |
| MSI CreatorPro Z16P B12UKST | |
| Lenovo ThinkPad P16 G1 21D6001DMB | |
| Lenovo ThinkPad P16 G2 21FA000FGE | |
| Lenovo ThinkPad P16v G1 AMD | |
| HP ZBook Fury 16 G9 | |
| Lenovo ThinkPad P1 G6-21FV000DGE | |
| Dell Precision 5000 5680 | |
| Lenovo Legion Pro 7 RTX4090 | |
| HP ZBook Fury 16 G10 | |
Cinebench R23: Multi Core | Single Core
Cinebench R20: CPU (Multi Core) | CPU (Single Core)
Cinebench R15: CPU Multi 64Bit | CPU Single 64Bit
Blender: v2.79 BMW27 CPU
7-Zip 18.03: 7z b 4 | 7z b 4 -mmt1
Geekbench 6.7: Multi-Core | Single-Core
Geekbench 5.5: Multi-Core | Single-Core
HWBOT x265 Benchmark v2.2: 4k Preset
LibreOffice : 20 Documents To PDF
R Benchmark 2.5: Overall mean
* ... a kisebb jobb
AIDA64: FP32 Ray-Trace | FPU Julia | CPU SHA3 | CPU Queen | FPU SinJulia | FPU Mandel | CPU AES | CPU ZLib | FP64 Ray-Trace | CPU PhotoWorxx
| Performance rating | |
| HP ZBook Fury 16 G10 | |
| Dell Precision 5690 | |
| Lenovo ThinkPad P16 G2 21FA000FGE | |
| Átlagos Intel Core Ultra 9 185H | |
| Dell Precision 5000 5680 | |
| MSI CreatorPro Z16P B12UKST | |
| Lenovo ThinkPad P1 G6-21FV000DGE | |
| AIDA64 / FP32 Ray-Trace | |
| HP ZBook Fury 16 G10 | |
| Dell Precision 5690 | |
| Lenovo ThinkPad P16 G2 21FA000FGE | |
| Lenovo ThinkPad P1 G6-21FV000DGE | |
| Átlagos Intel Core Ultra 9 185H (9220 - 18676, n=20) | |
| Dell Precision 5000 5680 | |
| MSI CreatorPro Z16P B12UKST | |
| AIDA64 / FPU Julia | |
| HP ZBook Fury 16 G10 | |
| Dell Precision 5690 | |
| Lenovo ThinkPad P16 G2 21FA000FGE | |
| Lenovo ThinkPad P1 G6-21FV000DGE | |
| Átlagos Intel Core Ultra 9 185H (48865 - 96463, n=20) | |
| Dell Precision 5000 5680 | |
| MSI CreatorPro Z16P B12UKST | |
| AIDA64 / CPU SHA3 | |
| HP ZBook Fury 16 G10 | |
| Dell Precision 5690 | |
| Lenovo ThinkPad P16 G2 21FA000FGE | |
| Átlagos Intel Core Ultra 9 185H (2394 - 4534, n=20) | |
| Lenovo ThinkPad P1 G6-21FV000DGE | |
| MSI CreatorPro Z16P B12UKST | |
| Dell Precision 5000 5680 | |
| AIDA64 / CPU Queen | |
| HP ZBook Fury 16 G10 | |
| Dell Precision 5000 5680 | |
| Lenovo ThinkPad P1 G6-21FV000DGE | |
| Lenovo ThinkPad P16 G2 21FA000FGE | |
| MSI CreatorPro Z16P B12UKST | |
| Dell Precision 5690 | |
| Átlagos Intel Core Ultra 9 185H (66785 - 95241, n=20) | |
| AIDA64 / FPU SinJulia | |
| HP ZBook Fury 16 G10 | |
| Lenovo ThinkPad P16 G2 21FA000FGE | |
| Dell Precision 5690 | |
| Átlagos Intel Core Ultra 9 185H (7255 - 11392, n=20) | |
| Lenovo ThinkPad P1 G6-21FV000DGE | |
| Dell Precision 5000 5680 | |
| MSI CreatorPro Z16P B12UKST | |
| AIDA64 / FPU Mandel | |
| HP ZBook Fury 16 G10 | |
| Dell Precision 5690 | |
| Lenovo ThinkPad P16 G2 21FA000FGE | |
| Átlagos Intel Core Ultra 9 185H (24004 - 48020, n=20) | |
| Lenovo ThinkPad P1 G6-21FV000DGE | |
| Dell Precision 5000 5680 | |
| MSI CreatorPro Z16P B12UKST | |
| AIDA64 / CPU AES | |
| MSI CreatorPro Z16P B12UKST | |
| HP ZBook Fury 16 G10 | |
| Átlagos Intel Core Ultra 9 185H (53116 - 154066, n=20) | |
| Dell Precision 5690 | |
| Lenovo ThinkPad P16 G2 21FA000FGE | |
| Lenovo ThinkPad P1 G6-21FV000DGE | |
| Dell Precision 5000 5680 | |
| AIDA64 / CPU ZLib | |
| HP ZBook Fury 16 G10 | |
| Dell Precision 5690 | |
| Átlagos Intel Core Ultra 9 185H (678 - 1341, n=20) | |
| Lenovo ThinkPad P16 G2 21FA000FGE | |
| Lenovo ThinkPad P1 G6-21FV000DGE | |
| MSI CreatorPro Z16P B12UKST | |
| Dell Precision 5000 5680 | |
| AIDA64 / FP64 Ray-Trace | |
| HP ZBook Fury 16 G10 | |
| Lenovo ThinkPad P16 G2 21FA000FGE | |
| Dell Precision 5690 | |
| Lenovo ThinkPad P1 G6-21FV000DGE | |
| Dell Precision 5000 5680 | |
| Átlagos Intel Core Ultra 9 185H (4428 - 10078, n=20) | |
| MSI CreatorPro Z16P B12UKST | |
| AIDA64 / CPU PhotoWorxx | |
| Dell Precision 5690 | |
| Átlagos Intel Core Ultra 9 185H (44547 - 53918, n=20) | |
| Dell Precision 5000 5680 | |
| MSI CreatorPro Z16P B12UKST | |
| HP ZBook Fury 16 G10 | |
| Lenovo ThinkPad P16 G2 21FA000FGE | |
| Lenovo ThinkPad P1 G6-21FV000DGE | |
Stressz teszt
A Prime95 stressz indításakor a CPU 3,7 GHz-re és 120 W-ra gyorsult, amíg néhány másodperccel később elérte a 100 C-os maghőmérsékletet. Ezután 3 GHz-re és 73 W-ra esett vissza, és végig viszonylag stabil maradt. Mind a maghőmérséklet, mind a csomag teljesítményfelvétele valamivel magasabb volt, mint amit a Precision 5680 esetében mértünk.
A GPU lap teljesítményfelvétele működés közben Witcher 3 stabilan 72 W-os volt, annak ellenére, hogy a GPU az Nvidia Control Centerben 90 W-os teljesítményként szerepel. Az eredmények hasonlóak ahhoz, amit a tavalyi modellnél rögzítettünk.
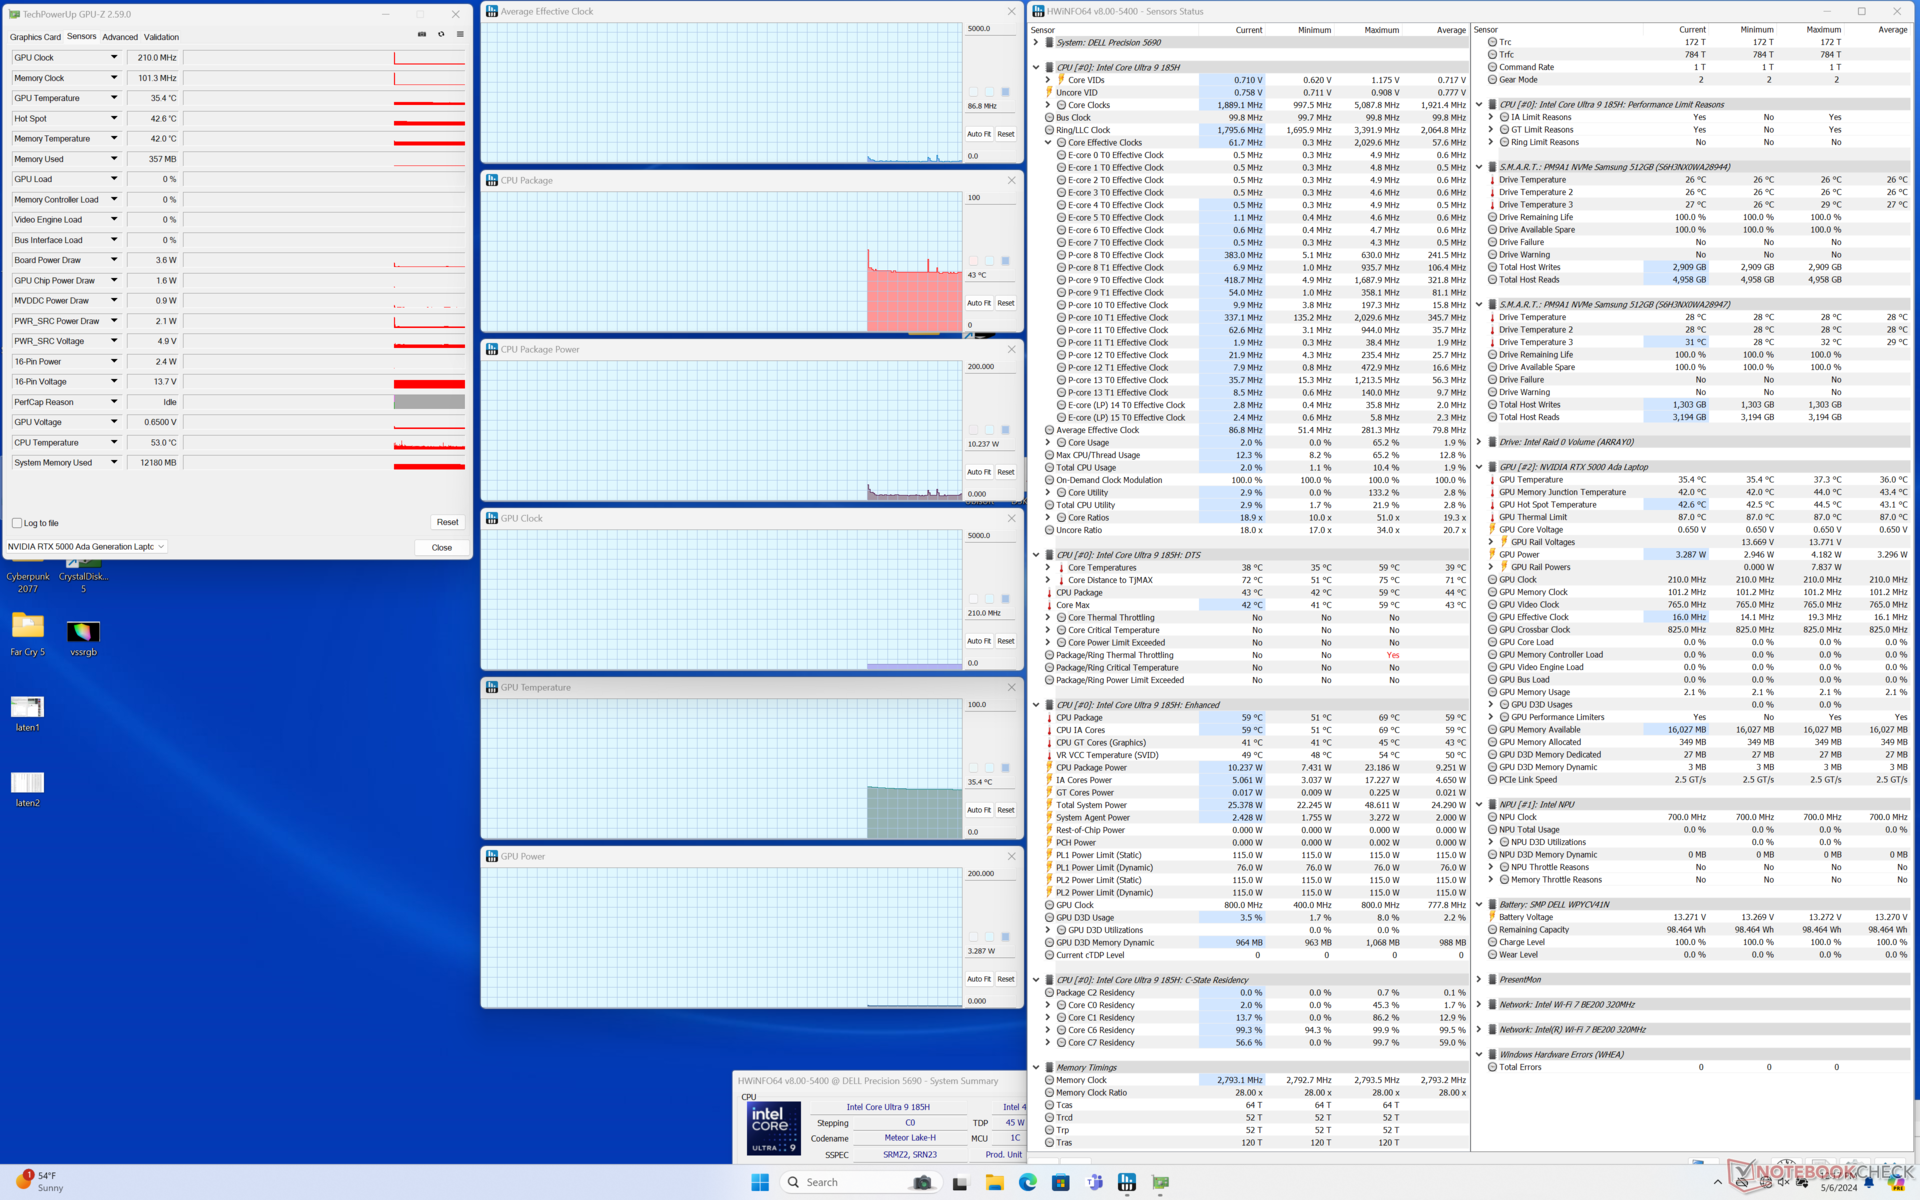
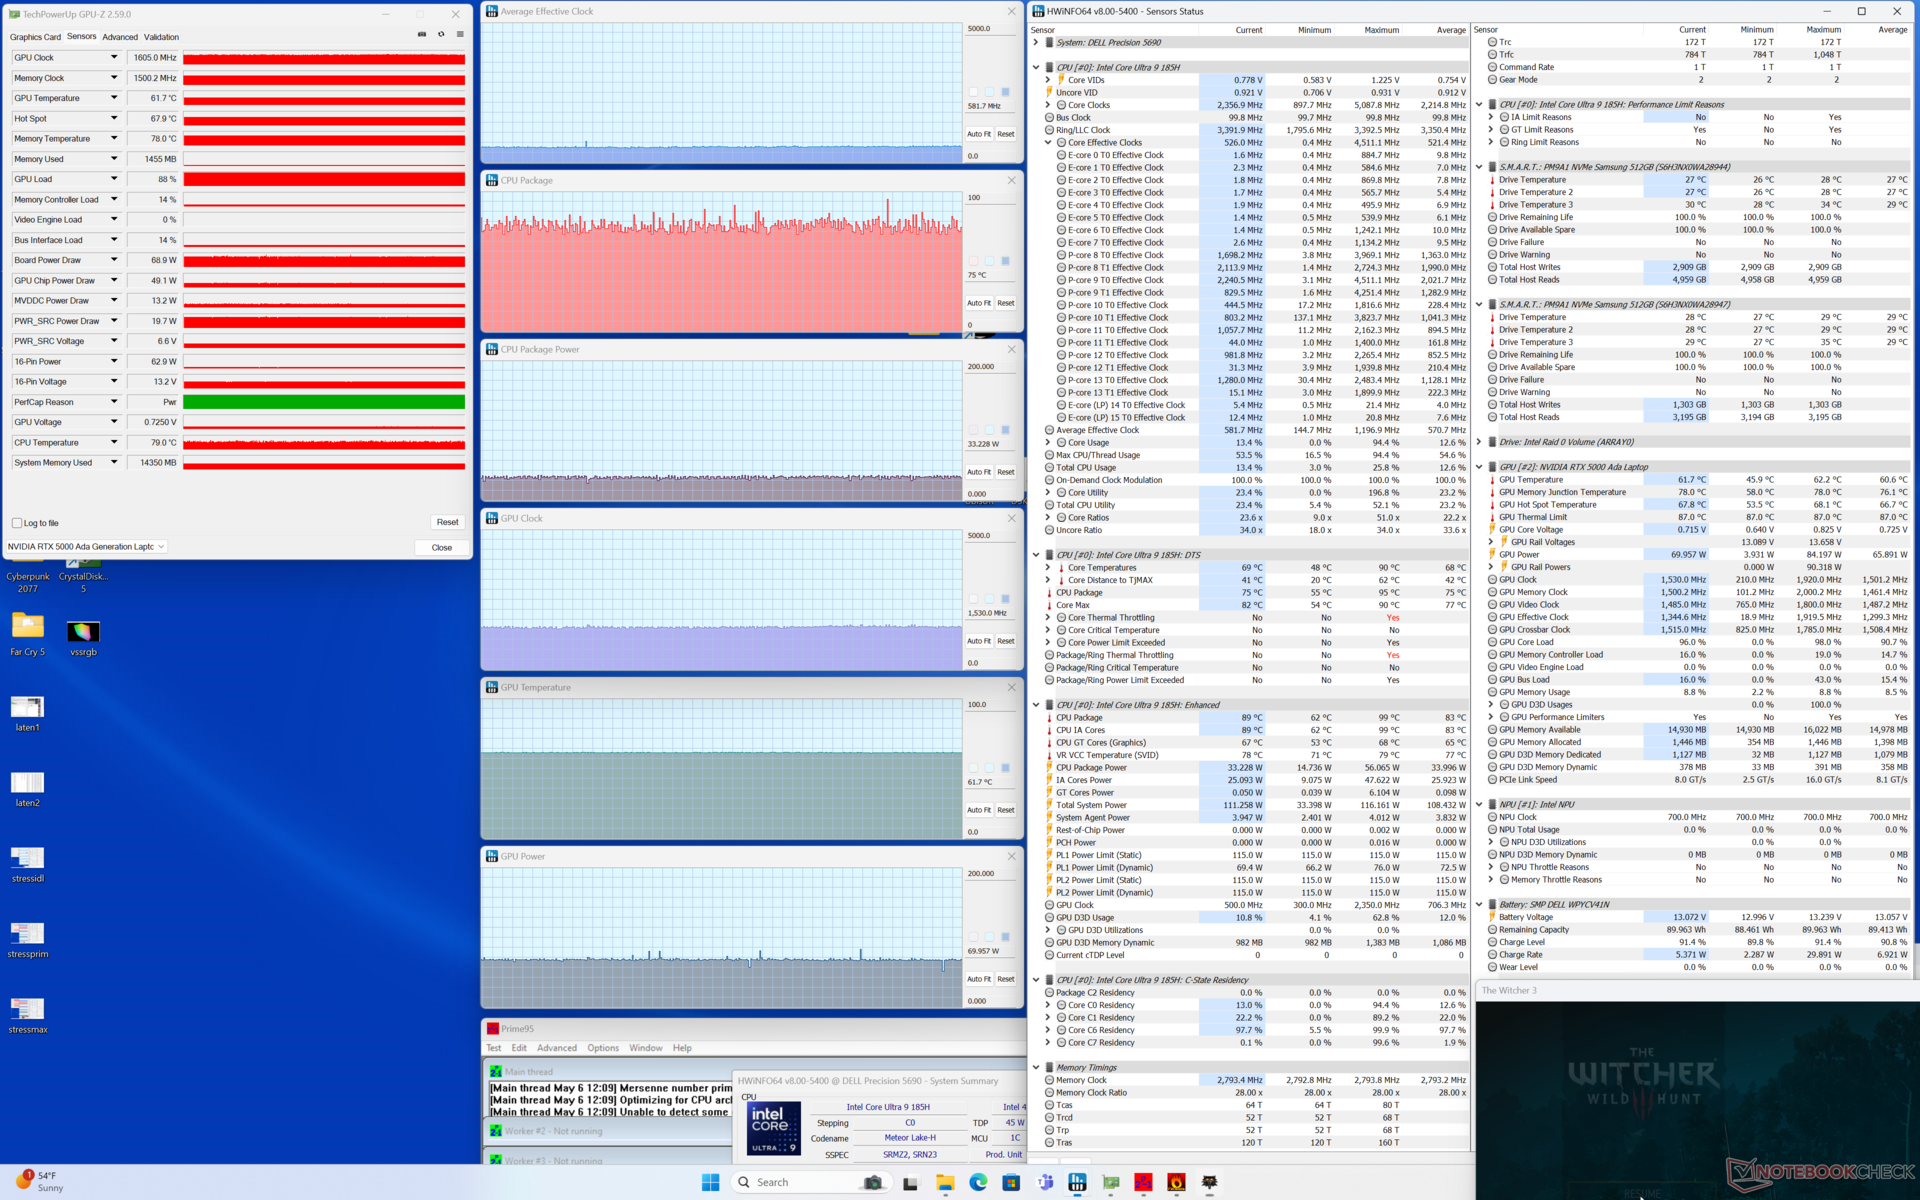
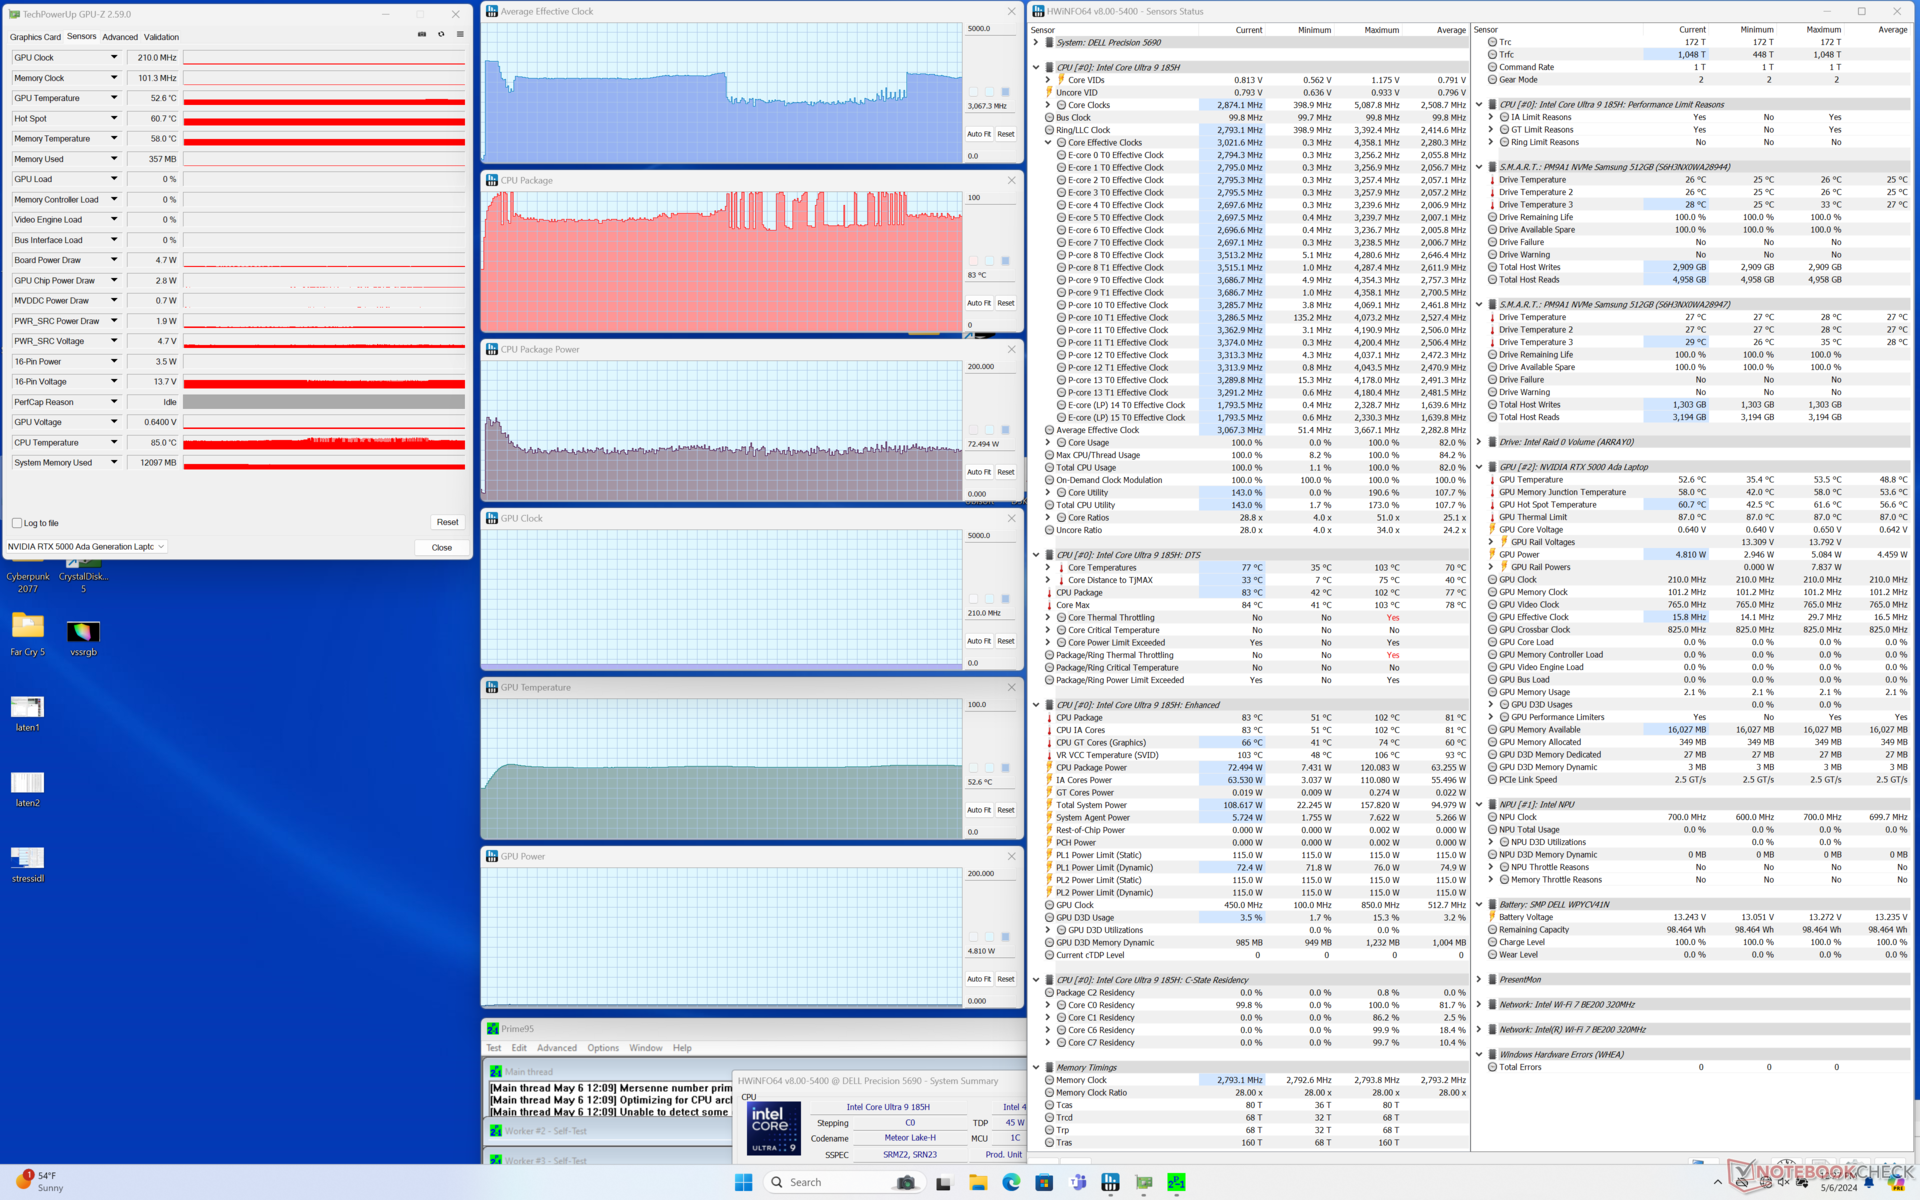
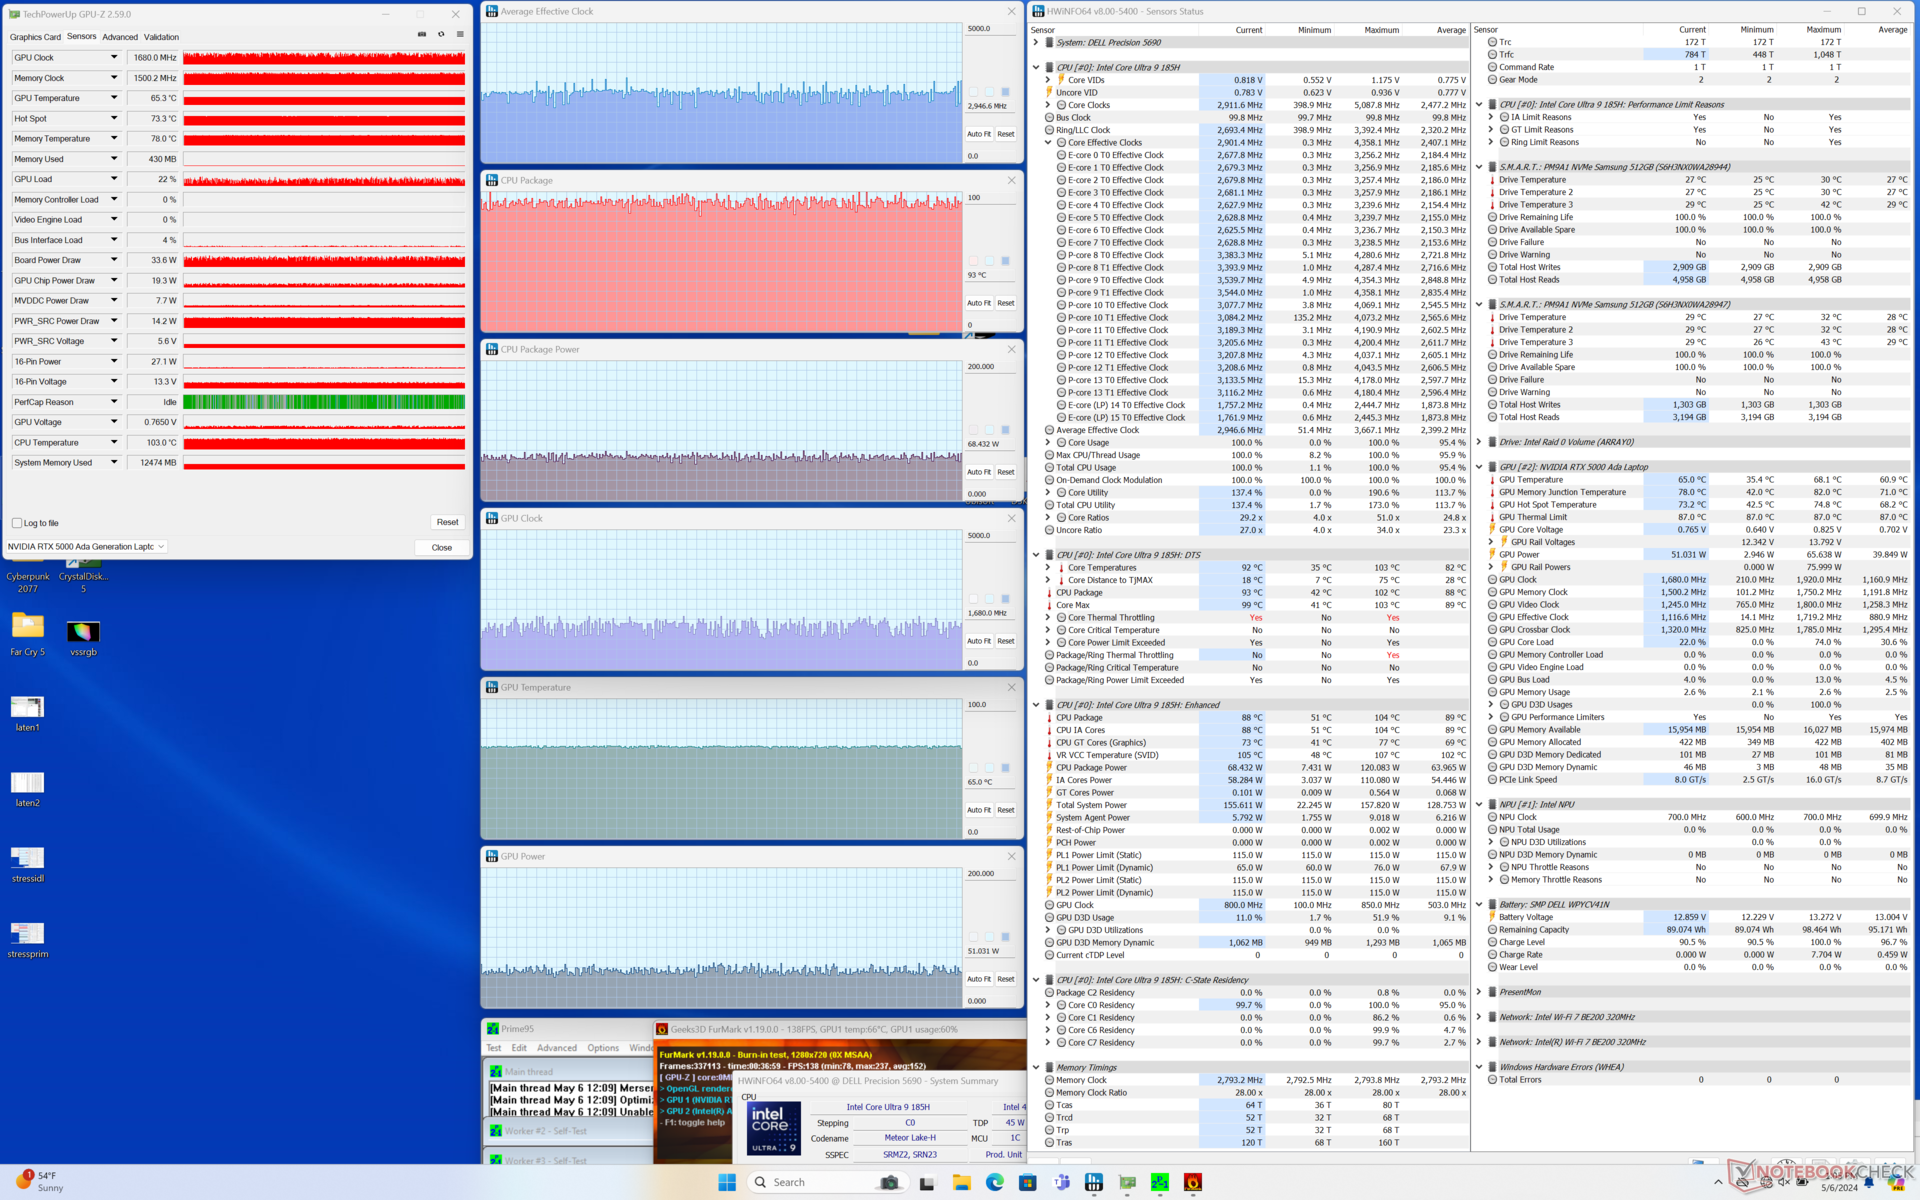
| CPU órajel (GHz) | GPU órajel (MHz) | CPU átlaghőmérséklet (°C) | GPU átlaghőmérséklet (°C) | |
| Rendszer üresjárat | -- | -- | 43 | 35 |
| Prime95 Stressz | 3.0 | -- | 83 | 53 |
| Prime95 + FurMark Stressz | ~3.0 | ~1680 | 93 | 65 |
| Witcher 3 Stressz | ~0.6 | 1530 | 75 | 62 |
Rendszer teljesítménye
A PCMark 10 pontszámok lényegében megegyeznek azzal, amit a Precision 5680 esetében rögzítettünk, ami azt sugallja, hogy a két modell között nincs jelentős teljesítménybeli különbség a hagyományos feladatok tekintetében.
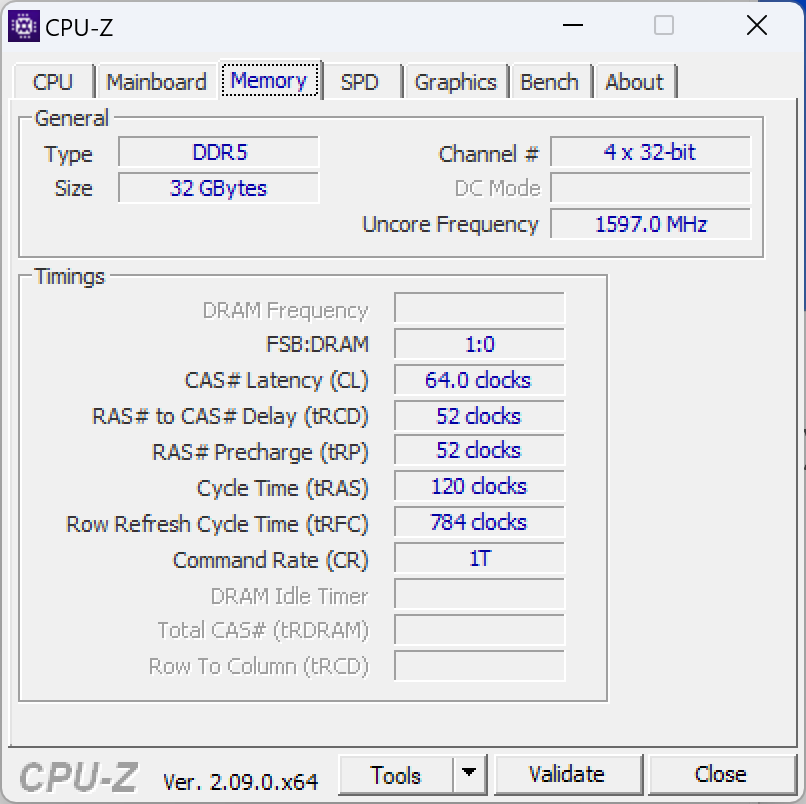
A rendszermemória idén valamivel gyorsabb (7467 vs. 6000 MT/s), és ez tükröződik a javuló AIDA64 benchmark eredményekben is.

CrossMark: Overall | Productivity | Creativity | Responsiveness
WebXPRT 3: Overall
WebXPRT 4: Overall
Mozilla Kraken 1.1: Total
| PCMark 10 / Score | |
| Dell Precision 5000 5680 | |
| HP ZBook Fury 16 G10 | |
| Dell Precision 5690 | |
| Átlagos Intel Core Ultra 9 185H, NVIDIA RTX 5000 Ada Generation Laptop (n=1) | |
| Lenovo ThinkPad P1 G6-21FV000DGE | |
| Lenovo ThinkPad P16 G2 21FA000FGE | |
| MSI CreatorPro Z16P B12UKST | |
| PCMark 10 / Essentials | |
| Dell Precision 5000 5680 | |
| Lenovo ThinkPad P1 G6-21FV000DGE | |
| HP ZBook Fury 16 G10 | |
| Dell Precision 5690 | |
| Átlagos Intel Core Ultra 9 185H, NVIDIA RTX 5000 Ada Generation Laptop (n=1) | |
| Lenovo ThinkPad P16 G2 21FA000FGE | |
| MSI CreatorPro Z16P B12UKST | |
| PCMark 10 / Productivity | |
| Dell Precision 5000 5680 | |
| Dell Precision 5690 | |
| Átlagos Intel Core Ultra 9 185H, NVIDIA RTX 5000 Ada Generation Laptop (n=1) | |
| Lenovo ThinkPad P1 G6-21FV000DGE | |
| Lenovo ThinkPad P16 G2 21FA000FGE | |
| MSI CreatorPro Z16P B12UKST | |
| HP ZBook Fury 16 G10 | |
| PCMark 10 / Digital Content Creation | |
| HP ZBook Fury 16 G10 | |
| Dell Precision 5000 5680 | |
| Dell Precision 5690 | |
| Átlagos Intel Core Ultra 9 185H, NVIDIA RTX 5000 Ada Generation Laptop (n=1) | |
| Lenovo ThinkPad P1 G6-21FV000DGE | |
| MSI CreatorPro Z16P B12UKST | |
| Lenovo ThinkPad P16 G2 21FA000FGE | |
| CrossMark / Overall | |
| MSI CreatorPro Z16P B12UKST | |
| Dell Precision 5000 5680 | |
| HP ZBook Fury 16 G10 | |
| Lenovo ThinkPad P1 G6-21FV000DGE | |
| Lenovo ThinkPad P16 G2 21FA000FGE | |
| Dell Precision 5690 | |
| Átlagos Intel Core Ultra 9 185H, NVIDIA RTX 5000 Ada Generation Laptop (n=1) | |
| CrossMark / Productivity | |
| HP ZBook Fury 16 G10 | |
| MSI CreatorPro Z16P B12UKST | |
| Dell Precision 5000 5680 | |
| Lenovo ThinkPad P1 G6-21FV000DGE | |
| Dell Precision 5690 | |
| Átlagos Intel Core Ultra 9 185H, NVIDIA RTX 5000 Ada Generation Laptop (n=1) | |
| Lenovo ThinkPad P16 G2 21FA000FGE | |
| CrossMark / Creativity | |
| Dell Precision 5000 5680 | |
| Lenovo ThinkPad P16 G2 21FA000FGE | |
| HP ZBook Fury 16 G10 | |
| MSI CreatorPro Z16P B12UKST | |
| Lenovo ThinkPad P1 G6-21FV000DGE | |
| Dell Precision 5690 | |
| Átlagos Intel Core Ultra 9 185H, NVIDIA RTX 5000 Ada Generation Laptop (n=1) | |
| CrossMark / Responsiveness | |
| MSI CreatorPro Z16P B12UKST | |
| HP ZBook Fury 16 G10 | |
| Lenovo ThinkPad P1 G6-21FV000DGE | |
| Dell Precision 5000 5680 | |
| Dell Precision 5690 | |
| Átlagos Intel Core Ultra 9 185H, NVIDIA RTX 5000 Ada Generation Laptop (n=1) | |
| Lenovo ThinkPad P16 G2 21FA000FGE | |
| WebXPRT 3 / Overall | |
| Dell Precision 5000 5680 | |
| HP ZBook Fury 16 G10 | |
| Lenovo ThinkPad P16 G2 21FA000FGE | |
| Lenovo ThinkPad P1 G6-21FV000DGE | |
| MSI CreatorPro Z16P B12UKST | |
| Dell Precision 5690 | |
| Átlagos Intel Core Ultra 9 185H, NVIDIA RTX 5000 Ada Generation Laptop (n=1) | |
| WebXPRT 4 / Overall | |
| Lenovo ThinkPad P1 G6-21FV000DGE | |
| HP ZBook Fury 16 G10 | |
| Dell Precision 5000 5680 | |
| Dell Precision 5690 | |
| Átlagos Intel Core Ultra 9 185H, NVIDIA RTX 5000 Ada Generation Laptop (n=1) | |
| MSI CreatorPro Z16P B12UKST | |
| Mozilla Kraken 1.1 / Total | |
| MSI CreatorPro Z16P B12UKST | |
| Dell Precision 5690 | |
| Átlagos Intel Core Ultra 9 185H, NVIDIA RTX 5000 Ada Generation Laptop (n=1) | |
| Lenovo ThinkPad P16 G2 21FA000FGE | |
| Dell Precision 5000 5680 | |
| Lenovo ThinkPad P1 G6-21FV000DGE | |
| HP ZBook Fury 16 G10 | |
* ... a kisebb jobb
| PCMark 10 Score | 8065 pontok | |
Segítség | ||
| AIDA64 / Memory Copy | |
| Dell Precision 5690 | |
| Átlagos Intel Core Ultra 9 185H (69929 - 95718, n=20) | |
| Dell Precision 5000 5680 | |
| MSI CreatorPro Z16P B12UKST | |
| HP ZBook Fury 16 G10 | |
| Lenovo ThinkPad P16 G2 21FA000FGE | |
| Lenovo ThinkPad P1 G6-21FV000DGE | |
| AIDA64 / Memory Read | |
| Dell Precision 5690 | |
| Átlagos Intel Core Ultra 9 185H (64619 - 87768, n=20) | |
| Dell Precision 5000 5680 | |
| MSI CreatorPro Z16P B12UKST | |
| HP ZBook Fury 16 G10 | |
| Lenovo ThinkPad P16 G2 21FA000FGE | |
| Lenovo ThinkPad P1 G6-21FV000DGE | |
| AIDA64 / Memory Write | |
| Dell Precision 5000 5680 | |
| Dell Precision 5690 | |
| Átlagos Intel Core Ultra 9 185H (51114 - 93871, n=20) | |
| MSI CreatorPro Z16P B12UKST | |
| HP ZBook Fury 16 G10 | |
| Lenovo ThinkPad P16 G2 21FA000FGE | |
| Lenovo ThinkPad P1 G6-21FV000DGE | |
| AIDA64 / Memory Latency | |
| Átlagos Intel Core Ultra 9 185H (121.4 - 259, n=20) | |
| Dell Precision 5690 | |
| HP ZBook Fury 16 G10 | |
| Lenovo ThinkPad P16 G2 21FA000FGE | |
| MSI CreatorPro Z16P B12UKST | |
| Dell Precision 5000 5680 | |
| Lenovo ThinkPad P1 G6-21FV000DGE | |
* ... a kisebb jobb
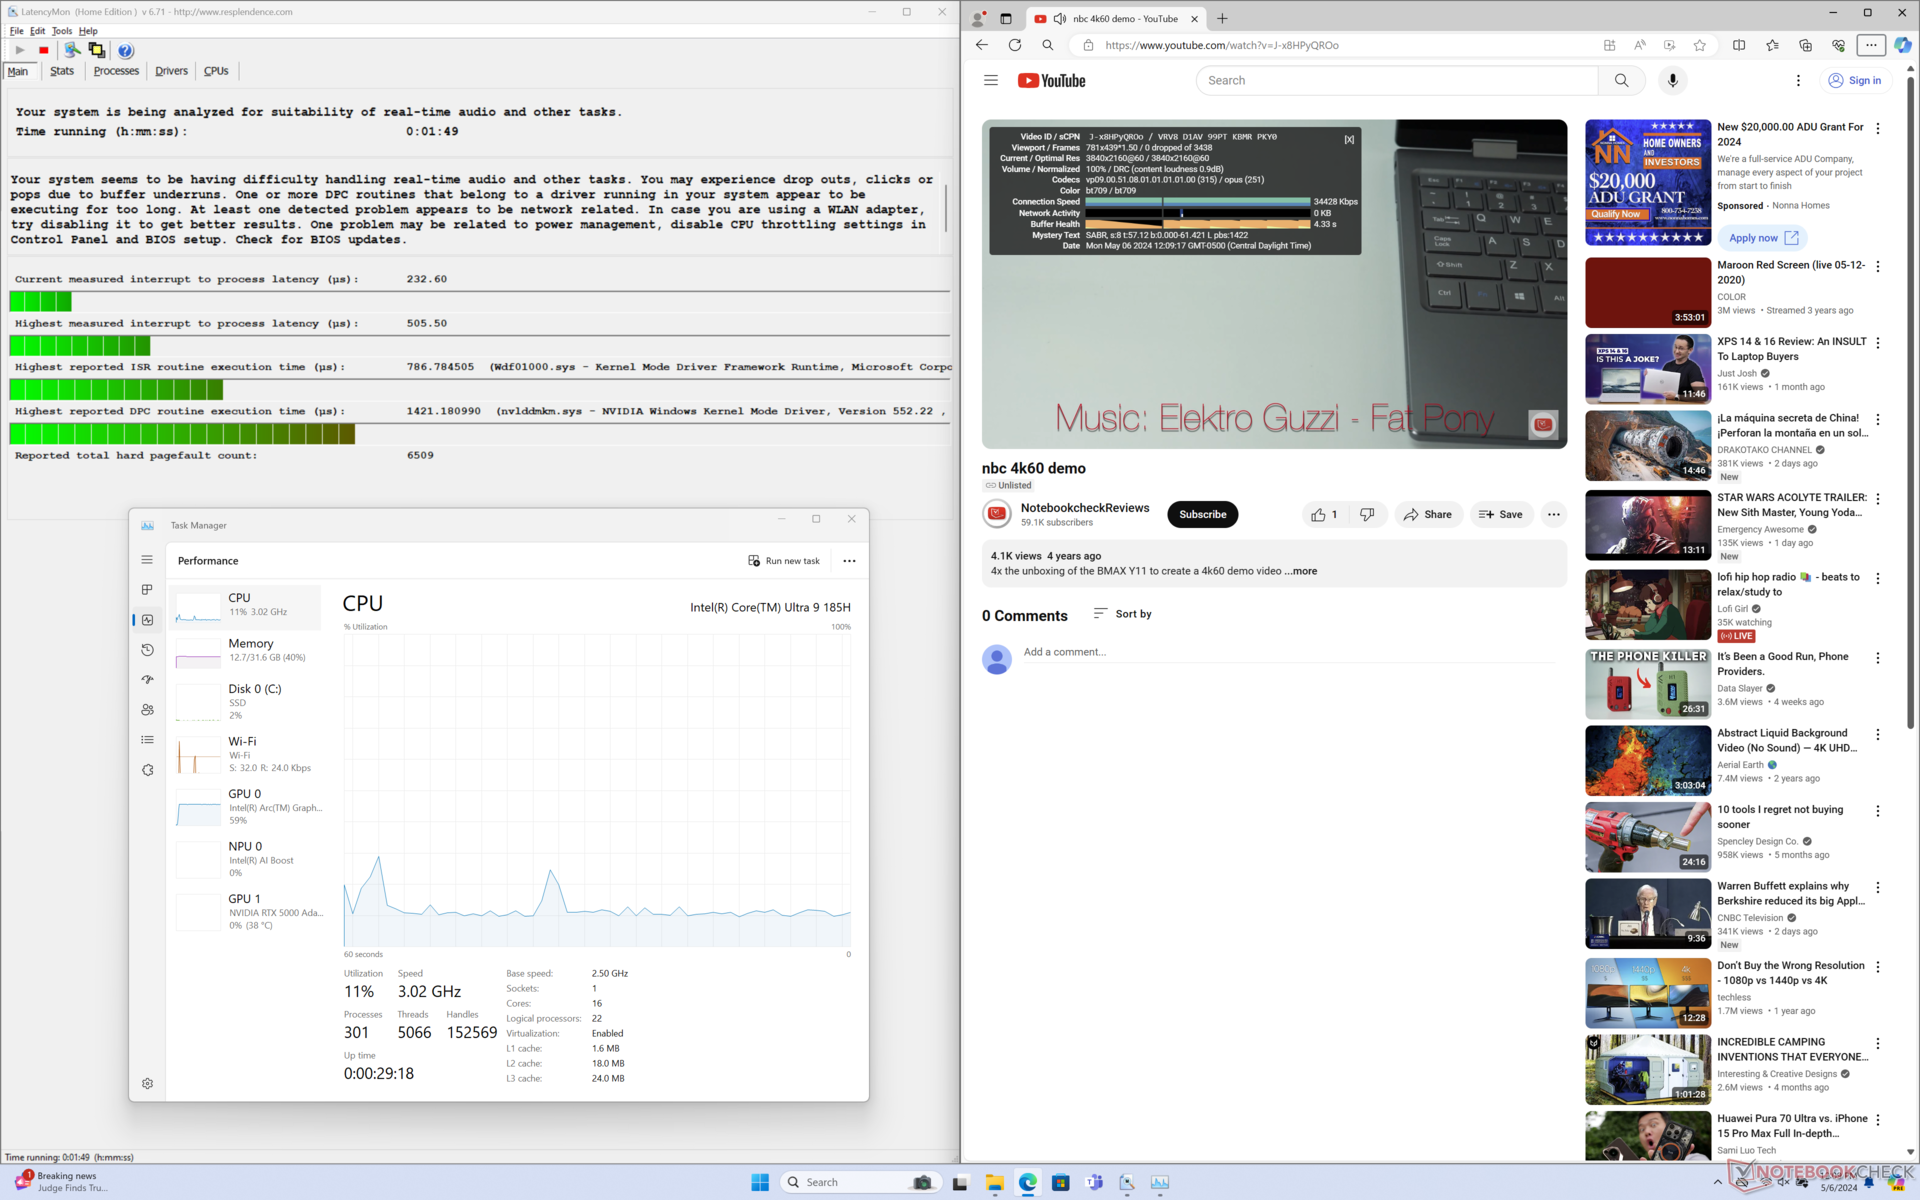
DPC késleltetés
A LatencyMon csak kisebb DPC-problémákat mutat, amikor több böngészőfület nyitunk meg a honlapunkon. a 4K videolejátszás 60 FPS mellett egyébként tökéletes, és nem rögzítettünk kiesett képkockákat.

| DPC Latencies / LatencyMon - interrupt to process latency (max), Web, Youtube, Prime95 | |
| HP ZBook Fury 16 G10 | |
| Lenovo ThinkPad P1 G6-21FV000DGE | |
| Dell Precision 5000 5680 | |
| Lenovo ThinkPad P16 G2 21FA000FGE | |
| MSI CreatorPro Z16P B12UKST | |
| Dell Precision 5690 | |
* ... a kisebb jobb
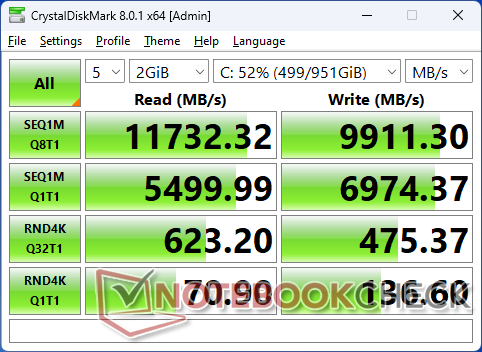
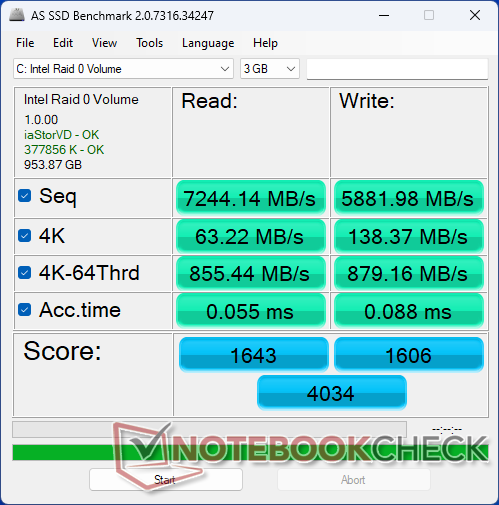
Tárolóeszközök
A tesztkészülékünk két Samsung PM9A1 PCIe4 x4 NVMe SSD-vel RAID 0 konfigurációban 12000 MB/s és 9000 MB/s feletti olvasási és írási sebességgel. A teljesítmény egyenletes, a DiskSpd hurokban történő futtatása során nem rögzített fojtott teljesítményt.

| Drive Performance rating - Percent | |
| MSI CreatorPro Z16P B12UKST -8! | |
| Lenovo ThinkPad P1 G6-21FV000DGE | |
| Dell Precision 5690 | |
| HP ZBook Fury 16 G10 | |
| Dell Precision 5000 5680 | |
| Lenovo ThinkPad P16 G2 21FA000FGE | |
* ... a kisebb jobb
Disk Throttling: DiskSpd Read Loop, Queue Depth 8
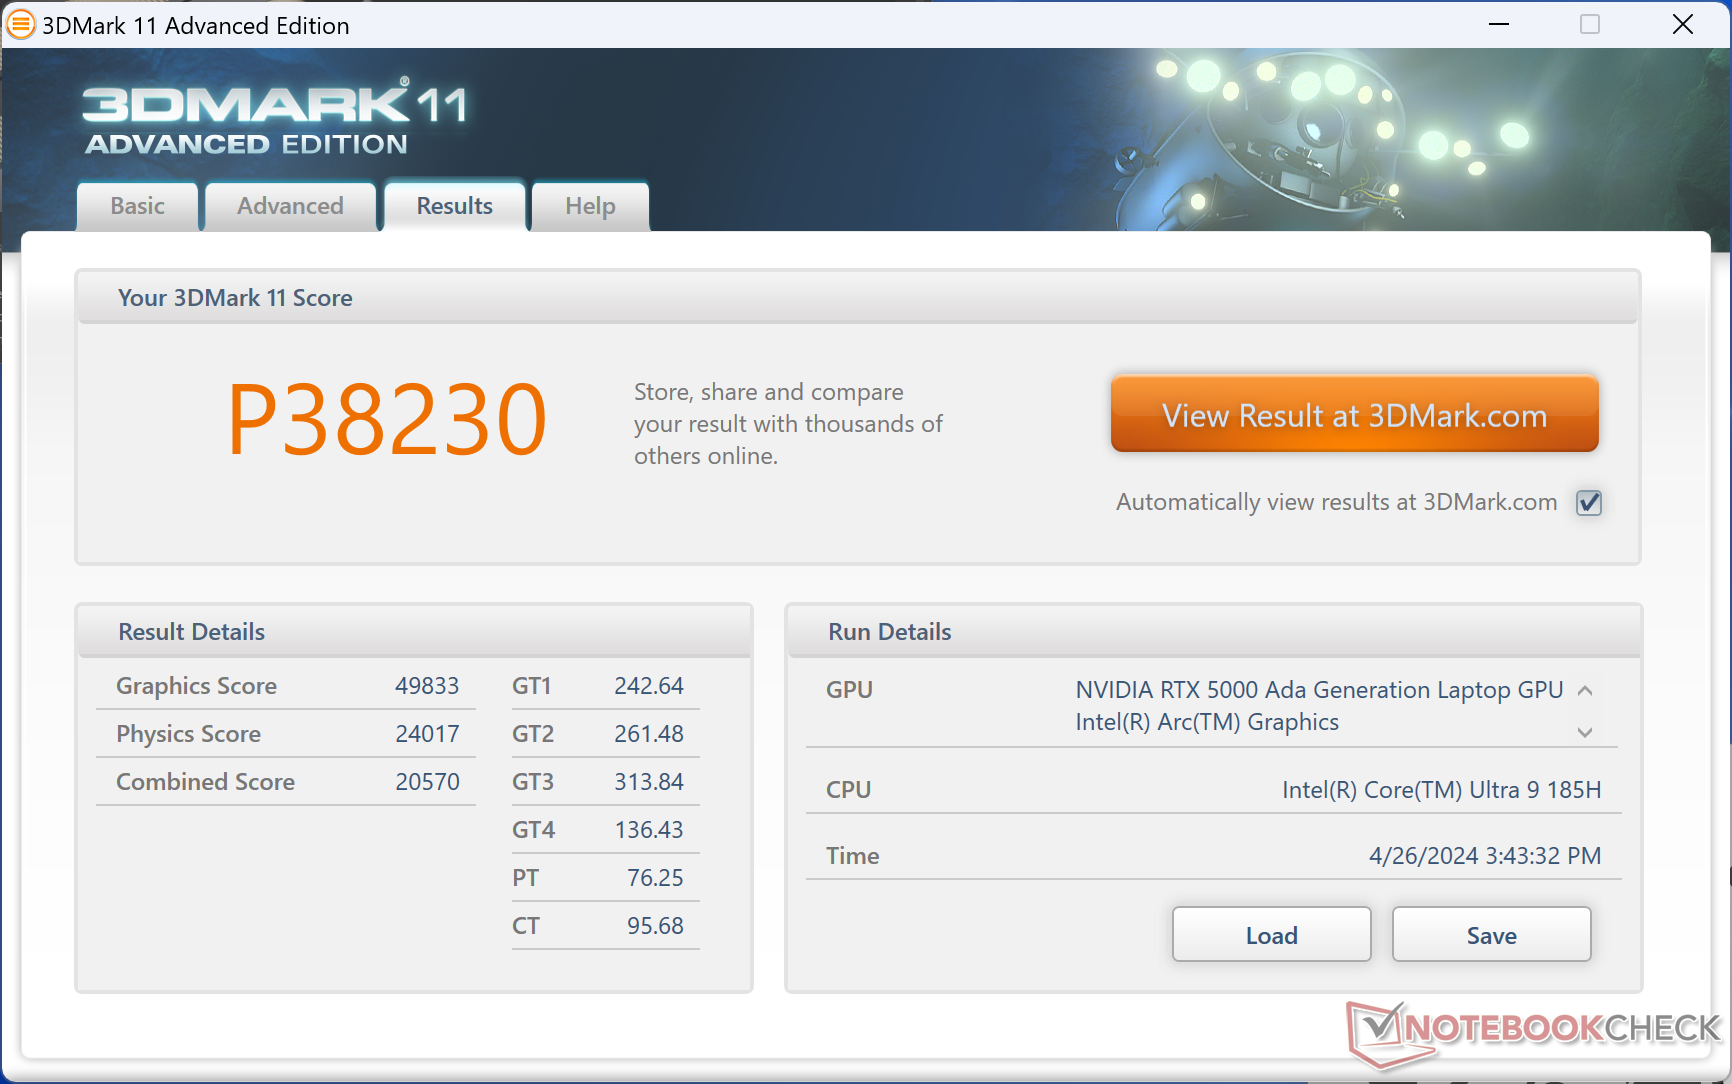
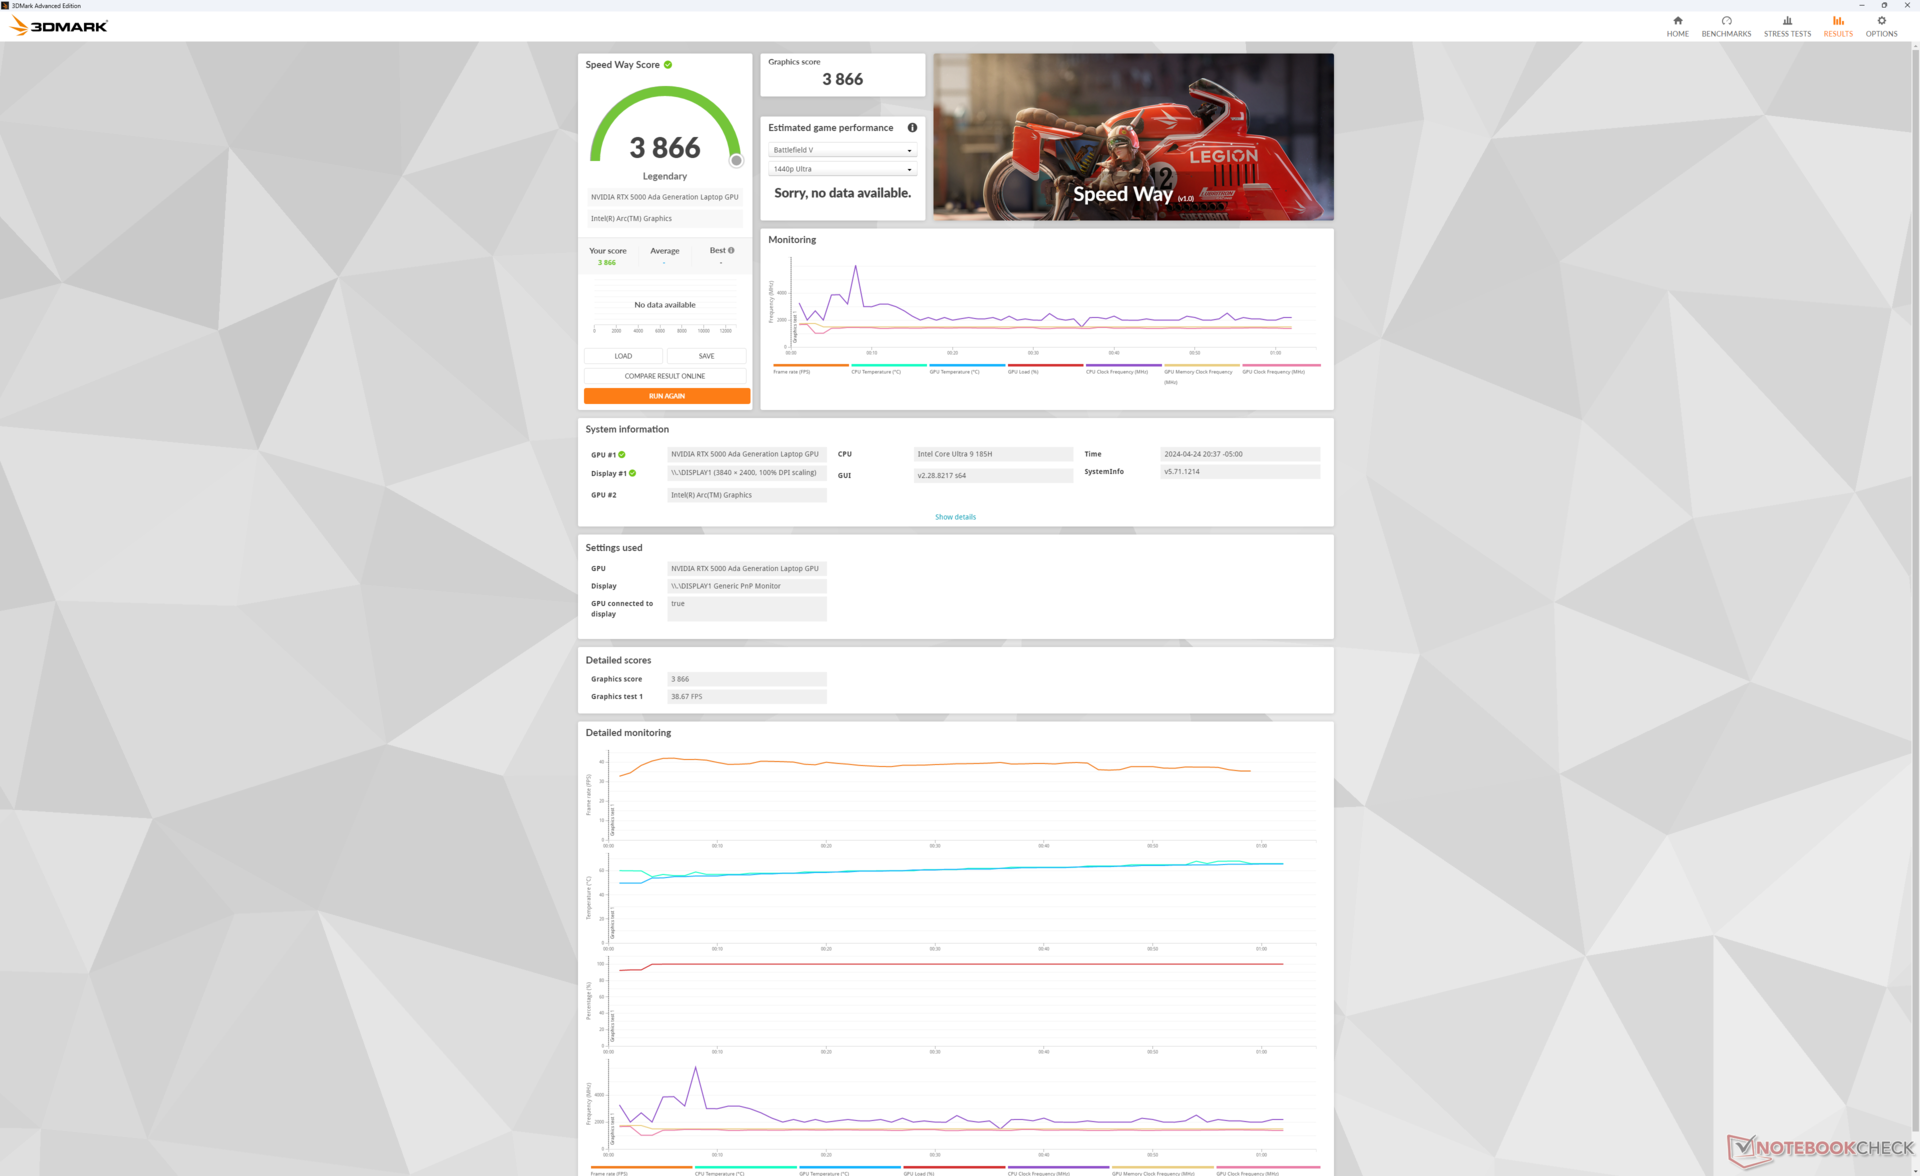
GPU-teljesítmény - Akár RTX 5000 Ada-ig
Az Nvidia GPU-választék nem változott a korábbiakhoz képest, így a RTX 5000 Ada továbbra is a csúcskategóriás opció marad. Ez a GPU a GeForce RTX 4090 RTX 4090-ből származik, és így nevezetesen 16 GB VRAM-ot tartalmaz a 12 GB helyett, ha a lassabb RTX 4000 Ada vagy 3500 Ada konfigurálható. A felhasználók az RTX Ada GPU-k széles skáláját konfigurálhatják, beleértve az RTX 1000 Ada-t egészen az RTX 5000 Ada konfigurációnkig.
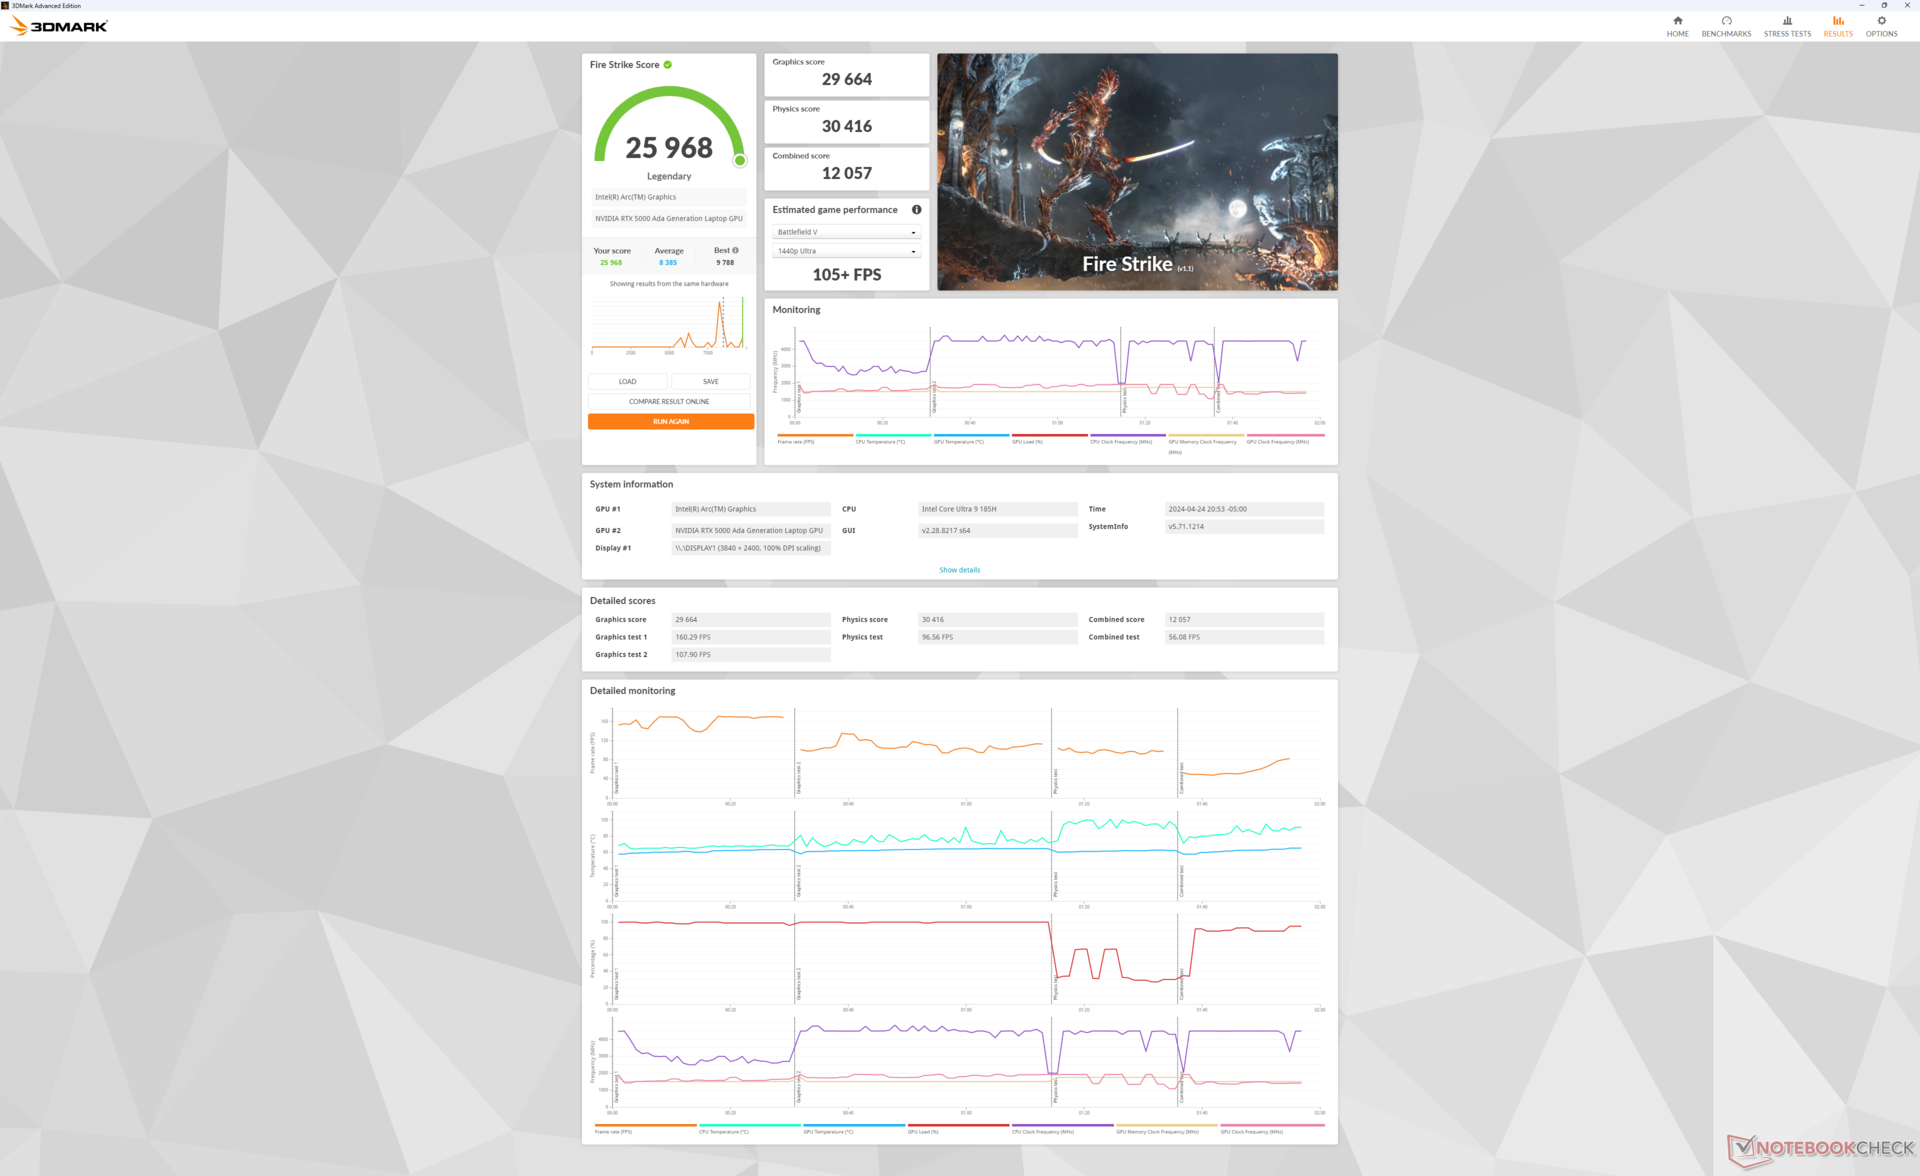
| Teljesítményprofil | Grafikai pontszám | Fizika pontszám | Kombinált pontszám |
| Teljesítmény mód | 29664 | 30416 | 12057 |
| Kiegyensúlyozott mód | 29771 (-0%) | 27199 (-11%) | 11770 (-2%) |
| Akkumulátor teljesítmény | 26674 (-10%) | 20268 (-33%) | 9539 (-21%) |
A Kiegyensúlyozott üzemmódban történő futtatás hatással van a processzorteljesítményre, míg a grafikus teljesítmény változatlan marad, ahogyan azt a fenti Fire Strike eredményeink is mutatják.
| 3DMark Performance rating - Percent | |
| HP ZBook Fury 16 G10 -2! | |
| Átlagos NVIDIA RTX 5000 Ada Generation Laptop | |
| Dell Precision 5690 -2! | |
| Dell Precision 5000 5680 -2! | |
| Asus ProArt StudioBook 16 W7600H5A-2BL2 -20! | |
| HP ZBook Fury 16 G9 -2! | |
| Dell XPS 16 9640 -35! | |
| Lenovo ThinkPad P1 G6-21FV000DGE -16! | |
| Lenovo ThinkPad P16 G2 21FA000FGE -18! | |
| MSI CreatorPro Z16P B12UKST -17! | |
| Lenovo ThinkPad P16v G1 AMD -16! | |
| Lenovo ThinkPad P16 G1 21D6001DMB -18! | |
| Lenovo ThinkPad P1 G4-20Y30017GE -18! | |
| Lenovo ThinkPad P16s G2 21K9000CGE -18! | |
| 3DMark 11 - 1280x720 Performance GPU | |
| HP ZBook Fury 16 G10 | |
| Átlagos NVIDIA RTX 5000 Ada Generation Laptop (49833 - 54334, n=3) | |
| Dell Precision 5000 5680 | |
| Dell Precision 5690 | |
| HP ZBook Fury 16 G9 | |
| Dell XPS 16 9640 | |
| Lenovo ThinkPad P16 G2 21FA000FGE | |
| Lenovo ThinkPad P1 G6-21FV000DGE | |
| MSI CreatorPro Z16P B12UKST | |
| Lenovo ThinkPad P16v G1 AMD | |
| Lenovo ThinkPad P16 G1 21D6001DMB | |
| Lenovo ThinkPad P1 G4-20Y30017GE | |
| Lenovo ThinkPad P16s G2 21K9000CGE | |
| 3DMark 11 Performance | 38230 pontok | |
| 3DMark Fire Strike Score | 25968 pontok | |
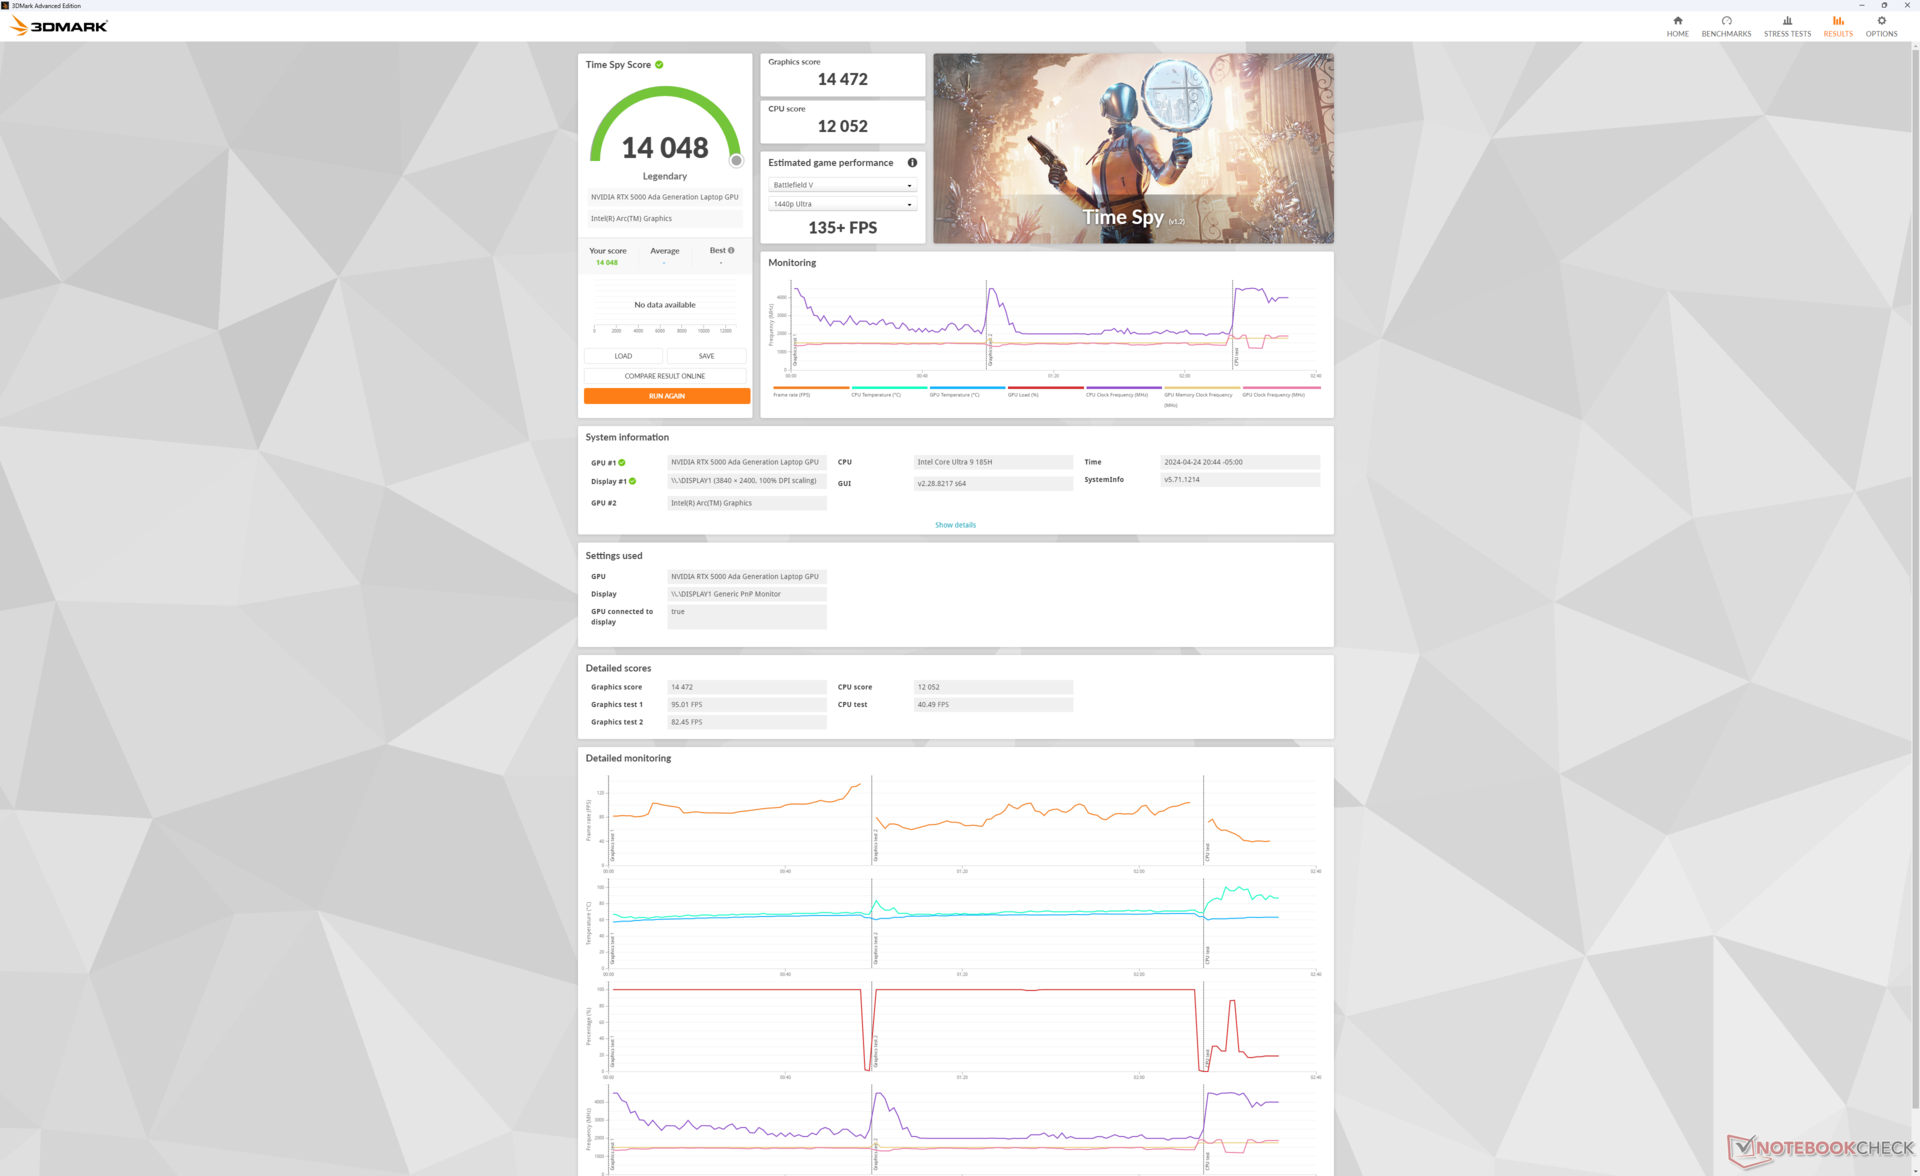
| 3DMark Time Spy Score | 14048 pontok | |
Segítség | ||
* ... a kisebb jobb
| Performance rating - Percent | |
| HP ZBook Fury 16 G10 | |
| Dell Precision 5000 5680 -1! | |
| Dell Precision 5690 | |
| Lenovo ThinkPad P16 G2 21FA000FGE | |
| Lenovo ThinkPad P1 G6-21FV000DGE | |
| MSI CreatorPro Z16P B12UKST | |
| The Witcher 3 - 1920x1080 Ultra Graphics & Postprocessing (HBAO+) | |
| HP ZBook Fury 16 G10 | |
| Dell Precision 5690 | |
| Dell Precision 5000 5680 | |
| Lenovo ThinkPad P16 G2 21FA000FGE | |
| Lenovo ThinkPad P1 G6-21FV000DGE | |
| MSI CreatorPro Z16P B12UKST | |
| Final Fantasy XV Benchmark - 1920x1080 High Quality | |
| HP ZBook Fury 16 G10 | |
| Dell Precision 5690 | |
| Dell Precision 5000 5680 | |
| Lenovo ThinkPad P16 G2 21FA000FGE | |
| Lenovo ThinkPad P1 G6-21FV000DGE | |
| MSI CreatorPro Z16P B12UKST | |
| Strange Brigade - 1920x1080 ultra AA:ultra AF:16 | |
| HP ZBook Fury 16 G10 | |
| Dell Precision 5690 | |
| Lenovo ThinkPad P16 G2 21FA000FGE | |
| Lenovo ThinkPad P1 G6-21FV000DGE | |
| MSI CreatorPro Z16P B12UKST | |
| Dota 2 Reborn - 1920x1080 ultra (3/3) best looking | |
| HP ZBook Fury 16 G10 | |
| Lenovo ThinkPad P16 G2 21FA000FGE | |
| MSI CreatorPro Z16P B12UKST | |
| Dell Precision 5000 5680 | |
| Dell Precision 5690 | |
| Lenovo ThinkPad P1 G6-21FV000DGE | |
| X-Plane 11.11 - 1920x1080 high (fps_test=3) | |
| HP ZBook Fury 16 G10 | |
| Lenovo ThinkPad P1 G6-21FV000DGE | |
| Lenovo ThinkPad P16 G2 21FA000FGE | |
| Dell Precision 5000 5680 | |
| MSI CreatorPro Z16P B12UKST | |
| Dell Precision 5690 | |
| Baldur's Gate 3 | |
| 1920x1080 High Preset AA:T | |
| Dell Precision 5690 | |
| Átlagos NVIDIA RTX 5000 Ada Generation Laptop (n=1) | |
| Dell XPS 16 9640 | |
| 1920x1080 Ultra Preset AA:T | |
| Dell Precision 5690 | |
| Átlagos NVIDIA RTX 5000 Ada Generation Laptop (n=1) | |
| Dell XPS 16 9640 | |
| 2560x1440 Ultra Preset AA:T | |
| Dell Precision 5690 | |
| Átlagos NVIDIA RTX 5000 Ada Generation Laptop (n=1) | |
| Dell XPS 16 9640 | |
| 3840x2160 Ultra Preset AA:T | |
| Dell Precision 5690 | |
| Átlagos NVIDIA RTX 5000 Ada Generation Laptop (n=1) | |
| 3840x2160 Ultra Preset + Quality DLSS | |
| Dell Precision 5690 | |
| Átlagos NVIDIA RTX 5000 Ada Generation Laptop (n=1) | |
| The Witcher 3 | |
| 1920x1080 High Graphics & Postprocessing (Nvidia HairWorks Off) | |
| HP ZBook Fury 16 G10 | |
| Átlagos NVIDIA RTX 5000 Ada Generation Laptop (256 - 298, n=3) | |
| Dell Precision 5690 | |
| Dell Precision 5000 5680 | |
| Dell XPS 16 9640 | |
| Lenovo ThinkPad P16 G2 21FA000FGE | |
| HP ZBook Fury 16 G9 | |
| Lenovo ThinkPad P1 G6-21FV000DGE | |
| MSI CreatorPro Z16P B12UKST | |
| Asus ProArt StudioBook 16 W7600H5A-2BL2 | |
| Lenovo ThinkPad P16v G1 AMD | |
| Lenovo ThinkPad P16 G1 21D6001DMB | |
| Lenovo ThinkPad P1 G4-20Y30017GE | |
| Lenovo ThinkPad P16s G2 21K9000CGE | |
| 1920x1080 Ultra Graphics & Postprocessing (HBAO+) | |
| HP ZBook Fury 16 G10 | |
| Átlagos NVIDIA RTX 5000 Ada Generation Laptop (137 - 156.5, n=3) | |
| Dell Precision 5690 | |
| Dell Precision 5000 5680 | |
| Lenovo ThinkPad P16 G2 21FA000FGE | |
| HP ZBook Fury 16 G9 | |
| Asus ProArt StudioBook 16 W7600H5A-2BL2 | |
| Dell XPS 16 9640 | |
| Lenovo ThinkPad P1 G6-21FV000DGE | |
| MSI CreatorPro Z16P B12UKST | |
| Lenovo ThinkPad P16 G1 21D6001DMB | |
| Lenovo ThinkPad P16v G1 AMD | |
| Lenovo ThinkPad P1 G4-20Y30017GE | |
| Lenovo ThinkPad P16s G2 21K9000CGE | |
| 3840x2160 High Graphics & Postprocessing (Nvidia HairWorks Off) | |
| HP ZBook Fury 16 G10 | |
| Dell Precision 5690 | |
| Átlagos NVIDIA RTX 5000 Ada Generation Laptop (97 - 105.2, n=3) | |
| Dell Precision 5000 5680 | |
| HP ZBook Fury 16 G9 | |
| Asus ProArt StudioBook 16 W7600H5A-2BL2 | |
| Lenovo ThinkPad P16s G2 21K9000CGE | |
| Cyberpunk 2077 | |
| 1920x1080 High Preset (FSR off) | |
| Dell Precision 5690 | |
| Átlagos NVIDIA RTX 5000 Ada Generation Laptop (n=1) | |
| Dell XPS 16 9640 | |
| Lenovo ThinkPad P16v G1 AMD | |
| 1920x1080 Ultra Preset (FSR off) | |
| Dell Precision 5690 | |
| Átlagos NVIDIA RTX 5000 Ada Generation Laptop (n=1) | |
| Dell XPS 16 9640 | |
| Lenovo ThinkPad P16v G1 AMD | |
| 2560x1440 Ultra Preset (FSR off) | |
| Dell Precision 5690 | |
| Átlagos NVIDIA RTX 5000 Ada Generation Laptop (n=1) | |
| Dell XPS 16 9640 | |
| 3840x2160 Ultra Preset (FSR off) | |
| Dell Precision 5690 | |
| Átlagos NVIDIA RTX 5000 Ada Generation Laptop (n=1) | |
| 1920x1080 Ray Tracing Ultra Preset (DLSS off) | |
| Dell Precision 5690 | |
| Átlagos NVIDIA RTX 5000 Ada Generation Laptop (n=1) | |
| F1 22 | |
| 1920x1080 High Preset AA:T AF:16x | |
| Dell Precision 5690 | |
| HP ZBook Fury 16 G10 | |
| Átlagos NVIDIA RTX 5000 Ada Generation Laptop (202 - 217, n=3) | |
| Dell Precision 5000 5680 | |
| HP ZBook Fury 16 G9 | |
| Lenovo ThinkPad P1 G6-21FV000DGE | |
| MSI CreatorPro Z16P B12UKST | |
| Lenovo ThinkPad P16v G1 AMD | |
| 1920x1080 Ultra High Preset AA:T AF:16x | |
| Dell Precision 5690 | |
| Átlagos NVIDIA RTX 5000 Ada Generation Laptop (84.5 - 91.1, n=3) | |
| HP ZBook Fury 16 G10 | |
| Dell Precision 5000 5680 | |
| HP ZBook Fury 16 G9 | |
| Lenovo ThinkPad P1 G6-21FV000DGE | |
| MSI CreatorPro Z16P B12UKST | |
| Lenovo ThinkPad P16v G1 AMD | |
| 2560x1440 Ultra High Preset AA:T AF:16x | |
| HP ZBook Fury 16 G10 | |
| Átlagos NVIDIA RTX 5000 Ada Generation Laptop (56.1 - 64.4, n=3) | |
| Dell Precision 5690 | |
| Dell Precision 5000 5680 | |
| HP ZBook Fury 16 G9 | |
| Lenovo ThinkPad P1 G6-21FV000DGE | |
| MSI CreatorPro Z16P B12UKST | |
| 3840x2160 Ultra High Preset AA:T AF:16x | |
| HP ZBook Fury 16 G10 | |
| Átlagos NVIDIA RTX 5000 Ada Generation Laptop (28.8 - 33.4, n=3) | |
| Dell Precision 5690 | |
| Dell Precision 5000 5680 | |
| HP ZBook Fury 16 G9 | |
| Tiny Tina's Wonderlands | |
| 1920x1080 High Preset (DX12) | |
| HP ZBook Fury 16 G10 | |
| Átlagos NVIDIA RTX 5000 Ada Generation Laptop (145.5 - 171.7, n=3) | |
| Dell Precision 5000 5680 | |
| Dell Precision 5690 | |
| HP ZBook Fury 16 G9 | |
| 1920x1080 Badass Preset (DX12) | |
| HP ZBook Fury 16 G10 | |
| Átlagos NVIDIA RTX 5000 Ada Generation Laptop (124 - 139.4, n=3) | |
| Dell Precision 5000 5680 | |
| Dell Precision 5690 | |
| HP ZBook Fury 16 G9 | |
| 2560x1440 Badass Preset (DX12) | |
| HP ZBook Fury 16 G10 | |
| Átlagos NVIDIA RTX 5000 Ada Generation Laptop (87.1 - 99.4, n=3) | |
| Dell Precision 5000 5680 | |
| Dell Precision 5690 | |
| HP ZBook Fury 16 G9 | |
| 3840x2160 Badass Preset (DX12) | |
| HP ZBook Fury 16 G10 | |
| Átlagos NVIDIA RTX 5000 Ada Generation Laptop (48.4 - 53.9, n=3) | |
| Dell Precision 5000 5680 | |
| Dell Precision 5690 | |
| HP ZBook Fury 16 G9 | |
| X-Plane 11.11 | |
| 1920x1080 high (fps_test=3) | |
| HP ZBook Fury 16 G10 | |
| Lenovo ThinkPad P1 G6-21FV000DGE | |
| Átlagos NVIDIA RTX 5000 Ada Generation Laptop (88.7 - 122.4, n=3) | |
| HP ZBook Fury 16 G9 | |
| Lenovo ThinkPad P16 G2 21FA000FGE | |
| Dell Precision 5000 5680 | |
| MSI CreatorPro Z16P B12UKST | |
| Lenovo ThinkPad P16 G1 21D6001DMB | |
| Dell Precision 5690 | |
| Dell XPS 16 9640 | |
| Dell XPS 16 9640 | |
| Asus ProArt StudioBook 16 W7600H5A-2BL2 | |
| Lenovo ThinkPad P16v G1 AMD | |
| Lenovo ThinkPad P1 G4-20Y30017GE | |
| Lenovo ThinkPad P16s G2 21K9000CGE | |
| Lenovo ThinkPad P16s G2 21K9000CGE | |
| 3840x2160 high (fps_test=3) | |
| HP ZBook Fury 16 G10 | |
| Átlagos NVIDIA RTX 5000 Ada Generation Laptop (74.8 - 102.6, n=3) | |
| Dell Precision 5000 5680 | |
| HP ZBook Fury 16 G9 | |
| Dell Precision 5690 | |
| Dell XPS 16 9640 | |
| Lenovo ThinkPad P1 G4-20Y30017GE | |
| Asus ProArt StudioBook 16 W7600H5A-2BL2 | |
| Lenovo ThinkPad P16s G2 21K9000CGE | |
Witcher 3 FPS Chart
| alacsony | közepes | magas | ultra | QHD | 4K DLSS | 4K | |
|---|---|---|---|---|---|---|---|
| The Witcher 3 (2015) | 411.3 | 351.2 | 258.7 | 137.6 | 103.9 | ||
| Dota 2 Reborn (2015) | 169.4 | 149.2 | 150.1 | 139.9 | 130 | ||
| Final Fantasy XV Benchmark (2018) | 196.6 | 165.4 | 132.5 | 103.8 | 63.2 | ||
| X-Plane 11.11 (2018) | 132.8 | 113.9 | 88.7 | 74.8 | |||
| Far Cry 5 (2018) | 144 | 134 | 127 | 119 | 113 | 72 | |
| Strange Brigade (2018) | 405 | 314 | 276 | 252 | 190.6 | 105.3 | |
| Tiny Tina's Wonderlands (2022) | 196.5 | 179.4 | 145.5 | 124 | 87.1 | 48.4 | |
| F1 22 (2022) | 228 | 224 | 217 | 91.1 | 60.1 | 29.6 | |
| Baldur's Gate 3 (2023) | 172.3 | 155.2 | 139.2 | 134.6 | 100.5 | 87.8 | 53.3 |
| Cyberpunk 2077 (2023) | 125 | 116.6 | 94.6 | 108.5 | 63.7 | 28.8 |
Kibocsátás
Rendszerzaj - hangos és felelős
A ventilátorzaj érzékeny a kiválasztott teljesítményprofilra. Csendes üzemmódban például a ventilátor zaja általában 25 dB(A) alatt marad a 23,4 dB(A) csendes háttérrel szemben. Ezzel szemben a ventilátorok hajlamosabbak a 30 dB(A) értékig lüktetni, ha Kiegyensúlyozott vagy Teljesítmény üzemmódban vannak beállítva, még olyan hétköznapi feladatok, mint a webböngészés közben is.
A ventilátorok zajszintjének felső határa egyébként megegyezik azzal, amit a Precision 5680 esetében rögzítettünk: 51 dB(A), ami olyan hangos, mint sok játékra szánt laptopé. Ezt a maximumot akkor lehet elérni, ha a GPU-t igénylő terheléseket több percnél hosszabb ideig futtatjuk.
Zajszint
| Üresjárat |
| 23.6 / 24.9 / 30.9 dB(A) |
| Terhelés |
| 40.4 / 51.9 dB(A) |
 | ||
30 dB csendes 40 dB(A) hallható 50 dB(A) hangos |
||
min: | ||
| Dell Precision 5690 RTX 5000 Ada Generation Laptop, Ultra 9 185H, 2x Samsung PM9A1 1TB (RAID 0) | Dell Precision 5000 5680 RTX 5000 Ada Generation Laptop, i9-13900H, 2x SK hynix PC801 HFS512GEJ9X101N RAID 0 | Lenovo ThinkPad P16 G2 21FA000FGE RTX 2000 Ada Generation Laptop, i7-13700HX, SK hynix PC801 HFS001TEJ9X162N | Lenovo ThinkPad P1 G6-21FV000DGE RTX 2000 Ada Generation Laptop, i9-13900H, SK Hynix PC711 1TB HFS001TDE9X084N | HP ZBook Fury 16 G10 RTX 5000 Ada Generation Laptop, i9-13950HX, SK hynix PC801 HFS001TEJ9X101N | MSI CreatorPro Z16P B12UKST RTX A3000 Laptop GPU, i7-12700H, Samsung PM9A1 MZVL21T0HCLR | |
|---|---|---|---|---|---|---|
| Noise | 6% | -1% | 3% | 6% | -0% | |
| off / környezet * (dB) | 23.4 | 22.8 3% | 23.5 -0% | 24.5 -5% | 22.9 2% | 24.1 -3% |
| Idle Minimum * (dB) | 23.6 | 23 3% | 23.5 -0% | 24.5 -4% | 22.9 3% | 27.1 -15% |
| Idle Average * (dB) | 24.9 | 23 8% | 29.2 -17% | 24.5 2% | 22.9 8% | 27.1 -9% |
| Idle Maximum * (dB) | 30.9 | 23 26% | 29.5 5% | 24.5 21% | 28.5 8% | 27.1 12% |
| Load Average * (dB) | 40.4 | 37.2 8% | 32.7 19% | 48 -19% | 40.6 -0% | 42.9 -6% |
| Witcher 3 ultra * (dB) | 48.3 | 51 -6% | 50.6 -5% | 40.7 16% | 44.1 9% | 44 9% |
| Load Maximum * (dB) | 51.9 | 51 2% | 56.6 -9% | 48 8% | 45.8 12% | 47 9% |
* ... a kisebb jobb
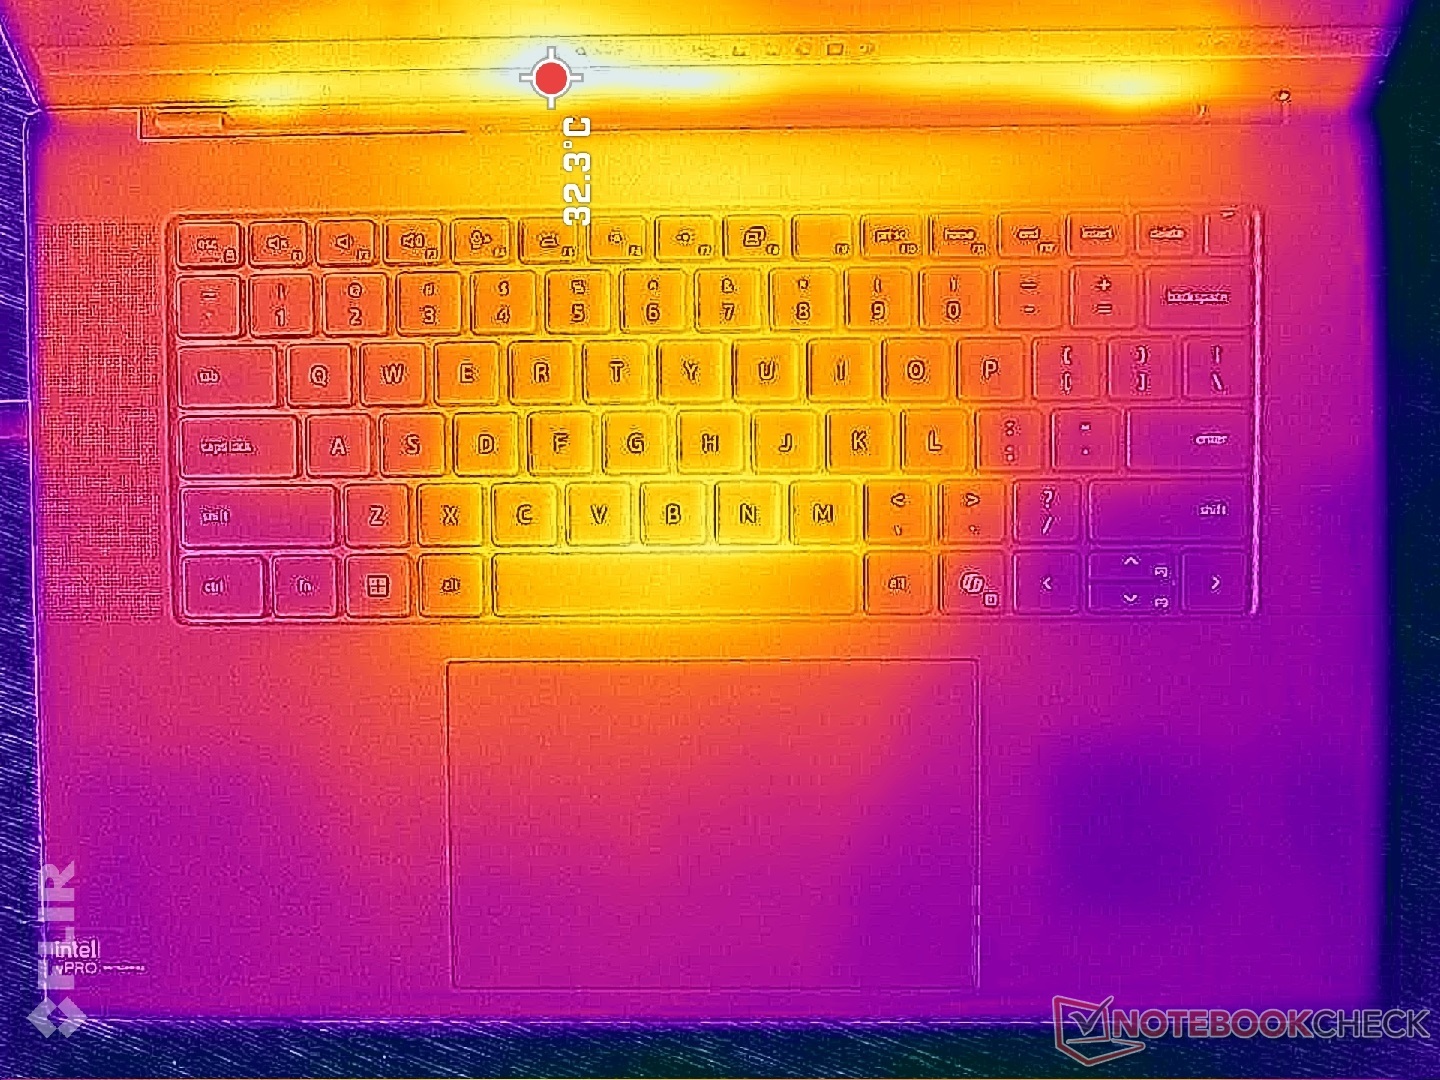
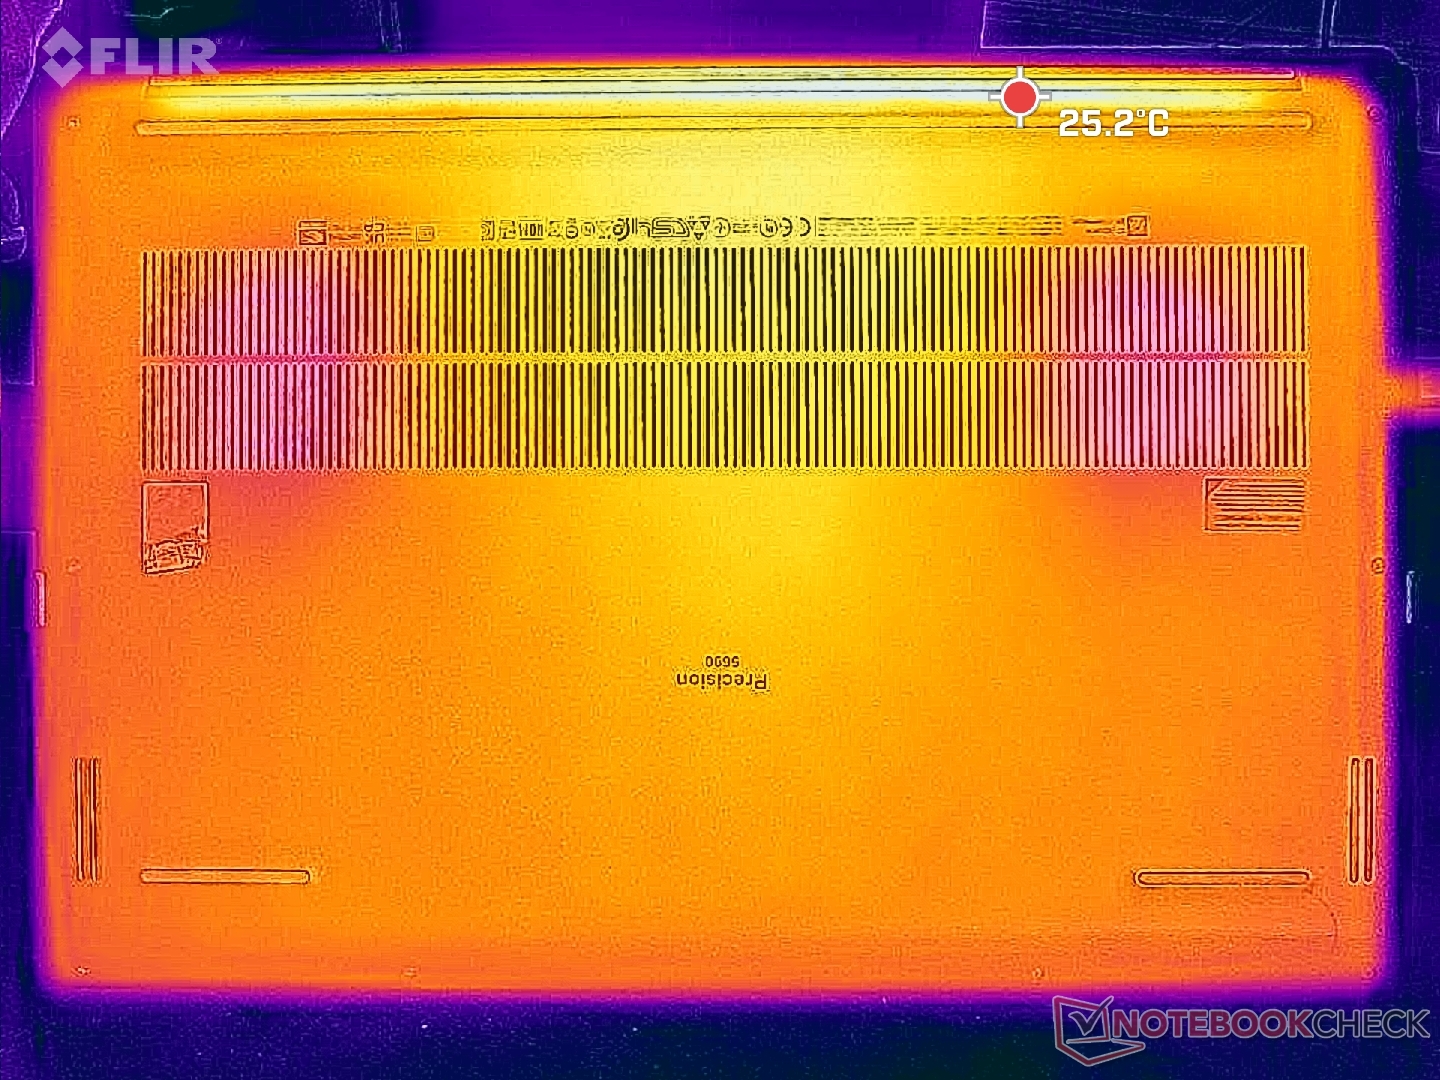
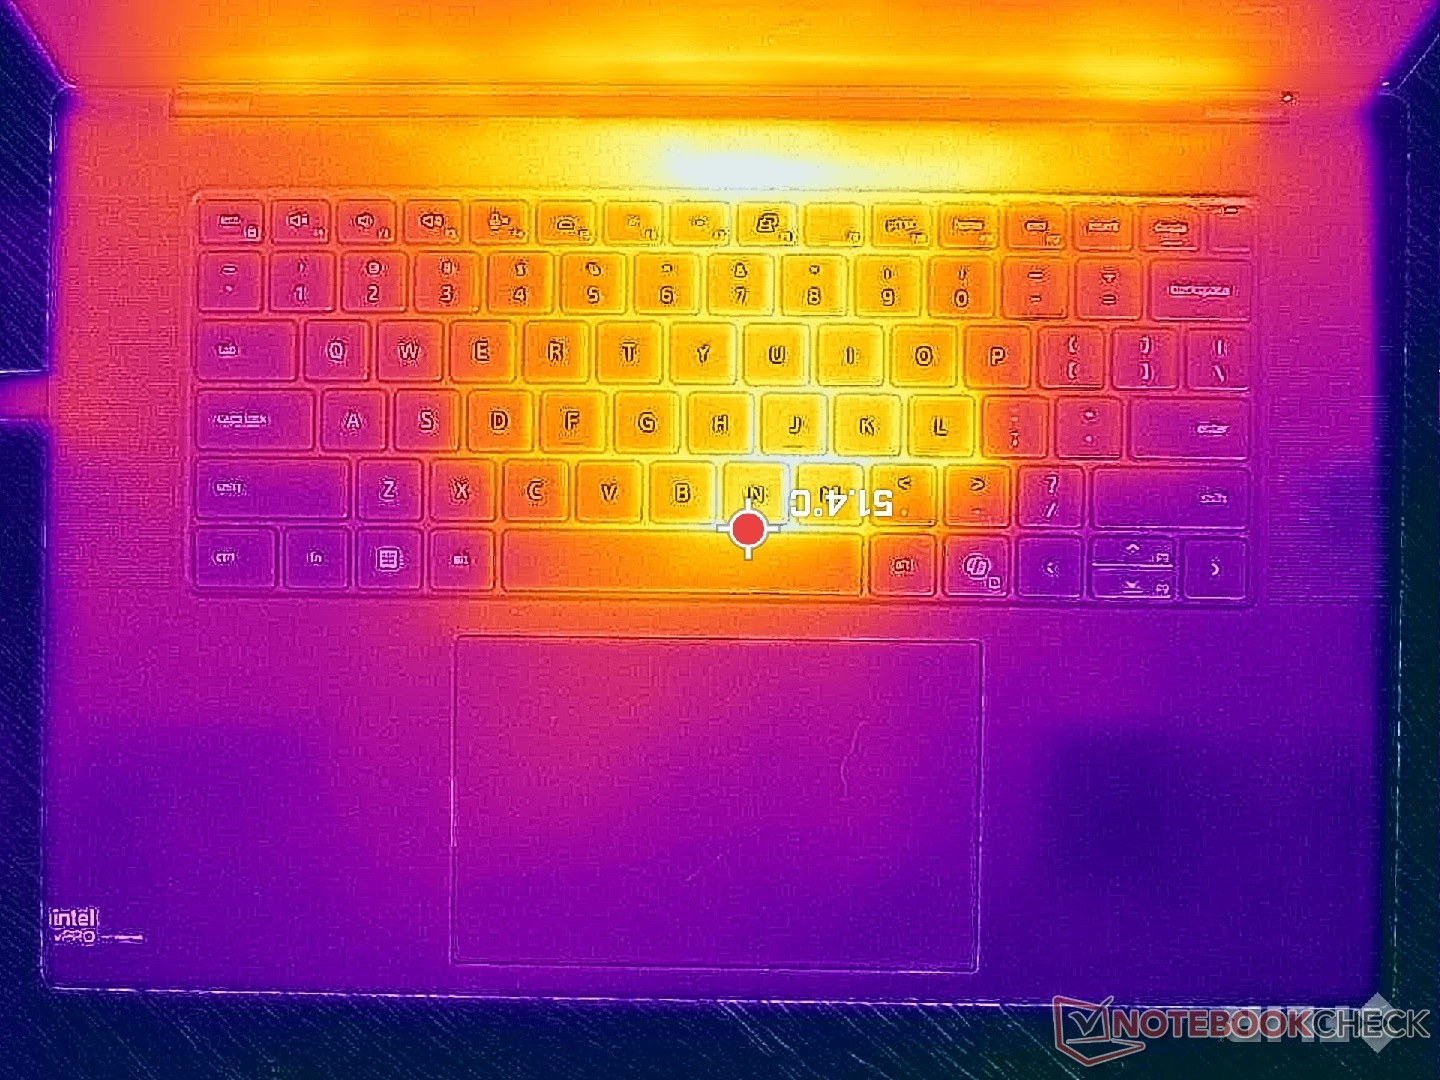
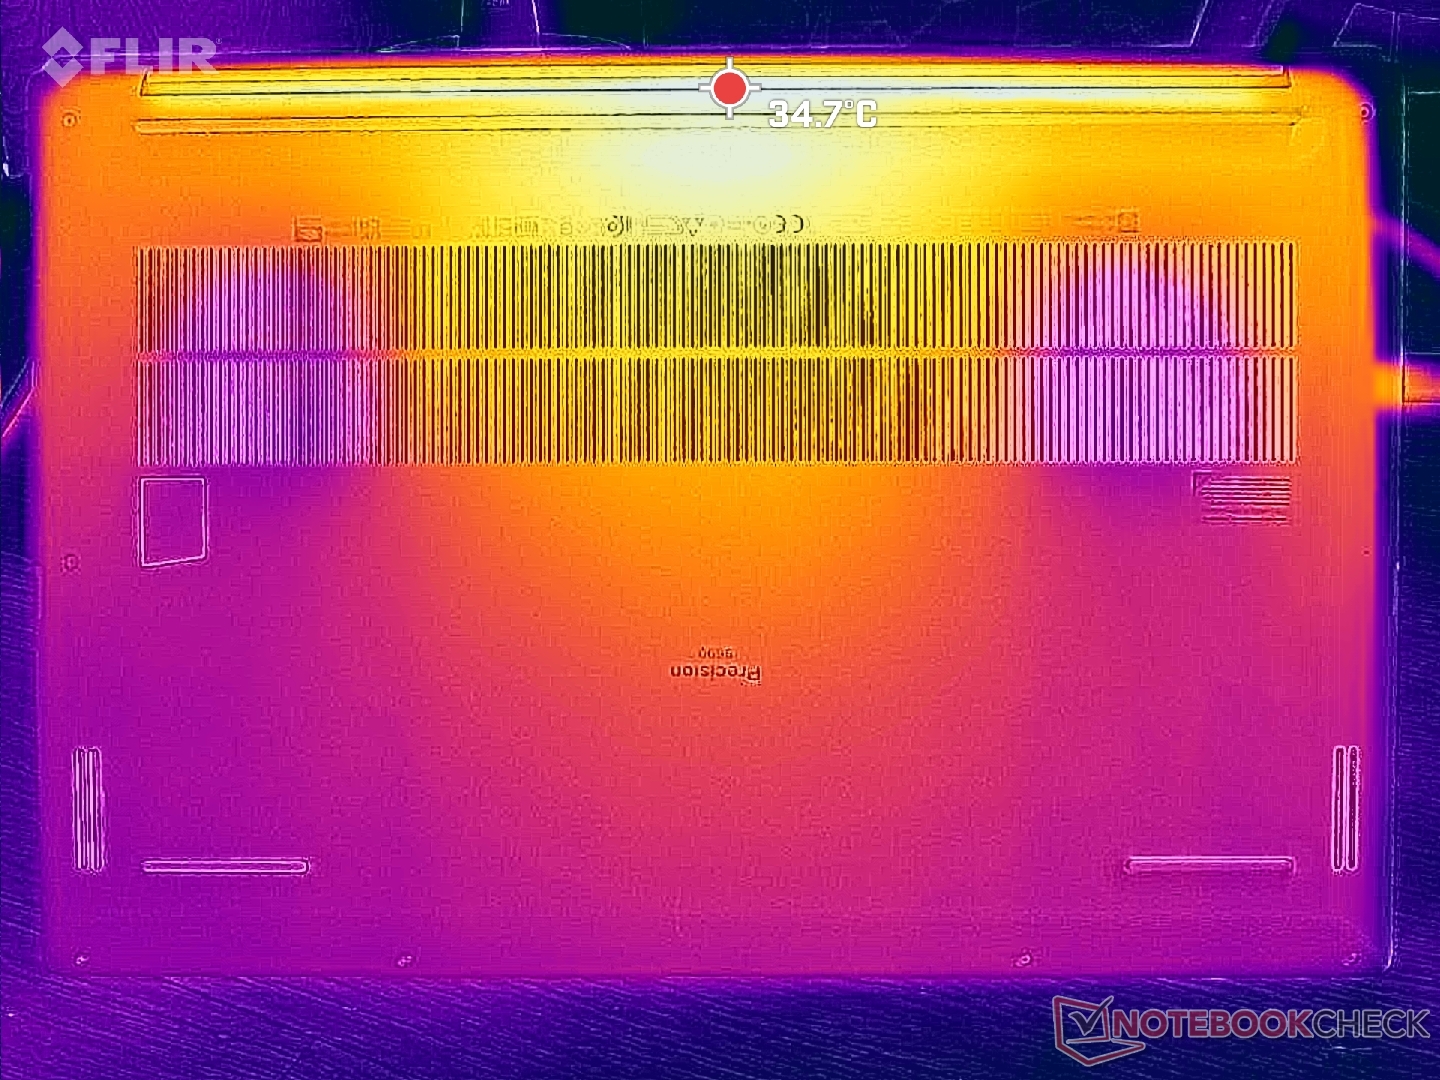
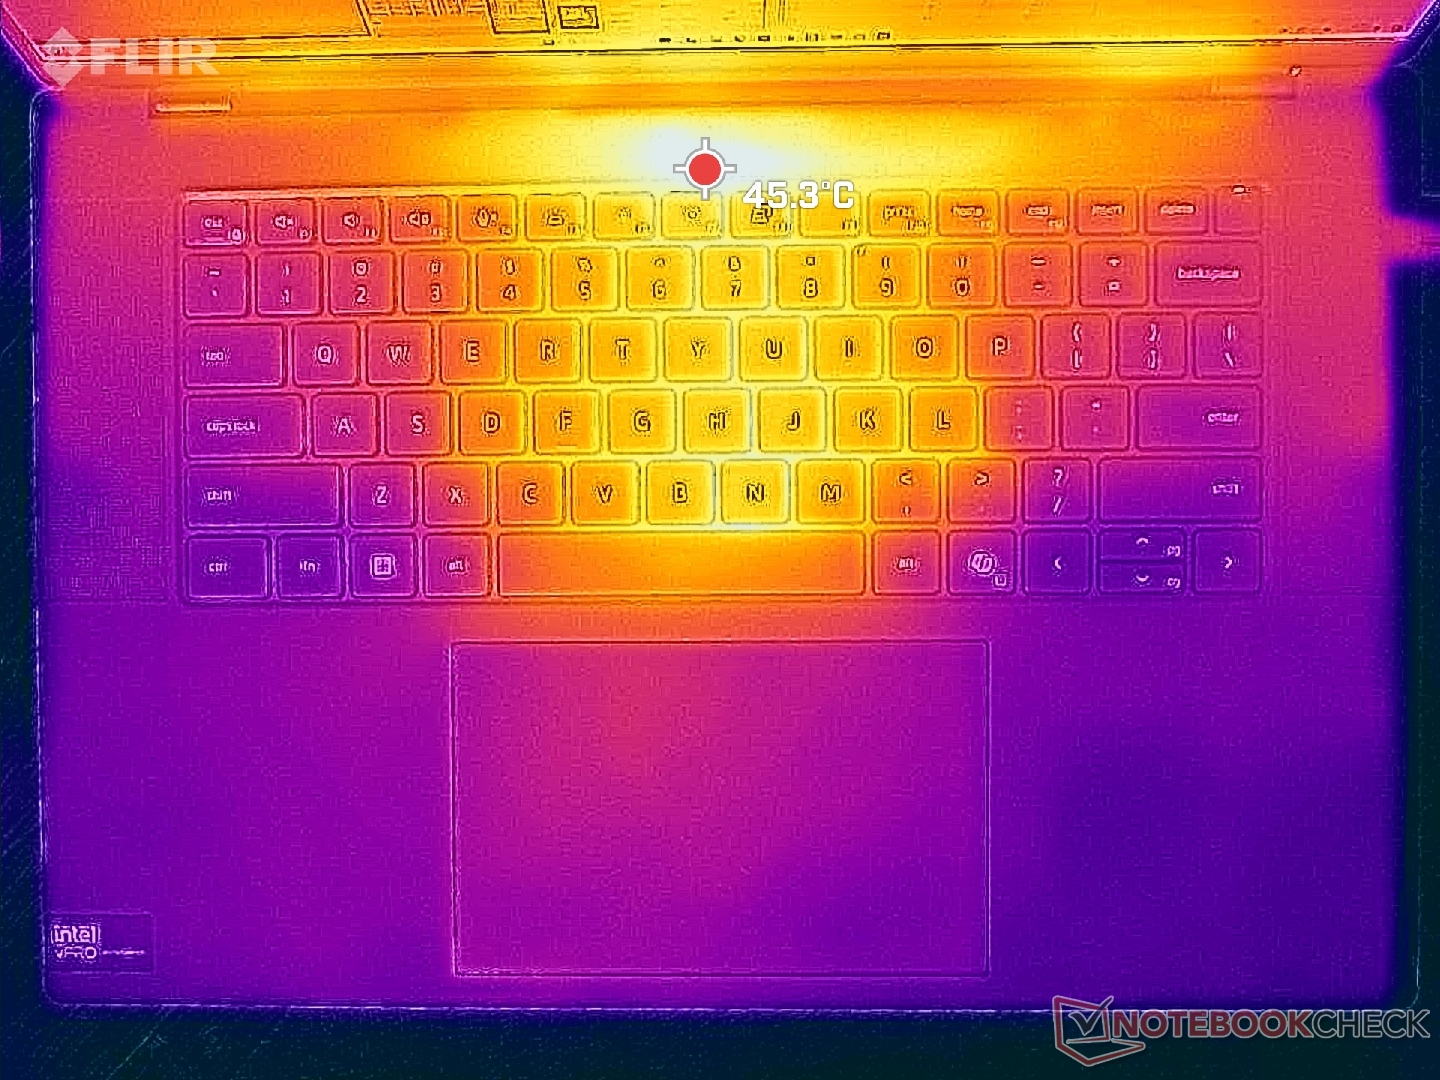
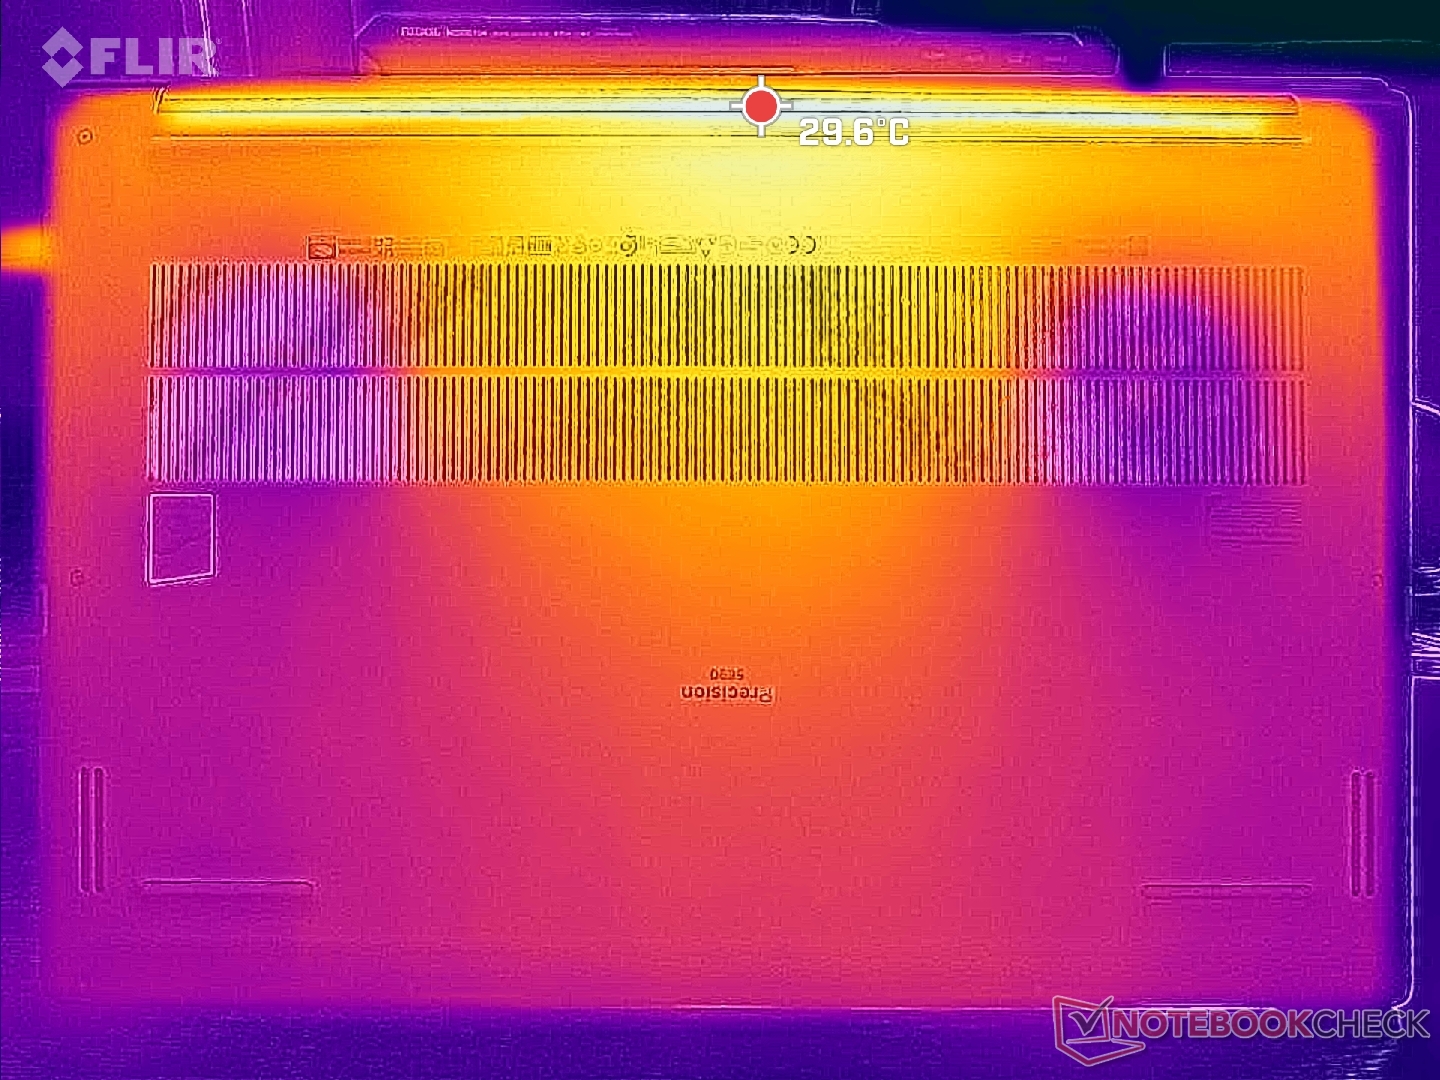
Hőmérséklet
A felszíni hőmérséklet alakulása szimmetrikus, a billentyűzet középpontja közelében 43 és 47 C közötti hőmérsékletű forró pontokkal. Az alváz alsó oldala még igényes terhelés esetén is érezhetően hűvösebb marad, mint a billentyűzetfedélzet.
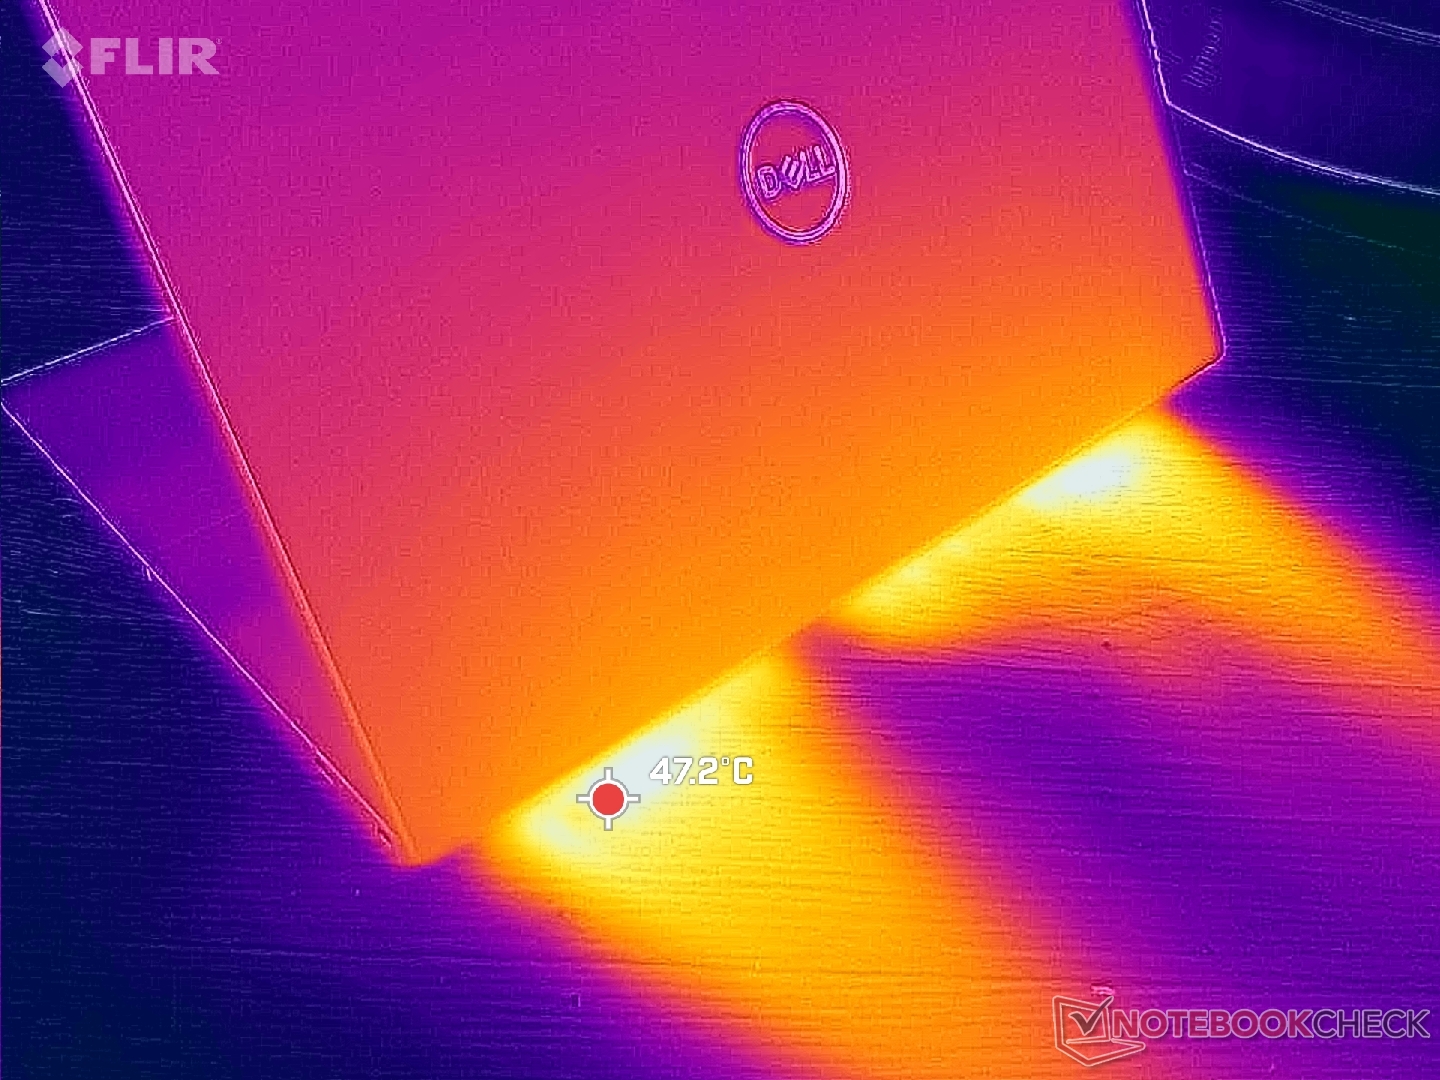
(-) A felső oldalon a maximális hőmérséklet 46.6 °C / 116 F, összehasonlítva a 38.2 °C / 101 F átlagával , 22.2 és 69.8 °C között a Workstation osztálynál.
(+) Az alsó maximum 33 °C / 91 F-ig melegszik fel, összehasonlítva a 41.1 °C / 106 F átlagával
(+) Üresjáratban a felső oldal átlagos hőmérséklete 29.2 °C / 85 F, összehasonlítva a 32 °C / ### eszközátlaggal class_avg_f### F.
(±) A The Witcher 3 játék során a felső oldal átlaghőmérséklete 34 °C / 93 F, összehasonlítva a 32 °C / ## eszközátlaggal #class_avg_f### F.
(+) A csuklótámasz és az érintőpad hűvösebb, mint a bőr hőmérséklete, maximum 27.6 °C / 81.7 F, ezért hűvös tapintású.
(±) A hasonló eszközök csuklótámasz területének átlagos hőmérséklete 27.8 °C / 82 F volt (+0.2 °C / 0.3 F).
| Dell Precision 5690 Intel Core Ultra 9 185H, NVIDIA RTX 5000 Ada Generation Laptop | Dell Precision 5000 5680 Intel Core i9-13900H, NVIDIA RTX 5000 Ada Generation Laptop | Lenovo ThinkPad P16 G2 21FA000FGE Intel Core i7-13700HX, NVIDIA RTX 2000 Ada Generation Laptop | Lenovo ThinkPad P1 G6-21FV000DGE Intel Core i9-13900H, NVIDIA RTX 2000 Ada Generation Laptop | HP ZBook Fury 16 G10 Intel Core i9-13950HX, NVIDIA RTX 5000 Ada Generation Laptop | MSI CreatorPro Z16P B12UKST Intel Core i7-12700H, NVIDIA RTX A3000 Laptop GPU | |
|---|---|---|---|---|---|---|
| Heat | -7% | 2% | -13% | -16% | -24% | |
| Maximum Upper Side * (°C) | 46.6 | 50.2 -8% | 47.2 -1% | 47.1 -1% | 44.8 4% | 56.3 -21% |
| Maximum Bottom * (°C) | 33 | 32 3% | 39.5 -20% | 56.5 -71% | 50 -52% | 68.3 -107% |
| Idle Upper Side * (°C) | 32.4 | 37.4 -15% | 28.1 13% | 28.1 13% | 34.4 -6% | 25.2 22% |
| Idle Bottom * (°C) | 29.4 | 31.2 -6% | 25.3 14% | 27.6 6% | 31.8 -8% | 25.9 12% |
* ... a kisebb jobb
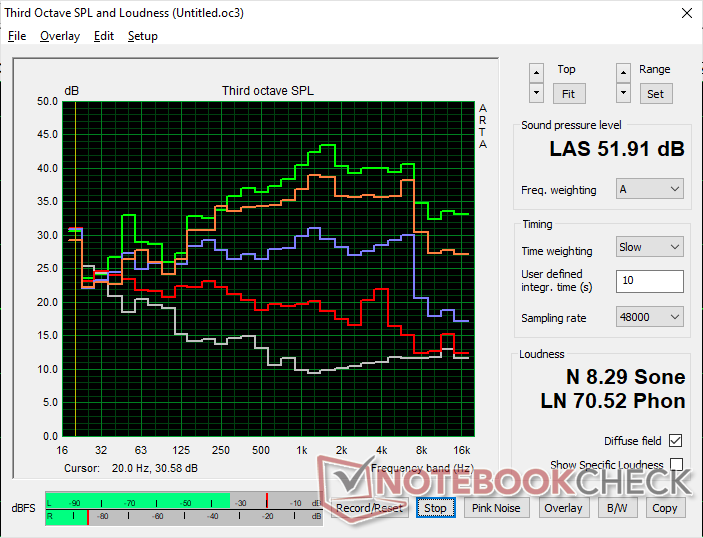
Hangszórók
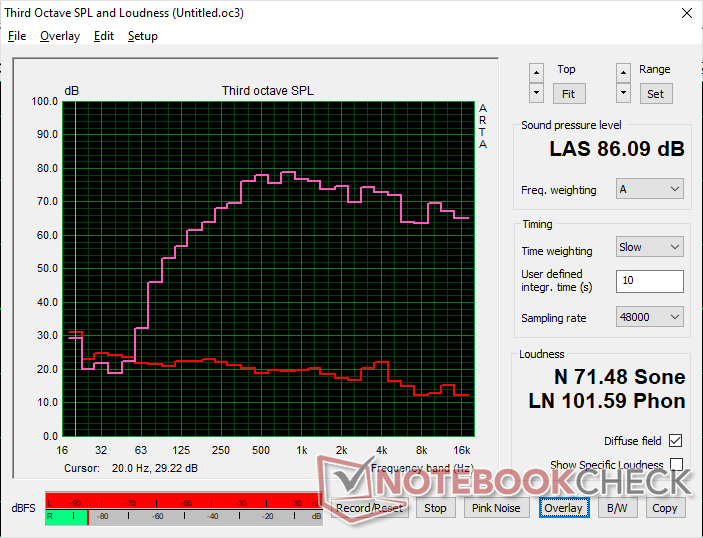
Dell Precision 5690 hangelemzés
(+) | a hangszórók viszonylag hangosan tudnak játszani (86.1 dB)
Basszus 100 - 315 Hz
(±) | csökkentett basszus – átlagosan 9.4%-kal alacsonyabb, mint a medián
(±) | a basszus linearitása átlagos (7.6% delta az előző frekvenciához)
Közepes 400-2000 Hz
(+) | kiegyensúlyozott középpontok – csak 4.7% választja el a mediántól
(+) | a középpontok lineárisak (4.8% delta az előző frekvenciához)
Maximum 2-16 kHz
(+) | kiegyensúlyozott csúcsok – csak 3.4% választja el a mediántól
(±) | a csúcsok linearitása átlagos (7.3% delta az előző gyakorisághoz)
Összességében 100 - 16.000 Hz
(+) | általános hangzás lineáris (11.1% eltérés a mediánhoz képest)
Ugyanazon osztályhoz képest
» 12%Ebben az osztályban az összes tesztelt eszköz %-a jobb volt, 4% hasonló, 84%-kal rosszabb
» A legjobb delta értéke 7%, az átlag 17%, a legrosszabb 35% volt
Az összes tesztelt eszközzel összehasonlítva
» 7% az összes tesztelt eszköz jobb volt, 2% hasonló, 92%-kal rosszabb
» A legjobb delta értéke 4%, az átlag 24%, a legrosszabb 134% volt
Apple MacBook Pro 16 2021 M1 Pro hangelemzés
(+) | a hangszórók viszonylag hangosan tudnak játszani (84.7 dB)
Basszus 100 - 315 Hz
(+) | jó basszus – csak 3.8% választja el a mediántól
(+) | a basszus lineáris (5.2% delta az előző frekvenciához)
Közepes 400-2000 Hz
(+) | kiegyensúlyozott középpontok – csak 1.3% választja el a mediántól
(+) | a középpontok lineárisak (2.1% delta az előző frekvenciához)
Maximum 2-16 kHz
(+) | kiegyensúlyozott csúcsok – csak 1.9% választja el a mediántól
(+) | a csúcsok lineárisak (2.7% delta az előző frekvenciához képest)
Összességében 100 - 16.000 Hz
(+) | általános hangzás lineáris (4.6% eltérés a mediánhoz képest)
Ugyanazon osztályhoz képest
» 0%Ebben az osztályban az összes tesztelt eszköz %-a jobb volt, 0% hasonló, 100%-kal rosszabb
» A legjobb delta értéke 5%, az átlag 17%, a legrosszabb 45% volt
Az összes tesztelt eszközzel összehasonlítva
» 0% az összes tesztelt eszköz jobb volt, 0% hasonló, 100%-kal rosszabb
» A legjobb delta értéke 4%, az átlag 24%, a legrosszabb 134% volt
Energiagazdálkodás
Energiafogyasztás
Az asztali gépen az üresjárat a minimális fényerő beállításnál akár 8 W-ot, a maximális fényerő beállításnál pedig 29 W-ot is igényelhet teljesen fehér háttérrel. Ez a tartomány az OLED működésének köszönhetően szélesebb, mint a legtöbb IPS laptop esetében. Az olyan feladatok, mint a webböngészés, a szövegszerkesztés vagy a táblázatkezelés bevitele gyorsabban lemeríthetik az akkumulátort, mint azt várnánk, mivel ezek az ablakok többnyire fehér színűek. A fényerő csökkentésével vagy a sötétebb színek kiválasztásával jobban meghosszabbítható az akkumulátor élettartama, mint egy IPS-alternatívánál.
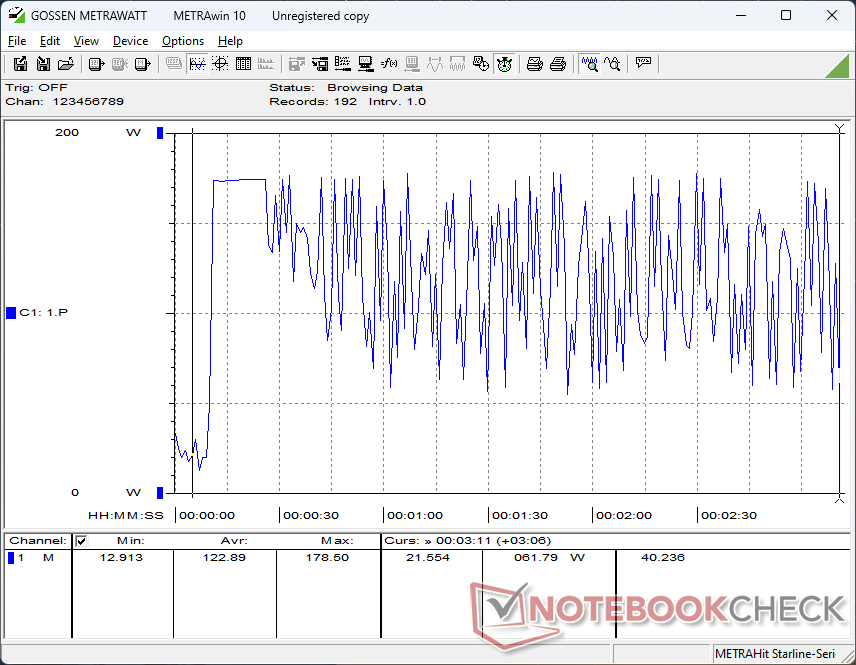
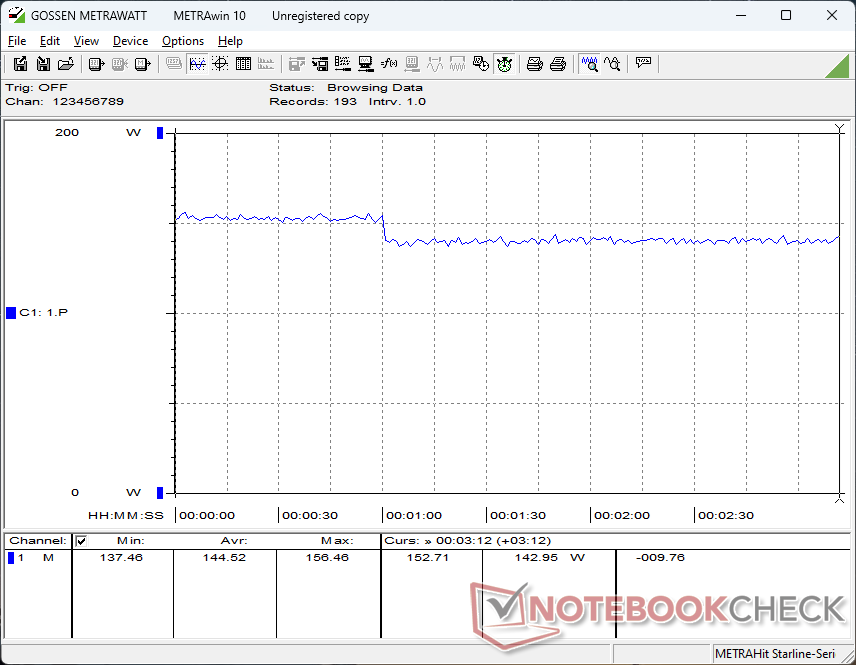
Az energiafogyasztás nagyobb terhelés esetén, például Witcher 3 közel azonos lenne azzal, amit a régebbi Precision 5680 esetében mértünk. Ez alátámasztja a fenti benchmark-adatainkat, amelyek szintén legfeljebb csak marginális teljesítménykülönbségeket mutatnak a két modell között.
Furcsa módon a fogyasztás a Prime95 stressz futtatásakor még többszöri újratesztelés után is vadul ingadozott. A teljesítmény egyébként egyenletesnek tűnik.
| Kikapcsolt állapot / Készenlét | |
| Üresjárat | |
| Terhelés |
|
Kulcs:
min: | |
| Dell Precision 5690 Ultra 9 185H, RTX 5000 Ada Generation Laptop, 2x Samsung PM9A1 1TB (RAID 0), OLED, 3840x2400, 16" | Dell Precision 5000 5680 i9-13900H, RTX 5000 Ada Generation Laptop, 2x SK hynix PC801 HFS512GEJ9X101N RAID 0, OLED, 3840x2400, 16" | Lenovo ThinkPad P16 G2 21FA000FGE i7-13700HX, RTX 2000 Ada Generation Laptop, SK hynix PC801 HFS001TEJ9X162N, IPS LED, 2560x1600, 16" | Lenovo ThinkPad P1 G6-21FV000DGE i9-13900H, RTX 2000 Ada Generation Laptop, SK Hynix PC711 1TB HFS001TDE9X084N, IPS, 2560x1600, 16" | HP ZBook Fury 16 G10 i9-13950HX, RTX 5000 Ada Generation Laptop, SK hynix PC801 HFS001TEJ9X101N, IPS, 3840x2400, 16" | MSI CreatorPro Z16P B12UKST i7-12700H, RTX A3000 Laptop GPU, Samsung PM9A1 MZVL21T0HCLR, IPS, 2560x1600, 16" | |
|---|---|---|---|---|---|---|
| Power Consumption | 6% | -5% | 10% | -39% | -9% | |
| Idle Minimum * (Watt) | 7.9 | 8 -1% | 9.3 -18% | 8.3 -5% | 15.3 -94% | 10.8 -37% |
| Idle Average * (Watt) | 12 | 10.4 13% | 14.1 -18% | 14.5 -21% | 18.2 -52% | 16.3 -36% |
| Idle Maximum * (Watt) | 28.6 | 30.5 -7% | 15.5 46% | 15.3 47% | 28 2% | 16.9 41% |
| Load Average * (Watt) | 98.8 | 75.4 24% | 133.6 -35% | 91.8 7% | 137.9 -40% | 111.7 -13% |
| Witcher 3 ultra * (Watt) | 144.5 | 134 7% | 144.9 -0% | 104.7 28% | 189.4 -31% | 152.1 -5% |
| Load Maximum * (Watt) | 174.8 | 175 -0% | 179.6 -3% | 164.5 6% | 202 -16% | 177.4 -1% |
* ... a kisebb jobb
Power Consumption Witcher 3 / Stresstest
Power Consumption external Monitor
Az akkumulátor élettartama
A futási idők nagyjából ugyanolyanok, mint korábban, ha nem valamivel rövidebbek. WLAN-tesztünk alig több mint 9 órát tartana, míg a Precision 5680 hasonló körülmények között közelebb van a 10 órához.
| Dell Precision 5690 Ultra 9 185H, RTX 5000 Ada Generation Laptop, 98 Wh | Dell Precision 5000 5680 i9-13900H, RTX 5000 Ada Generation Laptop, 98 Wh | Lenovo ThinkPad P16 G2 21FA000FGE i7-13700HX, RTX 2000 Ada Generation Laptop, 94 Wh | Lenovo ThinkPad P1 G6-21FV000DGE i9-13900H, RTX 2000 Ada Generation Laptop, 90 Wh | HP ZBook Fury 16 G10 i9-13950HX, RTX 5000 Ada Generation Laptop, 95 Wh | MSI CreatorPro Z16P B12UKST i7-12700H, RTX A3000 Laptop GPU, 90 Wh | |
|---|---|---|---|---|---|---|
| Akkumulátor üzemidő | 8% | -7% | 3% | -21% | -37% | |
| WiFi v1.3 (h) | 9.2 | 9.9 8% | 8.6 -7% | 9.5 3% | 7.3 -21% | 5.8 -37% |
| Reader / Idle (h) | 17.9 | |||||
| Load (h) | 1.7 | 1.1 | ||||
| H.264 (h) | 11.2 |
Pro
Kontra
Vélemény - Készen áll az AI forradalomra
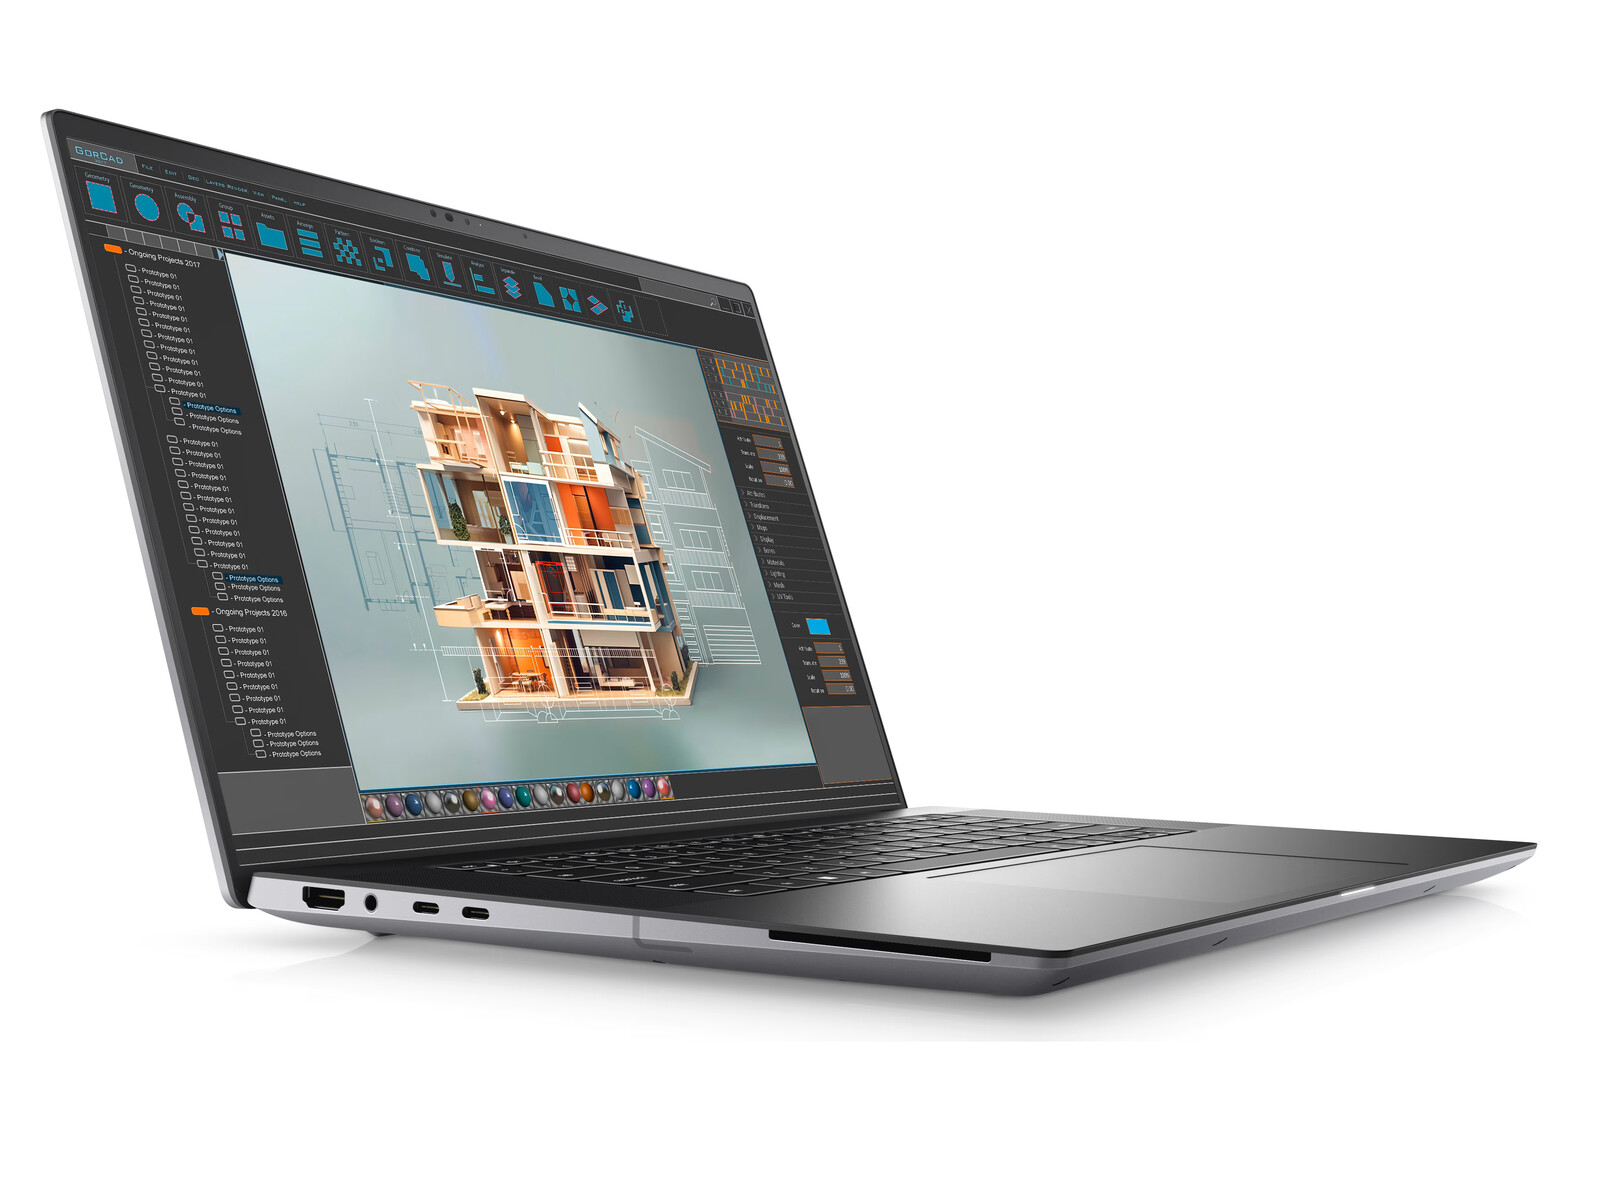
A Precision 5680 egy új, elegáns dizájnnal jelent meg, amely a XPS 16 vPro CPU-kkal és csúcskategóriás Nvidia RTX Ada grafikával kiegészítve. Ezt követően a méretéhez és súlyához képest az egyik leggyorsabb 16 hüvelykes munkaállomássá vált. A probléma itt az, hogy a Precision 5680 alig fél éves, és még mindig elég friss. Az újabb Precision 5690 ugyanolyan vázat, GPU-t, kijelzőt, fogyasztási szintet, akkumulátoros üzemidőt és processzorteljesítményt kínál, mint a Precision 5680. Ha egy kis pénzt szeretne spórolni, akkor a tavalyi Precision 5680 lényegében ugyanazt a felhasználói élményt és teljesítményt kínálja kevesebbért.
)(()()
A fő megkülönböztető tényező, amely elválasztja a 2024 Precision 5690-t a 2023 Precision 5680-tól, a Meteor Lake-H sorozatú CPU-k integrált NPU-jában rejlik. Az újabb Dell modell tehát "AI ready", amikor a Windows a helyi AI feladatokra optimalizálva lesz. Ha például már használja a Co-Pilotot, vagy arra számít, hogy a közeljövőben több, AI-val bővített alkalmazást fog futtatni, akkor a Precision 5690 az NPU gyorsításnak köszönhetően jelentős előnyre tehet szert. Egyébként a legtöbb "hagyományos" feladat nem fog észrevehetően gyorsabban futni a legújabb modellen.
Ár és elérhetőség
A Dell mostantól szállítja a Precision 5690-t. A Core Ultra 5 135H CPU, csak integrált grafika és 1200p IPS kijelző esetén 2290 dollárról indul a szállítás, és jóval 5000 dollár fölé emelkedik, ha Core Ultra 9 185H, RTX 5000 Ada és 2400p OLED érintőképernyővel konfigurálják.
Dell Precision 5690
- 05/08/2024 v7 (old)
Allen Ngo
Átláthatóság
A felülvizsgálandó készülékek kiválasztását szerkesztőségünk végzi. A tesztmintát a gyártó vagy a kiskereskedő kölcsönként bocsátotta a szerző rendelkezésére a felülvizsgálat céljából. A hitelezőnek nem volt befolyása erre a felülvizsgálatra, és a gyártó sem kapott másolatot erről a felülvizsgálatról a közzététel előtt. Nem volt kötelesség ezt az ismertetőt közzétenni. Független médiavállalatként a Notebookcheck nincs alávetve a gyártók, kiskereskedők vagy kiadók felhatalmazásának.
Így tesztel a Notebookcheck
A Notebookcheck minden évben független, laptopok és okostelefonok százait vizsgálja meg szabványosított eljárások alkalmazásával annak érdekében, hogy minden eredmény összehasonlítható legyen. Körülbelül 20 éve folyamatosan fejlesztjük vizsgálati módszereinket, és ennek során iparági szabványokat állítottunk fel. Tesztlaboratóriumainkban kiváló minőségű mérőberendezéseket használnak tapasztalt technikusok és szerkesztők. Ezek a tesztek többlépcsős validációs folyamatot foglalnak magukban. Komplex minősítési rendszerünk több száz megalapozott mérésen és benchmarkon alapul, ami megőrzi az objektivitást.Price comparison

