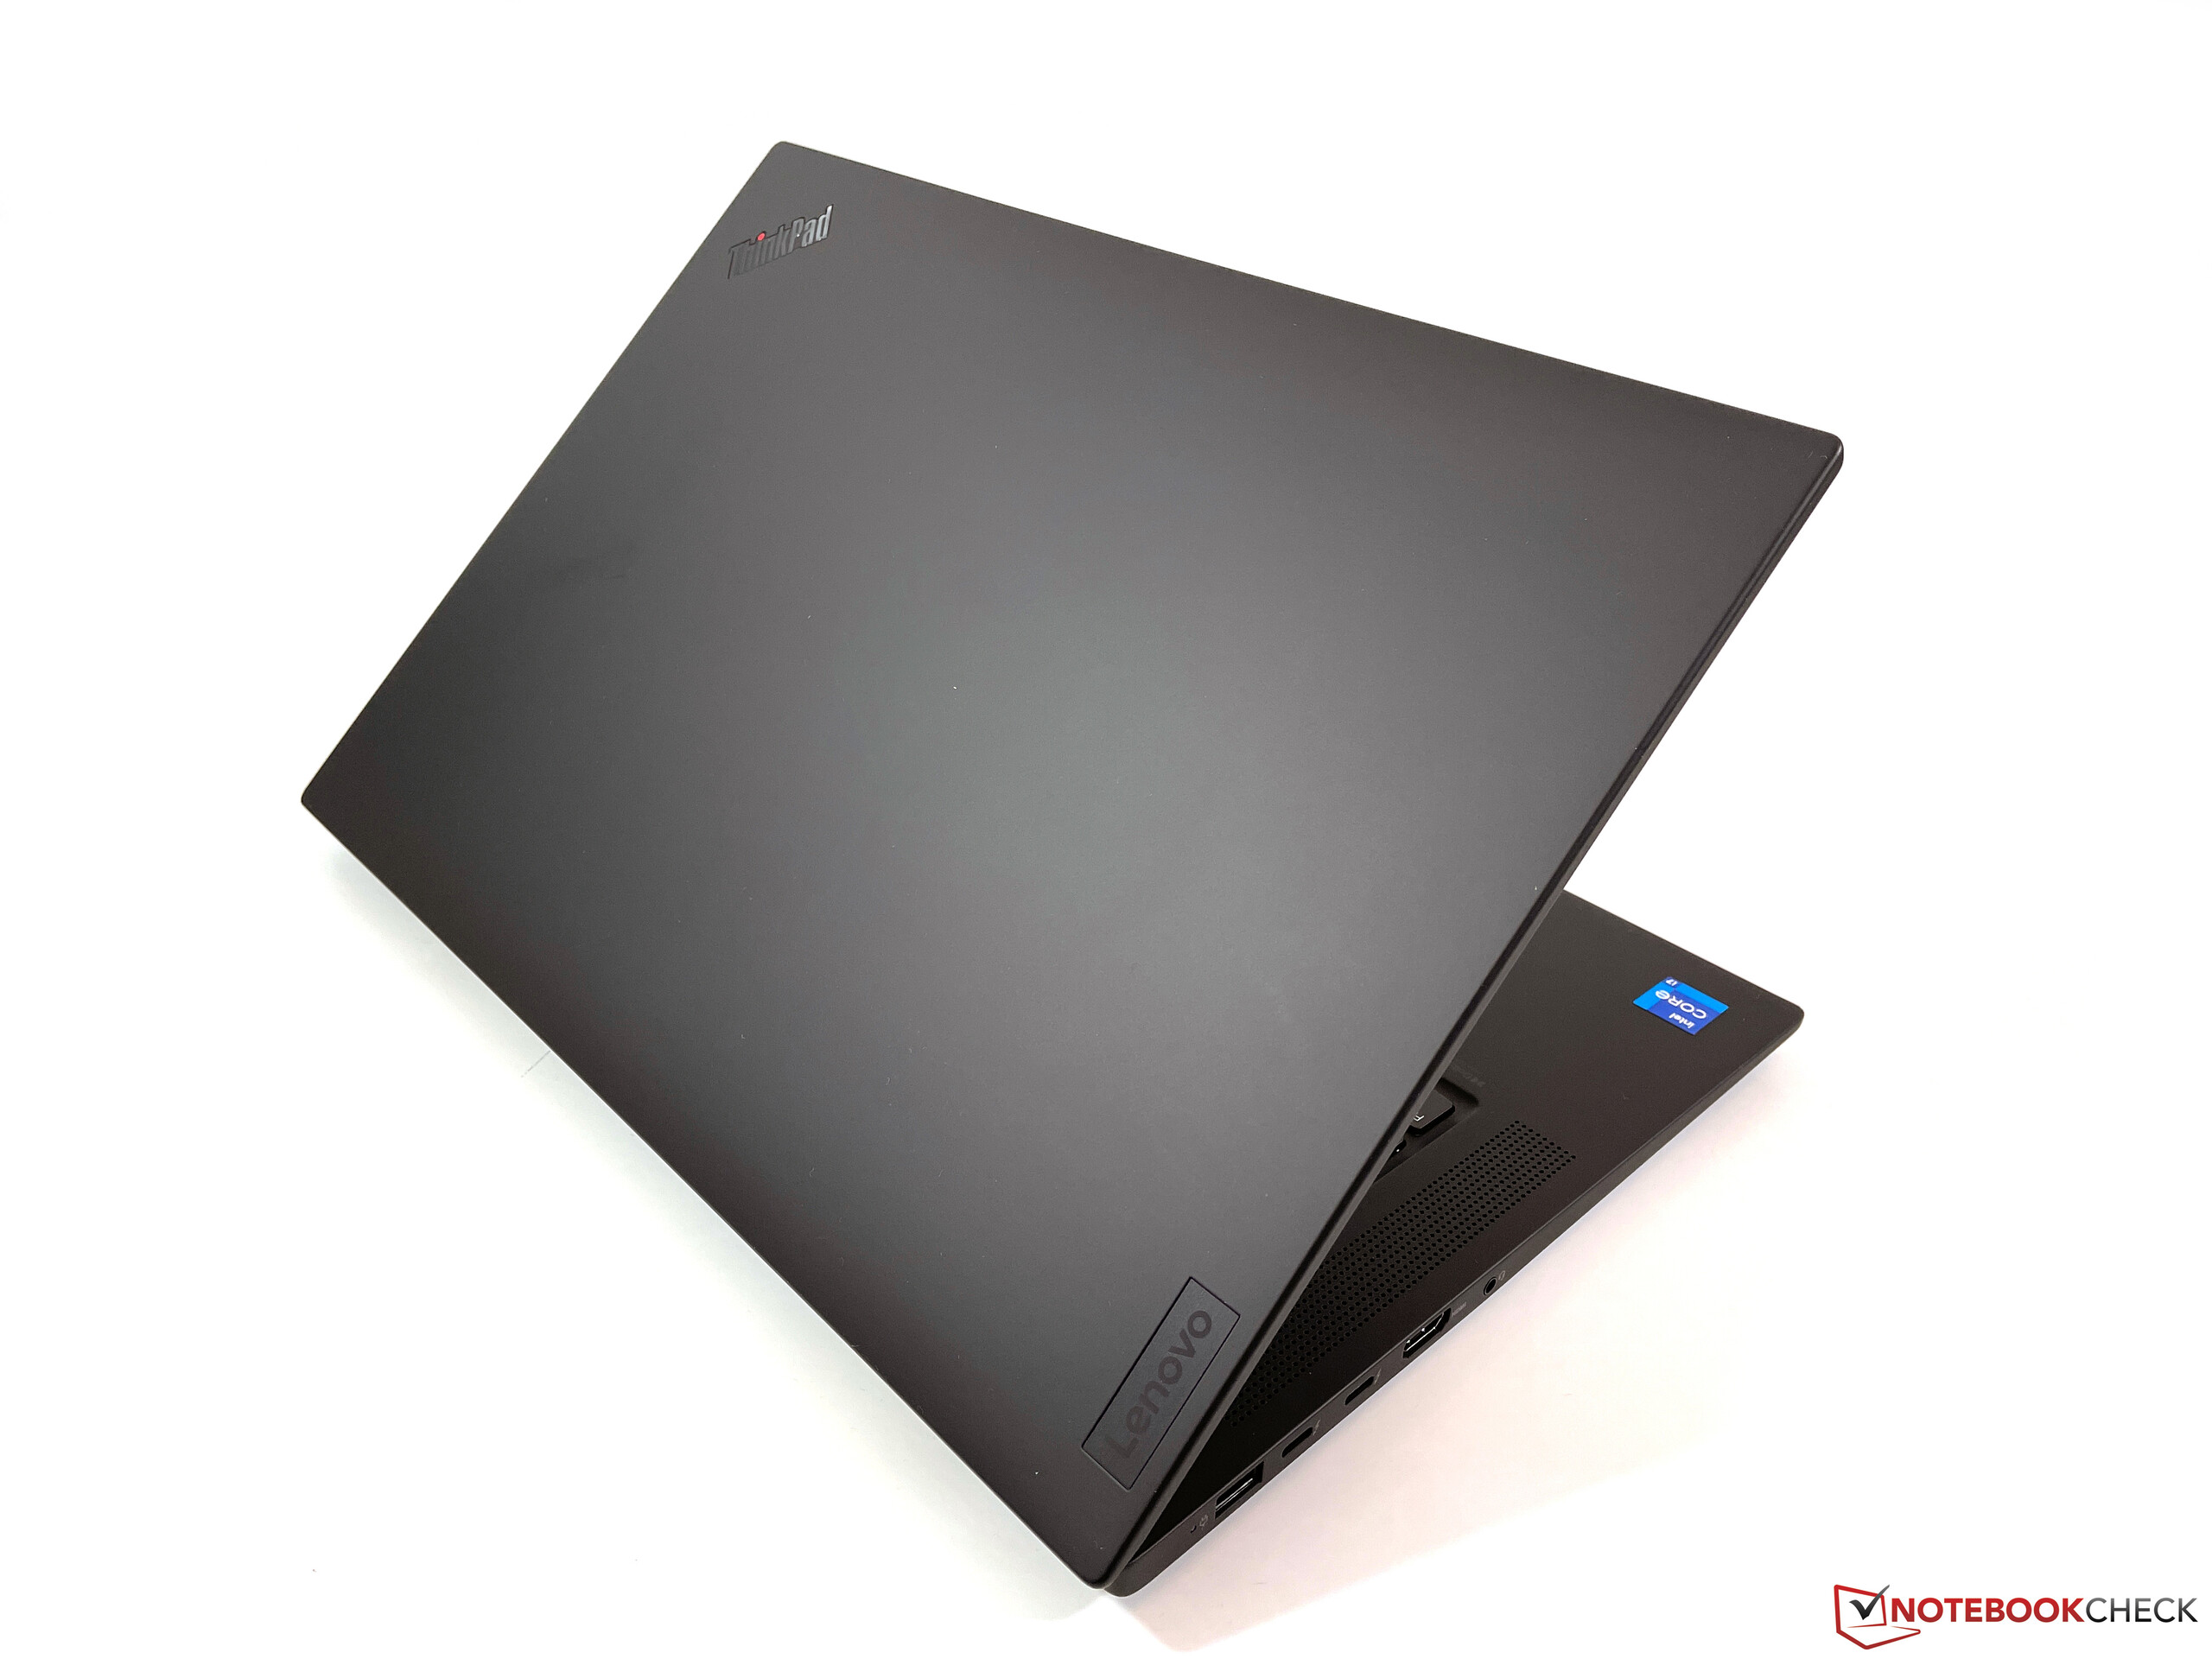
Lenovo ThinkPad P1 Laptop - Az X1 Extreme G4 munkaállomás verziója, rövid értékelés
Possible Competitors
Értékelés | Dátum | Modell | Súly | Magasság | Méret | Felbontás | Legjobb ár |
|---|---|---|---|---|---|---|---|
| 89.4 % v7 (old) | 12/2021 | Lenovo ThinkPad P1 G4-20Y30017GE i7-11800H, T1200 Laptop GPU | 1.8 kg | 17.7 mm | 16.00" | 2560x1600 | |
| 86.9 % v7 (old) | 03/2020 | Dell Precision 5540 i9-9980HK, Quadro T2000 Max-Q | 2 kg | 17 mm | 15.60" | 3840x2160 | |
| 89.7 % v7 (old) | 01/2020 | Apple MacBook Pro 16 2019 i9 5500M i9-9880H, Radeon Pro 5500M | 2 kg | 16.2 mm | 16.00" | 3072x1920 | |
| 87.8 % v7 (old) | 10/2021 | HP ZBook Studio 15 G8 i9-11950H, GeForce RTX 3070 Laptop GPU | 1.9 kg | 18 mm | 15.60" | 3840x2160 | |
| 87 % v7 (old) | 01/2022 | Lenovo ThinkBook 16p G2 ACH R9 5900HX, GeForce RTX 3060 Laptop GPU | 2 kg | 19.5 mm | 16.00" | 2560x1600 |
| SD Card Reader | |
| average JPG Copy Test (av. of 3 runs) | |
| Lenovo ThinkPad P1 G4-20Y30017GE (AV PRO V60) | |
| Lenovo ThinkPad P1 2019-20QT000RGE (Toshiba Exceria Pro SDXC 64 GB UHS-II) | |
| Dell Precision 5540 (Toshiba Exceria Pro SDXC 64 GB UHS-II) | |
| Az osztály átlaga Workstation (49.6 - 681, n=13, az elmúlt 2 évben) | |
| Lenovo ThinkBook 16p G2 ACH | |
| HP ZBook Studio 15 G8 (AV Pro V60) | |
| maximum AS SSD Seq Read Test (1GB) | |
| Az osztály átlaga Workstation (87.6 - 1455, n=13, az elmúlt 2 évben) | |
| Lenovo ThinkPad P1 2019-20QT000RGE (Toshiba Exceria Pro SDXC 64 GB UHS-II) | |
| Lenovo ThinkPad P1 G4-20Y30017GE (AV PRO V60) | |
| Dell Precision 5540 (Toshiba Exceria Pro SDXC 64 GB UHS-II) | |
| HP ZBook Studio 15 G8 (AV Pro V60) | |
| Lenovo ThinkBook 16p G2 ACH | |
| Networking | |
| iperf3 transmit AX12 | |
| HP ZBook Studio 15 G8 | |
| Lenovo ThinkPad P1 G4-20Y30017GE | |
| Átlagos Intel Wi-Fi 6E AX210 (675 - 1602, n=27) | |
| Lenovo ThinkPad P1 2019-20QT000RGE | |
| Lenovo ThinkBook 16p G2 ACH | |
| Dell Precision 5540 | |
| Apple MacBook Pro 16 2019 i9 5500M | |
| iperf3 receive AX12 | |
| Lenovo ThinkPad P1 G4-20Y30017GE | |
| HP ZBook Studio 15 G8 | |
| Átlagos Intel Wi-Fi 6E AX210 (914 - 1716, n=27) | |
| Apple MacBook Pro 16 2019 i9 5500M | |
| Lenovo ThinkBook 16p G2 ACH | |
| Dell Precision 5540 | |
| Lenovo ThinkPad P1 2019-20QT000RGE | |


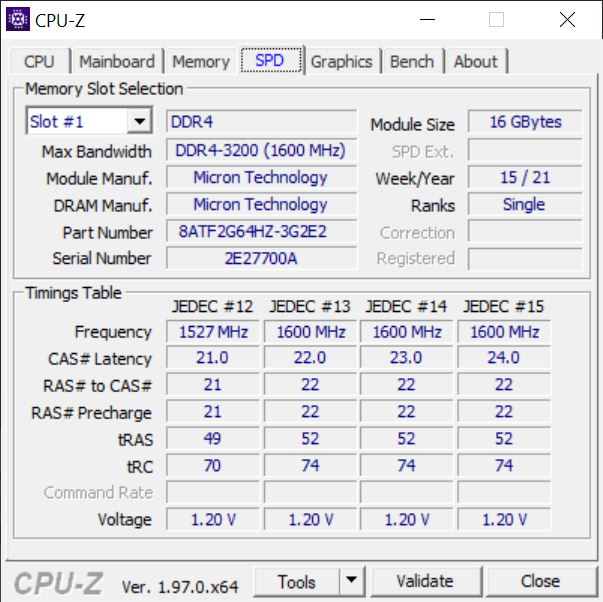
| |||||||||||||||||||||||||
Fényerő megoszlás: 90 %
Centrumban: 418 cd/m²
Kontraszt: 1400:1 (Fekete: 0.3 cd/m²)
ΔE ColorChecker Calman: 2.5 | ∀{0.5-29.43 Ø4.71}
calibrated: 1.6
ΔE Greyscale Calman: 3.4 | ∀{0.09-98 Ø4.96}
78.1% AdobeRGB 1998 (Argyll 3D)
99.9% sRGB (Argyll 3D)
77.3% Display P3 (Argyll 3D)
Gamma: 2.24
CCT: 6479 K
| Lenovo ThinkPad P1 G4-20Y30017GE B160QAN02.M, IPS, 2560x1600, 16" | Dell Precision 5540 SDCA029, OLED, 3840x2160, 15.6" | Apple MacBook Pro 16 2019 i9 5500M APPA044, IPS, 3072x1920, 16" | HP ZBook Studio 15 G8 SDC4145, OLED, 3840x2160, 15.6" | Lenovo ThinkBook 16p G2 ACH Lenovo LEN8A95 (AUO B160QAN02.M), IPS, 2560x1600, 16" | Lenovo ThinkPad P1 2019-20QT000RGE N156HCE-GN1, IPS LED, 1920x1080, 15.6" | |
|---|---|---|---|---|---|---|
| Display | 18% | 17% | -1% | -15% | ||
| Display P3 Coverage (%) | 77.3 | 99.9 29% | 99.9 29% | 76.4 -1% | 62.4 -19% | |
| sRGB Coverage (%) | 99.9 | 100 0% | 100 0% | 100 0% | 91.5 -8% | |
| AdobeRGB 1998 Coverage (%) | 78.1 | 97.3 25% | 95.3 22% | 77.4 -1% | 63.4 -19% | |
| Response Times | 91% | -30% | 93% | 25% | 32% | |
| Response Time Grey 50% / Grey 80% * (ms) | 40.8 ? | 2.8 ? 93% | 52.4 ? -28% | 2.4 ? 94% | 36 12% | 34.4 ? 16% |
| Response Time Black / White * (ms) | 26.4 ? | 3.2 ? 88% | 34.9 ? -32% | 2.4 ? 91% | 16.4 38% | 14 ? 47% |
| PWM Frequency (Hz) | 240.9 ? | 131700 | 240.4 ? | 26040 ? | ||
| Screen | -18% | 11% | -35% | 7% | -12% | |
| Brightness middle (cd/m²) | 420 | 427 2% | 519 24% | 379.6 -10% | 439 5% | 542 29% |
| Brightness (cd/m²) | 401 | 411 2% | 477 19% | 380 -5% | 397 -1% | 528 32% |
| Brightness Distribution (%) | 90 | 89 -1% | 86 -4% | 95 6% | 83 -8% | 84 -7% |
| Black Level * (cd/m²) | 0.3 | 0.39 -30% | 0.44 -47% | 0.41 -37% | ||
| Contrast (:1) | 1400 | 1331 -5% | 998 -29% | 1322 -6% | ||
| Colorchecker dE 2000 * | 2.5 | 3.2 -28% | 2.28 9% | 5.15 -106% | 1.68 33% | 3.5 -40% |
| Colorchecker dE 2000 max. * | 4.9 | 8.4 -71% | 6.54 -33% | 7.79 -59% | 2.36 52% | 7.8 -59% |
| Colorchecker dE 2000 calibrated * | 1.6 | 2.8 -75% | 0.86 46% | 3.1 -94% | 1.57 2% | 1.3 19% |
| Greyscale dE 2000 * | 3.4 | 1.8 47% | 0.9 74% | 2.6 24% | 1.64 52% | 4.8 -41% |
| Gamma | 2.24 98% | 2.15 102% | 2145 0% | 1.99 111% | 2.39 92% | 2.33 94% |
| CCT | 6479 100% | 6176 105% | 6572 99% | 6166 105% | 6616 98% | 7690 85% |
| Color Space (Percent of AdobeRGB 1998) (%) | 86.8 | 78 | 58.8 | |||
| Color Space (Percent of sRGB) (%) | 100 | 91.1 | ||||
| Teljes átlag (program / beállítások) | 30% /
9% | -10% /
4% | 25% /
-1% | 10% /
8% | 2% /
-7% |
* ... a kisebb jobb
Megjelenítési válaszidők
| ↔ Válaszidő Fekete-fehér | ||
|---|---|---|
| 26.4 ms ... emelkedés és süllyedés ↘ kombinálva | ↗ 14 ms emelkedés | 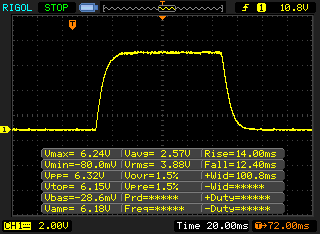 |
| ↘ 12.4 ms ősz | ||
| A képernyő viszonylag lassú reakciósebességet mutat tesztjeinkben, és túl lassú lehet a játékosok számára. Összehasonlításképpen, az összes tesztelt eszköz 0.1 (minimum) és 240 (maximum) ms között mozog. » 66 % of all devices are better. Ez azt jelenti, hogy a mért válaszidő rosszabb, mint az összes vizsgált eszköz átlaga (19.8 ms). | ||
| ↔ Válaszidő 50% szürke és 80% szürke között | ||
| 40.8 ms ... emelkedés és süllyedés ↘ kombinálva | ↗ 20.4 ms emelkedés | 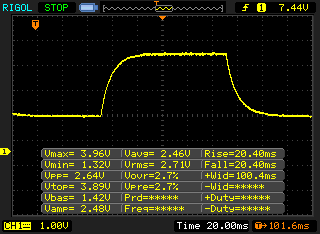 |
| ↘ 20.4 ms ősz | ||
| A képernyő lassú reakciósebességet mutat tesztjeinkben, és nem lesz kielégítő a játékosok számára. Összehasonlításképpen, az összes tesztelt eszköz 0.165 (minimum) és 636 (maximum) ms között mozog. » 64 % of all devices are better. Ez azt jelenti, hogy a mért válaszidő rosszabb, mint az összes vizsgált eszköz átlaga (30.9 ms). | ||
Képernyő villogása / PWM (impulzusszélesség-moduláció)
| Képernyő villogása / PWM nem érzékelhető | 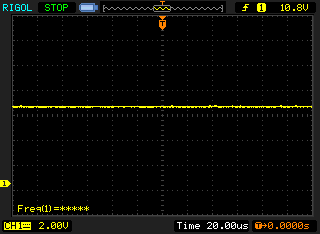 | ||
Összehasonlításképpen: az összes tesztelt eszköz 52 %-a nem használja a PWM-et a kijelző elsötétítésére. Ha PWM-et észleltek, akkor átlagosan 7741 (minimum: 5 - maximum: 343500) Hz-t mértek. | |||
Cinebench R15 Multi Dauertest
Cinebench R20: CPU (Multi Core) | CPU (Single Core)
Cinebench R15: CPU Multi 64Bit | CPU Single 64Bit
Blender: v2.79 BMW27 CPU
7-Zip 18.03: 7z b 4 | 7z b 4 -mmt1
Geekbench 5.5: Multi-Core | Single-Core
HWBOT x265 Benchmark v2.2: 4k Preset
LibreOffice : 20 Documents To PDF
R Benchmark 2.5: Overall mean
| Cinebench R23 / Multi Core | |
| Az osztály átlaga Workstation (14621 - 38520, n=22, az elmúlt 2 évben) | |
| Lenovo ThinkBook 16p G2 ACH | |
| HP ZBook Studio 15 G8 | |
| Átlagos Intel Core i7-11800H (6508 - 14088, n=48) | |
| Lenovo ThinkPad P1 G4-20Y30017GE | |
| Apple MacBook Pro 16 2019 i9 5500M | |
| Apple MacBook Pro 16 2019 i9 5500M | |
| Cinebench R23 / Single Core | |
| Az osztály átlaga Workstation (1712 - 2228, n=22, az elmúlt 2 évben) | |
| HP ZBook Studio 15 G8 | |
| Átlagos Intel Core i7-11800H (1386 - 1522, n=45) | |
| Lenovo ThinkBook 16p G2 ACH | |
| Lenovo ThinkPad P1 G4-20Y30017GE | |
| Apple MacBook Pro 16 2019 i9 5500M | |
| Cinebench R20 / CPU (Multi Core) | |
| Az osztály átlaga Workstation (5760 - 15043, n=22, az elmúlt 2 évben) | |
| Lenovo ThinkBook 16p G2 ACH | |
| HP ZBook Studio 15 G8 | |
| Átlagos Intel Core i7-11800H (2498 - 5408, n=50) | |
| Lenovo ThinkPad P1 G4-20Y30017GE | |
| Apple MacBook Pro 16 2019 i9 5500M | |
| Apple MacBook Pro 16 2019 i9 5500M | |
| Lenovo ThinkPad P1 2019-20QT000RGE | |
| Cinebench R20 / CPU (Single Core) | |
| Az osztály átlaga Workstation (671 - 857, n=22, az elmúlt 2 évben) | |
| HP ZBook Studio 15 G8 | |
| Lenovo ThinkBook 16p G2 ACH | |
| Átlagos Intel Core i7-11800H (520 - 586, n=47) | |
| Lenovo ThinkPad P1 G4-20Y30017GE | |
| Apple MacBook Pro 16 2019 i9 5500M | |
| Apple MacBook Pro 16 2019 i9 5500M | |
| Lenovo ThinkPad P1 2019-20QT000RGE | |
| Cinebench R15 / CPU Multi 64Bit | |
| Az osztály átlaga Workstation (2489 - 5810, n=22, az elmúlt 2 évben) | |
| Lenovo ThinkBook 16p G2 ACH | |
| Átlagos Intel Core i7-11800H (1342 - 2173, n=50) | |
| HP ZBook Studio 15 G8 | |
| Lenovo ThinkPad P1 G4-20Y30017GE | |
| Apple MacBook Pro 16 2019 i9 5500M | |
| Apple MacBook Pro 16 2019 i9 5500M | |
| Dell Precision 5540 | |
| Lenovo ThinkPad P1 2019-20QT000RGE | |
| Cinebench R15 / CPU Single 64Bit | |
| Az osztály átlaga Workstation (191.4 - 328, n=22, az elmúlt 2 évben) | |
| Lenovo ThinkBook 16p G2 ACH | |
| HP ZBook Studio 15 G8 | |
| Átlagos Intel Core i7-11800H (201 - 231, n=46) | |
| Lenovo ThinkPad P1 G4-20Y30017GE | |
| Lenovo ThinkPad P1 2019-20QT000RGE | |
| Dell Precision 5540 | |
| Apple MacBook Pro 16 2019 i9 5500M | |
| Apple MacBook Pro 16 2019 i9 5500M | |
| Blender / v2.79 BMW27 CPU | |
| Lenovo ThinkPad P1 2019-20QT000RGE | |
| Dell Precision 5540 | |
| Apple MacBook Pro 16 2019 i9 5500M | |
| Lenovo ThinkPad P1 G4-20Y30017GE | |
| Átlagos Intel Core i7-11800H (217 - 454, n=46) | |
| HP ZBook Studio 15 G8 | |
| Lenovo ThinkBook 16p G2 ACH | |
| Az osztály átlaga Workstation (91 - 222, n=22, az elmúlt 2 évben) | |
| 7-Zip 18.03 / 7z b 4 | |
| Az osztály átlaga Workstation (60489 - 116969, n=22, az elmúlt 2 évben) | |
| Lenovo ThinkBook 16p G2 ACH | |
| HP ZBook Studio 15 G8 | |
| Átlagos Intel Core i7-11800H (33718 - 56758, n=46) | |
| Dell Precision 5540 | |
| Apple MacBook Pro 16 2019 i9 5500M | |
| Lenovo ThinkPad P1 G4-20Y30017GE | |
| Lenovo ThinkPad P1 2019-20QT000RGE | |
| 7-Zip 18.03 / 7z b 4 -mmt1 | |
| Az osztály átlaga Workstation (5126 - 6895, n=22, az elmúlt 2 évben) | |
| Lenovo ThinkBook 16p G2 ACH | |
| HP ZBook Studio 15 G8 | |
| Lenovo ThinkPad P1 G4-20Y30017GE | |
| Átlagos Intel Core i7-11800H (5138 - 5732, n=46) | |
| Dell Precision 5540 | |
| Lenovo ThinkPad P1 2019-20QT000RGE | |
| Apple MacBook Pro 16 2019 i9 5500M | |
| Geekbench 5.5 / Multi-Core | |
| Az osztály átlaga Workstation (11542 - 25554, n=22, az elmúlt 2 évben) | |
| Lenovo ThinkBook 16p G2 ACH | |
| Átlagos Intel Core i7-11800H (4655 - 9851, n=40) | |
| HP ZBook Studio 15 G8 | |
| Apple MacBook Pro 16 2019 i9 5500M | |
| Lenovo ThinkPad P1 G4-20Y30017GE | |
| Geekbench 5.5 / Single-Core | |
| Az osztály átlaga Workstation (1783 - 2183, n=22, az elmúlt 2 évben) | |
| HP ZBook Studio 15 G8 | |
| Átlagos Intel Core i7-11800H (1429 - 1625, n=40) | |
| Lenovo ThinkBook 16p G2 ACH | |
| Lenovo ThinkPad P1 G4-20Y30017GE | |
| Apple MacBook Pro 16 2019 i9 5500M | |
| HWBOT x265 Benchmark v2.2 / 4k Preset | |
| Az osztály átlaga Workstation (17.8 - 40.5, n=22, az elmúlt 2 évben) | |
| Lenovo ThinkBook 16p G2 ACH | |
| HP ZBook Studio 15 G8 | |
| Átlagos Intel Core i7-11800H (7.38 - 17.4, n=46) | |
| Dell Precision 5540 | |
| Lenovo ThinkPad P1 G4-20Y30017GE | |
| Apple MacBook Pro 16 2019 i9 5500M | |
| Lenovo ThinkPad P1 2019-20QT000RGE | |
| LibreOffice / 20 Documents To PDF | |
| Apple MacBook Pro 16 2019 i9 5500M | |
| Apple MacBook Pro 16 2019 i9 5500M | |
| Lenovo ThinkBook 16p G2 ACH | |
| Lenovo ThinkPad P1 G4-20Y30017GE | |
| HP ZBook Studio 15 G8 | |
| Az osztály átlaga Workstation (37.1 - 74.7, n=22, az elmúlt 2 évben) | |
| Átlagos Intel Core i7-11800H (38.6 - 59.9, n=45) | |
| R Benchmark 2.5 / Overall mean | |
| Apple MacBook Pro 16 2019 i9 5500M | |
| Apple MacBook Pro 16 2019 i9 5500M | |
| Lenovo ThinkPad P1 G4-20Y30017GE | |
| Átlagos Intel Core i7-11800H (0.548 - 0.615, n=46) | |
| HP ZBook Studio 15 G8 | |
| Lenovo ThinkBook 16p G2 ACH | |
| Az osztály átlaga Workstation (0.395 - 0.603, n=22, az elmúlt 2 évben) | |
* ... a kisebb jobb
| PCMark 10 / Score | |
| Az osztály átlaga Workstation (6563 - 10409, n=18, az elmúlt 2 évben) | |
| HP ZBook Studio 15 G8 | |
| Lenovo ThinkBook 16p G2 ACH | |
| Átlagos Intel Core i7-11800H, NVIDIA T1200 Laptop GPU (5889 - 6147, n=3) | |
| Lenovo ThinkPad P1 G4-20Y30017GE | |
| Apple MacBook Pro 16 2019 i9 5500M | |
| Dell Precision 5540 | |
| Lenovo ThinkPad P1 2019-20QT000RGE | |
| PCMark 10 / Essentials | |
| Az osztály átlaga Workstation (9622 - 11157, n=18, az elmúlt 2 évben) | |
| Lenovo ThinkBook 16p G2 ACH | |
| HP ZBook Studio 15 G8 | |
| Átlagos Intel Core i7-11800H, NVIDIA T1200 Laptop GPU (9776 - 9956, n=3) | |
| Lenovo ThinkPad P1 G4-20Y30017GE | |
| Dell Precision 5540 | |
| Lenovo ThinkPad P1 2019-20QT000RGE | |
| PCMark 10 / Productivity | |
| Az osztály átlaga Workstation (8789 - 20616, n=18, az elmúlt 2 évben) | |
| Lenovo ThinkBook 16p G2 ACH | |
| HP ZBook Studio 15 G8 | |
| Lenovo ThinkPad P1 G4-20Y30017GE | |
| Átlagos Intel Core i7-11800H, NVIDIA T1200 Laptop GPU (8276 - 8445, n=3) | |
| Lenovo ThinkPad P1 2019-20QT000RGE | |
| Dell Precision 5540 | |
| PCMark 10 / Digital Content Creation | |
| Az osztály átlaga Workstation (8108 - 15631, n=18, az elmúlt 2 évben) | |
| HP ZBook Studio 15 G8 | |
| Lenovo ThinkBook 16p G2 ACH | |
| Átlagos Intel Core i7-11800H, NVIDIA T1200 Laptop GPU (6851 - 7581, n=3) | |
| Lenovo ThinkPad P1 G4-20Y30017GE | |
| Dell Precision 5540 | |
| Lenovo ThinkPad P1 2019-20QT000RGE | |
| PCMark 10 Score | 5969 pontok | |
Segítség | ||
| DPC Latencies / LatencyMon - interrupt to process latency (max), Web, Youtube, Prime95 | |
| Lenovo ThinkPad P1 G4-20Y30017GE | |
| HP ZBook Studio 15 G8 | |
| Lenovo ThinkBook 16p G2 ACH | |
* ... a kisebb jobb
| Lenovo ThinkPad P1 G4-20Y30017GE Samsung PM9A1 MZVL2512HCJQ | Dell Precision 5540 SK hynix PC400 512 GB | Apple MacBook Pro 16 2019 i9 5500M Apple SSD AP1024 7171 | HP ZBook Studio 15 G8 Samsung PM981a MZVLB2T0HALB | Lenovo ThinkBook 16p G2 ACH WDC PC SN730 SDBPNTY-1T00 | Lenovo ThinkPad P1 2019-20QT000RGE WDC PC SN720 SDAQNTW-512G | Átlagos Samsung PM9A1 MZVL2512HCJQ | |
|---|---|---|---|---|---|---|---|
| CrystalDiskMark 5.2 / 6 | -54% | -50% | -42% | -35% | -39% | -20% | |
| Write 4K (MB/s) | 224.1 | 98 -56% | 55.5 -75% | 110.5 -51% | 158.1 -29% | 162.2 -28% | 179.1 ? -20% |
| Read 4K (MB/s) | 88.5 | 41.25 -53% | 16.21 -82% | 51.8 -41% | 49.09 -45% | 43.71 -51% | 75.6 ? -15% |
| Write Seq (MB/s) | 1295 | 1959 | 2071 | 2830 | 2441 | 3016 ? | |
| Read Seq (MB/s) | 1441 | 1763 | 2505 | 2531 | 1753 | 3350 ? | |
| Write 4K Q32T1 (MB/s) | 664 | 429.2 -35% | 398.5 -40% | 429.8 -35% | 453.4 -32% | 397.6 -40% | 459 ? -31% |
| Read 4K Q32T1 (MB/s) | 720 | 400.1 -44% | 648 -10% | 418.3 -42% | 573 -20% | 520 -28% | 554 ? -23% |
| Write Seq Q32T1 (MB/s) | 5089 | 1366 -73% | 2727 -46% | 3060 -40% | 3088 -39% | 2519 -51% | 4346 ? -15% |
| Read Seq Q32T1 (MB/s) | 6088 | 2201 -64% | 3242 -47% | 3539 -42% | 3394 -44% | 3448 -43% | 6346 ? 4% |
| Write 4K Q8T8 (MB/s) | 2021 | 1381 -32% | 1356 ? -33% | ||||
| Read 4K Q8T8 (MB/s) | 2328 | 1371 -41% | 1746 ? -25% | ||||
| AS SSD | -67% | -73% | -43% | -20% | -33% | -18% | |
| Seq Read (MB/s) | 5505 | 1743 -68% | 2531 -54% | 2953 -46% | 2986 -46% | 2980 -46% | 4656 ? -15% |
| Seq Write (MB/s) | 3908 | 930 -76% | 2289 -41% | 1691 -57% | 2426 -38% | 2094 -46% | 2742 ? -30% |
| 4K Read (MB/s) | 54.4 | 39.1 -28% | 15.85 -71% | 43.98 -19% | 45.93 -16% | 45.05 -17% | 67 ? 23% |
| 4K Write (MB/s) | 146.1 | 92.1 -37% | 39.88 -73% | 105.4 -28% | 152.3 4% | 155.4 6% | 173.8 ? 19% |
| 4K-64 Read (MB/s) | 2356 | 956 -59% | 1267 -46% | 1065 -55% | 1683 -29% | 1291 -45% | 1514 ? -36% |
| 4K-64 Write (MB/s) | 3300 | 863 -74% | 1749 -47% | 1957 -41% | 2010 -39% | 1506 -54% | 2355 ? -29% |
| Access Time Read * (ms) | 0.035 | 0.074 -111% | 0.122 -249% | 0.04 -14% | 0.045 -29% | 0.064 -83% | 0.04867 ? -39% |
| Access Time Write * (ms) | 0.029 | 0.053 -83% | 0.095 -228% | 0.105 -262% | 0.025 14% | 0.024 17% | 0.03605 ? -24% |
| Score Read (Points) | 2961 | 1170 -60% | 1536 -48% | 1404 -53% | 2028 -32% | 1634 -45% | 2047 ? -31% |
| Score Write (Points) | 3837 | 1048 -73% | 2018 -47% | 2232 -42% | 2405 -37% | 1871 -51% | 2778 ? -28% |
| Score Total (Points) | 8226 | 2781 -66% | 4317 -48% | 4297 -48% | 5441 -34% | 4300 -48% | 5812 ? -29% |
| Copy ISO MB/s (MB/s) | 2287 | 1995 -13% | 2474 8% | 2256 -1% | 2015 -12% | 2192 ? -4% | |
| Copy Program MB/s (MB/s) | 757 | 584 -23% | 1074 42% | 779 3% | 597 -21% | 629 ? -17% | |
| Copy Game MB/s (MB/s) | 1644 | 1135 -31% | 1929 17% | 1627 -1% | 1449 -12% | 1393 ? -15% | |
| Teljes átlag (program / beállítások) | -61% /
-62% | -62% /
-66% | -43% /
-42% | -28% /
-25% | -36% /
-35% | -19% /
-19% |
* ... a kisebb jobb

Disk Throttling: DiskSpd Read Loop, Queue Depth 8
| 3DMark 11 - 1280x720 Performance GPU | |
| Az osztály átlaga Workstation (12535 - 69594, n=22, az elmúlt 2 évben) | |
| HP ZBook Studio 15 G8 | |
| Lenovo ThinkBook 16p G2 ACH | |
| Lenovo ThinkPad P17 G2-20YU0025G | |
| Apple MacBook Pro 16 2019 i9 5500M | |
| Lenovo ThinkPad P1 G4-20Y30017GE | |
| Átlagos NVIDIA T1200 Laptop GPU (12142 - 14614, n=3) | |
| Lenovo ThinkPad X1 Extreme Gen3-20TLS0UV00 | |
| Dell Precision 5540 | |
| Lenovo ThinkPad P1 2019-20QT000RGE | |
| 3DMark | |
| 1920x1080 Fire Strike Graphics | |
| Az osztály átlaga Workstation (8293 - 52560, n=22, az elmúlt 2 évben) | |
| HP ZBook Studio 15 G8 | |
| Lenovo ThinkBook 16p G2 ACH | |
| Lenovo ThinkPad P17 G2-20YU0025G | |
| Apple MacBook Pro 16 2019 i9 5500M | |
| Lenovo ThinkPad P1 G4-20Y30017GE | |
| Átlagos NVIDIA T1200 Laptop GPU (9030 - 10266, n=3) | |
| Lenovo ThinkPad X1 Extreme Gen3-20TLS0UV00 | |
| Dell Precision 5540 | |
| Lenovo ThinkPad P1 2019-20QT000RGE | |
| 2560x1440 Time Spy Graphics | |
| Az osztály átlaga Workstation (2725 - 24806, n=22, az elmúlt 2 évben) | |
| HP ZBook Studio 15 G8 | |
| Lenovo ThinkBook 16p G2 ACH | |
| Lenovo ThinkPad P17 G2-20YU0025G | |
| Lenovo ThinkPad P1 G4-20Y30017GE | |
| Átlagos NVIDIA T1200 Laptop GPU (3229 - 3651, n=3) | |
| Apple MacBook Pro 16 2019 i9 5500M | |
| Lenovo ThinkPad X1 Extreme Gen3-20TLS0UV00 | |
| Dell Precision 5540 | |
| Lenovo ThinkPad P1 2019-20QT000RGE | |
| 3DMark Vantage P Result | 44135 pontok | |
| 3DMark 11 Performance | 13779 pontok | |
| 3DMark Cloud Gate Standard Score | 27580 pontok | |
| 3DMark Fire Strike Score | 9255 pontok | |
| 3DMark Time Spy Score | 3891 pontok | |
Segítség | ||
Witcher 3 FPS Chart
| alacsony | közepes | magas | ultra | QHD | 4K | |
|---|---|---|---|---|---|---|
| GTA V (2015) | 166 | 152 | 94.9 | 52.3 | 37.4 | |
| The Witcher 3 (2015) | 195 | 127 | 72 | 38 | ||
| Dota 2 Reborn (2015) | 155 | 131 | 114 | 107 | 109 | |
| Final Fantasy XV Benchmark (2018) | 103 | 56.5 | 37 | 26 | ||
| X-Plane 11.11 (2018) | 105 | 85.3 | 66.8 | 52.4 | ||
| Far Cry 5 (2018) | 110 | 69 | 64 | 60 | 41 | |
| Strange Brigade (2018) | 218 | 94 | 77 | 67 | 47 | |
| Borderlands 3 (2019) | 99 | 62 | 43 | 33 | 23 | |
| Gears Tactics (2020) | 268 | 101 | 66 | 46 | 32 | |
| F1 2020 (2020) | 222 | 109 | 90 | 63 | 45 | |
| Death Stranding (2020) | 86 | 68 | 61 | 59 | 40 | |
| Horizon Zero Dawn (2020) | 88 | 60 | 50 | 43 | 32 | |
| Watch Dogs Legion (2020) | 66 | 54 | 47 | 19 | 12 | |
| Dirt 5 (2020) | 125 | 56 | 45 | 12 | ||
| Assassin´s Creed Valhalla (2020) | 77 | 47 | 28 | 21 | 18 | |
| Immortals Fenyx Rising (2020) | 84 | 55 | 44 | 40 | 26 | |
| Cyberpunk 2077 1.0 (2020) | 61 | 33 | 27 | 22 | 14 | |
| F1 2021 (2021) | 164 | 106 | 89.5 | 53.6 | 39 | |
| FIFA 22 (2021) | 175 | 121 | 119 | 111 | 76 | |
| Far Cry 6 (2021) | 86 | 58 | 54 | 47 | 26 |
Zajszint
| Üresjárat |
| 24.3 / 24.3 / 26.6 dB(A) |
| Terhelés |
| 46.8 / 46.8 dB(A) |
 | ||
30 dB csendes 40 dB(A) hallható 50 dB(A) hangos |
||
min: | ||
| Lenovo ThinkPad P1 G4-20Y30017GE T1200 Laptop GPU, i7-11800H, Samsung PM9A1 MZVL2512HCJQ | Dell Precision 5540 Quadro T2000 Max-Q, i9-9980HK, SK hynix PC400 512 GB | Apple MacBook Pro 16 2019 i9 5500M Radeon Pro 5500M, i9-9880H, Apple SSD AP1024 7171 | HP ZBook Studio 15 G8 GeForce RTX 3070 Laptop GPU, i9-11950H, Samsung PM981a MZVLB2T0HALB | Lenovo ThinkBook 16p G2 ACH GeForce RTX 3060 Laptop GPU, R9 5900HX, WDC PC SN730 SDBPNTY-1T00 | Lenovo ThinkPad P1 2019-20QT000RGE Quadro T1000 (Laptop), i7-9850H, WDC PC SN720 SDAQNTW-512G | |
|---|---|---|---|---|---|---|
| Noise | 2% | -10% | 0% | 7% | -3% | |
| off / környezet * (dB) | 24.3 | 28.6 -18% | 29.8 -23% | 23.5 3% | 23 5% | 28.8 -19% |
| Idle Minimum * (dB) | 24.3 | 28.6 -18% | 29.9 -23% | 25.3 -4% | 23 5% | 28.8 -19% |
| Idle Average * (dB) | 24.3 | 28.6 -18% | 29.9 -23% | 25.3 -4% | 23 5% | 28.8 -19% |
| Idle Maximum * (dB) | 26.6 | 28.6 -8% | 29.9 -12% | 25.3 5% | 23 14% | 28.8 -8% |
| Load Average * (dB) | 46.8 | 33.3 29% | 43 8% | 41.2 12% | 35.66 24% | 36.1 23% |
| Witcher 3 ultra * (dB) | 46.8 | 34.7 26% | 45.4 3% | 49.4 -6% | 48.7 -4% | |
| Load Maximum * (dB) | 46.8 | 38 19% | 46.1 1% | 49.4 -6% | 48.13 -3% | 36.7 22% |
* ... a kisebb jobb
(-) A felső oldalon a maximális hőmérséklet 50.6 °C / 123 F, összehasonlítva a 38.2 °C / 101 F átlagával , 22.2 és 69.8 °C között a Workstation osztálynál.
(-) Az alsó maximum 53.6 °C / 128 F-ig melegszik fel, összehasonlítva a 41.1 °C / 106 F átlagával
(+) Üresjáratban a felső oldal átlagos hőmérséklete 24.3 °C / 76 F, összehasonlítva a 32 °C / ### eszközátlaggal class_avg_f### F.
(-) A The Witcher 3 játék során a felső oldal átlaghőmérséklete 38.8 °C / 102 F, összehasonlítva a 32 °C / ## eszközátlaggal #class_avg_f### F.
(+) A csuklótámasz és az érintőpad eléri a bőr maximális hőmérsékletét (35.5 °C / 95.9 F), ezért nem forrók.
(-) A hasonló eszközök csuklótámasz területének átlagos hőmérséklete 27.8 °C / 82 F volt (-7.7 °C / -13.9 F).
Lenovo ThinkPad P1 G4-20Y30017GE hangelemzés
(+) | a hangszórók viszonylag hangosan tudnak játszani (84.3 dB)
Basszus 100 - 315 Hz
(±) | csökkentett basszus – átlagosan 12.2%-kal alacsonyabb, mint a medián
(±) | a basszus linearitása átlagos (9.8% delta az előző frekvenciához)
Közepes 400-2000 Hz
(+) | kiegyensúlyozott középpontok – csak 3.4% választja el a mediántól
(+) | a középpontok lineárisak (3.4% delta az előző frekvenciához)
Maximum 2-16 kHz
(+) | kiegyensúlyozott csúcsok – csak 2.9% választja el a mediántól
(+) | a csúcsok lineárisak (5% delta az előző frekvenciához képest)
Összességében 100 - 16.000 Hz
(+) | általános hangzás lineáris (11.8% eltérés a mediánhoz képest)
Ugyanazon osztályhoz képest
» 16%Ebben az osztályban az összes tesztelt eszköz %-a jobb volt, 3% hasonló, 81%-kal rosszabb
» A legjobb delta értéke 7%, az átlag 17%, a legrosszabb 35% volt
Az összes tesztelt eszközzel összehasonlítva
» 9% az összes tesztelt eszköz jobb volt, 3% hasonló, 89%-kal rosszabb
» A legjobb delta értéke 4%, az átlag 23%, a legrosszabb 134% volt
Dell Precision 5540 hangelemzés
(±) | a hangszóró hangereje átlagos, de jó (80.7 dB)
Basszus 100 - 315 Hz
(-) | szinte nincs basszus – átlagosan 16.6%-kal alacsonyabb a mediánnál
(±) | a basszus linearitása átlagos (7.2% delta az előző frekvenciához)
Közepes 400-2000 Hz
(+) | kiegyensúlyozott középpontok – csak 3.8% választja el a mediántól
(+) | a középpontok lineárisak (6.6% delta az előző frekvenciához)
Maximum 2-16 kHz
(+) | kiegyensúlyozott csúcsok – csak 3.3% választja el a mediántól
(+) | a csúcsok lineárisak (6.6% delta az előző frekvenciához képest)
Összességében 100 - 16.000 Hz
(±) | az általános hang linearitása átlagos (16% eltérés a mediánhoz képest)
Ugyanazon osztályhoz képest
» 40%Ebben az osztályban az összes tesztelt eszköz %-a jobb volt, 9% hasonló, 51%-kal rosszabb
» A legjobb delta értéke 7%, az átlag 17%, a legrosszabb 35% volt
Az összes tesztelt eszközzel összehasonlítva
» 25% az összes tesztelt eszköz jobb volt, 5% hasonló, 69%-kal rosszabb
» A legjobb delta értéke 4%, az átlag 23%, a legrosszabb 134% volt
Apple MacBook Pro 16 2019 i9 5500M hangelemzés
(+) | a hangszórók viszonylag hangosan tudnak játszani (82.3 dB)
Basszus 100 - 315 Hz
(+) | jó basszus – csak 2.3% választja el a mediántól
(+) | a basszus lineáris (5% delta az előző frekvenciához)
Közepes 400-2000 Hz
(+) | kiegyensúlyozott középpontok – csak 2.7% választja el a mediántól
(+) | a középpontok lineárisak (3.4% delta az előző frekvenciához)
Maximum 2-16 kHz
(+) | kiegyensúlyozott csúcsok – csak 2.1% választja el a mediántól
(+) | a csúcsok lineárisak (2.6% delta az előző frekvenciához képest)
Összességében 100 - 16.000 Hz
(+) | általános hangzás lineáris (6.9% eltérés a mediánhoz képest)
Ugyanazon osztályhoz képest
» 5%Ebben az osztályban az összes tesztelt eszköz %-a jobb volt, 1% hasonló, 95%-kal rosszabb
» A legjobb delta értéke 5%, az átlag 17%, a legrosszabb 45% volt
Az összes tesztelt eszközzel összehasonlítva
» 1% az összes tesztelt eszköz jobb volt, 0% hasonló, 99%-kal rosszabb
» A legjobb delta értéke 4%, az átlag 23%, a legrosszabb 134% volt
| Kikapcsolt állapot / Készenlét | |
| Üresjárat | |
| Terhelés |
|
Kulcs:
min: | |
| Lenovo ThinkPad P1 G4-20Y30017GE i7-11800H, T1200 Laptop GPU, Samsung PM9A1 MZVL2512HCJQ, IPS, 2560x1600, 16" | Dell Precision 5540 i9-9980HK, Quadro T2000 Max-Q, SK hynix PC400 512 GB, OLED, 3840x2160, 15.6" | Apple MacBook Pro 16 2019 i9 5500M i9-9880H, Radeon Pro 5500M, Apple SSD AP1024 7171, IPS, 3072x1920, 16" | HP ZBook Studio 15 G8 i9-11950H, GeForce RTX 3070 Laptop GPU, Samsung PM981a MZVLB2T0HALB, OLED, 3840x2160, 15.6" | Lenovo ThinkBook 16p G2 ACH R9 5900HX, GeForce RTX 3060 Laptop GPU, WDC PC SN730 SDBPNTY-1T00, IPS, 2560x1600, 16" | Lenovo ThinkPad P1 2019-20QT000RGE i7-9850H, Quadro T1000 (Laptop), WDC PC SN720 SDAQNTW-512G, IPS LED, 1920x1080, 15.6" | Átlagos NVIDIA T1200 Laptop GPU | Az osztály átlaga Workstation | |
|---|---|---|---|---|---|---|---|---|
| Power Consumption | 1% | 6% | -58% | -29% | -34% | -0% | -23% | |
| Idle Minimum * (Watt) | 7.7 | 7.4 4% | 3.7 52% | 11 -43% | 13.2 -71% | 13.7 -78% | 7.85 ? -2% | 9.13 ? -19% |
| Idle Average * (Watt) | 11.8 | 12.1 -3% | 12.1 -3% | 18.8 -59% | 17 -44% | 17.5 -48% | 11.4 ? 3% | 13.8 ? -17% |
| Idle Maximum * (Watt) | 12.4 | 12.7 -2% | 17 -37% | 31.7 -156% | 18.6 -50% | 20.9 -69% | 12 ? 3% | 18 ? -45% |
| Load Average * (Watt) | 94.6 | 98 -4% | 91.5 3% | 105.2 -11% | 88.8 6% | 77.2 18% | 93.8 ? 1% | 94.5 ? -0% |
| Witcher 3 ultra * (Watt) | 99.6 | 89.9 10% | 103 -3% | 148 -49% | 123 -23% 123 -23% | |||
| Load Maximum * (Watt) | 134 | 135.1 -1% | 102.3 24% | 171.8 -28% | 132 1% | 123.7 8% | 143.7 ? -7% | 177.8 ? -33% |
* ... a kisebb jobb
Power Consumption Witcher 3 / Stresstest
| Lenovo ThinkPad P1 G4-20Y30017GE i7-11800H, T1200 Laptop GPU, 90 Wh | Dell Precision 5540 i9-9980HK, Quadro T2000 Max-Q, 97 Wh | Apple MacBook Pro 16 2019 i9 5500M i9-9880H, Radeon Pro 5500M, 99.8 Wh | HP ZBook Studio 15 G8 i9-11950H, GeForce RTX 3070 Laptop GPU, 83 Wh | Lenovo ThinkBook 16p G2 ACH R9 5900HX, GeForce RTX 3060 Laptop GPU, 71 Wh | Lenovo ThinkPad P1 2019-20QT000RGE i7-9850H, Quadro T1000 (Laptop), 80 Wh | Az osztály átlaga Workstation | |
|---|---|---|---|---|---|---|---|
| Akkumulátor üzemidő | 6% | 3% | -6% | 2% | -4% | 1% | |
| H.264 (h) | 9 | 10.6 18% | 9.7 8% | 7 -22% | 9.3 3% | 10.1 ? 12% | |
| WiFi v1.3 (h) | 9 | 7.7 -14% | 12 33% | 6.2 -31% | 8.5 -6% | 8.9 -1% | 8.63 ? -4% |
| Load (h) | 1.5 | 1.7 13% | 1 -33% | 1.8 20% | 2 33% | 1.3 -13% | 1.441 ? -4% |
| Reader / Idle (h) | 15 | 12.9 | 26.1 ? | ||||
| Witcher 3 ultra (h) | 0.9 |
Pro
Kontra
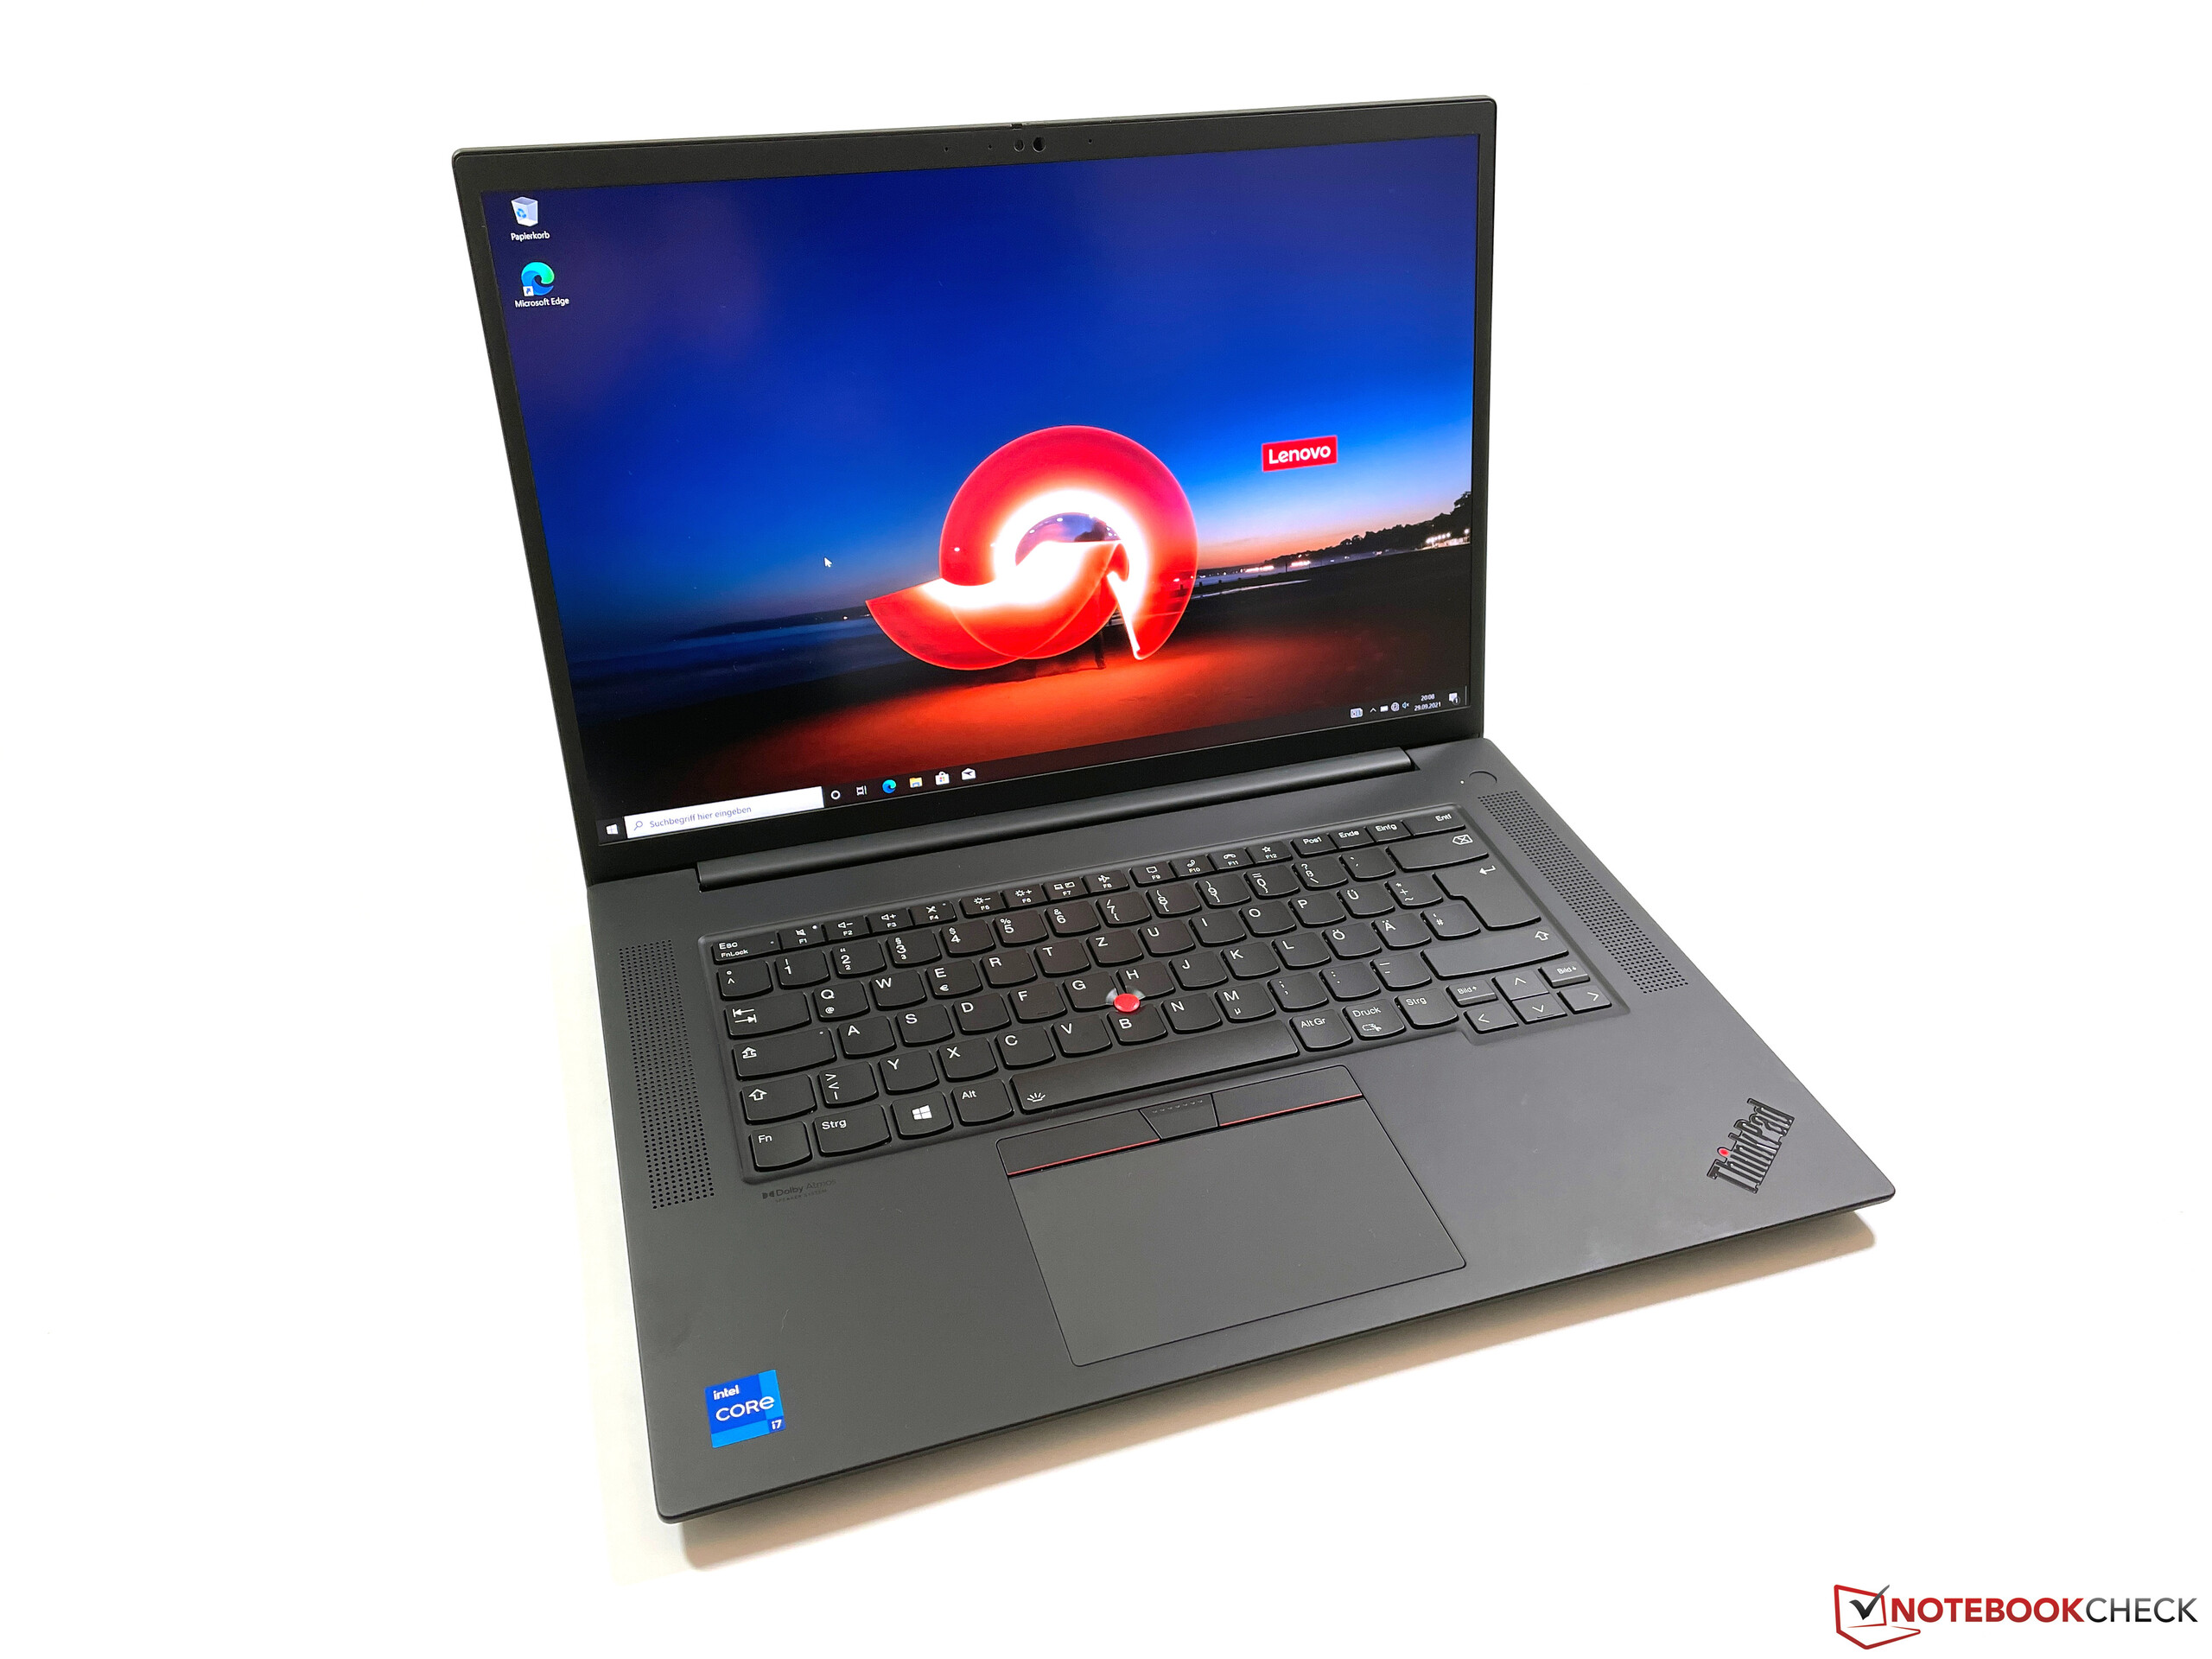
Összegzés - ThinkPad P1 G4 középszerű CPU teljesítménnyel
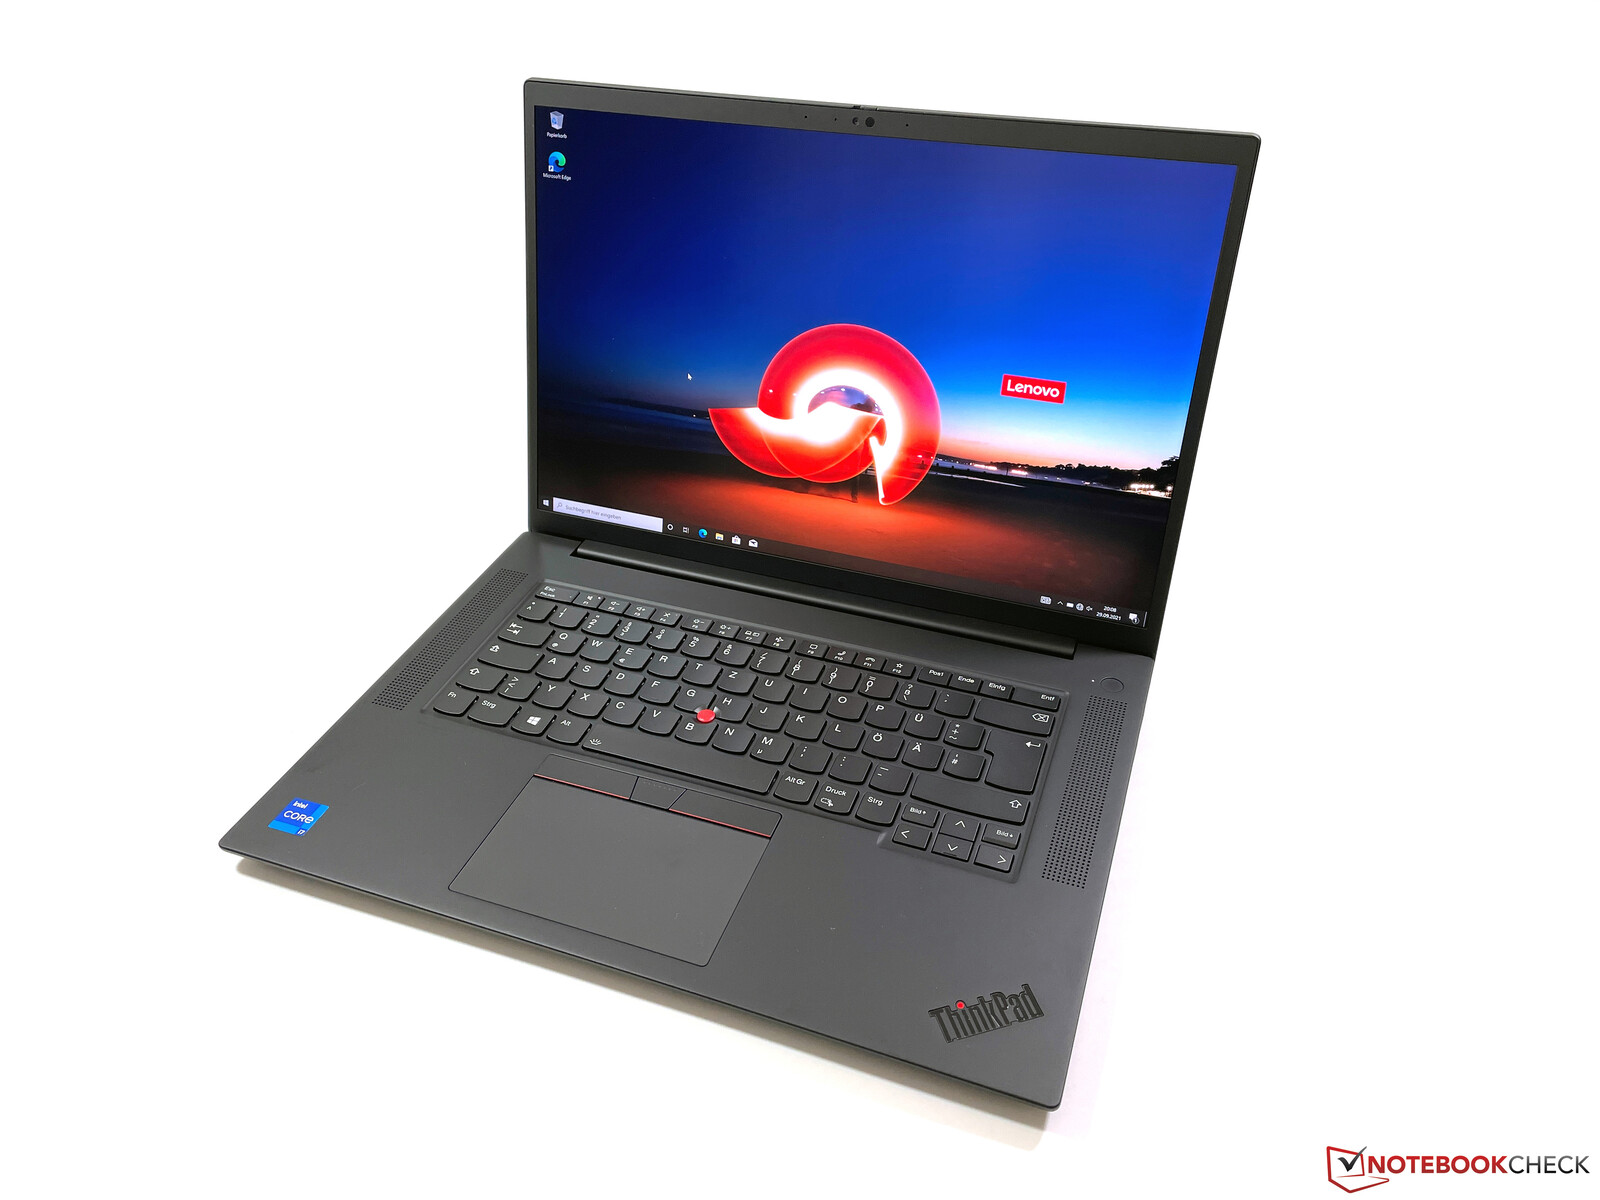
A Lenovo a ThinkPad P1 negyedik generációját használja fel egy jelentős frissítésre. A legszembetűnőbb változás az új 16 hüvelykes, 16:10-es képarányú kijelző, míg a váz mérete nagyjából változatlan. Az új belépőszintű panel már a WQHD felbontást kínálja, és jó benyomást keltett méréseink során. A második szembetűnő változás a billentyűzet, amely most a kisebbik testvér ThinkPad X1 Carbon G9-hez hasonló. Elég kritikusan állunk ehhez a fejleményhez, mert a beviteli eszközök egyértelműen visszaesést jelentenek a korábbi modellekhez képest. A korábbi ThinkPad-ek kiváló billentyűzetekkel rendelkeztek, de úgy tűnik, ez már a múlté. Persze, az új billentyűzet semmiképpen sem rossz, de a versenytárs Dell vagy HP modellekkel szemben már nincs többé előnye.
Az új Lenovo ThinkPad P1 G4 rendelkezik néhány pozitív változással, mint például a nagyobb, 16 hüvelykes képernyő vagy a jó hangszórók. A beviteli eszközökkel kapcsolatos fejlemények viszont problematikusak. A billentyűzet nem rossz, de a korábbi modellek szemmel láthatóan jobb beviteli eszközöket kínáltak.
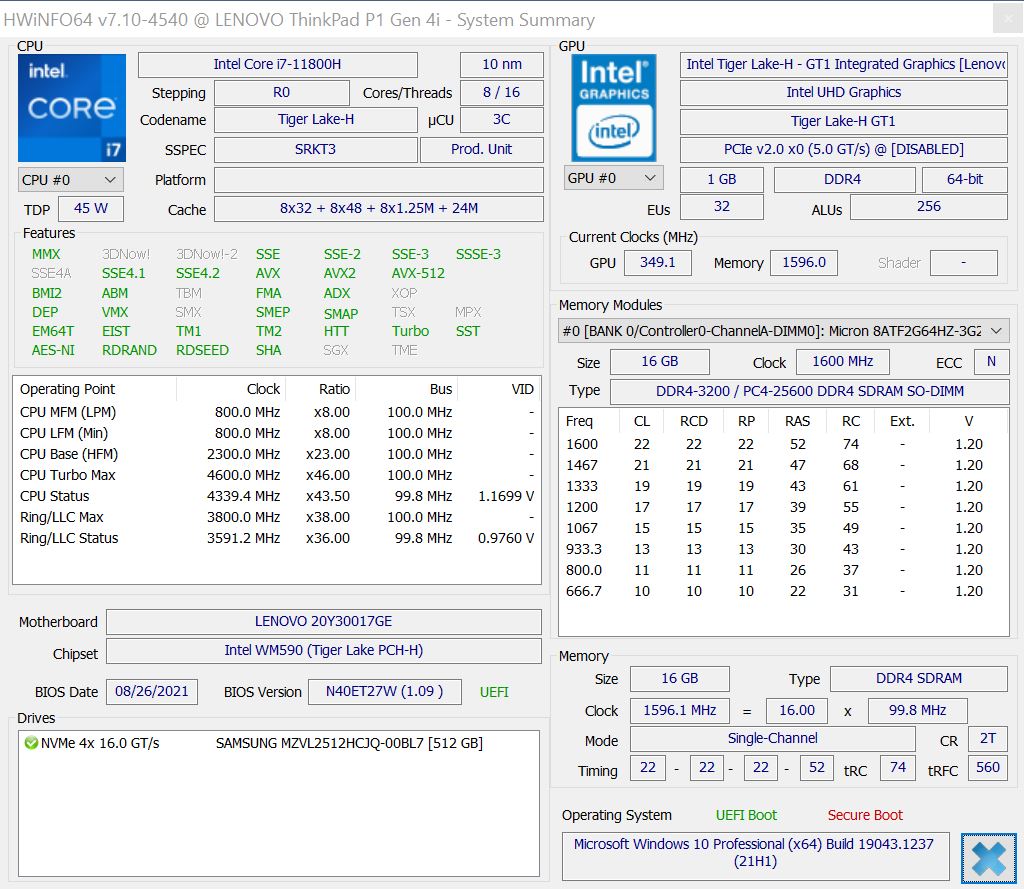
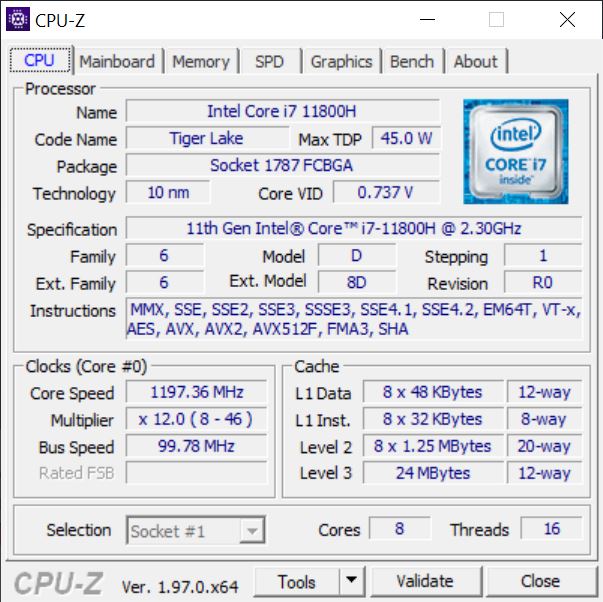
Teljesítményt tekintetében a belépőszintű konfigurációnk vegyes benyomásokat hagy maga után. Az új Nvidia T1200 GPU jól teljesít és stabil teljesítményt nyújt terhelés alatt, de a processzorral már több probléma van. A Lenovo egy 45W-os Intel CPU-t használ, de a P1 G4 még ezt a névleges TDP-t is nehezen tudja tartani tiszta CPU terhelés alatt, és gyorsan 40W alá esik. Kombinált munkaterhelés esetén a CPU mindössze 20W-ot kap, ami aligha jó eredmény egy drága mobil munkaállomásnál.
Összességében az új ThinkPad P1 G4 ismét egy nagyon jó mobil munkaállomás, de van egy bökkenő. A CPU teljesítménye, különösen a kombinált munkaterhelési esetekben, meglehetősen alacsony. Az Nvidia T1200 GPU-ja viszont jól teljesít, különösen a professzionális benchmarkokban.
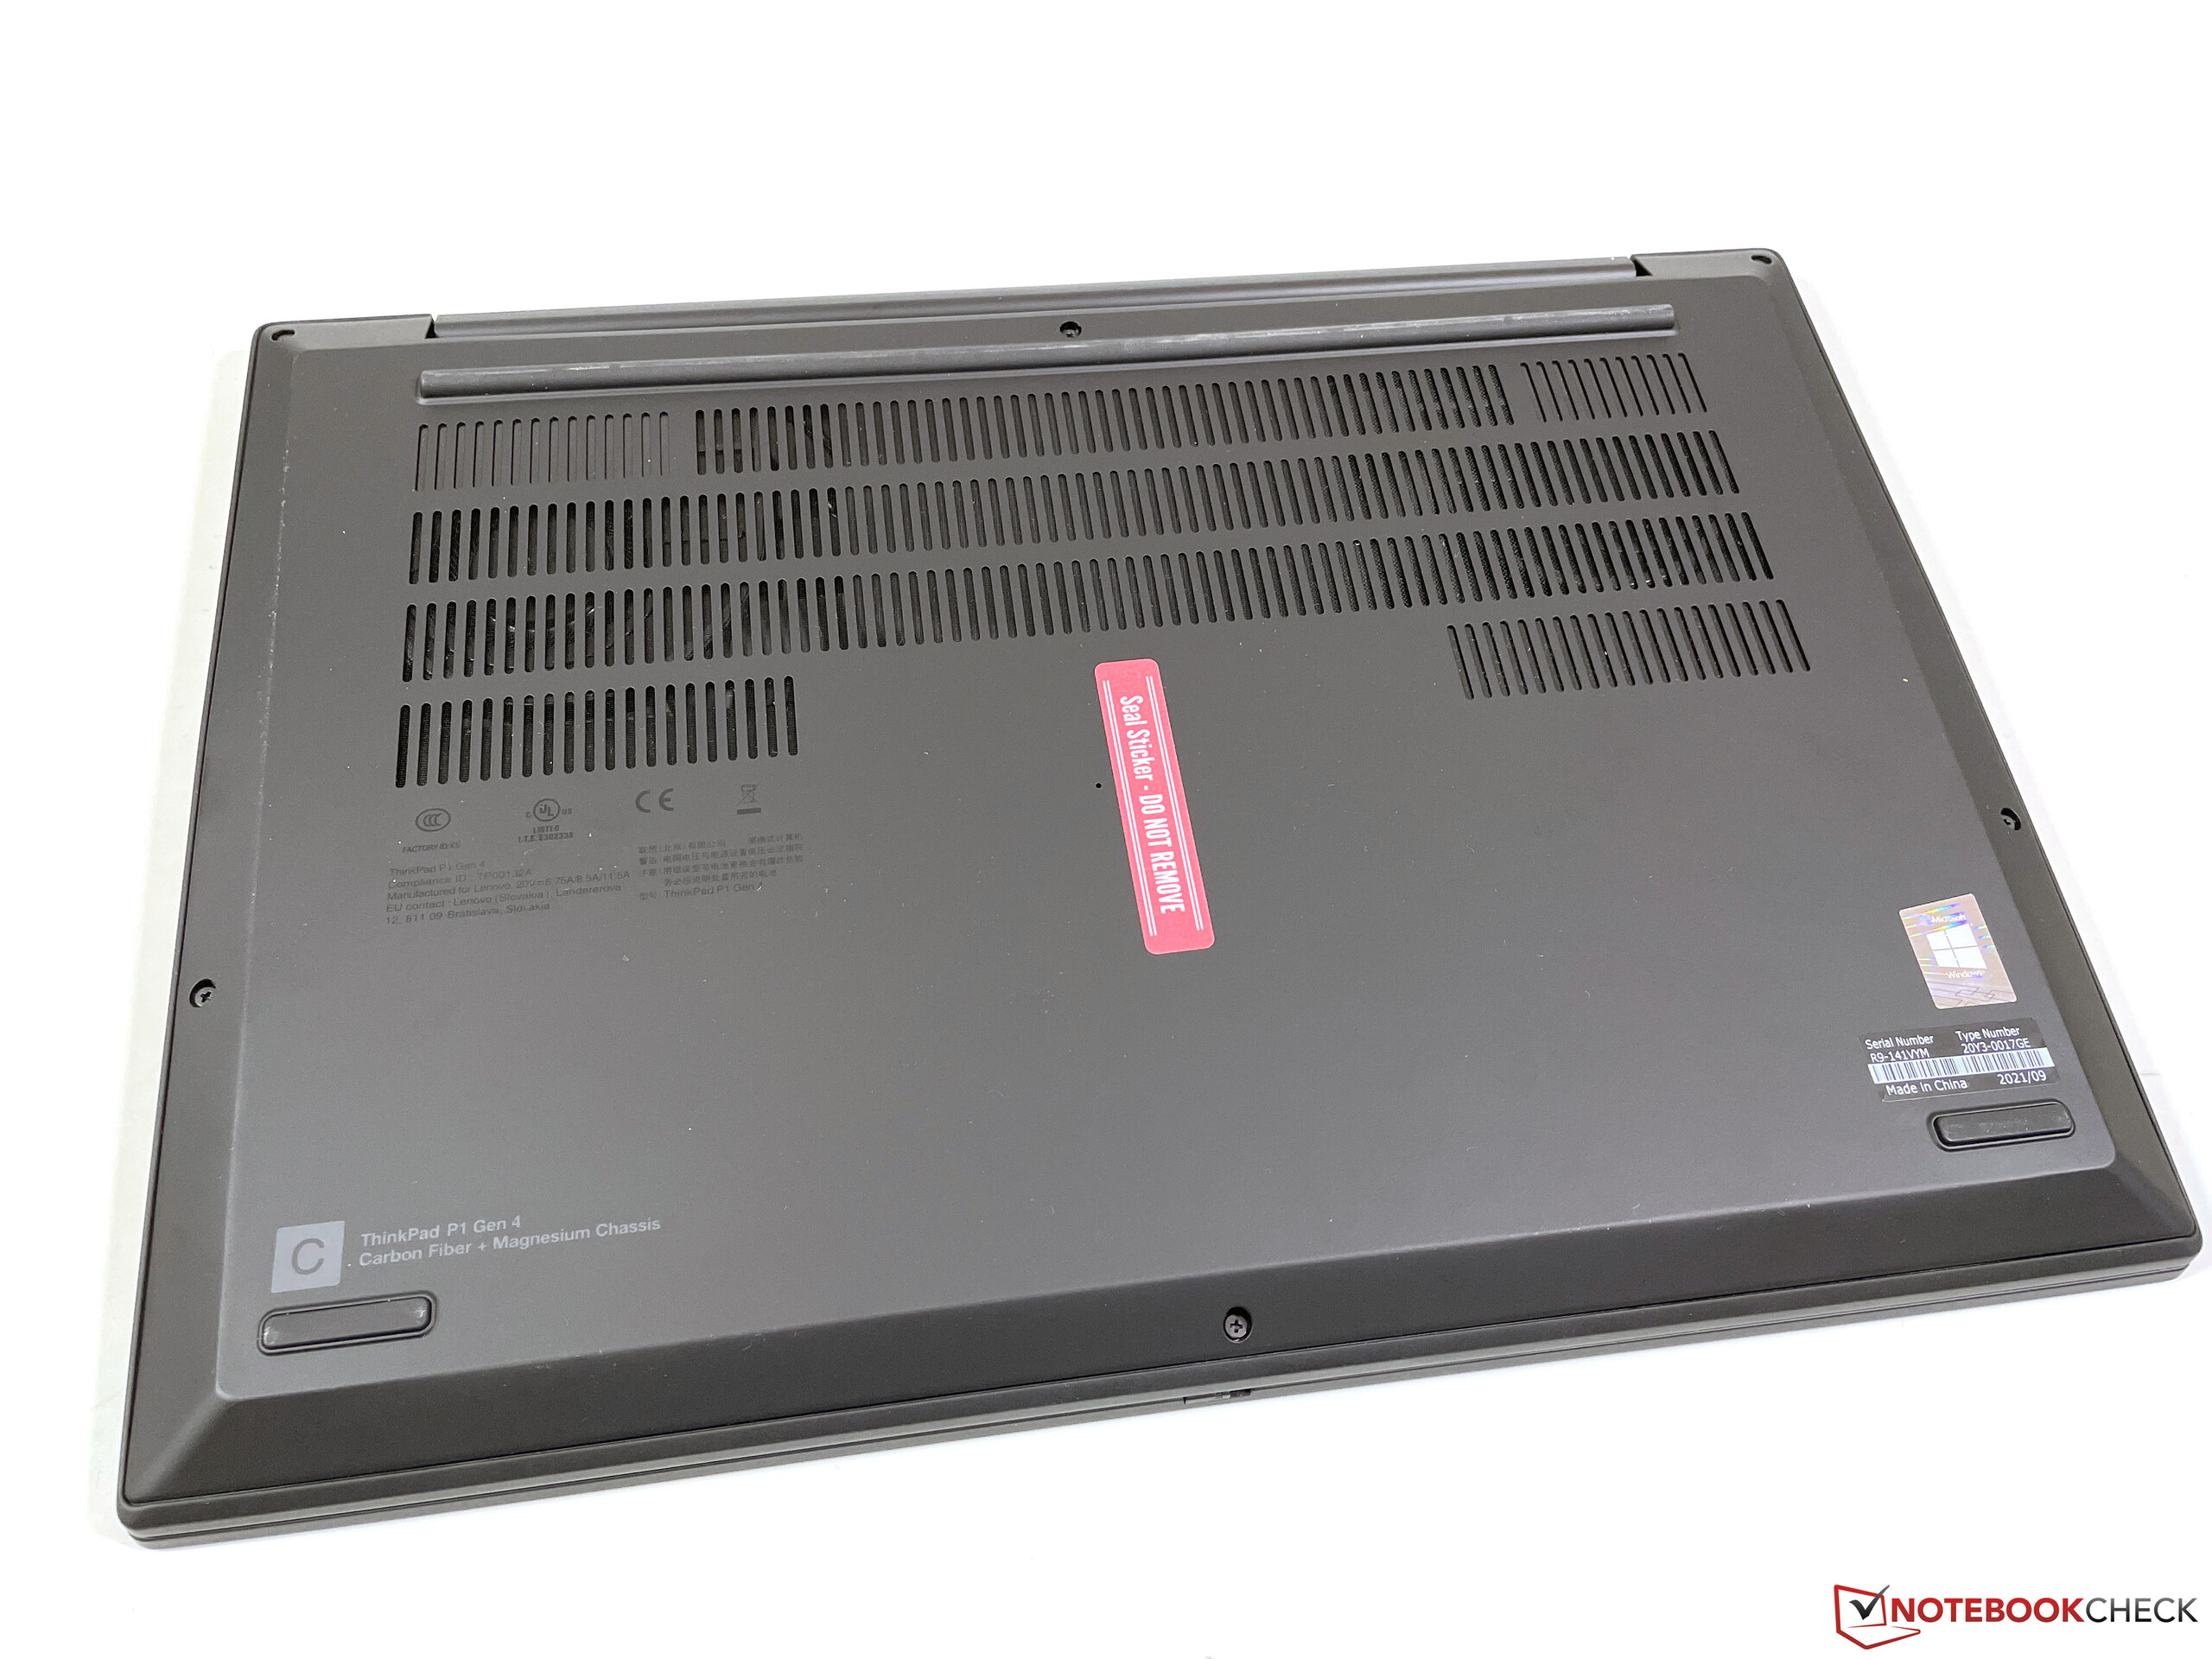
A helyzetet tovább bonyolítja, ha figyelembe vesszük, hogy a ThinkPad P1 G4-nek (illetve az X1 Extreme G4-nek) két alapmodellje van. A „kisebb” GPU-val felszerelt modellek hagyományos, hőcsöves hűtési megoldást használnak, ami kevésbé helyigényes, és helyet ad egy második M.2-2280-as foglalatnak, valamint egy opcionális WWAN modulnak (a P1 G4 azonban nem WWAN-képes). A nagyobb teljesítményű GPU-kkal (legalább RTX A3000 vagy RTX 3060 az X1 Extreme G4 esetében) felszerelt modellek új, gőzkamrás hűtést kapnak, de ez több helyet igényel, és valószínűleg egy kicsit nehezebb is.
Jelenleg a Dell új Precision 5560-as modelljét vizsgáljuk, a jövő héten pedig a ThinkPad P1 G4 sokkal erősebb változatát várjuk GeForce RTX 3070-zel és matt 4K kijelzővel. Már most kíváncsian várjuk, hogyan teljesít az új gőzkamrás hűtés.
Ár és Elérhetőség
A Lenovo.com oldalon 2319 dollárért szerepel az általunk tesztelt konfiguráció, és más modellek is kaphatók.
Lenovo ThinkPad P1 G4-20Y30017GE
- 10/08/2021 v7 (old)
Andreas Osthoff
Price comparison

