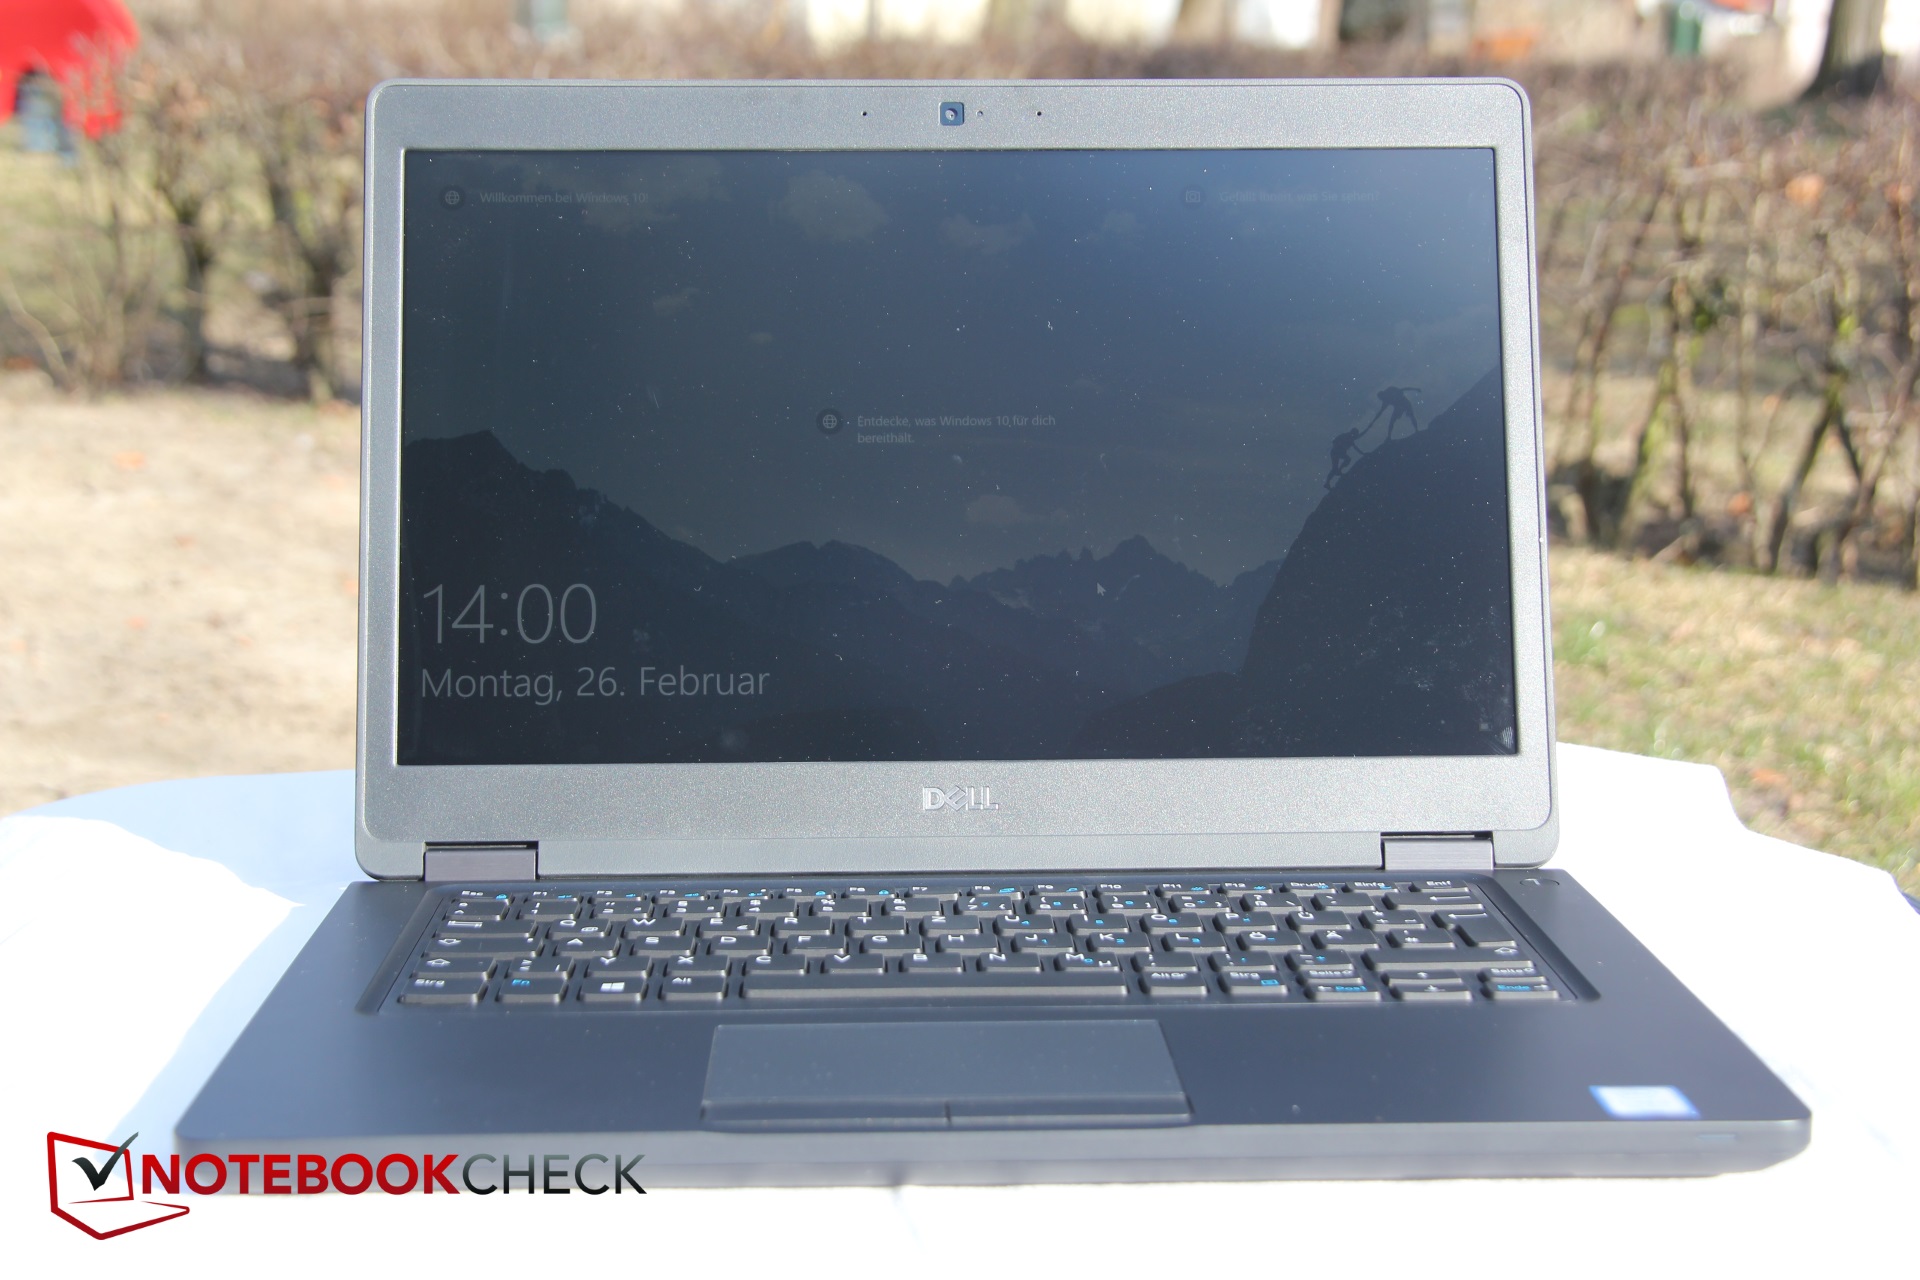
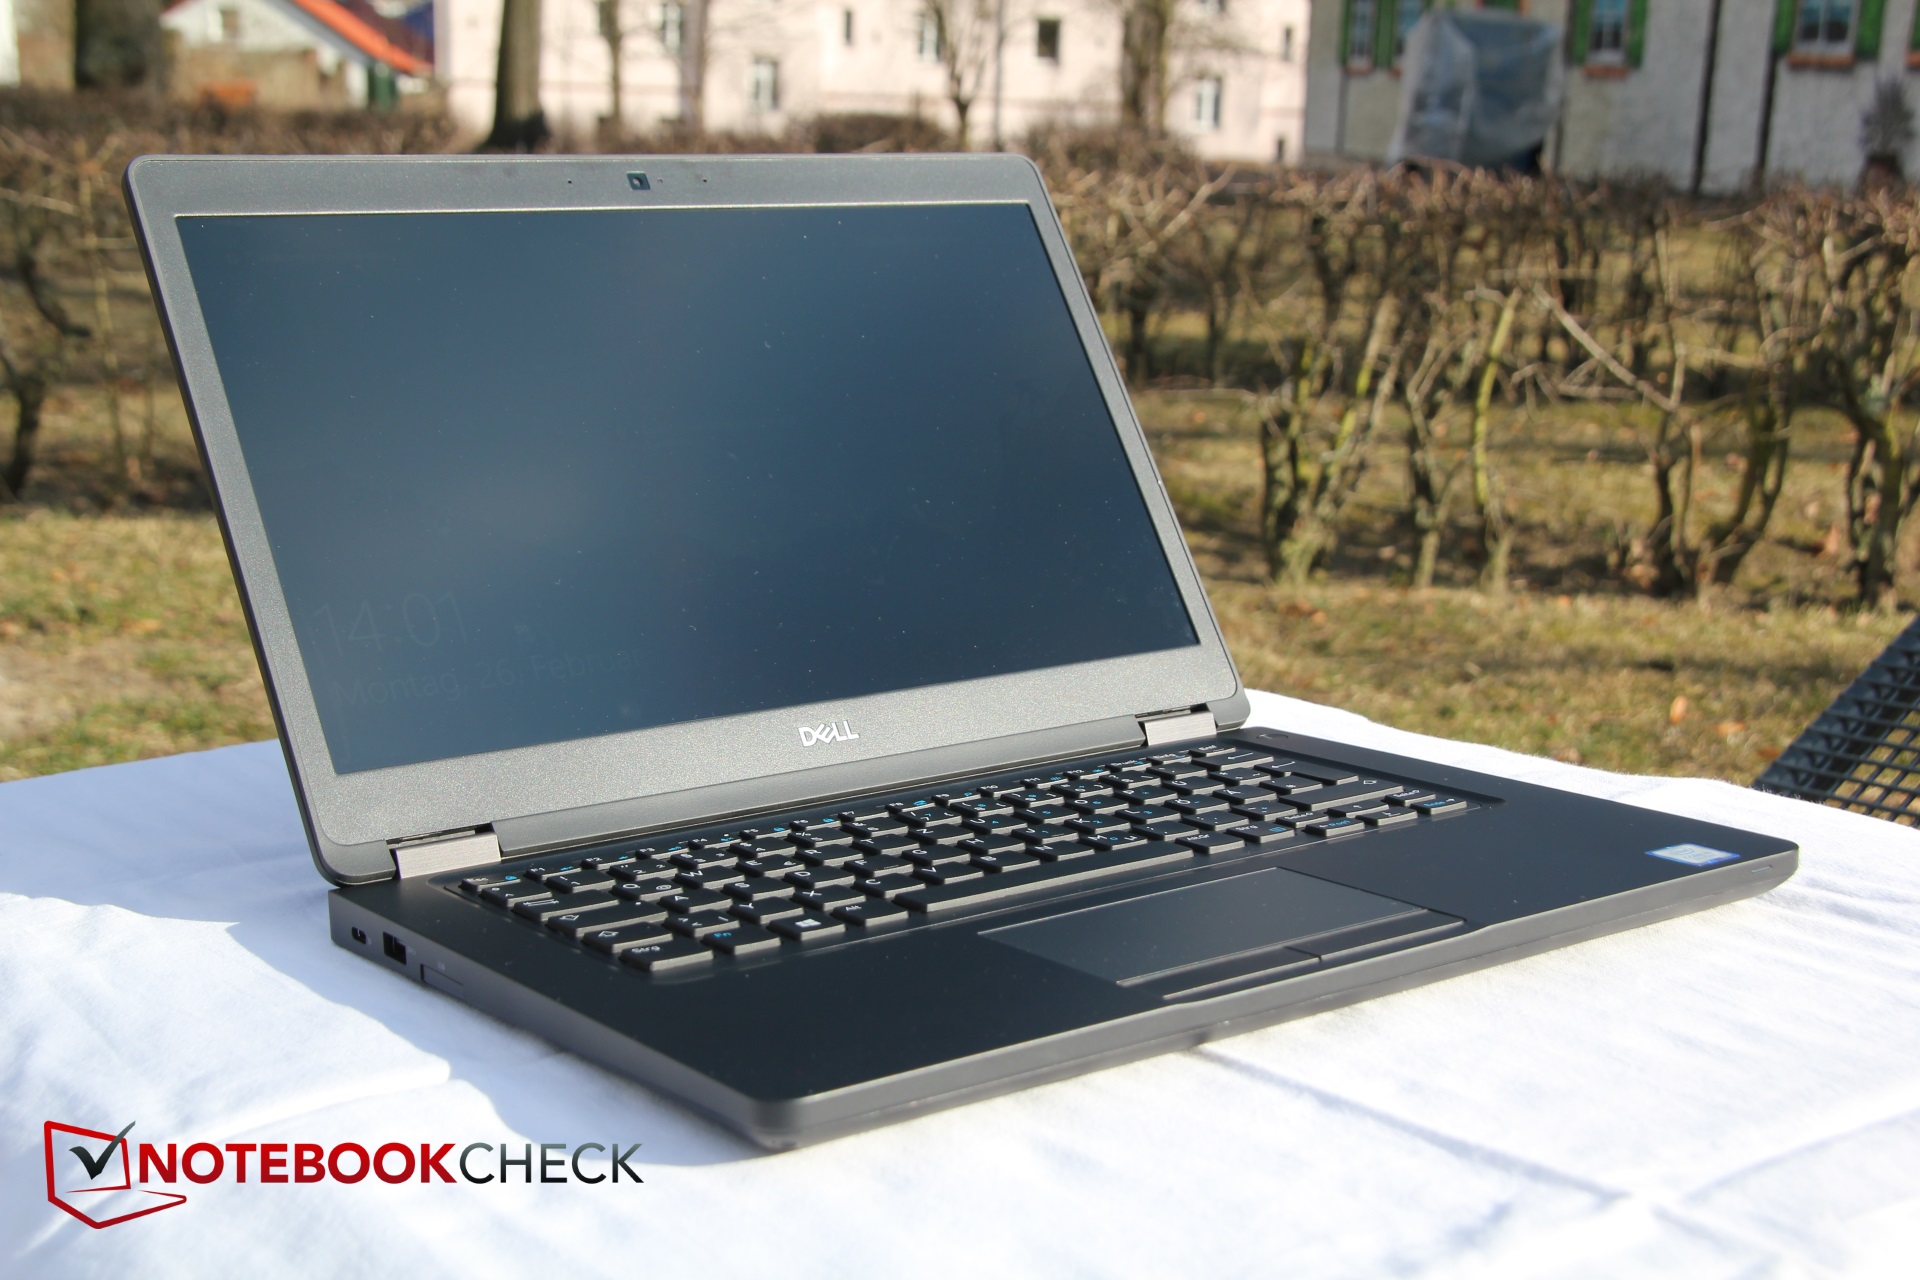
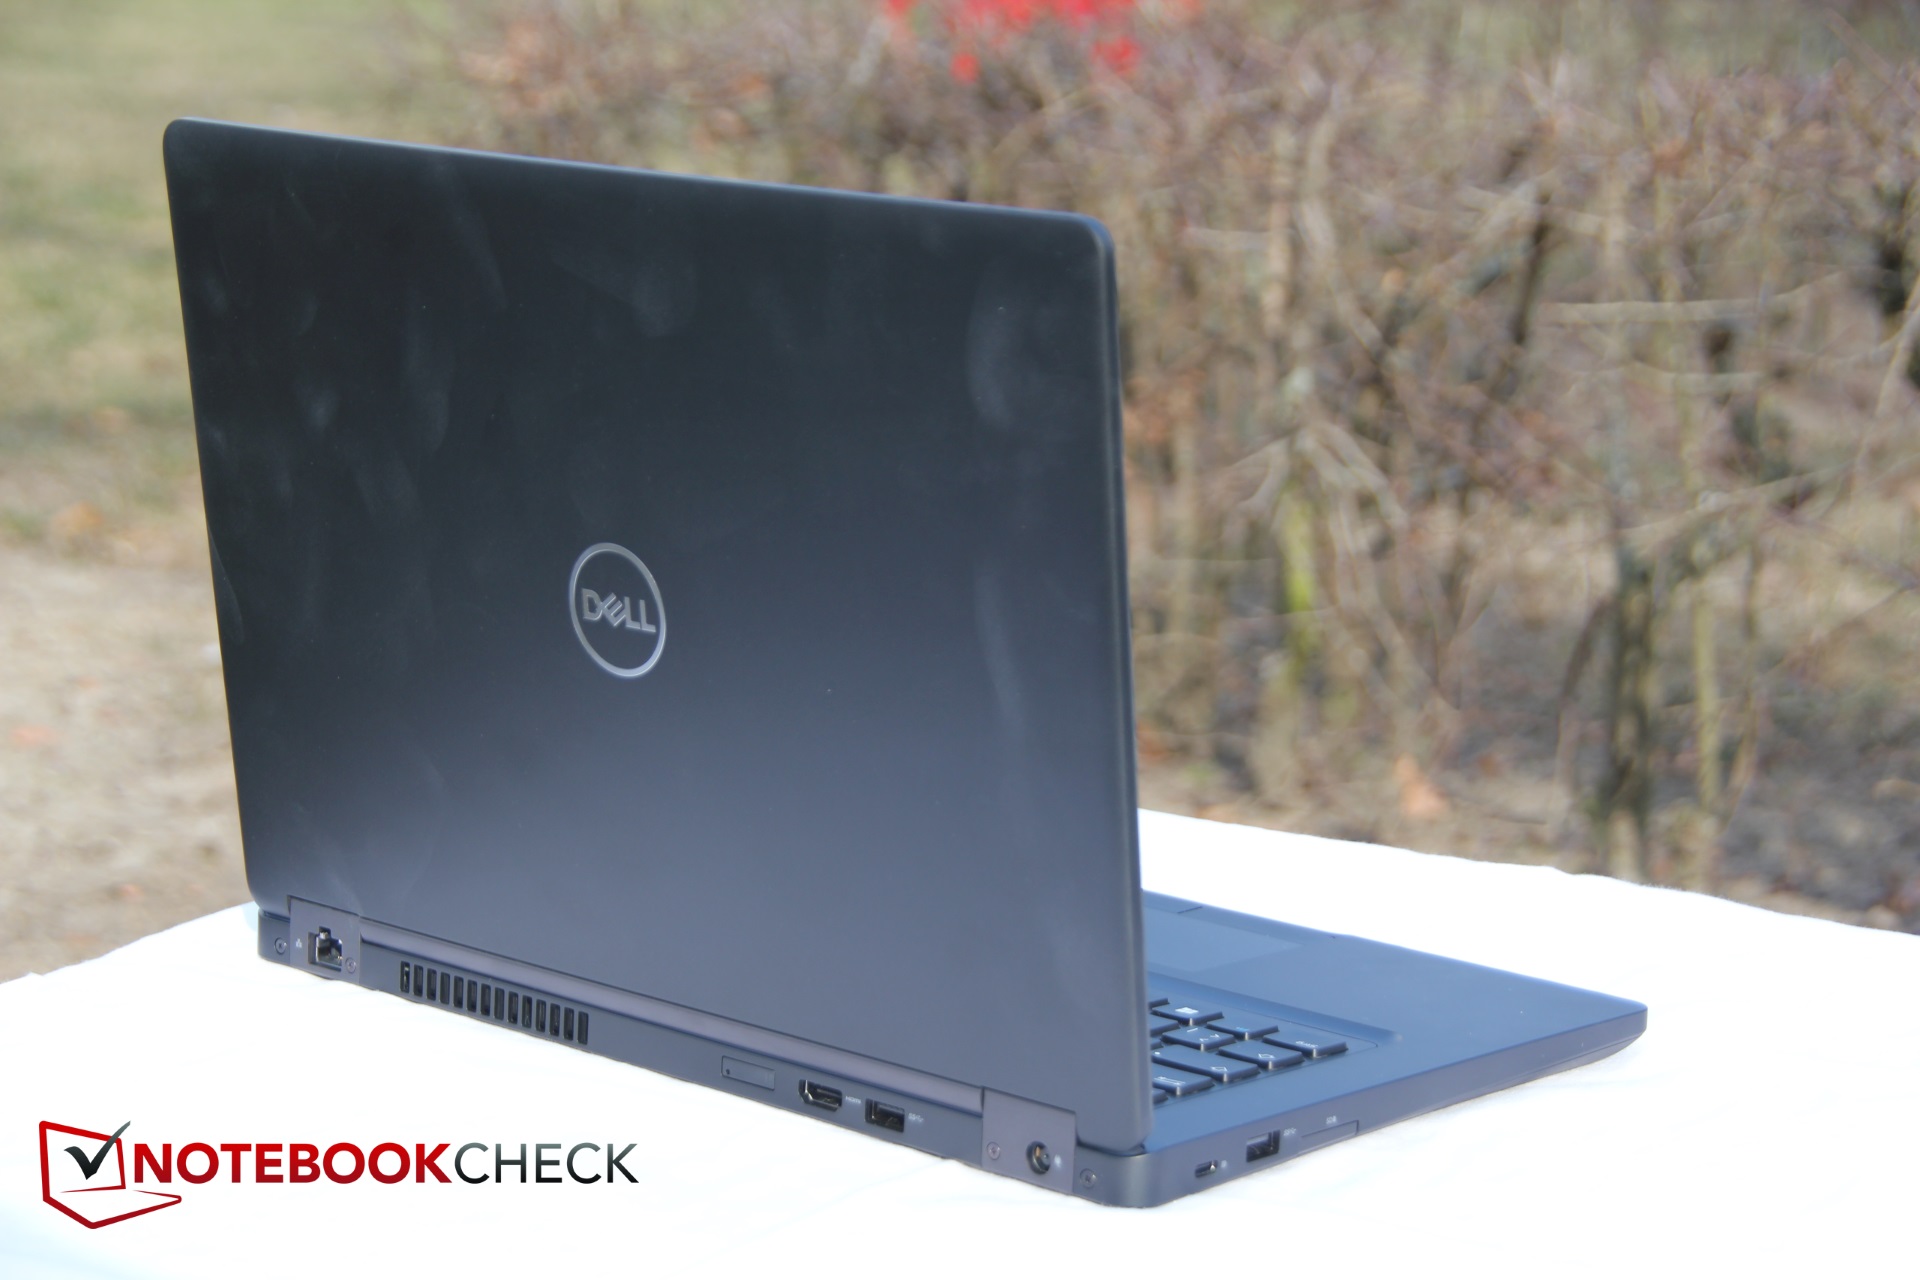
Dell Latitude 5490 (Core i7-8650U, Touchscreen) Laptop rövid értékelés

| BioShock Infinite | |
| 1280x720 Very Low Preset (érték szerinti rendezés) | |
| Dell Latitude 5490 | |
| HP EliteBook 840 G4-Z2V49ET ABD | |
| Lenovo ThinkPad T470-20HD002HGE | |
| 1366x768 Medium Preset (érték szerinti rendezés) | |
| Dell Latitude 5490 | |
| HP EliteBook 840 G4-Z2V49ET ABD | |
| Lenovo ThinkPad T470-20HD002HGE | |
| 1366x768 High Preset (érték szerinti rendezés) | |
| Dell Latitude 5490 | |
| HP EliteBook 840 G4-Z2V49ET ABD | |
| Lenovo ThinkPad T470-20HD002HGE | |
| 1920x1080 Ultra Preset, DX11 (DDOF) (érték szerinti rendezés) | |
| Dell Latitude 5490 | |
| HP EliteBook 840 G4-Z2V49ET ABD | |
| Lenovo ThinkPad T470-20HD002HGE | |
| SD Card Reader | |
| average JPG Copy Test (av. of 3 runs) | |
| Dell Latitude 5490-TD70X (Toshiba Exceria Pro SDXC 64 GB UHS-II) | |
| Dell Latitude 5490 (Toshiba Exceria Pro SDXC 64 GB UHS-II) | |
| Dell Latitude 5480 (Toshiba Exceria Pro SDXC 64 GB UHS-II) | |
| Lenovo ThinkPad T470-20HD002HGE (Toshiba Exceria Pro SDXC 64 GB UHS-II) | |
| HP EliteBook 840 G4-Z2V49ET ABD (Toshiba Exceria Pro SDXC 64 GB UHS-II) | |
| Az osztály átlaga Office (19.8 - 198.5, n=22, az elmúlt 2 évben) | |
| maximum AS SSD Seq Read Test (1GB) | |
| Dell Latitude 5480 (Toshiba Exceria Pro SDXC 64 GB UHS-II) | |
| Dell Latitude 5490-TD70X (Toshiba Exceria Pro SDXC 64 GB UHS-II) | |
| Dell Latitude 5490 (Toshiba Exceria Pro SDXC 64 GB UHS-II) | |
| Lenovo ThinkPad T470-20HD002HGE (Toshiba Exceria Pro SDXC 64 GB UHS-II) | |
| HP EliteBook 840 G4-Z2V49ET ABD (Toshiba Exceria Pro SDXC 64 GB UHS-II) | |
| Az osztály átlaga Office (27.4 - 249, n=21, az elmúlt 2 évben) | |
| Networking | |
| iperf3 transmit AX12 | |
| Dell Latitude 5490 | |
| Lenovo ThinkPad T470-20HD002HGE | |
| Dell Latitude 5490-TD70X | |
| HP EliteBook 840 G4-Z2V49ET ABD (jseb) | |
| Dell Latitude 5480 | |
| iperf3 receive AX12 | |
| Lenovo ThinkPad T470-20HD002HGE | |
| Dell Latitude 5490 | |
| Dell Latitude 5480 | |
| Dell Latitude 5490-TD70X | |
| HP EliteBook 840 G4-Z2V49ET ABD (jseb) | |
| |||||||||||||||||||||||||
Fényerő megoszlás: 87 %
Centrumban: 200.6 cd/m²
Kontraszt: 1254:1 (Fekete: 0.16 cd/m²)
ΔE ColorChecker Calman: 8.36 | ∀{0.5-29.43 Ø4.71}
calibrated: 4.6
ΔE Greyscale Calman: 7.7 | ∀{0.09-98 Ø4.96}
54.2% sRGB (Argyll 1.6.3 3D)
34.5% AdobeRGB 1998 (Argyll 1.6.3 3D)
37.62% AdobeRGB 1998 (Argyll 3D)
54.6% sRGB (Argyll 3D)
36.42% Display P3 (Argyll 3D)
Gamma: 2.773
CCT: 6397 K
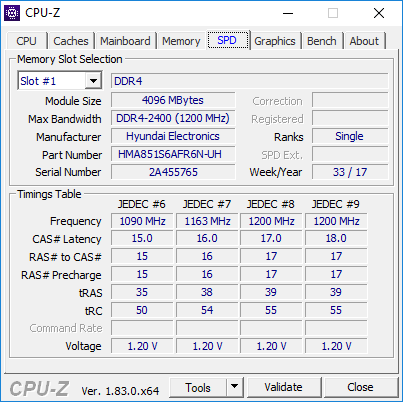
| Dell Latitude 5490 AUO133D, IPS, 14", 1920x1080 | Dell Latitude 5490-TD70X AU Optronics AUO263D, IPS, 14", 1920x1080 | Dell Latitude 5480 LG Philips LGD0553, IPS, 14", 1920x1080 | HP EliteBook 840 G4-Z2V49ET ABD AUO123D, TN, 14", 1920x1080 | Lenovo ThinkPad T480-20L6S01V00 Lenovo LP140WF6-SPB7, IPS, 14", 1920x1080 | Lenovo ThinkPad T470-20HD002HGE N140HCA-EAB, IPS, 14", 1920x1080 | |
|---|---|---|---|---|---|---|
| Display | 0% | 12% | 51% | 8% | 14% | |
| Display P3 Coverage (%) | 36.42 | 36.28 0% | 40.62 12% | 55.8 53% | 39.24 8% | 41.6 14% |
| sRGB Coverage (%) | 54.6 | 54.6 0% | 61.2 12% | 80.7 48% | 58.8 8% | 61.9 13% |
| AdobeRGB 1998 Coverage (%) | 37.62 | 37.48 0% | 41.96 12% | 57.7 53% | 40.56 8% | 43.06 14% |
| Response Times | -35% | -3% | -7% | -4% | -31% | |
| Response Time Grey 50% / Grey 80% * (ms) | 30.4 ? | 46.9 ? -54% | 32.8 ? -8% | 39 ? -28% | 35.6 ? -17% | 41.6 ? -37% |
| Response Time Black / White * (ms) | 27.2 ? | 31.2 ? -15% | 26.4 ? 3% | 23 ? 15% | 24.8 ? 9% | 34 ? -25% |
| PWM Frequency (Hz) | ||||||
| Screen | 11% | 11% | -28% | 14% | 11% | |
| Brightness middle (cd/m²) | 200.6 | 227 13% | 215.9 8% | 346 72% | 307 53% | 306 53% |
| Brightness (cd/m²) | 204 | 211 3% | 205 0% | 317 55% | 295 45% | 287 41% |
| Brightness Distribution (%) | 87 | 88 1% | 90 3% | 86 -1% | 90 3% | 88 1% |
| Black Level * (cd/m²) | 0.16 | 0.19 -19% | 0.22 -38% | 0.86 -438% | 0.25 -56% | 0.3 -88% |
| Contrast (:1) | 1254 | 1195 -5% | 981 -22% | 402 -68% | 1228 -2% | 1020 -19% |
| Colorchecker dE 2000 * | 8.36 | 5.6 33% | 5.1 39% | 8.64 -3% | 5.7 32% | 6.2 26% |
| Colorchecker dE 2000 max. * | 25.63 | 22.4 13% | 15.6 39% | 13.58 47% | 21.3 17% | 13.6 47% |
| Colorchecker dE 2000 calibrated * | 4.6 | 4.7 -2% | ||||
| Greyscale dE 2000 * | 7.7 | 2.4 69% | 4 48% | 11.24 -46% | 3.7 52% | 5.8 25% |
| Gamma | 2.773 79% | 2.44 90% | 2.41 91% | 2.62 84% | 2.11 104% | 2.04 108% |
| CCT | 6397 102% | 6506 100% | 6856 95% | 12530 52% | 7353 88% | 6277 104% |
| Color Space (Percent of AdobeRGB 1998) (%) | 34.5 | 34.5 0% | 41.96 22% | 52 51% | 37.4 8% | 39.62 15% |
| Color Space (Percent of sRGB) (%) | 54.2 | 54.4 0% | 61.15 13% | 80 48% | 58.7 8% | 61.44 13% |
| Teljes átlag (program / beállítások) | -8% /
3% | 7% /
10% | 5% /
-9% | 6% /
11% | -2% /
6% |
* ... a kisebb jobb
Megjelenítési válaszidők
| ↔ Válaszidő Fekete-fehér | ||
|---|---|---|
| 27.2 ms ... emelkedés és süllyedés ↘ kombinálva | ↗ 16.4 ms emelkedés | 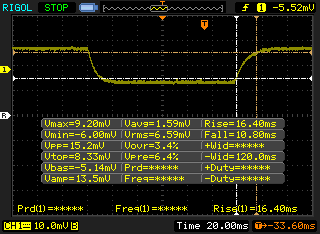 |
| ↘ 10.8 ms ősz | ||
| A képernyő viszonylag lassú reakciósebességet mutat tesztjeinkben, és túl lassú lehet a játékosok számára. Összehasonlításképpen, az összes tesztelt eszköz 0.1 (minimum) és 240 (maximum) ms között mozog. » 69 % of all devices are better. Ez azt jelenti, hogy a mért válaszidő rosszabb, mint az összes vizsgált eszköz átlaga (19.8 ms). | ||
| ↔ Válaszidő 50% szürke és 80% szürke között | ||
| 30.4 ms ... emelkedés és süllyedés ↘ kombinálva | ↗ 16.8 ms emelkedés | 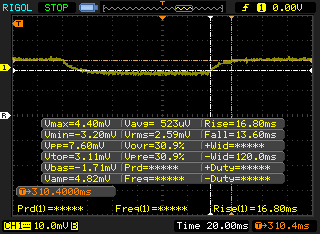 |
| ↘ 13.6 ms ősz | ||
| A képernyő lassú reakciósebességet mutat tesztjeinkben, és nem lesz kielégítő a játékosok számára. Összehasonlításképpen, az összes tesztelt eszköz 0.165 (minimum) és 636 (maximum) ms között mozog. » 41 % of all devices are better. Ez azt jelenti, hogy a mért válaszidő hasonló az összes vizsgált eszköz átlagához (31 ms). | ||
Képernyő villogása / PWM (impulzusszélesség-moduláció)
| Képernyő villogása / PWM nem érzékelhető | 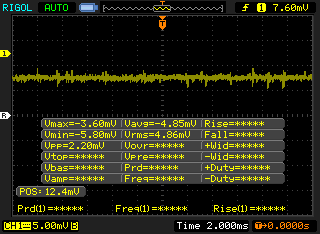 | ||
Összehasonlításképpen: az összes tesztelt eszköz 52 %-a nem használja a PWM-et a kijelző elsötétítésére. Ha PWM-et észleltek, akkor átlagosan 7754 (minimum: 5 - maximum: 343500) Hz-t mértek. | |||
| wPrime 2.10 - 1024m | |
| Dell Latitude 5480 | |
| Dell Latitude 5490-TD70X | |
| Az osztály átlaga Office (208 - 675, n=8, az elmúlt 2 évben) | |
| Dell Latitude 5490 | |
| Átlagos Intel Core i7-8650U (268 - 335, n=3) | |
* ... a kisebb jobb
| PCMark 8 Home Score Accelerated v2 | 4065 pontok | |
| PCMark 8 Creative Score Accelerated v2 | 5225 pontok | |
| PCMark 8 Work Score Accelerated v2 | 5200 pontok | |
| PCMark 10 Score | 4066 pontok | |
Segítség | ||
| Dell Latitude 5490 Samsung PM961 MZVLW256HEHP | Dell Latitude 5490-TD70X Toshiba KSG60ZMV512G | HP EliteBook 840 G4-Z2V49ET ABD Samsung PM961 MZVLW256HEHP | Lenovo ThinkPad T480-20L6S01V00 Samsung SSD PM981 MZVLB512HAJQ | Átlagos Samsung PM961 MZVLW256HEHP | |
|---|---|---|---|---|---|
| AS SSD | -20% | 64% | -457% | -33% | |
| Copy Game MB/s (MB/s) | 273.6 | 505 85% | 355.1 30% | 676 147% | 537 ? 96% |
| Copy Program MB/s (MB/s) | 214 | 213 0% | 269.7 26% | 254.8 19% | 343 ? 60% |
| Copy ISO MB/s (MB/s) | 514 | 426.6 -17% | 735 43% | 921 79% | 1004 ? 95% |
| Score Total (Points) | 1834 | 1067 -42% | 3006 64% | 2348 28% | 2565 ? 40% |
| Score Write (Points) | 449 | 381 -15% | 767 71% | 147 -67% | 587 ? 31% |
| Score Read (Points) | 916 | 455 -50% | 1524 66% | 1480 62% | 1378 ? 50% |
| Access Time Write * (ms) | 0.037 | 0.052 -41% | 0.027 27% | 2.515 -6697% | 0.4637 ? -1153% |
| Access Time Read * (ms) | 0.067 | 0.07 -4% | 0.044 34% | 0.041 39% | 0.06777 ? -1% |
| 4K-64 Write (MB/s) | 300.9 | 259.5 -14% | 510 69% | 96.2 -68% | 419 ? 39% |
| 4K-64 Read (MB/s) | 793 | 383.6 -52% | 1215 53% | 1278 61% | 1112 ? 40% |
| 4K Write (MB/s) | 93.6 | 91.7 -2% | 140.2 50% | 1.76 -98% | 91.6 ? -2% |
| 4K Read (MB/s) | 45.99 | 23.75 -48% | 49.21 7% | 58 26% | 45.1 ? -2% |
| Seq Write (MB/s) | 541 | 300.6 -44% | 1167 116% | 487.1 -10% | 960 ? 77% |
| Seq Read (MB/s) | 768 | 473.1 -38% | 2603 239% | 1441 88% | 2019 ? 163% |
* ... a kisebb jobb

| 3DMark 06 Standard Score | 11732 pontok | |
| 3DMark 11 Performance | 1989 pontok | |
| 3DMark Cloud Gate Standard Score | 8914 pontok | |
| 3DMark Fire Strike Score | 1062 pontok | |
Segítség | ||
| alacsony | közepes | magas | ultra | |
|---|---|---|---|---|
| BioShock Infinite (2013) | 64 | 35 | 29 | 10 |
Zajszint
| Üresjárat |
| 27.8 / 27.8 / 31 dB(A) |
| Terhelés |
| 34.2 / 42.7 dB(A) |
 | ||
30 dB csendes 40 dB(A) hallható 50 dB(A) hangos |
||
min: | ||
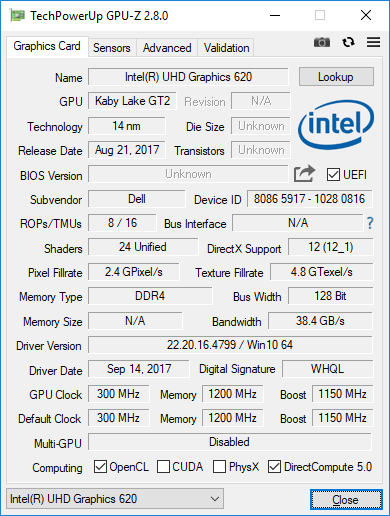
| Dell Latitude 5490 UHD Graphics 620, i7-8650U, Samsung PM961 MZVLW256HEHP | Dell Latitude 5490-TD70X UHD Graphics 620, i5-8350U, Toshiba KSG60ZMV512G | Dell Latitude 5480 HD Graphics 620, i7-7600U, Toshiba SG5 256GB THNSNK256GVN8 | HP EliteBook 840 G4-Z2V49ET ABD HD Graphics 620, i5-7200U, Samsung PM961 MZVLW256HEHP | Lenovo ThinkPad T480-20L6S01V00 GeForce MX150, i5-8550U, Samsung SSD PM981 MZVLB512HAJQ | Lenovo ThinkPad T470-20HD002HGE HD Graphics 620, i5-7200U, Samsung PM961 NVMe MZVLW512HMJP | |
|---|---|---|---|---|---|---|
| Noise | -2% | -8% | -2% | 1% | 5% | |
| off / környezet * (dB) | 27.8 | 28.8 -4% | 31 -12% | 29 -4% | 28 -1% | |
| Idle Minimum * (dB) | 27.8 | 28.8 -4% | 29.6 -6% | 31 -12% | 29 -4% | 28 -1% |
| Idle Average * (dB) | 27.8 | 28.8 -4% | 29.6 -6% | 31 -12% | 29 -4% | 28 -1% |
| Idle Maximum * (dB) | 31 | 30.9 -0% | 29.6 5% | 31 -0% | 29 6% | 29.4 5% |
| Load Average * (dB) | 34.2 | 35.6 -4% | 42 -23% | 33.5 2% | 35.6 -4% | 31.4 8% |
| Load Maximum * (dB) | 42.7 | 41.4 3% | 47.1 -10% | 33.7 21% | 35.6 17% | 34.6 19% |
| Witcher 3 ultra * (dB) | 32.5 |
* ... a kisebb jobb
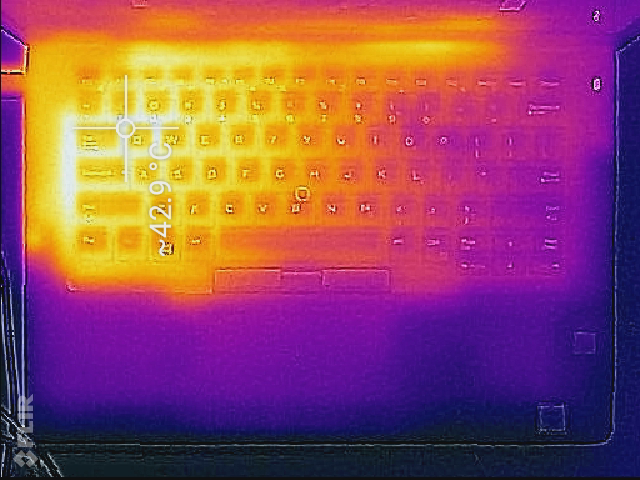
(±) A felső oldalon a maximális hőmérséklet 43.4 °C / 110 F, összehasonlítva a 34.3 °C / 94 F átlagával , 21.2 és 62.5 °C között a Office osztálynál.
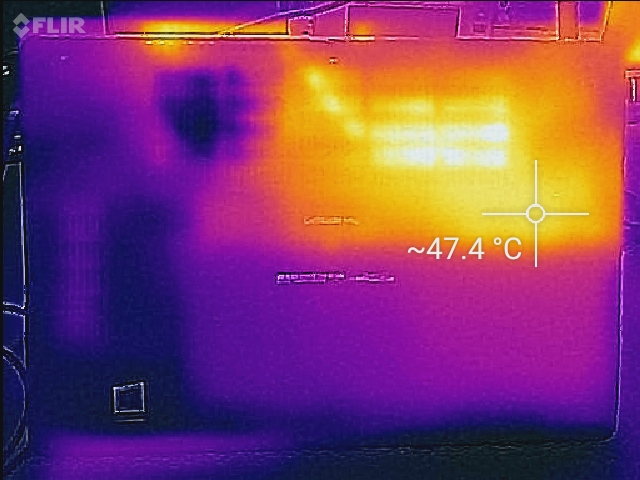
(-) Az alsó maximum 47.8 °C / 118 F-ig melegszik fel, összehasonlítva a 36.8 °C / 98 F átlagával
(+) Üresjáratban a felső oldal átlagos hőmérséklete 26.3 °C / 79 F, összehasonlítva a 29.5 °C / ### eszközátlaggal class_avg_f### F.
(+) A csuklótámasz és az érintőpad hűvösebb, mint a bőr hőmérséklete, maximum 28.2 °C / 82.8 F, ezért hűvös tapintású.
(±) A hasonló eszközök csuklótámasz területének átlagos hőmérséklete 27.5 °C / 81.5 F volt (-0.7 °C / -1.3 F).
Dell Latitude 5490 hangelemzés
(±) | a hangszóró hangereje átlagos, de jó (78.3 dB)
Basszus 100 - 315 Hz
(-) | szinte nincs basszus – átlagosan 15.5%-kal alacsonyabb a mediánnál
(±) | a basszus linearitása átlagos (9.3% delta az előző frekvenciához)
Közepes 400-2000 Hz
(+) | kiegyensúlyozott középpontok – csak 3.9% választja el a mediántól
(±) | a középpontok linearitása átlagos (9.5% delta az előző gyakorisághoz)
Maximum 2-16 kHz
(+) | kiegyensúlyozott csúcsok – csak 1.5% választja el a mediántól
(+) | a csúcsok lineárisak (1.7% delta az előző frekvenciához képest)
Összességében 100 - 16.000 Hz
(±) | az általános hang linearitása átlagos (17.4% eltérés a mediánhoz képest)
Ugyanazon osztályhoz képest
» 27%Ebben az osztályban az összes tesztelt eszköz %-a jobb volt, 7% hasonló, 66%-kal rosszabb
» A legjobb delta értéke 7%, az átlag 21%, a legrosszabb 53% volt
Az összes tesztelt eszközzel összehasonlítva
» 33% az összes tesztelt eszköz jobb volt, 8% hasonló, 58%-kal rosszabb
» A legjobb delta értéke 4%, az átlag 23%, a legrosszabb 134% volt
Lenovo ThinkPad T470-20HD002HGE hangelemzés
(±) | a hangszóró hangereje átlagos, de jó (80.4 dB)
Basszus 100 - 315 Hz
(-) | szinte nincs basszus – átlagosan 16.6%-kal alacsonyabb a mediánnál
(±) | a basszus linearitása átlagos (8.8% delta az előző frekvenciához)
Közepes 400-2000 Hz
(+) | kiegyensúlyozott középpontok – csak 4.3% választja el a mediántól
(+) | a középpontok lineárisak (6.7% delta az előző frekvenciához)
Maximum 2-16 kHz
(±) | magasabb csúcsok – átlagosan 5.4%-kal magasabb, mint a medián
(±) | a csúcsok linearitása átlagos (13.3% delta az előző gyakorisághoz)
Összességében 100 - 16.000 Hz
(±) | az általános hang linearitása átlagos (18.7% eltérés a mediánhoz képest)
Ugyanazon osztályhoz képest
» 35%Ebben az osztályban az összes tesztelt eszköz %-a jobb volt, 6% hasonló, 59%-kal rosszabb
» A legjobb delta értéke 7%, az átlag 21%, a legrosszabb 53% volt
Az összes tesztelt eszközzel összehasonlítva
» 43% az összes tesztelt eszköz jobb volt, 8% hasonló, 49%-kal rosszabb
» A legjobb delta értéke 4%, az átlag 23%, a legrosszabb 134% volt
| Kikapcsolt állapot / Készenlét | |
| Üresjárat | |
| Terhelés |
|
Kulcs:
min: | |
| Dell Latitude 5490 i7-8650U, UHD Graphics 620, Samsung PM961 MZVLW256HEHP, IPS, 1920x1080, 14" | Dell Latitude 5490-TD70X i5-8350U, UHD Graphics 620, Toshiba KSG60ZMV512G, IPS, 1920x1080, 14" | Dell Latitude 5480 i7-7600U, HD Graphics 620, Toshiba SG5 256GB THNSNK256GVN8, IPS, 1920x1080, 14" | HP EliteBook 840 G4-Z2V49ET ABD i5-7200U, HD Graphics 620, Samsung PM961 MZVLW256HEHP, TN, 1920x1080, 14" | Lenovo ThinkPad T470-20HD002HGE i5-7200U, HD Graphics 620, Samsung PM961 NVMe MZVLW512HMJP, IPS, 1920x1080, 14" | |
|---|---|---|---|---|---|
| Power Consumption | 0% | -3% | 19% | 19% | |
| Idle Minimum * (Watt) | 3.9 | 3.3 15% | 6.64 -70% | 2.9 26% | 3.21 18% |
| Idle Average * (Watt) | 6.2 | 5.54 11% | 6.67 -8% | 5.6 10% | 6.15 1% |
| Idle Maximum * (Watt) | 7.7 | 6.59 14% | 7.78 -1% | 8.15 -6% | 6.82 11% |
| Load Average * (Watt) | 43.9 | 42.4 3% | 30.83 30% | 30.6 30% | 28.5 35% |
| Load Maximum * (Watt) | 47.7 | 67.6 -42% | 31.7 34% | 31 35% | 34.5 28% |
* ... a kisebb jobb
| Dell Latitude 5490 i7-8650U, UHD Graphics 620, 68 Wh | Dell Latitude 5490-TD70X i5-8350U, UHD Graphics 620, 68 Wh | Dell Latitude 5480 i7-7600U, HD Graphics 620, 68 Wh | HP EliteBook 840 G4-Z2V49ET ABD i5-7200U, HD Graphics 620, 51 Wh | Lenovo ThinkPad T470-20HD002HGE i5-7200U, HD Graphics 620, 48 Wh | |
|---|---|---|---|---|---|
| Akkumulátor üzemidő | 29% | 39% | -18% | -37% | |
| WiFi v1.3 (h) | 11.6 | 15 29% | 16.1 39% | 9.5 -18% | 7.3 -37% |
| Reader / Idle (h) | 25.9 | 24.1 | 19.3 | ||
| Load (h) | 1.6 | 2.7 | 3.1 | 1.8 |
Pro
Kontra
Egy sallangmentes, produktivitás-orientált gép követelményeinek a Latitude 5490 legnagyobb részt megfelel. Gyors alkalmazások, strapabíró, jól kivitelezett ház, széles csatlakozókínálat, kitűnő beviteli eszközök, és kiemelkedően hosszú üzemidő jellemzik. Többnyire, mindennapos feladatok elvégzése közben csendes is, így jól illik az irodai környezetbe. Ennek az 1788 dolláros gépnek az előnyei a márciusban tesztelt konfigurációval szemben a sokkal jobb egymagos és valamivel jobb többmagos teljesítmény, a jobban teljesítő NVMe SSD, több biztonsági funkció, a háttérvilágításos billentyűzet, valamint az érintőkijelző. Ezek mind szívesen látottak (az árat nem említve—amelyre mindjárt visszatérünk) kivéve az érintőkijelző, amely a rossz kijelzőt még rosszabbá teszi, mivel a sötét tükröződés mentes panelből egy sötét, néha alig használható, tükröződő kijelzőt csinált. Már korábban is írtuk, de az 5490-nek hatalmas szüksége lenne egy sokkal világosabb tükröződésmentes panelra.
Egy gép sem hibátlan, de legalább teljesítmény és üzemidő terén nem igazán akad párja kategóriáján belül a Latitude 5490-nek. Ha a kijelzője jobb lenne, teljes szívvel tudnánk ajánlani.
Az elsődleges panaszunkon felül van még pár probléma: a gép viszonylag nehéz, nincs benne Thunderbolt 3, a fogyasztása és felületi hőmérséklete szintén nem ideális. Egyes riválisok - mint a HP EliteBook 840 G4 és a Lenovo ThinkPad T480 - sokkal jobban kezelik ezeket a dolgokat. A Dell Latitude 7490 és 7390 is kitűnő (bár drágább) alternatíva ezzel a kevés hiányossággal rendelkező géppel szemben. Ugyanakkor egy gép sem hibátlan, de legalább teljesítmény és üzemidő terén nem igazán akad párja kategóriáján belül a Latitude 5490-nek. Ha a kijelzője jobb lenne, teljes szívvel tudnánk ajánlani.
Ez az eredeti értékelés rövidített változata. A teljes, angol nyelvű cikk itt olvasható.
Dell Latitude 5490
- 05/12/2018 v6 (old)
Steve Schardein
Price comparison
