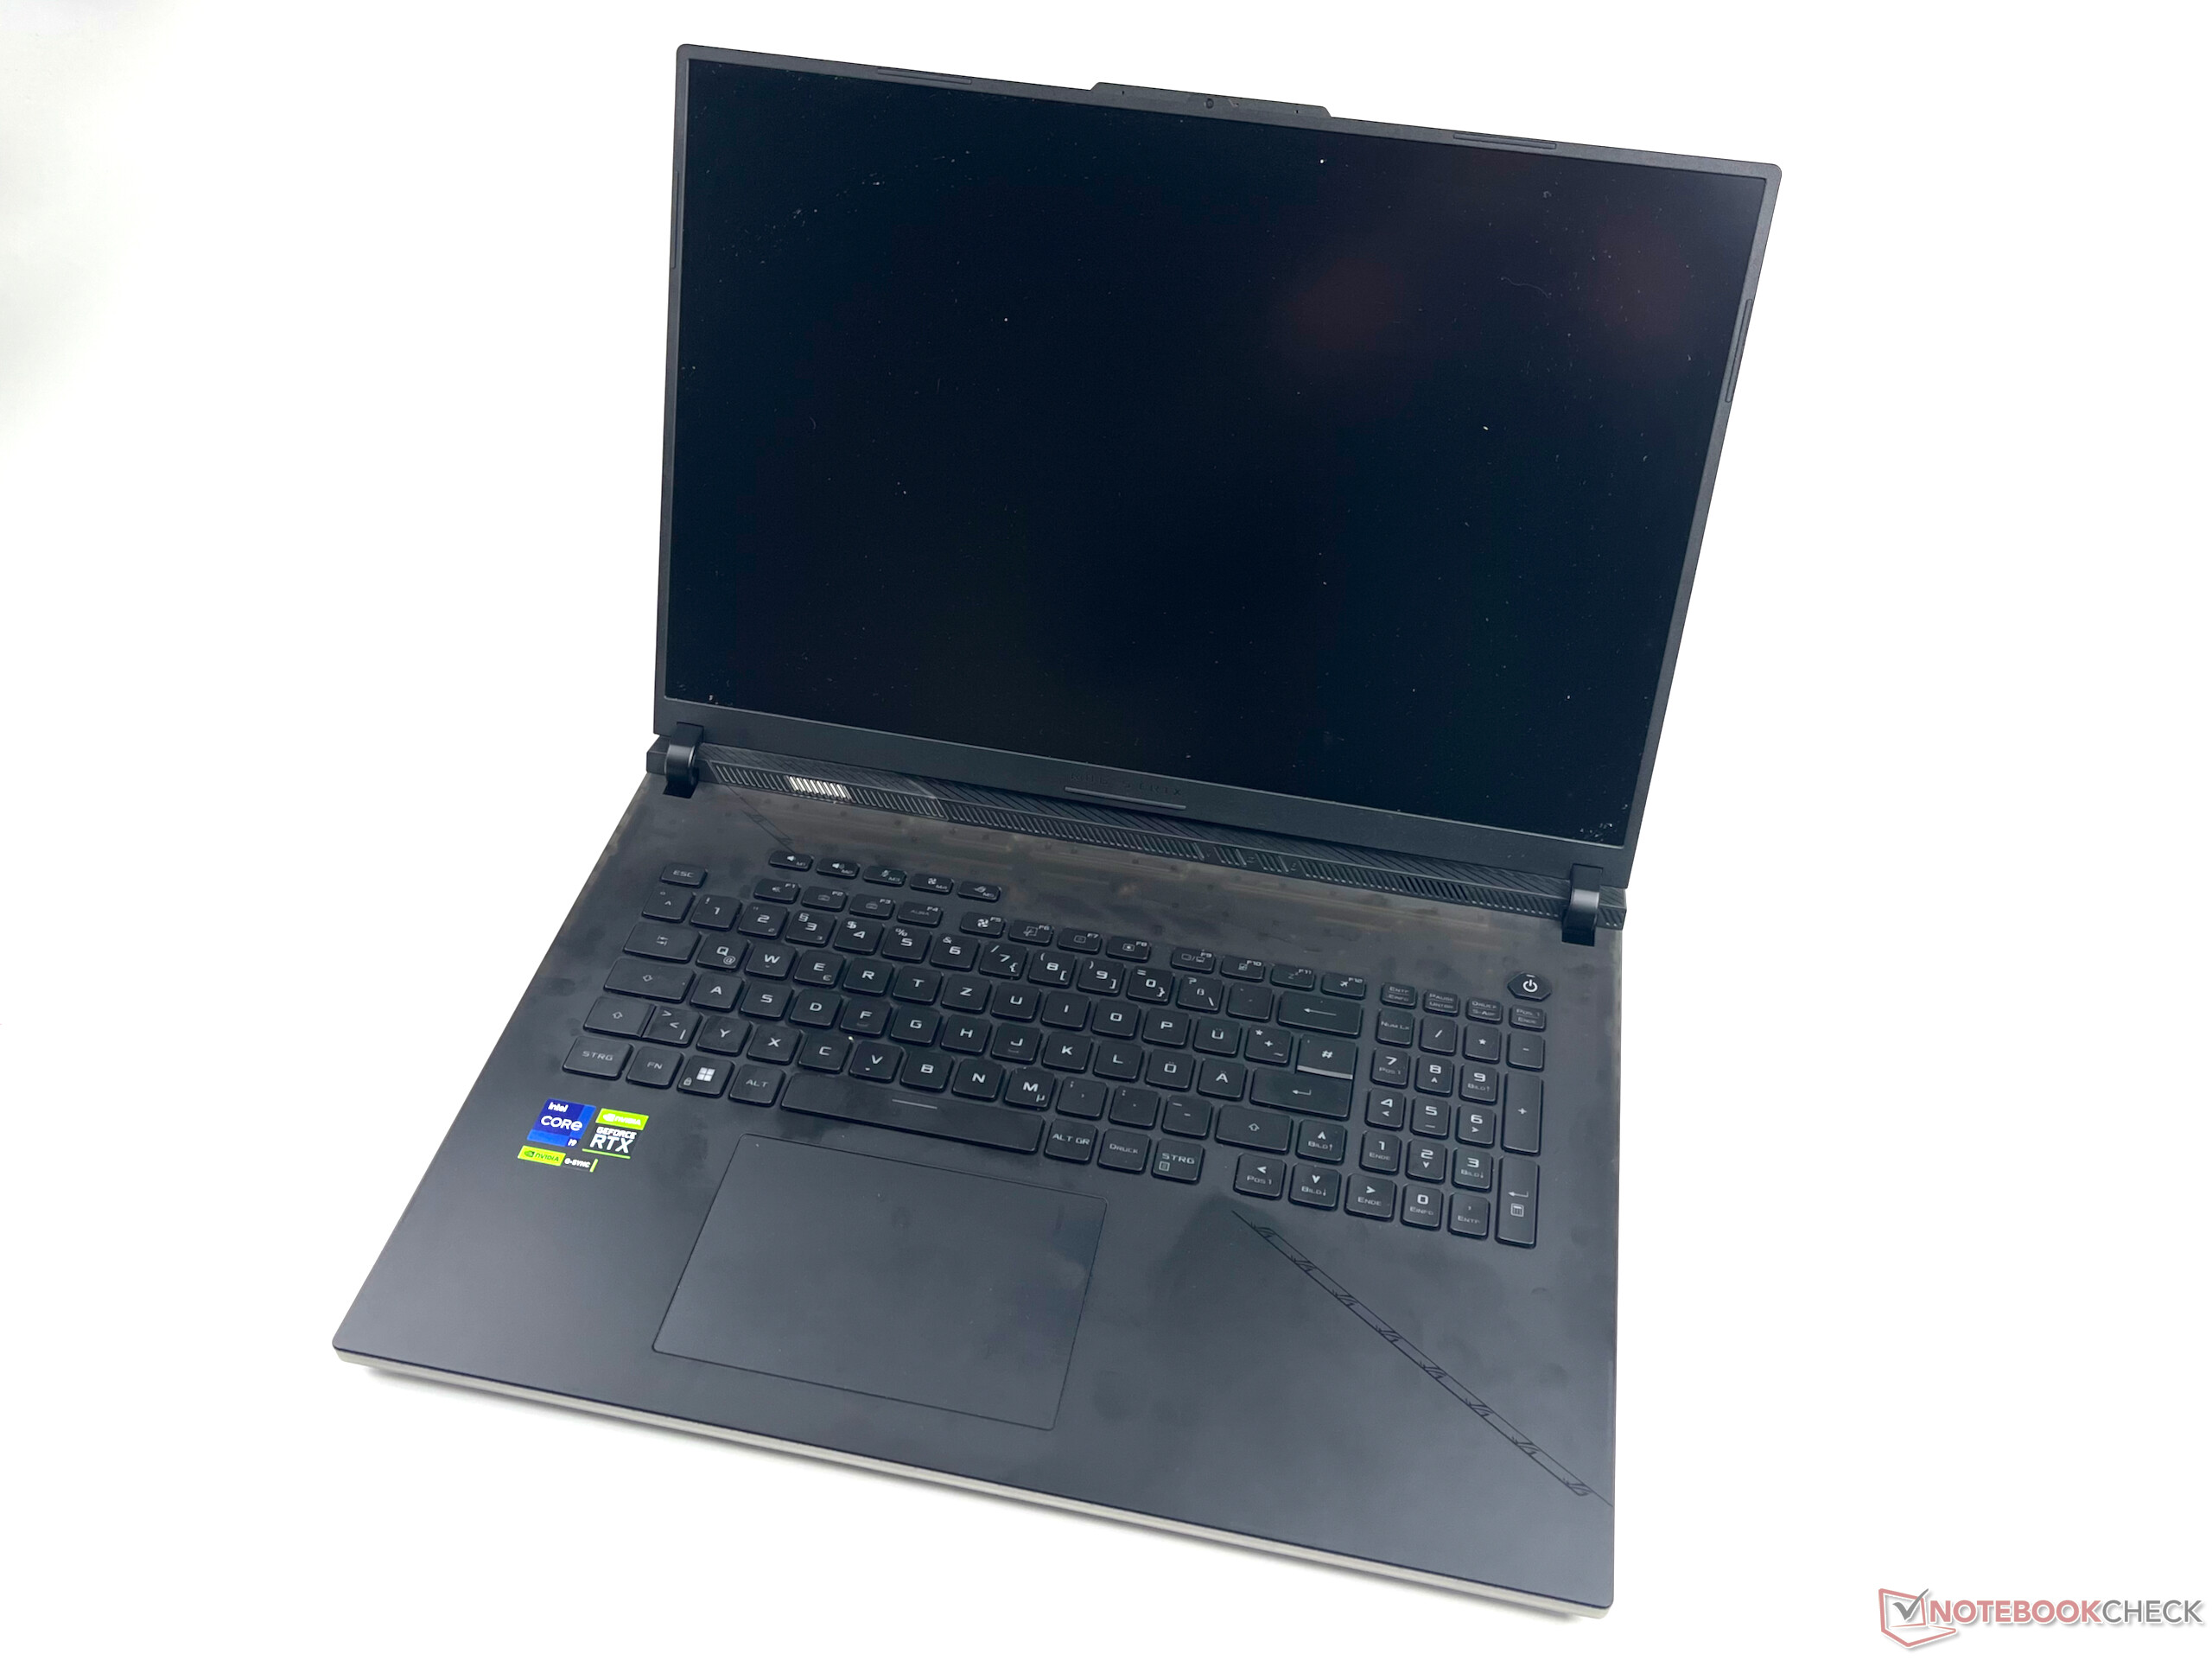
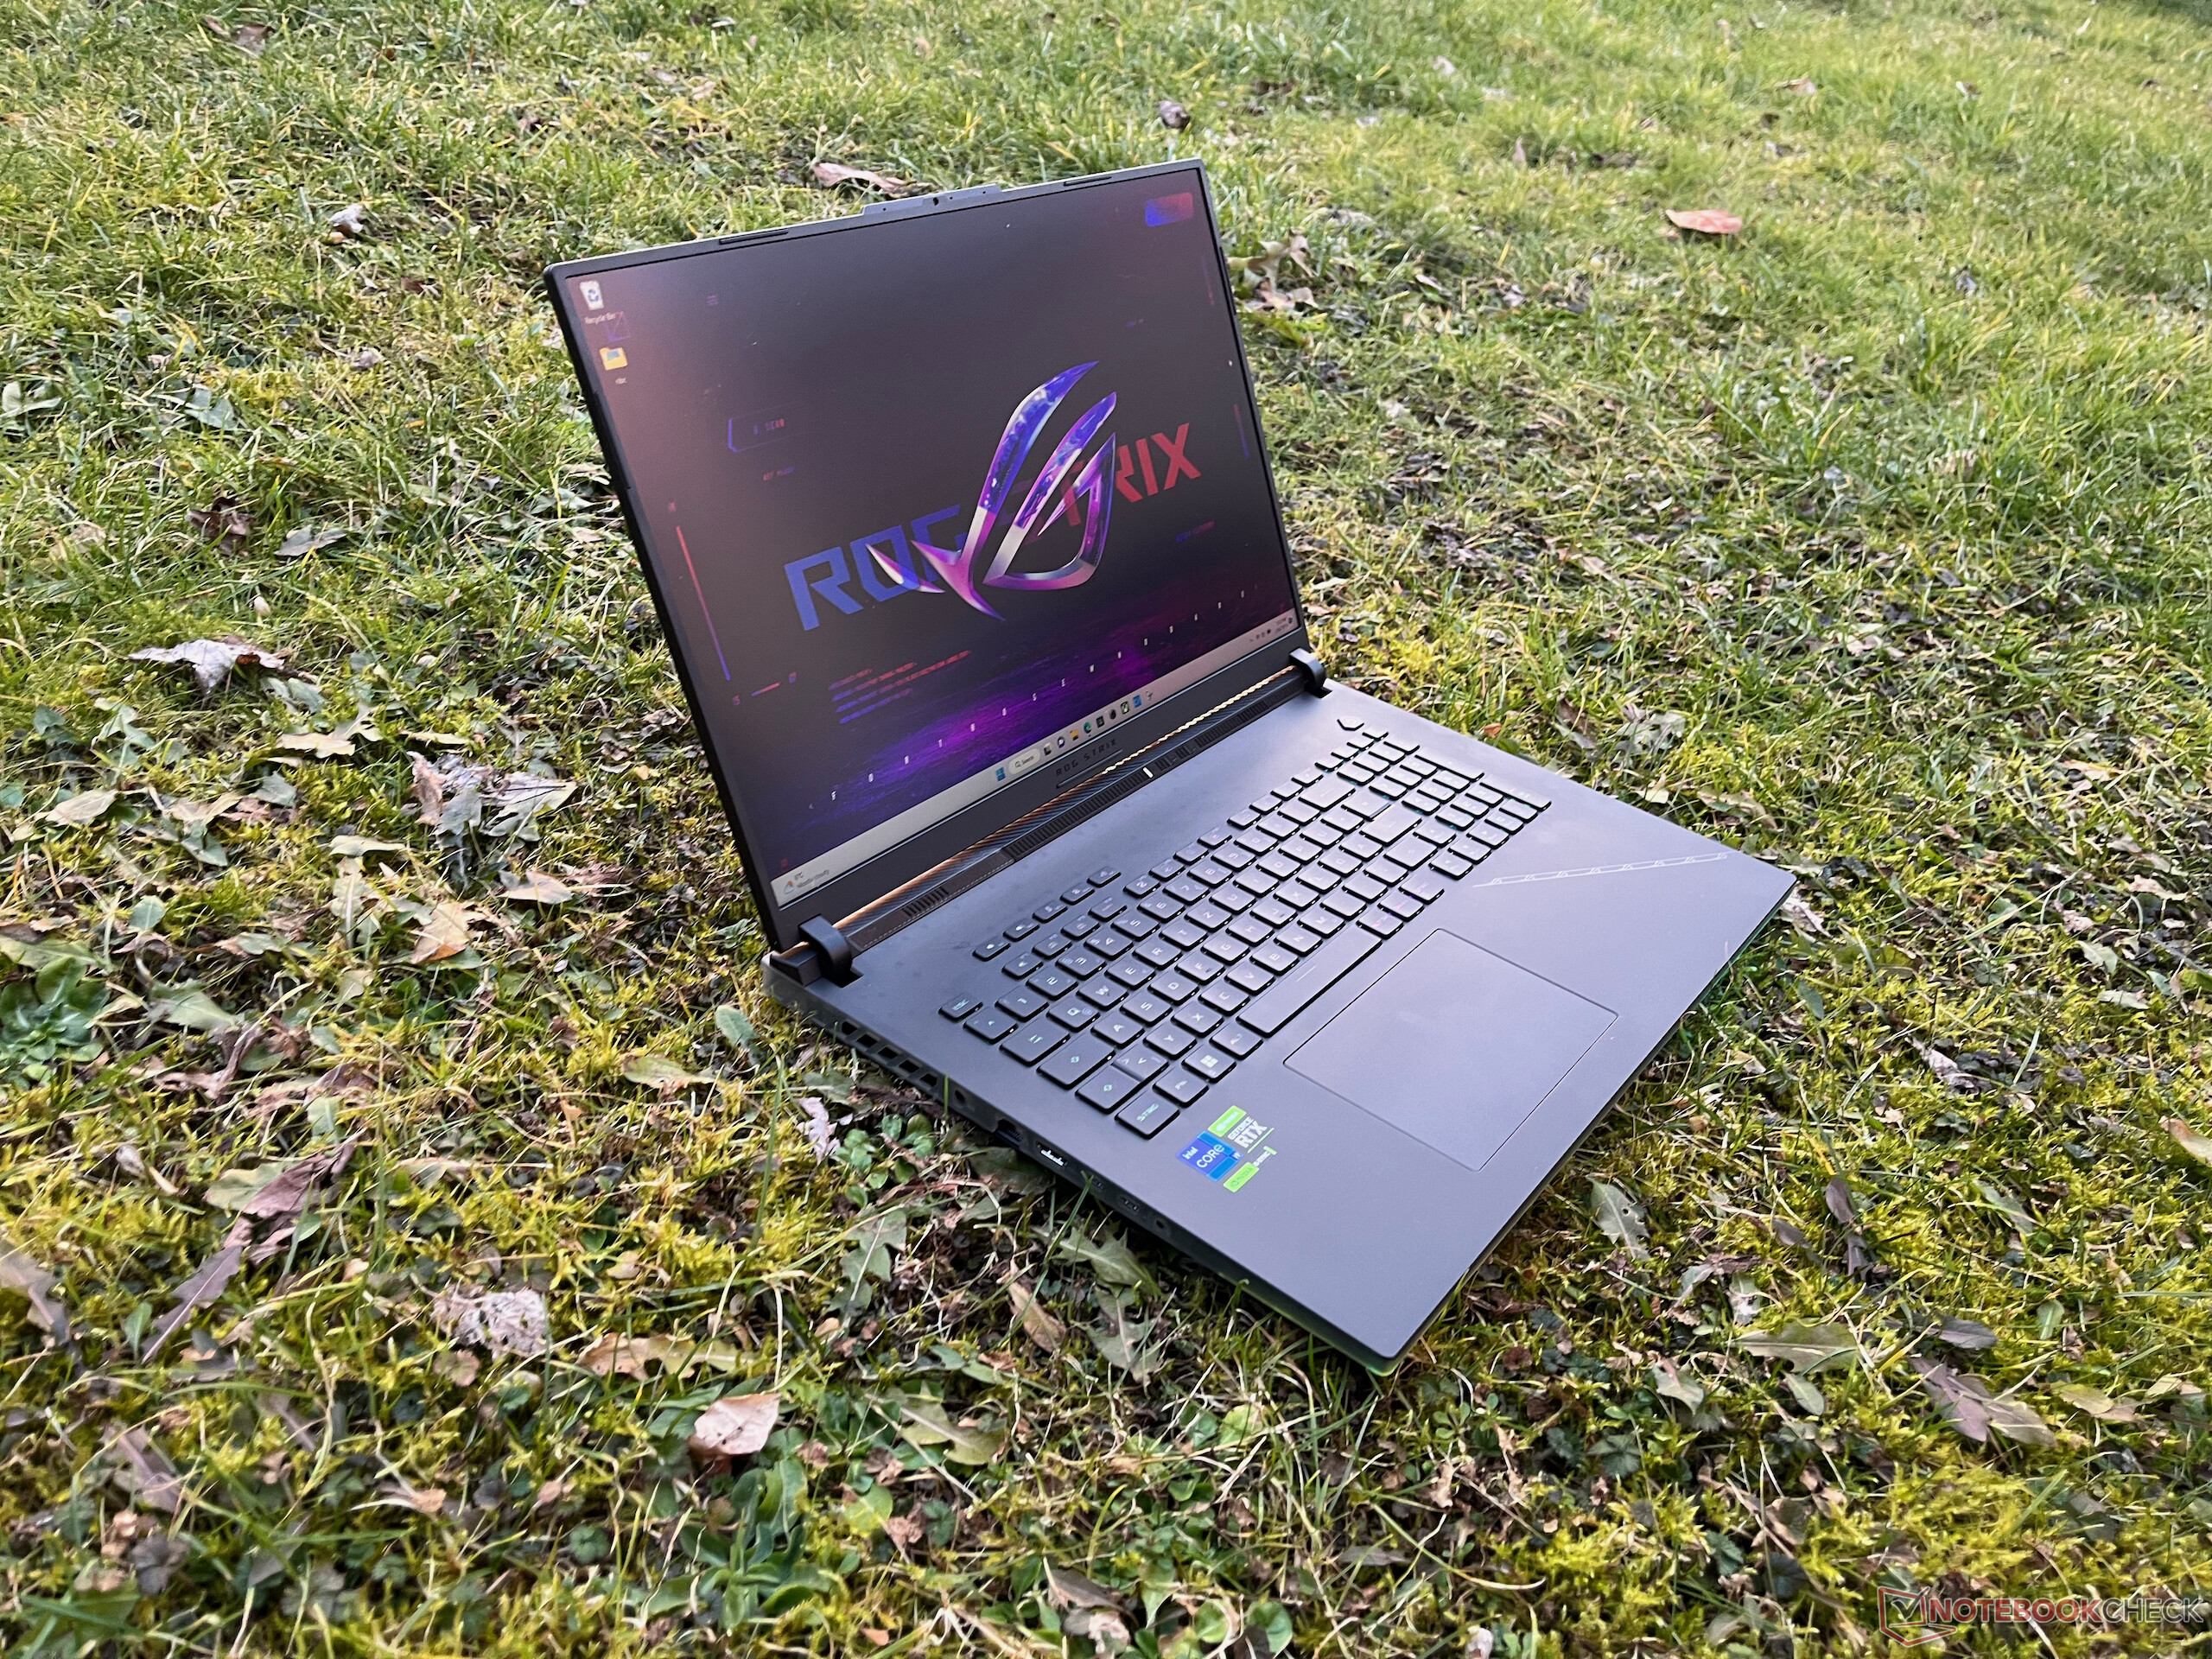
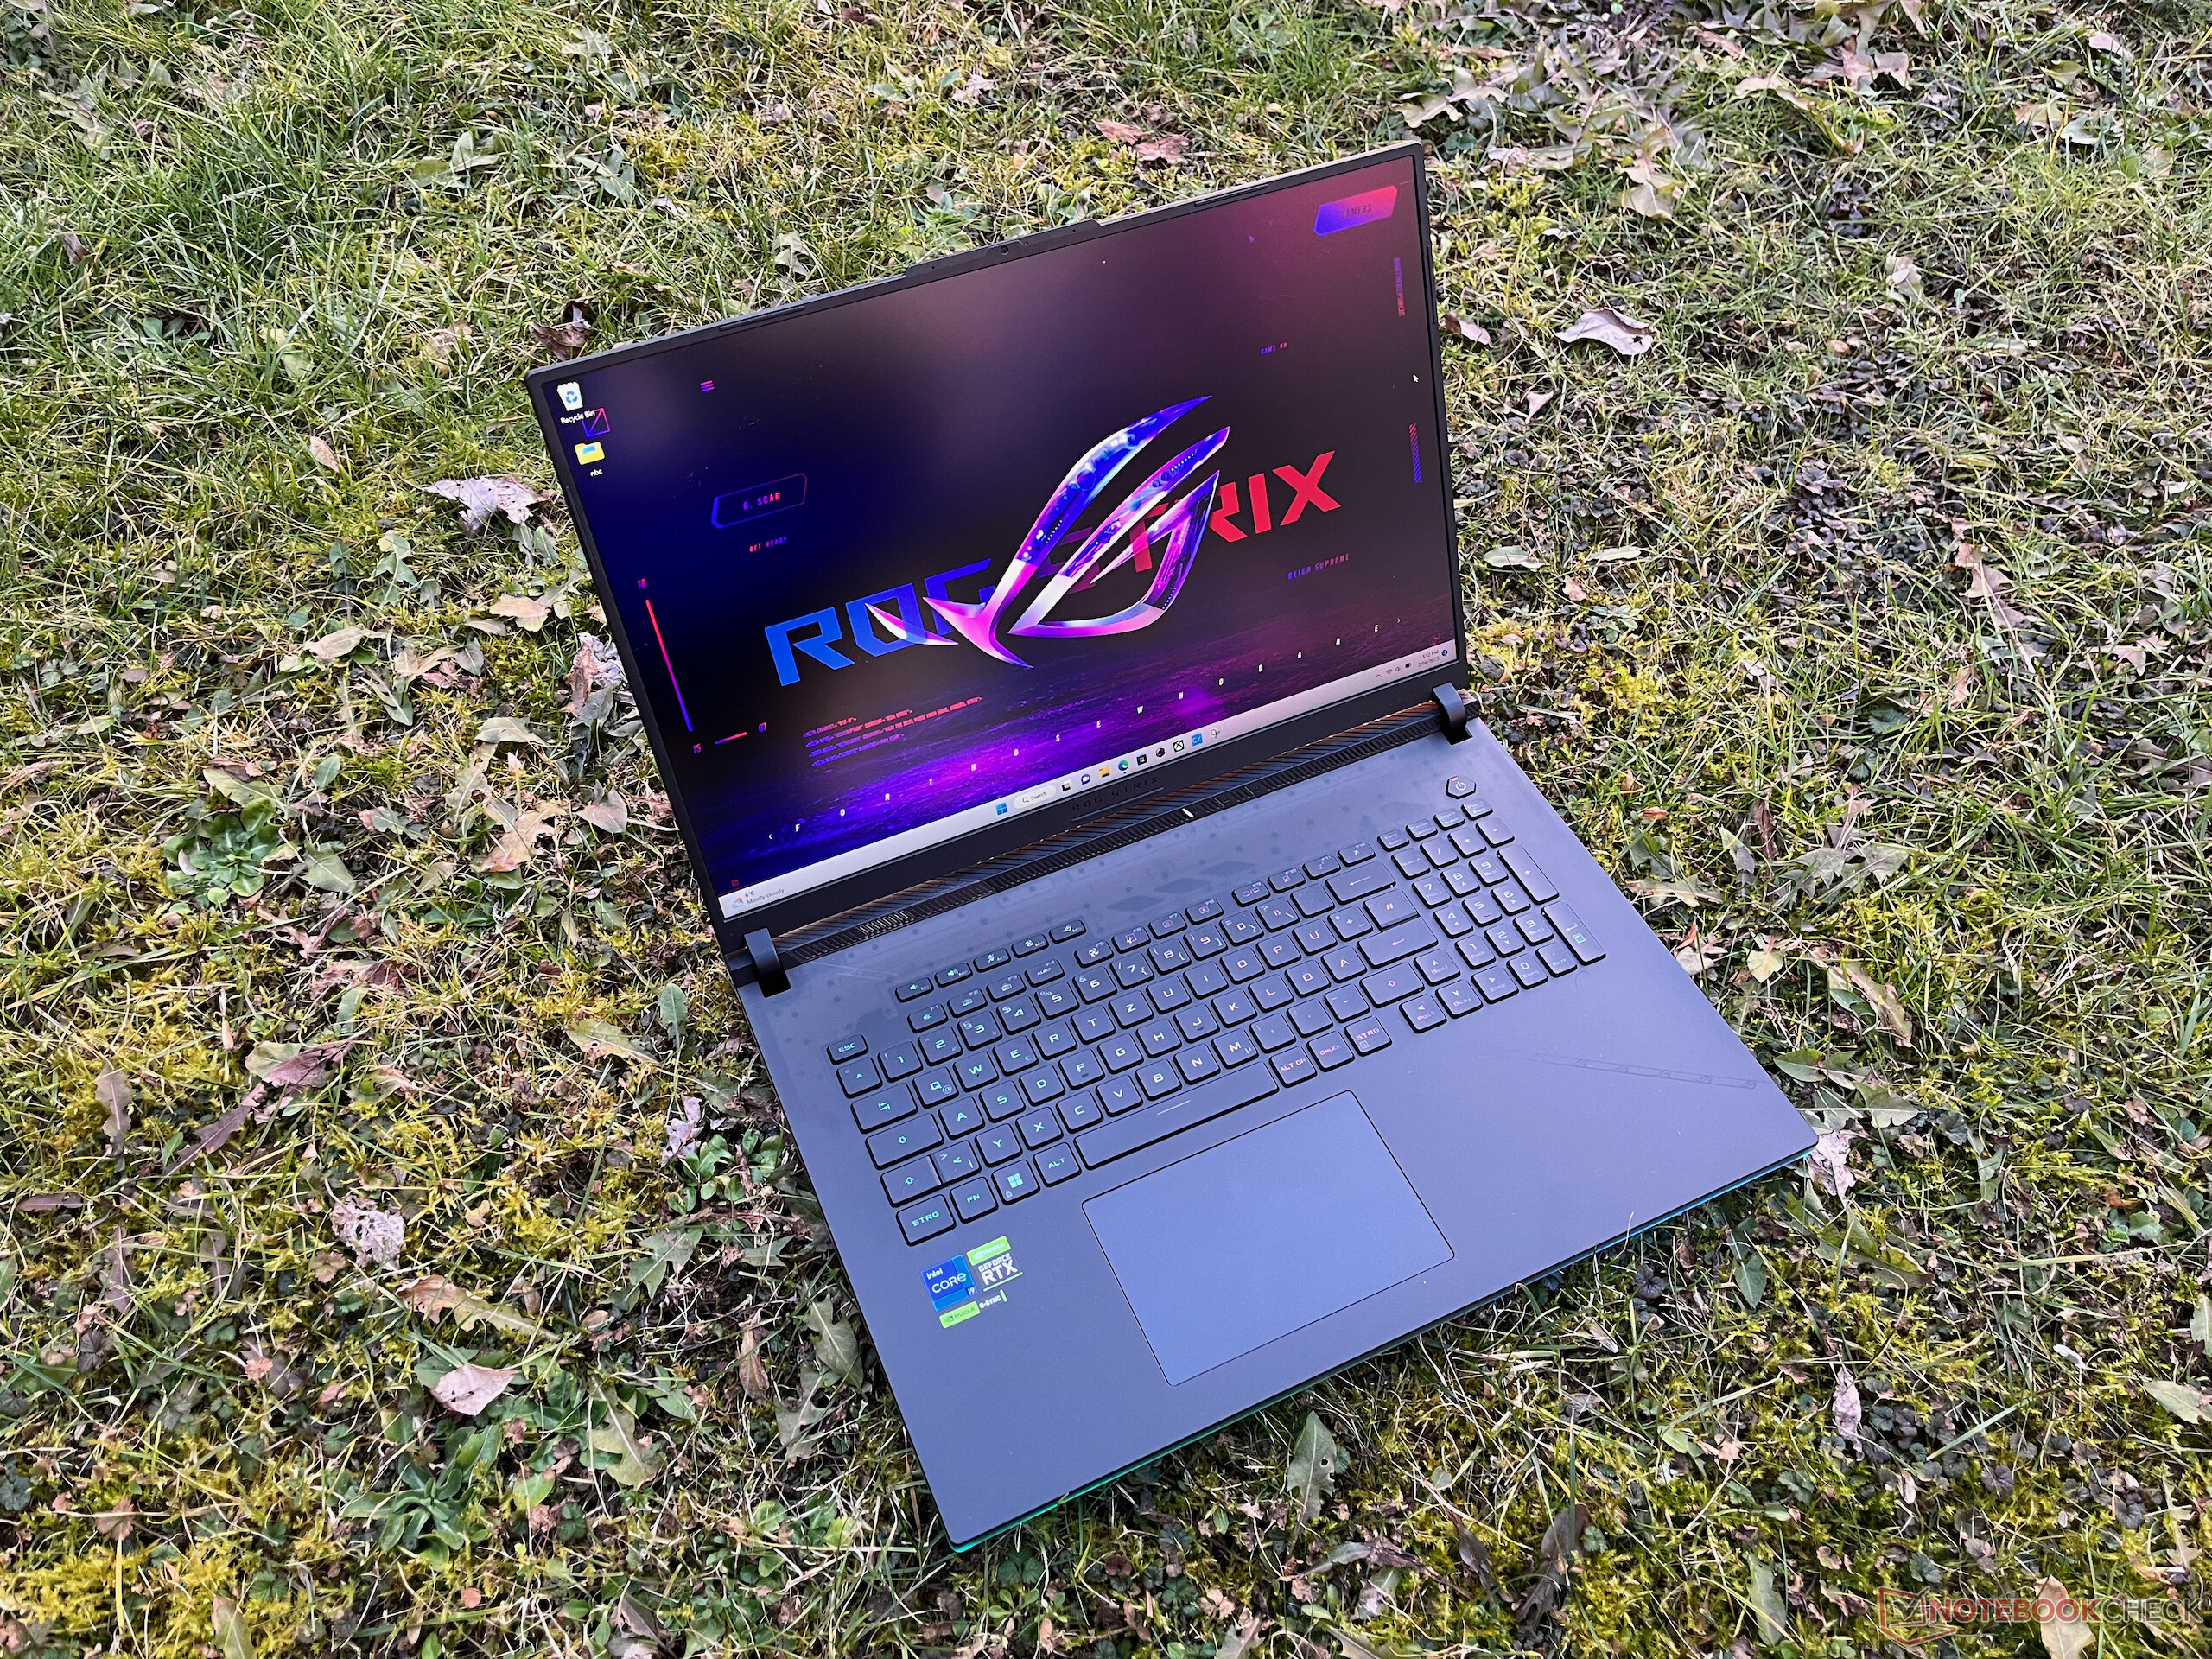
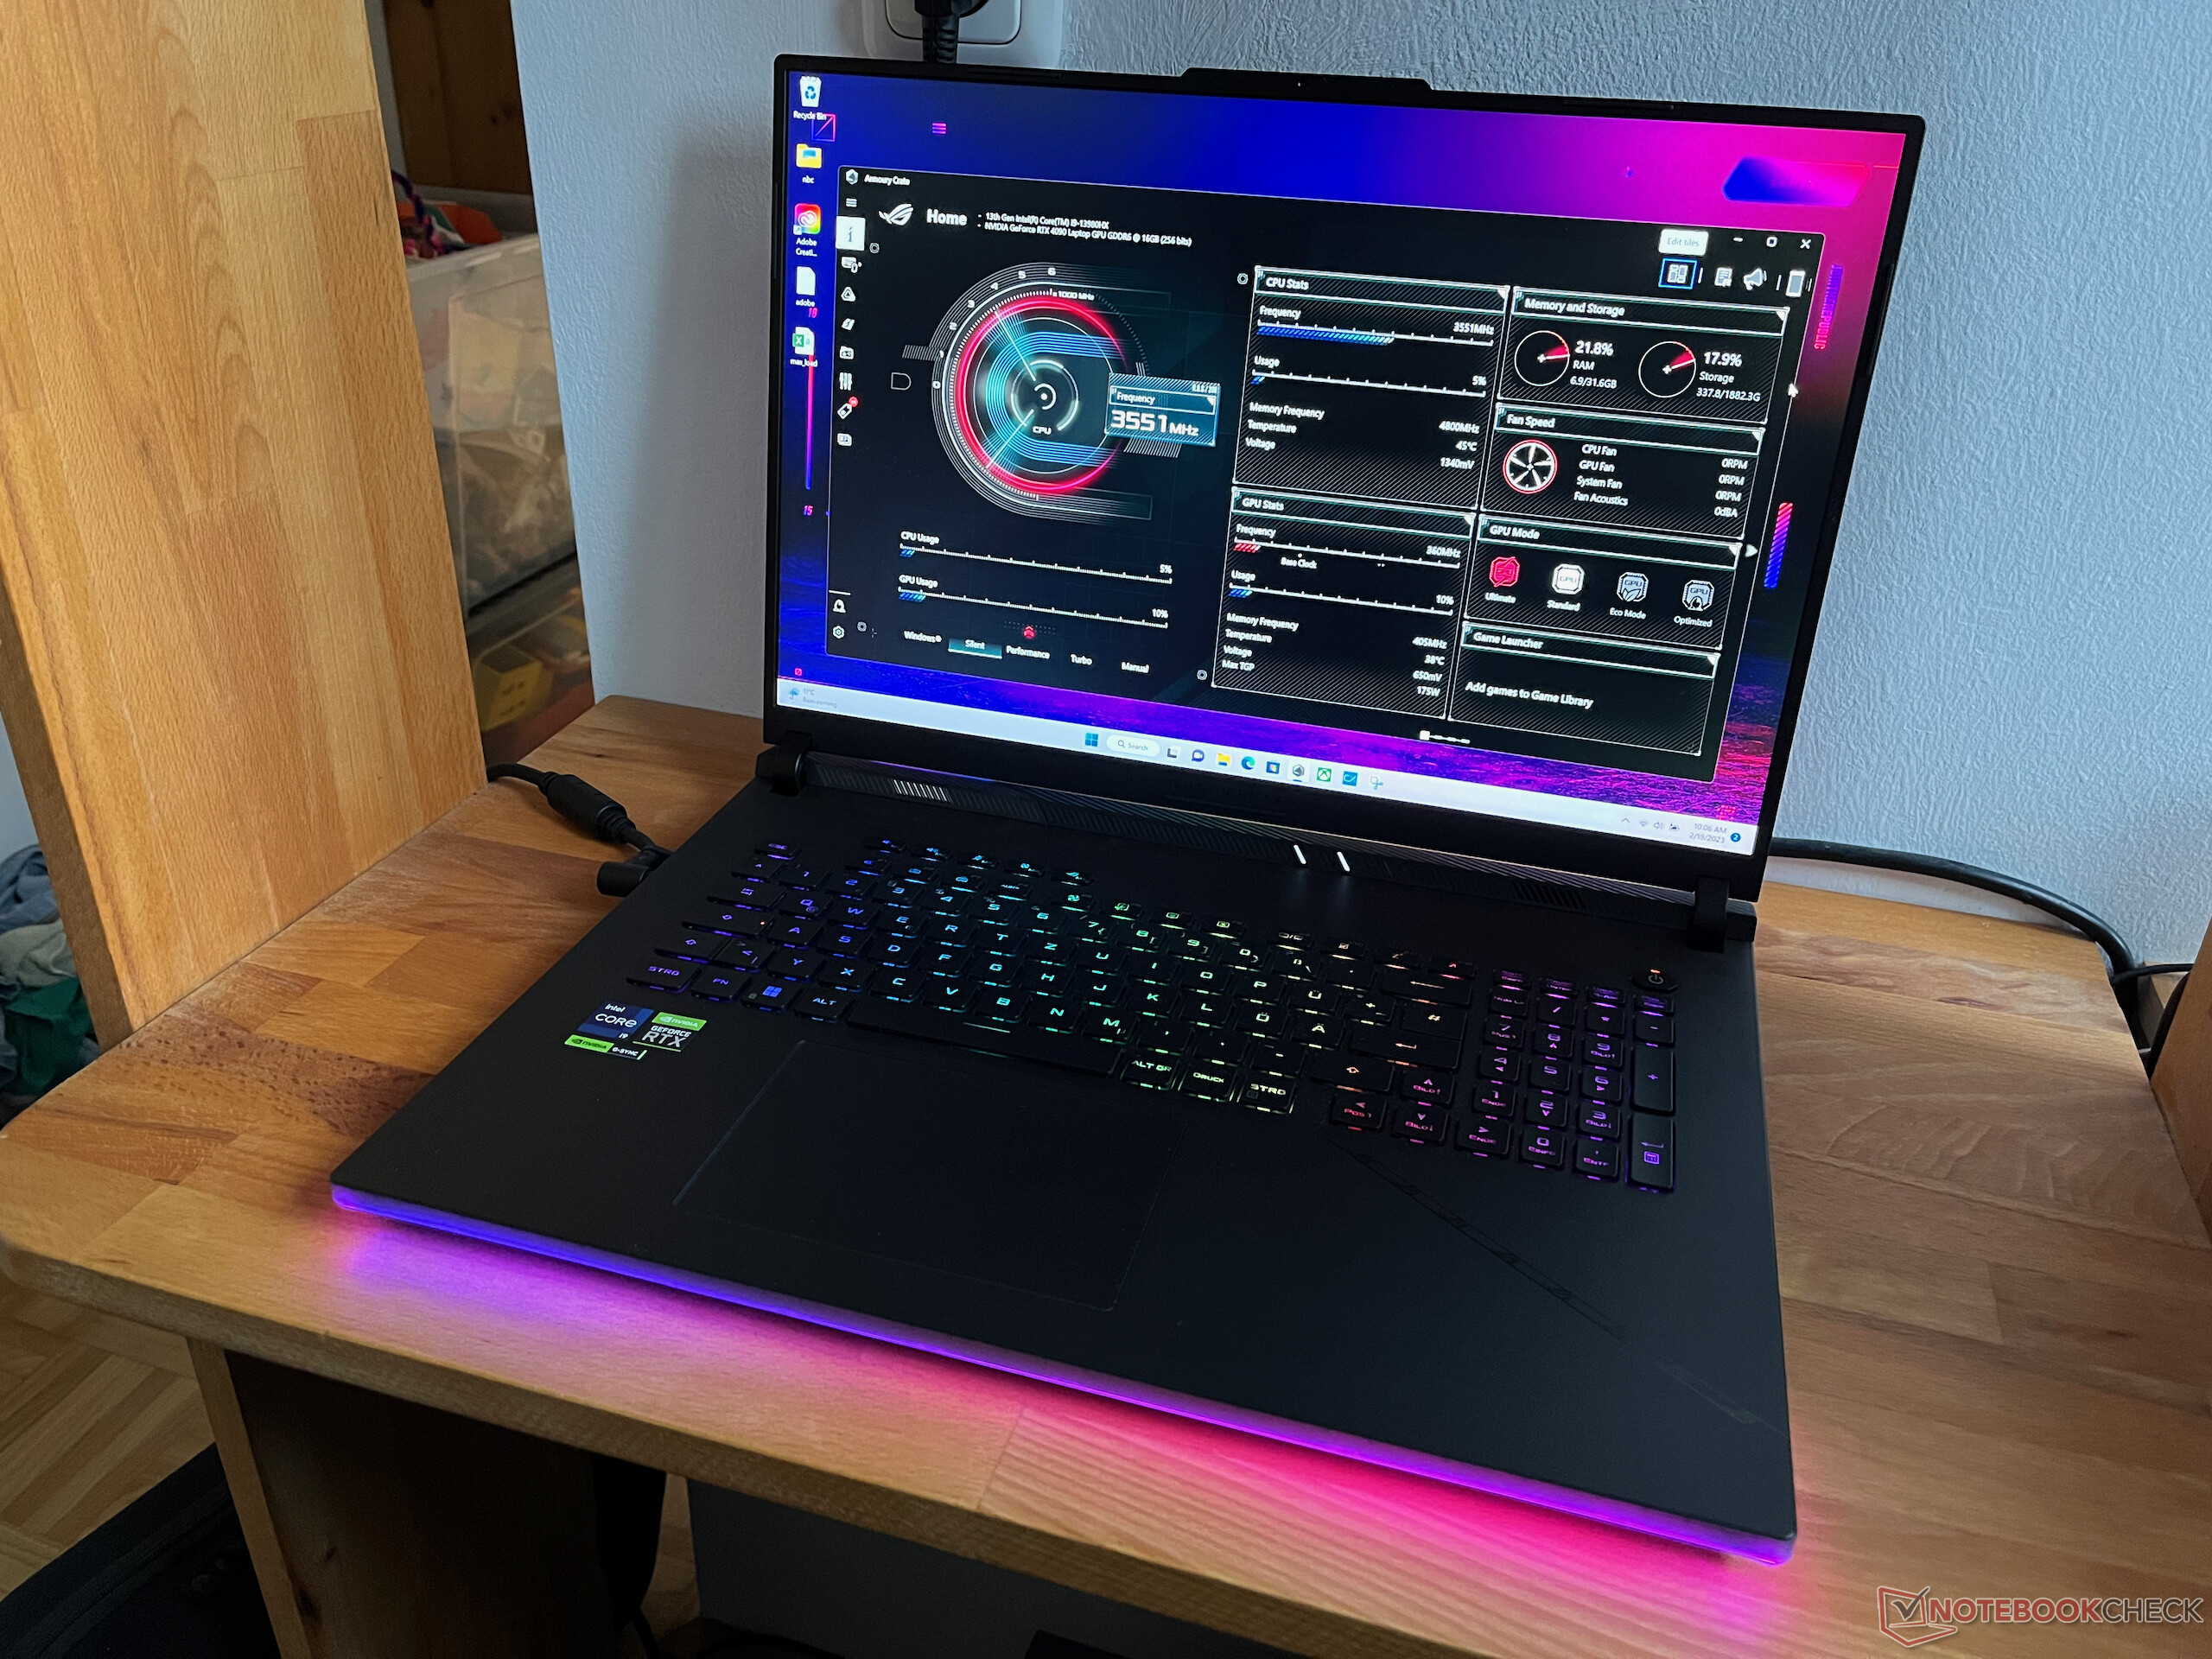
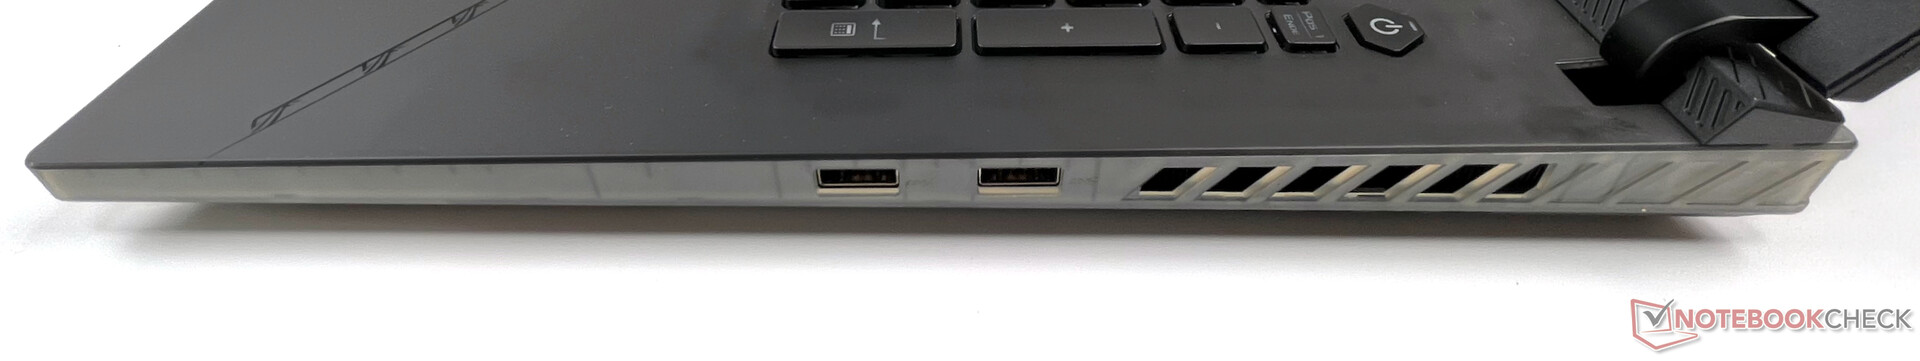
Asus ROG Strix Scar 18 2023 G834JY rövid értékelés - Gamer laptop RTX 4090-nel
Possible Competitors in Comparison
Értékelés | Dátum | Modell | Súly | Magasság | Méret | Felbontás | Legjobb ár |
|---|---|---|---|---|---|---|---|
| 86.6 % v7 (old) | 03/2023 | Asus ROG Strix Scar 18 2023 G834JY-N6005W i9-13980HX, GeForce RTX 4090 Laptop GPU | 3.1 kg | 30.8 mm | 18.00" | 2560x1600 | |
| 89 % v7 (old) | 05/2023 | MSI Titan GT77 HX 13VI i9-13950HX, GeForce RTX 4090 Laptop GPU | 3.5 kg | 23 mm | 17.30" | 3840x2160 | |
| 89.4 % v7 (old) | 03/2023 | Lenovo Legion Pro 7 16IRX8H i9-13900HX, GeForce RTX 4080 Laptop GPU | 2.7 kg | 26 mm | 16.00" | 2560x1600 | |
| 91.2 % v7 (old) | 05/2023 | Razer Blade 16 Early 2023 i9-13950HX, GeForce RTX 4080 Laptop GPU | 2.4 kg | 21.99 mm | 16.00" | 2560x1600 | |
| 86.9 % v7 (old) | 01/2023 | Asus ROG Strix Scar 17 SE G733CX-LL014W i9-12950HX, GeForce RTX 3080 Ti Laptop GPU | 2.9 kg | 28.3 mm | 17.30" | 2560x1440 | |
| 88.3 % v7 (old) | 09/2022 | MSI Titan GT77 12UHS i9-12900HX, GeForce RTX 3080 Ti Laptop GPU | 3.3 kg | 23 mm | 17.30" | 1920x1080 | |
| 85.4 % v7 (old) | 05/2023 | HP Omen 17-ck2097ng i9-13900HX, GeForce RTX 4080 Laptop GPU | 2.8 kg | 27 mm | 17.30" | 2560x1440 |


")
")
| |||||||||||||||||||||||||
Fényerő megoszlás: 86 %
Centrumban: 490 cd/m²
Kontraszt: 907:1 (Fekete: 0.54 cd/m²)
ΔE ColorChecker Calman: 4.97 | ∀{0.5-29.43 Ø4.73}
calibrated: 2.97
ΔE Greyscale Calman: 7.2 | ∀{0.09-98 Ø4.97}
100% sRGB (Calman 2D)
84.9% AdobeRGB 1998 (Argyll 3D)
99.9% sRGB (Argyll 3D)
97.2% Display P3 (Argyll 3D)
Gamma: 2.161
CCT: 6515 K
| Asus ROG Strix Scar 18 2023 G834JY-N6005W NE180QDM-NZ2, IPS, 2560x1600, 18" | Razer Blade 18 RTX 4070 AU Optronics B180QAN01.0, IPS, 2560x1600, 18" | MSI Titan GT77 HX 13VI B173ZAN06.C, Mini-LED, 3840x2160, 17.3" | Asus ROG Strix Scar 17 SE G733CX-LL014W NE173QHM-NZ2, IPS, 2560x1440, 17.3" | |
|---|---|---|---|---|
| Display | 0% | 2% | 0% | |
| Display P3 Coverage (%) | 97.2 | 96.9 0% | 94.9 -2% | 97.1 0% |
| sRGB Coverage (%) | 99.9 | 99.8 0% | 99.9 0% | 99.9 0% |
| AdobeRGB 1998 Coverage (%) | 84.9 | 85.3 0% | 92.4 9% | 84.8 0% |
| Response Times | 15% | -410% | -11% | |
| Response Time Grey 50% / Grey 80% * (ms) | 5.41 ? | 4.2 ? 22% | 38.4 ? -610% | 5.7 ? -5% |
| Response Time Black / White * (ms) | 8.62 ? | 8 ? 7% | 26.6 ? -209% | 10.1 ? -17% |
| PWM Frequency (Hz) | 2380 ? | |||
| Screen | 22% | 74253% | 29% | |
| Brightness middle (cd/m²) | 490 | 549.6 12% | 606 24% | 320 -35% |
| Brightness (cd/m²) | 468 | 524 12% | 602 29% | 303 -35% |
| Brightness Distribution (%) | 86 | 89 3% | 93 8% | 87 1% |
| Black Level * (cd/m²) | 0.54 | 0.53 2% | 0.0001 100% | 0.3 44% |
| Contrast (:1) | 907 | 1037 14% | 6060000 668037% | 1067 18% |
| Colorchecker dE 2000 * | 4.97 | 3.32 33% | 4.8 3% | 1.1 78% |
| Colorchecker dE 2000 max. * | 11.02 | 6.63 40% | 8.2 26% | 2.7 75% |
| Colorchecker dE 2000 calibrated * | 2.97 | 2.7 9% | 1.8 39% | |
| Greyscale dE 2000 * | 7.2 | 2 72% | 6.5 10% | 1.1 85% |
| Gamma | 2.161 102% | 2.29 96% | 2.63 84% | 2.13 103% |
| CCT | 6515 100% | 6319 103% | 6596 99% | 6599 98% |
| Teljes átlag (program / beállítások) | 12% /
16% | 24615% /
47676% | 6% /
16% |
* ... a kisebb jobb
Megjelenítési válaszidők
| ↔ Válaszidő Fekete-fehér | ||
|---|---|---|
| 8.62 ms ... emelkedés és süllyedés ↘ kombinálva | ↗ 3.68 ms emelkedés | 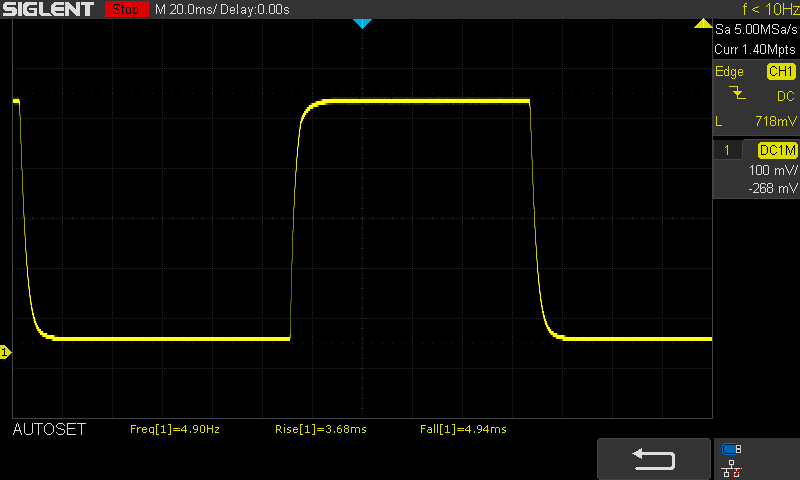 |
| ↘ 4.94 ms ősz | ||
| A képernyő gyors reakciósebességet mutat tesztjeinkben, és játékra is alkalmasnak kell lennie. Összehasonlításképpen, az összes tesztelt eszköz 0.1 (minimum) és 240 (maximum) ms között mozog. » 24 % of all devices are better. Ez azt jelenti, hogy a mért válaszidő jobb, mint az összes vizsgált eszköz átlaga (19.9 ms). | ||
| ↔ Válaszidő 50% szürke és 80% szürke között | ||
| 5.41 ms ... emelkedés és süllyedés ↘ kombinálva | ↗ 2.57 ms emelkedés | 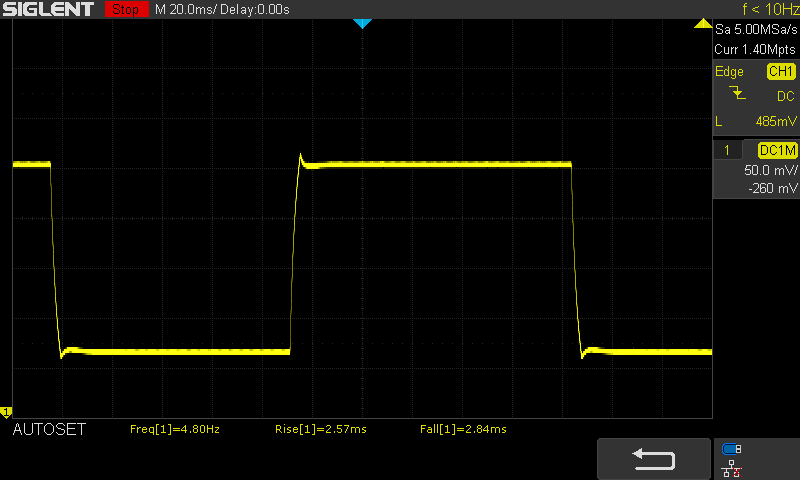 |
| ↘ 2.84 ms ősz | ||
| A képernyő tesztjeinkben nagyon gyors reakciósebességet mutatott, és nagyon jól használható gyors tempójú játékokhoz. Összehasonlításképpen, az összes tesztelt eszköz 0.165 (minimum) és 636 (maximum) ms között mozog. » 18 % of all devices are better. Ez azt jelenti, hogy a mért válaszidő jobb, mint az összes vizsgált eszköz átlaga (31.1 ms). | ||
Képernyő villogása / PWM (impulzusszélesség-moduláció)
| Képernyő villogása / PWM nem érzékelhető | 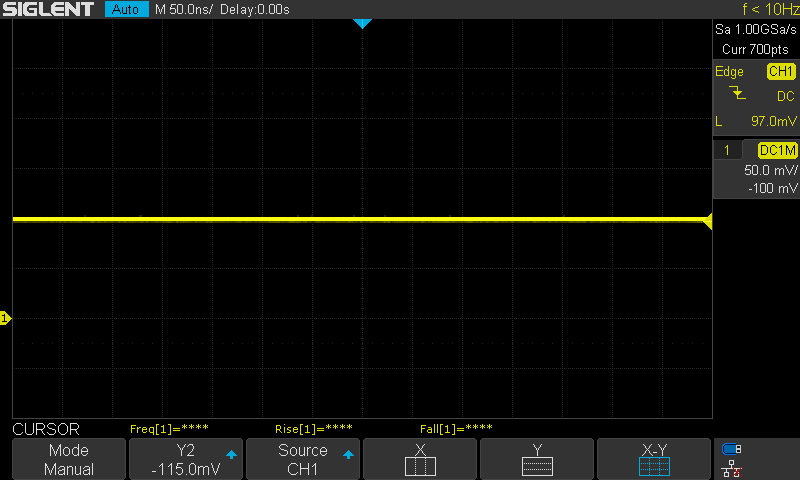 | ||
Összehasonlításképpen: az összes tesztelt eszköz 52 %-a nem használja a PWM-et a kijelző elsötétítésére. Ha PWM-et észleltek, akkor átlagosan 7798 (minimum: 5 - maximum: 343500) Hz-t mértek. | |||
Cinebench R15 Multi Constant Load Test
Cinebench R23: Multi Core | Single Core
Cinebench R20: CPU (Multi Core) | CPU (Single Core)
Cinebench R15: CPU Multi 64Bit | CPU Single 64Bit
Blender: v2.79 BMW27 CPU
7-Zip 18.03: 7z b 4 | 7z b 4 -mmt1
Geekbench 5.5: Multi-Core | Single-Core
HWBOT x265 Benchmark v2.2: 4k Preset
LibreOffice : 20 Documents To PDF
R Benchmark 2.5: Overall mean
| CPU Performance rating | |
| Intel Core i9-13900K @253W | |
| Intel NUC13 Raptor Canyon | |
| Asus ROG Strix Scar 18 2023 G834JY-N6005W | |
| MSI Titan GT77 HX 13VI | |
| Lenovo Legion Pro 7 16IRX8H | |
| Átlagos Intel Core i9-13980HX | |
| Razer Blade 18 RTX 4070 | |
| Schenker XMG Neo 16 Raptor Lake | |
| Asus ROG Strix Scar 18 2023 G834JY-N6005W | |
| Razer Blade 16 Early 2023 | |
| Az osztály átlaga Gaming | |
| MSI Raider GE77 HX 12UHS | |
| Asus ROG Strix Scar 17 SE G733CX-LL014W | |
| Dell Precision 7000 7670 Performance | |
| Cinebench R23 / Multi Core | |
| Intel Core i9-13900K @253W | |
| MSI Titan GT77 HX 13VI | |
| Intel NUC13 Raptor Canyon | |
| Asus ROG Strix Scar 18 2023 G834JY-N6005W | |
| Átlagos Intel Core i9-13980HX (28301 - 33052, n=11) | |
| Lenovo Legion Pro 7 16IRX8H | |
| Schenker XMG Neo 16 Raptor Lake | |
| Schenker XMG Neo 16 Raptor Lake | |
| Schenker XMG Neo 16 Raptor Lake | |
| Razer Blade 18 RTX 4070 | |
| Asus ROG Strix Scar 18 2023 G834JY-N6005W | |
| Razer Blade 16 Early 2023 | |
| Az osztály átlaga Gaming (10488 - 40970, n=113, az elmúlt 2 évben) | |
| MSI Raider GE77 HX 12UHS | |
| Asus ROG Strix Scar 17 SE G733CX-LL014W | |
| Dell Precision 7000 7670 Performance | |
| Cinebench R23 / Single Core | |
| Intel Core i9-13900K @253W | |
| Intel NUC13 Raptor Canyon | |
| Asus ROG Strix Scar 18 2023 G834JY-N6005W | |
| MSI Titan GT77 HX 13VI | |
| Asus ROG Strix Scar 18 2023 G834JY-N6005W | |
| Átlagos Intel Core i9-13980HX (1825 - 2169, n=9) | |
| Razer Blade 18 RTX 4070 | |
| Schenker XMG Neo 16 Raptor Lake | |
| Lenovo Legion Pro 7 16IRX8H | |
| Razer Blade 16 Early 2023 | |
| Az osztály átlaga Gaming (1166 - 2356, n=113, az elmúlt 2 évben) | |
| MSI Raider GE77 HX 12UHS | |
| Asus ROG Strix Scar 17 SE G733CX-LL014W | |
| Dell Precision 7000 7670 Performance | |
| Cinebench R20 / CPU (Multi Core) | |
| Intel Core i9-13900K @253W | |
| Intel NUC13 Raptor Canyon | |
| MSI Titan GT77 HX 13VI | |
| Asus ROG Strix Scar 18 2023 G834JY-N6005W | |
| Átlagos Intel Core i9-13980HX (10353 - 12437, n=10) | |
| Lenovo Legion Pro 7 16IRX8H | |
| Schenker XMG Neo 16 Raptor Lake | |
| Razer Blade 18 RTX 4070 | |
| Asus ROG Strix Scar 18 2023 G834JY-N6005W | |
| Az osztály átlaga Gaming (4029 - 16108, n=112, az elmúlt 2 évben) | |
| MSI Raider GE77 HX 12UHS | |
| Razer Blade 16 Early 2023 | |
| Asus ROG Strix Scar 17 SE G733CX-LL014W | |
| Dell Precision 7000 7670 Performance | |
| Cinebench R20 / CPU (Single Core) | |
| Intel Core i9-13900K @253W | |
| Intel NUC13 Raptor Canyon | |
| Asus ROG Strix Scar 18 2023 G834JY-N6005W | |
| MSI Titan GT77 HX 13VI | |
| Asus ROG Strix Scar 18 2023 G834JY-N6005W | |
| Razer Blade 18 RTX 4070 | |
| Átlagos Intel Core i9-13980HX (717 - 825, n=10) | |
| Lenovo Legion Pro 7 16IRX8H | |
| Az osztály átlaga Gaming (442 - 895, n=112, az elmúlt 2 évben) | |
| Schenker XMG Neo 16 Raptor Lake | |
| MSI Raider GE77 HX 12UHS | |
| Razer Blade 16 Early 2023 | |
| Asus ROG Strix Scar 17 SE G733CX-LL014W | |
| Dell Precision 7000 7670 Performance | |
| Cinebench R15 / CPU Multi 64Bit | |
| Intel Core i9-13900K @253W | |
| Intel NUC13 Raptor Canyon | |
| MSI Titan GT77 HX 13VI | |
| Schenker XMG Neo 16 Raptor Lake | |
| Schenker XMG Neo 16 Raptor Lake | |
| Lenovo Legion Pro 7 16IRX8H | |
| Asus ROG Strix Scar 18 2023 G834JY-N6005W | |
| Átlagos Intel Core i9-13980HX (4358 - 5172, n=11) | |
| Razer Blade 16 Early 2023 | |
| Razer Blade 18 RTX 4070 | |
| Asus ROG Strix Scar 18 2023 G834JY-N6005W | |
| Az osztály átlaga Gaming (1578 - 6271, n=113, az elmúlt 2 évben) | |
| MSI Raider GE77 HX 12UHS | |
| Asus ROG Strix Scar 17 SE G733CX-LL014W | |
| Dell Precision 7000 7670 Performance | |
| Cinebench R15 / CPU Single 64Bit | |
| Intel Core i9-13900K @253W | |
| Intel NUC13 Raptor Canyon | |
| Asus ROG Strix Scar 18 2023 G834JY-N6005W | |
| Asus ROG Strix Scar 18 2023 G834JY-N6005W | |
| Átlagos Intel Core i9-13980HX (289 - 312, n=11) | |
| Lenovo Legion Pro 7 16IRX8H | |
| MSI Titan GT77 HX 13VI | |
| Razer Blade 18 RTX 4070 | |
| Schenker XMG Neo 16 Raptor Lake | |
| Schenker XMG Neo 16 Raptor Lake | |
| Az osztály átlaga Gaming (188.8 - 343, n=112, az elmúlt 2 évben) | |
| MSI Raider GE77 HX 12UHS | |
| Asus ROG Strix Scar 17 SE G733CX-LL014W | |
| Razer Blade 16 Early 2023 | |
| Dell Precision 7000 7670 Performance | |
| Blender / v2.79 BMW27 CPU | |
| Dell Precision 7000 7670 Performance | |
| Asus ROG Strix Scar 17 SE G733CX-LL014W | |
| Az osztály átlaga Gaming (80 - 330, n=110, az elmúlt 2 évben) | |
| MSI Raider GE77 HX 12UHS | |
| Razer Blade 16 Early 2023 | |
| Asus ROG Strix Scar 18 2023 G834JY-N6005W | |
| Schenker XMG Neo 16 Raptor Lake | |
| Razer Blade 18 RTX 4070 | |
| Átlagos Intel Core i9-13980HX (97 - 136, n=10) | |
| Lenovo Legion Pro 7 16IRX8H | |
| Asus ROG Strix Scar 18 2023 G834JY-N6005W | |
| Intel NUC13 Raptor Canyon | |
| MSI Titan GT77 HX 13VI | |
| Intel Core i9-13900K @253W | |
| 7-Zip 18.03 / 7z b 4 | |
| Intel Core i9-13900K @253W | |
| MSI Titan GT77 HX 13VI | |
| Intel NUC13 Raptor Canyon | |
| Asus ROG Strix Scar 18 2023 G834JY-N6005W | |
| Lenovo Legion Pro 7 16IRX8H | |
| Schenker XMG Neo 16 Raptor Lake | |
| Átlagos Intel Core i9-13980HX (104616 - 129804, n=10) | |
| Razer Blade 18 RTX 4070 | |
| Asus ROG Strix Scar 18 2023 G834JY-N6005W | |
| Razer Blade 16 Early 2023 | |
| Az osztály átlaga Gaming (33491 - 148086, n=111, az elmúlt 2 évben) | |
| MSI Raider GE77 HX 12UHS | |
| Asus ROG Strix Scar 17 SE G733CX-LL014W | |
| Dell Precision 7000 7670 Performance | |
| 7-Zip 18.03 / 7z b 4 -mmt1 | |
| Intel Core i9-13900K @253W | |
| Intel NUC13 Raptor Canyon | |
| Asus ROG Strix Scar 18 2023 G834JY-N6005W | |
| Lenovo Legion Pro 7 16IRX8H | |
| Asus ROG Strix Scar 18 2023 G834JY-N6005W | |
| Átlagos Intel Core i9-13980HX (6230 - 7163, n=10) | |
| MSI Titan GT77 HX 13VI | |
| Razer Blade 18 RTX 4070 | |
| Schenker XMG Neo 16 Raptor Lake | |
| Razer Blade 16 Early 2023 | |
| Az osztály átlaga Gaming (4199 - 7436, n=111, az elmúlt 2 évben) | |
| MSI Raider GE77 HX 12UHS | |
| Asus ROG Strix Scar 17 SE G733CX-LL014W | |
| Dell Precision 7000 7670 Performance | |
| Geekbench 5.5 / Multi-Core | |
| Intel Core i9-13900K @253W | |
| Intel NUC13 Raptor Canyon | |
| Lenovo Legion Pro 7 16IRX8H | |
| Asus ROG Strix Scar 18 2023 G834JY-N6005W | |
| Schenker XMG Neo 16 Raptor Lake | |
| MSI Titan GT77 HX 13VI | |
| Átlagos Intel Core i9-13980HX (18475 - 22200, n=10) | |
| Razer Blade 18 RTX 4070 | |
| Asus ROG Strix Scar 18 2023 G834JY-N6005W | |
| Razer Blade 16 Early 2023 | |
| Az osztály átlaga Gaming (6460 - 27010, n=111, az elmúlt 2 évben) | |
| MSI Raider GE77 HX 12UHS | |
| Asus ROG Strix Scar 17 SE G733CX-LL014W | |
| Dell Precision 7000 7670 Performance | |
| Geekbench 5.5 / Single-Core | |
| Intel Core i9-13900K @253W | |
| Asus ROG Strix Scar 18 2023 G834JY-N6005W | |
| Intel NUC13 Raptor Canyon | |
| Asus ROG Strix Scar 18 2023 G834JY-N6005W | |
| Átlagos Intel Core i9-13980HX (1796 - 2139, n=10) | |
| MSI Titan GT77 HX 13VI | |
| Az osztály átlaga Gaming (986 - 2474, n=111, az elmúlt 2 évben) | |
| Razer Blade 18 RTX 4070 | |
| Lenovo Legion Pro 7 16IRX8H | |
| Schenker XMG Neo 16 Raptor Lake | |
| MSI Raider GE77 HX 12UHS | |
| Dell Precision 7000 7670 Performance | |
| Asus ROG Strix Scar 17 SE G733CX-LL014W | |
| Razer Blade 16 Early 2023 | |
| HWBOT x265 Benchmark v2.2 / 4k Preset | |
| Intel Core i9-13900K @253W | |
| Intel NUC13 Raptor Canyon | |
| Asus ROG Strix Scar 18 2023 G834JY-N6005W | |
| MSI Titan GT77 HX 13VI | |
| Lenovo Legion Pro 7 16IRX8H | |
| Átlagos Intel Core i9-13980HX (27 - 33.4, n=9) | |
| Razer Blade 18 RTX 4070 | |
| Schenker XMG Neo 16 Raptor Lake | |
| Asus ROG Strix Scar 18 2023 G834JY-N6005W | |
| Razer Blade 16 Early 2023 | |
| Az osztály átlaga Gaming (11.5 - 44.3, n=111, az elmúlt 2 évben) | |
| MSI Raider GE77 HX 12UHS | |
| Asus ROG Strix Scar 17 SE G733CX-LL014W | |
| Dell Precision 7000 7670 Performance | |
| LibreOffice / 20 Documents To PDF | |
| Az osztály átlaga Gaming (19 - 88.8, n=111, az elmúlt 2 évben) | |
| Razer Blade 16 Early 2023 | |
| MSI Titan GT77 HX 13VI | |
| Schenker XMG Neo 16 Raptor Lake | |
| Lenovo Legion Pro 7 16IRX8H | |
| Dell Precision 7000 7670 Performance | |
| Razer Blade 18 RTX 4070 | |
| Átlagos Intel Core i9-13980HX (35 - 51.4, n=10) | |
| MSI Raider GE77 HX 12UHS | |
| Intel NUC13 Raptor Canyon | |
| Asus ROG Strix Scar 18 2023 G834JY-N6005W | |
| Asus ROG Strix Scar 18 2023 G834JY-N6005W | |
| Asus ROG Strix Scar 17 SE G733CX-LL014W | |
| Intel Core i9-13900K @253W | |
| R Benchmark 2.5 / Overall mean | |
| Dell Precision 7000 7670 Performance | |
| Az osztály átlaga Gaming (0.3439 - 0.759, n=112, az elmúlt 2 évben) | |
| Asus ROG Strix Scar 17 SE G733CX-LL014W | |
| MSI Raider GE77 HX 12UHS | |
| Razer Blade 16 Early 2023 | |
| MSI Titan GT77 HX 13VI | |
| Lenovo Legion Pro 7 16IRX8H | |
| Átlagos Intel Core i9-13980HX (0.3793 - 0.4462, n=10) | |
| Razer Blade 18 RTX 4070 | |
| Asus ROG Strix Scar 18 2023 G834JY-N6005W | |
| Intel NUC13 Raptor Canyon | |
| Schenker XMG Neo 16 Raptor Lake | |
| Asus ROG Strix Scar 18 2023 G834JY-N6005W | |
| Intel Core i9-13900K @253W | |
Cinebench R23: Multi Core | Single Core
Cinebench R20: CPU (Multi Core) | CPU (Single Core)
Cinebench R15: CPU Multi 64Bit | CPU Single 64Bit
Blender: v2.79 BMW27 CPU
7-Zip 18.03: 7z b 4 | 7z b 4 -mmt1
Geekbench 5.5: Multi-Core | Single-Core
HWBOT x265 Benchmark v2.2: 4k Preset
LibreOffice : 20 Documents To PDF
R Benchmark 2.5: Overall mean
* ... a kisebb jobb
AIDA64: FP32 Ray-Trace | FPU Julia | CPU SHA3 | CPU Queen | FPU SinJulia | FPU Mandel | CPU AES | CPU ZLib | FP64 Ray-Trace | CPU PhotoWorxx
| Performance rating | |
| Intel Core i9-13900K @253W | |
| Intel NUC13 Raptor Canyon | |
| Asus ROG Strix Scar 18 2023 G834JY-N6005W | |
| MSI Titan GT77 HX 13VI | |
| Lenovo Legion Pro 7 16IRX8H | |
| Átlagos Intel Core i9-13980HX | |
| Schenker XMG Neo 16 Raptor Lake | |
| Razer Blade 18 RTX 4070 | |
| Asus ROG Strix Scar 18 2023 G834JY-N6005W | |
| Az osztály átlaga Gaming | |
| Razer Blade 16 Early 2023 | |
| MSI Raider GE77 HX 12UHS | |
| Asus ROG Strix Scar 17 SE G733CX-LL014W | |
| Dell Precision 7000 7670 Performance | |
| AIDA64 / FP32 Ray-Trace | |
| Intel Core i9-13900K @253W | |
| Az osztály átlaga Gaming (10227 - 85542, n=110, az elmúlt 2 évben) | |
| MSI Titan GT77 HX 13VI | |
| Asus ROG Strix Scar 18 2023 G834JY-N6005W | |
| Intel NUC13 Raptor Canyon | |
| Schenker XMG Neo 16 Raptor Lake | |
| Lenovo Legion Pro 7 16IRX8H | |
| Átlagos Intel Core i9-13980HX (21332 - 29553, n=9) | |
| Razer Blade 18 RTX 4070 | |
| Razer Blade 16 Early 2023 | |
| Razer Blade 16 Early 2023 | |
| Razer Blade 16 Early 2023 | |
| Asus ROG Strix Scar 18 2023 G834JY-N6005W | |
| MSI Raider GE77 HX 12UHS | |
| Asus ROG Strix Scar 17 SE G733CX-LL014W | |
| Dell Precision 7000 7670 Performance | |
| AIDA64 / FPU Julia | |
| Intel Core i9-13900K @253W | |
| MSI Titan GT77 HX 13VI | |
| Intel NUC13 Raptor Canyon | |
| Asus ROG Strix Scar 18 2023 G834JY-N6005W | |
| Az osztály átlaga Gaming (51376 - 238426, n=110, az elmúlt 2 évben) | |
| Lenovo Legion Pro 7 16IRX8H | |
| Átlagos Intel Core i9-13980HX (108001 - 148168, n=9) | |
| Razer Blade 18 RTX 4070 | |
| Schenker XMG Neo 16 Raptor Lake | |
| Asus ROG Strix Scar 18 2023 G834JY-N6005W | |
| Razer Blade 16 Early 2023 | |
| Razer Blade 16 Early 2023 | |
| Razer Blade 16 Early 2023 | |
| MSI Raider GE77 HX 12UHS | |
| Asus ROG Strix Scar 17 SE G733CX-LL014W | |
| Dell Precision 7000 7670 Performance | |
| AIDA64 / CPU SHA3 | |
| Intel Core i9-13900K @253W | |
| MSI Titan GT77 HX 13VI | |
| Asus ROG Strix Scar 18 2023 G834JY-N6005W | |
| Intel NUC13 Raptor Canyon | |
| Lenovo Legion Pro 7 16IRX8H | |
| Schenker XMG Neo 16 Raptor Lake | |
| Átlagos Intel Core i9-13980HX (5264 - 7142, n=9) | |
| Razer Blade 16 Early 2023 | |
| Razer Blade 16 Early 2023 | |
| Razer Blade 16 Early 2023 | |
| Razer Blade 18 RTX 4070 | |
| Asus ROG Strix Scar 18 2023 G834JY-N6005W | |
| Az osztály átlaga Gaming (2180 - 9817, n=110, az elmúlt 2 évben) | |
| MSI Raider GE77 HX 12UHS | |
| Asus ROG Strix Scar 17 SE G733CX-LL014W | |
| Dell Precision 7000 7670 Performance | |
| AIDA64 / CPU Queen | |
| Intel Core i9-13900K @253W | |
| Intel NUC13 Raptor Canyon | |
| Asus ROG Strix Scar 18 2023 G834JY-N6005W | |
| Asus ROG Strix Scar 18 2023 G834JY-N6005W | |
| MSI Titan GT77 HX 13VI | |
| Átlagos Intel Core i9-13980HX (126758 - 143409, n=9) | |
| Razer Blade 18 RTX 4070 | |
| Schenker XMG Neo 16 Raptor Lake | |
| Razer Blade 16 Early 2023 | |
| Razer Blade 16 Early 2023 | |
| Lenovo Legion Pro 7 16IRX8H | |
| Az osztály átlaga Gaming (49785 - 173351, n=101, az elmúlt 2 évben) | |
| Asus ROG Strix Scar 17 SE G733CX-LL014W | |
| Dell Precision 7000 7670 Performance | |
| MSI Raider GE77 HX 12UHS | |
| AIDA64 / FPU SinJulia | |
| Intel Core i9-13900K @253W | |
| Intel NUC13 Raptor Canyon | |
| Asus ROG Strix Scar 18 2023 G834JY-N6005W | |
| MSI Titan GT77 HX 13VI | |
| Schenker XMG Neo 16 Raptor Lake | |
| Átlagos Intel Core i9-13980HX (13785 - 17117, n=9) | |
| Razer Blade 18 RTX 4070 | |
| Asus ROG Strix Scar 18 2023 G834JY-N6005W | |
| Razer Blade 16 Early 2023 | |
| Razer Blade 16 Early 2023 | |
| Razer Blade 16 Early 2023 | |
| Lenovo Legion Pro 7 16IRX8H | |
| Az osztály átlaga Gaming (4424 - 33636, n=110, az elmúlt 2 évben) | |
| MSI Raider GE77 HX 12UHS | |
| Asus ROG Strix Scar 17 SE G733CX-LL014W | |
| Dell Precision 7000 7670 Performance | |
| AIDA64 / FPU Mandel | |
| Intel Core i9-13900K @253W | |
| MSI Titan GT77 HX 13VI | |
| Asus ROG Strix Scar 18 2023 G834JY-N6005W | |
| Intel NUC13 Raptor Canyon | |
| Az osztály átlaga Gaming (25115 - 128721, n=110, az elmúlt 2 évben) | |
| Lenovo Legion Pro 7 16IRX8H | |
| Átlagos Intel Core i9-13980HX (53398 - 73758, n=9) | |
| Schenker XMG Neo 16 Raptor Lake | |
| Razer Blade 18 RTX 4070 | |
| Asus ROG Strix Scar 18 2023 G834JY-N6005W | |
| Razer Blade 16 Early 2023 | |
| Razer Blade 16 Early 2023 | |
| Razer Blade 16 Early 2023 | |
| MSI Raider GE77 HX 12UHS | |
| Asus ROG Strix Scar 17 SE G733CX-LL014W | |
| Dell Precision 7000 7670 Performance | |
| AIDA64 / CPU AES | |
| Intel Core i9-13900K @253W | |
| MSI Raider GE77 HX 12UHS | |
| Asus ROG Strix Scar 17 SE G733CX-LL014W | |
| Razer Blade 16 Early 2023 | |
| Razer Blade 16 Early 2023 | |
| Razer Blade 16 Early 2023 | |
| MSI Titan GT77 HX 13VI | |
| Asus ROG Strix Scar 18 2023 G834JY-N6005W | |
| Intel NUC13 Raptor Canyon | |
| Lenovo Legion Pro 7 16IRX8H | |
| Átlagos Intel Core i9-13980HX (105169 - 136520, n=9) | |
| Schenker XMG Neo 16 Raptor Lake | |
| Razer Blade 18 RTX 4070 | |
| Asus ROG Strix Scar 18 2023 G834JY-N6005W | |
| Az osztály átlaga Gaming (39258 - 247074, n=110, az elmúlt 2 évben) | |
| Dell Precision 7000 7670 Performance | |
| AIDA64 / CPU ZLib | |
| Intel Core i9-13900K @253W | |
| MSI Titan GT77 HX 13VI | |
| Asus ROG Strix Scar 18 2023 G834JY-N6005W | |
| Intel NUC13 Raptor Canyon | |
| Lenovo Legion Pro 7 16IRX8H | |
| Átlagos Intel Core i9-13980HX (1513 - 2039, n=9) | |
| Schenker XMG Neo 16 Raptor Lake | |
| Razer Blade 16 Early 2023 | |
| Razer Blade 16 Early 2023 | |
| Razer Blade 16 Early 2023 | |
| Razer Blade 18 RTX 4070 | |
| Asus ROG Strix Scar 18 2023 G834JY-N6005W | |
| Az osztály átlaga Gaming (574 - 2531, n=110, az elmúlt 2 évben) | |
| MSI Raider GE77 HX 12UHS | |
| Asus ROG Strix Scar 17 SE G733CX-LL014W | |
| Dell Precision 7000 7670 Performance | |
| AIDA64 / FP64 Ray-Trace | |
| Intel Core i9-13900K @253W | |
| Az osztály átlaga Gaming (5509 - 45446, n=110, az elmúlt 2 évben) | |
| MSI Titan GT77 HX 13VI | |
| Asus ROG Strix Scar 18 2023 G834JY-N6005W | |
| Intel NUC13 Raptor Canyon | |
| Lenovo Legion Pro 7 16IRX8H | |
| Átlagos Intel Core i9-13980HX (11431 - 16325, n=9) | |
| Schenker XMG Neo 16 Raptor Lake | |
| Razer Blade 18 RTX 4070 | |
| Razer Blade 16 Early 2023 | |
| Razer Blade 16 Early 2023 | |
| Razer Blade 16 Early 2023 | |
| Asus ROG Strix Scar 18 2023 G834JY-N6005W | |
| MSI Raider GE77 HX 12UHS | |
| Asus ROG Strix Scar 17 SE G733CX-LL014W | |
| Dell Precision 7000 7670 Performance | |
| AIDA64 / CPU PhotoWorxx | |
| Razer Blade 16 Early 2023 | |
| Razer Blade 16 Early 2023 | |
| Razer Blade 16 Early 2023 | |
| Razer Blade 18 RTX 4070 | |
| Intel Core i9-13900K @253W | |
| Lenovo Legion Pro 7 16IRX8H | |
| MSI Raider GE77 HX 12UHS | |
| Átlagos Intel Core i9-13980HX (37069 - 52949, n=9) | |
| Intel NUC13 Raptor Canyon | |
| Schenker XMG Neo 16 Raptor Lake | |
| Az osztály átlaga Gaming (12271 - 89891, n=110, az elmúlt 2 évben) | |
| Asus ROG Strix Scar 18 2023 G834JY-N6005W | |
| Asus ROG Strix Scar 18 2023 G834JY-N6005W | |
| Dell Precision 7000 7670 Performance | |
| Asus ROG Strix Scar 17 SE G733CX-LL014W | |
| MSI Titan GT77 HX 13VI | |
AIDA64: FP32 Ray-Trace | FPU Julia | CPU SHA3 | CPU Queen | FPU SinJulia | FPU Mandel | CPU AES | CPU ZLib | FP64 Ray-Trace | CPU PhotoWorxx
CrossMark: Overall | Productivity | Creativity | Responsiveness
| PCMark 10 / Score | |
| Intel NUC13 Raptor Canyon | |
| MSI Titan GT77 HX 13VI | |
| Átlagos Intel Core i9-13980HX, NVIDIA GeForce RTX 4090 Laptop GPU (8650 - 9068, n=4) | |
| Asus ROG Strix Scar 18 2023 G834JY-N6005W | |
| Az osztály átlaga Gaming (5828 - 11574, n=96, az elmúlt 2 évben) | |
| Razer Blade 16 Early 2023 | |
| Lenovo Legion Pro 7 16IRX8H | |
| Razer Blade 18 RTX 4070 | |
| Asus ROG Strix Scar 17 SE G733CX-LL014W | |
| MSI Raider GE77 HX 12UHS | |
| Dell Precision 7000 7670 Performance | |
| PCMark 10 / Essentials | |
| MSI Titan GT77 HX 13VI | |
| Lenovo Legion Pro 7 16IRX8H | |
| Razer Blade 18 RTX 4070 | |
| Intel NUC13 Raptor Canyon | |
| Dell Precision 7000 7670 Performance | |
| Átlagos Intel Core i9-13980HX, NVIDIA GeForce RTX 4090 Laptop GPU (11215 - 11644, n=3) | |
| Razer Blade 16 Early 2023 | |
| Az osztály átlaga Gaming (8810 - 12600, n=100, az elmúlt 2 évben) | |
| Asus ROG Strix Scar 17 SE G733CX-LL014W | |
| MSI Raider GE77 HX 12UHS | |
| PCMark 10 / Productivity | |
| Intel NUC13 Raptor Canyon | |
| Lenovo Legion Pro 7 16IRX8H | |
| Az osztály átlaga Gaming (6845 - 18766, n=98, az elmúlt 2 évben) | |
| Átlagos Intel Core i9-13980HX, NVIDIA GeForce RTX 4090 Laptop GPU (10125 - 11067, n=3) | |
| Asus ROG Strix Scar 17 SE G733CX-LL014W | |
| MSI Titan GT77 HX 13VI | |
| MSI Raider GE77 HX 12UHS | |
| Razer Blade 18 RTX 4070 | |
| Razer Blade 16 Early 2023 | |
| Dell Precision 7000 7670 Performance | |
| PCMark 10 / Digital Content Creation | |
| MSI Titan GT77 HX 13VI | |
| Intel NUC13 Raptor Canyon | |
| Átlagos Intel Core i9-13980HX, NVIDIA GeForce RTX 4090 Laptop GPU (15052 - 16012, n=3) | |
| Razer Blade 16 Early 2023 | |
| Az osztály átlaga Gaming (7602 - 19657, n=98, az elmúlt 2 évben) | |
| Razer Blade 18 RTX 4070 | |
| Lenovo Legion Pro 7 16IRX8H | |
| Asus ROG Strix Scar 17 SE G733CX-LL014W | |
| MSI Raider GE77 HX 12UHS | |
| Dell Precision 7000 7670 Performance | |
| CrossMark / Overall | |
| Intel Core i9-13900K @253W | |
| Intel NUC13 Raptor Canyon | |
| MSI Raider GE77 HX 12UHS | |
| MSI Titan GT77 HX 13VI | |
| Razer Blade 18 RTX 4070 | |
| Asus ROG Strix Scar 17 SE G733CX-LL014W | |
| Asus ROG Strix Scar 18 2023 G834JY-N6005W | |
| Átlagos Intel Core i9-13980HX, NVIDIA GeForce RTX 4090 Laptop GPU (1935 - 2176, n=4) | |
| Asus ROG Strix Scar 18 2023 G834JY-N6005W | |
| Schenker XMG Neo 16 Raptor Lake | |
| Az osztály átlaga Gaming (1366 - 2409, n=98, az elmúlt 2 évben) | |
| Dell Precision 7000 7670 Performance | |
| Razer Blade 16 Early 2023 | |
| CrossMark / Productivity | |
| Intel Core i9-13900K @253W | |
| Intel NUC13 Raptor Canyon | |
| MSI Raider GE77 HX 12UHS | |
| MSI Titan GT77 HX 13VI | |
| Razer Blade 18 RTX 4070 | |
| Asus ROG Strix Scar 17 SE G733CX-LL014W | |
| Asus ROG Strix Scar 18 2023 G834JY-N6005W | |
| Átlagos Intel Core i9-13980HX, NVIDIA GeForce RTX 4090 Laptop GPU (1764 - 2005, n=4) | |
| Asus ROG Strix Scar 18 2023 G834JY-N6005W | |
| Az osztály átlaga Gaming (1386 - 2254, n=98, az elmúlt 2 évben) | |
| Schenker XMG Neo 16 Raptor Lake | |
| Dell Precision 7000 7670 Performance | |
| Razer Blade 16 Early 2023 | |
| CrossMark / Creativity | |
| Intel Core i9-13900K @253W | |
| Intel NUC13 Raptor Canyon | |
| Asus ROG Strix Scar 18 2023 G834JY-N6005W | |
| MSI Titan GT77 HX 13VI | |
| Átlagos Intel Core i9-13980HX, NVIDIA GeForce RTX 4090 Laptop GPU (2267 - 2469, n=4) | |
| Razer Blade 18 RTX 4070 | |
| Asus ROG Strix Scar 18 2023 G834JY-N6005W | |
| Schenker XMG Neo 16 Raptor Lake | |
| Asus ROG Strix Scar 17 SE G733CX-LL014W | |
| MSI Raider GE77 HX 12UHS | |
| Az osztály átlaga Gaming (1343 - 2729, n=98, az elmúlt 2 évben) | |
| Dell Precision 7000 7670 Performance | |
| Razer Blade 16 Early 2023 | |
| CrossMark / Responsiveness | |
| Intel Core i9-13900K @253W | |
| MSI Raider GE77 HX 12UHS | |
| Asus ROG Strix Scar 17 SE G733CX-LL014W | |
| Intel NUC13 Raptor Canyon | |
| Razer Blade 18 RTX 4070 | |
| MSI Titan GT77 HX 13VI | |
| Az osztály átlaga Gaming (1226 - 2334, n=98, az elmúlt 2 évben) | |
| Átlagos Intel Core i9-13980HX, NVIDIA GeForce RTX 4090 Laptop GPU (1556 - 1904, n=4) | |
| Asus ROG Strix Scar 18 2023 G834JY-N6005W | |
| Asus ROG Strix Scar 18 2023 G834JY-N6005W | |
| Schenker XMG Neo 16 Raptor Lake | |
| Dell Precision 7000 7670 Performance | |
| Razer Blade 16 Early 2023 | |
CrossMark: Overall | Productivity | Creativity | Responsiveness
| PCMark 10 Score | 8764 pontok | |
Segítség | ||
| AIDA64 / Memory Copy | |
| Razer Blade 16 Early 2023 | |
| Razer Blade 16 Early 2023 | |
| Razer Blade 16 Early 2023 | |
| Lenovo Legion Pro 7 16IRX8H | |
| Razer Blade 18 RTX 4070 | |
| Intel Core i9-13900K @253W | |
| Az osztály átlaga Gaming (21750 - 129946, n=110, az elmúlt 2 évben) | |
| Átlagos Intel Core i9-13980HX (62189 - 80776, n=9) | |
| MSI Raider GE77 HX 12UHS | |
| Intel NUC13 Raptor Canyon | |
| Asus ROG Strix Scar 18 2023 G834JY-N6005W | |
| Schenker XMG Neo 16 Raptor Lake | |
| Asus ROG Strix Scar 18 2023 G834JY-N6005W | |
| Dell Precision 7000 7670 Performance | |
| MSI Titan GT77 HX 13VI | |
| Asus ROG Strix Scar 17 SE G733CX-LL014W | |
| AIDA64 / Memory Read | |
| Razer Blade 16 Early 2023 | |
| Razer Blade 16 Early 2023 | |
| Razer Blade 16 Early 2023 | |
| Razer Blade 18 RTX 4070 | |
| Lenovo Legion Pro 7 16IRX8H | |
| Intel Core i9-13900K @253W | |
| Átlagos Intel Core i9-13980HX (62624 - 89096, n=9) | |
| Schenker XMG Neo 16 Raptor Lake | |
| Asus ROG Strix Scar 18 2023 G834JY-N6005W | |
| Asus ROG Strix Scar 18 2023 G834JY-N6005W | |
| Az osztály átlaga Gaming (22956 - 118858, n=110, az elmúlt 2 évben) | |
| Intel NUC13 Raptor Canyon | |
| MSI Raider GE77 HX 12UHS | |
| Asus ROG Strix Scar 17 SE G733CX-LL014W | |
| Dell Precision 7000 7670 Performance | |
| MSI Titan GT77 HX 13VI | |
| AIDA64 / Memory Write | |
| Razer Blade 16 Early 2023 | |
| Razer Blade 16 Early 2023 | |
| Razer Blade 16 Early 2023 | |
| Az osztály átlaga Gaming (22297 - 135096, n=110, az elmúlt 2 évben) | |
| Razer Blade 18 RTX 4070 | |
| Intel Core i9-13900K @253W | |
| Lenovo Legion Pro 7 16IRX8H | |
| Átlagos Intel Core i9-13980HX (59912 - 79917, n=9) | |
| Intel NUC13 Raptor Canyon | |
| Schenker XMG Neo 16 Raptor Lake | |
| Asus ROG Strix Scar 18 2023 G834JY-N6005W | |
| MSI Raider GE77 HX 12UHS | |
| Asus ROG Strix Scar 18 2023 G834JY-N6005W | |
| Asus ROG Strix Scar 17 SE G733CX-LL014W | |
| Dell Precision 7000 7670 Performance | |
| MSI Titan GT77 HX 13VI | |
| AIDA64 / Memory Latency | |
| Az osztály átlaga Gaming (75.3 - 259, n=110, az elmúlt 2 évben) | |
| Razer Blade 16 Early 2023 | |
| Razer Blade 16 Early 2023 | |
| Razer Blade 16 Early 2023 | |
| Intel NUC13 Raptor Canyon | |
| MSI Titan GT77 HX 13VI | |
| Schenker XMG Neo 16 Raptor Lake | |
| Asus ROG Strix Scar 18 2023 G834JY-N6005W | |
| Asus ROG Strix Scar 18 2023 G834JY-N6005W | |
| Átlagos Intel Core i9-13980HX (79.4 - 93.2, n=9) | |
| Asus ROG Strix Scar 17 SE G733CX-LL014W | |
| Dell Precision 7000 7670 Performance | |
| Razer Blade 18 RTX 4070 | |
| MSI Raider GE77 HX 12UHS | |
| Lenovo Legion Pro 7 16IRX8H | |
| Intel Core i9-13900K @253W | |
* ... a kisebb jobb
| DPC Latencies / LatencyMon - interrupt to process latency (max), Web, Youtube, Prime95 | |
| MSI Titan GT77 HX 13VI | |
| Asus ROG Strix Scar 17 SE G733CX-LL014W | |
| Razer Blade 16 Early 2023 | |
| Dell Precision 7000 7670 Performance | |
| MSI Raider GE77 HX 12UHS | |
| Razer Blade 18 RTX 4070 | |
| Asus ROG Strix Scar 18 2023 G834JY-N6005W | |
| Lenovo Legion Pro 7 16IRX8H | |
* ... a kisebb jobb

| Drive Performance rating - Percent | |
| Asus ROG Strix Scar 17 SE G733CX-LL014W | |
| Lenovo Legion 5 Pro 16IAH7H | |
| MSI Raider GE77 HX 12UHS | |
| Lenovo Legion Pro 7 16IRX8H | |
| Razer Blade 18 RTX 4070 | |
| MSI Titan GT77 HX 13VI | |
| Intel NUC13 Raptor Canyon | |
| Az osztály átlaga Gaming | |
| Átlagos 2x Samsung PM9A1 MZVL21T0HCLR (RAID 0) | |
| Razer Blade 16 Early 2023 | |
| Intel Core i9-13900K @253W -11! | |
| Asus ROG Strix Scar 18 2023 G834JY-N6005W | |
| Asus ROG Strix Scar 18 2023 G834JY-N6005W | |
| Dell Precision 7000 7670 Performance | |
| Schenker XMG Neo 16 Raptor Lake -11! | |
* ... a kisebb jobb
Disk Throttling: DiskSpd Read Loop, Queue Depth 8
| 3DMark Performance rating - Percent | |
| MSI Titan GT77 HX 13VI | |
| Schenker XMG Neo 16 Raptor Lake | |
| Asus ROG Strix Scar 18 2023 G834JY-N6005W | |
| Átlagos NVIDIA GeForce RTX 4090 Laptop GPU | |
| Asus ROG Strix Scar 18 2023 G834JY-N6005W | |
| Intel NUC13 Raptor Canyon | |
| Intel Core i9-13900K @253W | |
| Lenovo Legion Pro 7 16IRX8H | |
| Razer Blade 16 Early 2023 | |
| Az osztály átlaga Gaming | |
| Asus ROG Strix Scar 17 SE G733CX-LL014W | |
| MSI Raider GE77 HX 12UHS | |
| Razer Blade 18 RTX 4070 | |
| Dell Precision 7000 7670 Performance | |
| 3DMark 11 - 1280x720 Performance GPU | |
| Schenker XMG Neo 16 Raptor Lake | |
| MSI Titan GT77 HX 13VI | |
| Átlagos NVIDIA GeForce RTX 4090 Laptop GPU (54073 - 73027, n=42) | |
| Asus ROG Strix Scar 18 2023 G834JY-N6005W | |
| Asus ROG Strix Scar 18 2023 G834JY-N6005W | |
| Lenovo Legion Pro 7 16IRX8H | |
| Intel NUC13 Raptor Canyon | |
| Intel Core i9-13900K @253W | |
| Razer Blade 16 Early 2023 | |
| Az osztály átlaga Gaming (21841 - 80022, n=109, az elmúlt 2 évben) | |
| MSI Raider GE77 HX 12UHS | |
| Asus ROG Strix Scar 17 SE G733CX-LL014W | |
| Razer Blade 18 RTX 4070 | |
| Dell Precision 7000 7670 Performance | |
| 3DMark 06 Standard Score | 67702 pontok | |
| 3DMark 11 Performance | 46985 pontok | |
| 3DMark Ice Storm Standard Score | 277937 pontok | |
| 3DMark Cloud Gate Standard Score | 70984 pontok | |
| 3DMark Fire Strike Score | 36408 pontok | |
| 3DMark Fire Strike Extreme Score | 24278 pontok | |
| 3DMark Time Spy Score | 20166 pontok | |
Segítség | ||
| Blender - v3.3 Classroom OPTIX/RTX | |
| Dell Precision 7000 7670 Performance | |
| MSI Raider GE77 HX 12UHS | |
| Asus ROG Strix Scar 17 SE G733CX-LL014W | |
| Razer Blade 18 RTX 4070 | |
| Az osztály átlaga Gaming (9 - 32, n=112, az elmúlt 2 évben) | |
| Intel NUC13 Raptor Canyon | |
| Razer Blade 16 Early 2023 | |
| Lenovo Legion Pro 7 16IRX8H | |
| Intel Core i9-13900K @253W | |
| Átlagos NVIDIA GeForce RTX 4090 Laptop GPU (9 - 19, n=39) | |
| Asus ROG Strix Scar 18 2023 G834JY-N6005W | |
| MSI Titan GT77 HX 13VI | |
| Schenker XMG Neo 16 Raptor Lake | |
| Asus ROG Strix Scar 18 2023 G834JY-N6005W | |
| V-Ray Benchmark Next 4.10 - GPU | |
| Asus ROG Strix Scar 18 2023 G834JY-N6005W | |
| MSI Titan GT77 HX 13VI | |
| Asus ROG Strix Scar 18 2023 G834JY-N6005W | |
| Átlagos NVIDIA GeForce RTX 4090 Laptop GPU (873 - 1334, n=30) | |
| Schenker XMG Neo 16 Raptor Lake | |
| Lenovo Legion Pro 7 16IRX8H | |
| Intel Core i9-13900K @253W | |
| Intel NUC13 Raptor Canyon | |
| Az osztály átlaga Gaming (427 - 1333, n=106, az elmúlt 2 évben) | |
| MSI Raider GE77 HX 12UHS | |
| Asus ROG Strix Scar 17 SE G733CX-LL014W | |
| V-Ray 5 Benchmark | |
| GPU RTX | |
| Schenker XMG Neo 16 Raptor Lake | |
| Asus ROG Strix Scar 18 2023 G834JY-N6005W | |
| Asus ROG Strix Scar 18 2023 G834JY-N6005W | |
| MSI Titan GT77 HX 13VI | |
| Átlagos NVIDIA GeForce RTX 4090 Laptop GPU (1982 - 3824, n=29) | |
| Intel Core i9-13900K @253W | |
| Intel NUC13 Raptor Canyon | |
| Razer Blade 16 Early 2023 | |
| Az osztály átlaga Gaming (1146 - 4363, n=38, az elmúlt 2 évben) | |
| Asus ROG Strix Scar 17 SE G733CX-LL014W | |
| MSI Raider GE77 HX 12UHS | |
| Razer Blade 18 RTX 4070 | |
| GPU CUDA | |
| Asus ROG Strix Scar 18 2023 G834JY-N6005W | |
| Schenker XMG Neo 16 Raptor Lake | |
| MSI Titan GT77 HX 13VI | |
| Asus ROG Strix Scar 18 2023 G834JY-N6005W | |
| Átlagos NVIDIA GeForce RTX 4090 Laptop GPU (1454 - 2797, n=29) | |
| Intel Core i9-13900K @253W | |
| Intel NUC13 Raptor Canyon | |
| Az osztály átlaga Gaming (887 - 3288, n=38, az elmúlt 2 évben) | |
| Razer Blade 16 Early 2023 | |
| MSI Raider GE77 HX 12UHS | |
| Asus ROG Strix Scar 17 SE G733CX-LL014W | |
| Razer Blade 18 RTX 4070 | |
* ... a kisebb jobb
| Performance rating - Percent | |
| Intel NUC13 Raptor Canyon | |
| Asus ROG Strix Scar 18 2023 G834JY-N6005W | |
| MSI Titan GT77 HX 13VI | |
| Asus ROG Strix Scar 18 2023 G834JY-N6005W | |
| Schenker XMG Neo 16 Raptor Lake | |
| Razer Blade 16 Early 2023 | |
| Lenovo Legion Pro 7 16IRX8H | |
| MSI Raider GE77 HX 12UHS | |
| Razer Blade 18 RTX 4070 | |
| Az osztály átlaga Gaming | |
| Asus ROG Strix Scar 17 SE G733CX-LL014W | |
| Dell Precision 7000 7670 Performance | |
| GTA V - 1920x1080 Highest AA:4xMSAA + FX AF:16x | |
| Intel NUC13 Raptor Canyon | |
| Lenovo Legion Pro 7 16IRX8H | |
| Asus ROG Strix Scar 18 2023 G834JY-N6005W | |
| Asus ROG Strix Scar 18 2023 G834JY-N6005W | |
| MSI Titan GT77 HX 13VI | |
| Razer Blade 16 Early 2023 | |
| Schenker XMG Neo 16 Raptor Lake | |
| MSI Raider GE77 HX 12UHS | |
| Az osztály átlaga Gaming (48.3 - 186.9, n=103, az elmúlt 2 évben) | |
| Asus ROG Strix Scar 17 SE G733CX-LL014W | |
| Razer Blade 18 RTX 4070 | |
| Dell Precision 7000 7670 Performance | |
| Final Fantasy XV Benchmark - 1920x1080 High Quality | |
| MSI Titan GT77 HX 13VI | |
| Schenker XMG Neo 16 Raptor Lake | |
| Intel NUC13 Raptor Canyon | |
| Asus ROG Strix Scar 18 2023 G834JY-N6005W | |
| Asus ROG Strix Scar 18 2023 G834JY-N6005W | |
| Lenovo Legion Pro 7 16IRX8H | |
| Razer Blade 16 Early 2023 | |
| Az osztály átlaga Gaming (41 - 215, n=104, az elmúlt 2 évben) | |
| MSI Raider GE77 HX 12UHS | |
| Asus ROG Strix Scar 17 SE G733CX-LL014W | |
| Razer Blade 18 RTX 4070 | |
| Dell Precision 7000 7670 Performance | |
| Strange Brigade - 1920x1080 ultra AA:ultra AF:16 | |
| MSI Titan GT77 HX 13VI | |
| Asus ROG Strix Scar 18 2023 G834JY-N6005W | |
| Intel NUC13 Raptor Canyon | |
| Schenker XMG Neo 16 Raptor Lake | |
| Asus ROG Strix Scar 18 2023 G834JY-N6005W | |
| Razer Blade 16 Early 2023 | |
| Lenovo Legion Pro 7 16IRX8H | |
| Az osztály átlaga Gaming (76.3 - 456, n=94, az elmúlt 2 évben) | |
| Asus ROG Strix Scar 17 SE G733CX-LL014W | |
| MSI Raider GE77 HX 12UHS | |
| Razer Blade 18 RTX 4070 | |
| Dell Precision 7000 7670 Performance | |
| Dota 2 Reborn - 1920x1080 ultra (3/3) best looking | |
| Intel NUC13 Raptor Canyon | |
| Razer Blade 16 Early 2023 | |
| Asus ROG Strix Scar 18 2023 G834JY-N6005W | |
| Asus ROG Strix Scar 18 2023 G834JY-N6005W | |
| MSI Titan GT77 HX 13VI | |
| Lenovo Legion Pro 7 16IRX8H | |
| Razer Blade 18 RTX 4070 | |
| Schenker XMG Neo 16 Raptor Lake | |
| Asus ROG Strix Scar 17 SE G733CX-LL014W | |
| MSI Raider GE77 HX 12UHS | |
| Dell Precision 7000 7670 Performance | |
| Az osztály átlaga Gaming (84.8 - 248, n=113, az elmúlt 2 évben) | |
| X-Plane 11.11 - 1920x1080 high (fps_test=3) | |
| Intel NUC13 Raptor Canyon | |
| Asus ROG Strix Scar 18 2023 G834JY-N6005W | |
| Asus ROG Strix Scar 18 2023 G834JY-N6005W | |
| Razer Blade 18 RTX 4070 | |
| Razer Blade 16 Early 2023 | |
| Schenker XMG Neo 16 Raptor Lake | |
| Schenker XMG Neo 16 Raptor Lake | |
| Schenker XMG Neo 16 Raptor Lake | |
| MSI Titan GT77 HX 13VI | |
| MSI Titan GT77 HX 13VI | |
| Lenovo Legion Pro 7 16IRX8H | |
| MSI Raider GE77 HX 12UHS | |
| Asus ROG Strix Scar 17 SE G733CX-LL014W | |
| Dell Precision 7000 7670 Performance | |
| Az osztály átlaga Gaming (52.1 - 143.5, n=116, az elmúlt 2 évben) | |
The Witcher 3 FPS Chart
| alacsony | közepes | magas | ultra | QHD | 4K DLSS | 4K | |
|---|---|---|---|---|---|---|---|
| Counter-Strike: GO (2012) | 516 | 314 | |||||
| GTA V (2015) | 187.4 | 185.7 | 184.8 | 141.3 | 139.1 | 175.7 | |
| Dota 2 Reborn (2015) | 237 | 207.7 | 201.75 | 190.2 | 178.6 | ||
| Deus Ex Mankind Divided (2016) | 169 | ||||||
| Final Fantasy XV Benchmark (2018) | 224 | 208 | 177.6 | 146.7 | 90.1 | ||
| X-Plane 11.11 (2018) | 211 | 186.8 | 142.8 | ||||
| Far Cry 5 (2018) | 197 | 181 | 172 | 158 | 153 | 107 | |
| Strange Brigade (2018) | 496 | 403 | 386 | 366 | 292 | 154.7 | |
| Shadow of the Tomb Raider (2018) | 143.7 | 121.2 | 87.3 | ||||
| Control (2019) | 184.4 | 123.2 | 72.6 | ||||
| Horizon Zero Dawn (2020) | 184 | 154 | 145 | 127 | 92 | ||
| Flight Simulator 2020 (2020) | 74 | 74 | 96.8 | 51.2 | |||
| Battlefield 2042 (2021) | 172.6 | 138.9 | 85.4 | ||||
| Halo Infinite (2021) | 128.9 | 77 | 57.3 | ||||
| Elden Ring (2022) | 60 | 60 | 60 | 60 | 60 | 60 | |
| Cyberpunk 2077 1.6 (2022) | 119.7 | 94.5 | |||||
| Vampire Bloodhunt (2022) | 290 | 242 | 138.3 | ||||
| F1 22 (2022) | 319 | 308 | 273 | 124.5 | 75 | 42.4 | |
| FIFA 23 (2022) | 183.7 | 182.6 | 162.4 | ||||
| A Plague Tale Requiem (2022) | 96.8 | 72 | 82.3 | 41 | |||
| Uncharted Legacy of Thieves Collection (2022) | 108.2 | 103.1 | 62.9 | ||||
| Call of Duty Modern Warfare 2 2022 (2022) | 170 | 127 | 112 | 81 | |||
| Spider-Man Miles Morales (2022) | 109.1 | 103.8 | 73.2 | ||||
| Need for Speed Unbound (2022) | 124.2 | 111.8 | 84.3 | ||||
| High On Life (2023) | 180.3 | 120.2 | 52 | ||||
| The Witcher 3 v4 (2023) | 137.6 | 96.6 | 49 |
Zajszint
| Üresjárat |
| 23.9 / 32.6 / 32.6 dB(A) |
| Terhelés |
| 35.9 / 55.8 dB(A) |
 | ||
30 dB csendes 40 dB(A) hallható 50 dB(A) hangos |
||
min: | ||
| Asus ROG Strix Scar 18 2023 G834JY-N6005W GeForce RTX 4090 Laptop GPU, i9-13980HX, 2x Samsung PM9A1 MZVL21T0HCLR (RAID 0) | Razer Blade 18 RTX 4070 GeForce RTX 4070 Laptop GPU, i9-13950HX, SSSTC CA6-8D1024 | Lenovo Legion Pro 7 16IRX8H GeForce RTX 4080 Laptop GPU, i9-13900HX, Samsung PM9A1 MZVL21T0HCLR | Razer Blade 16 Early 2023 GeForce RTX 4080 Laptop GPU, i9-13950HX, SSSTC CA6-8D1024 | MSI Titan GT77 HX 13VI GeForce RTX 4090 Laptop GPU, i9-13950HX, Samsung PM9A1 MZVL22T0HBLB | MSI Raider GE77 HX 12UHS GeForce RTX 3080 Ti Laptop GPU, i9-12900HX, Samsung PM9A1 MZVL22T0HBLB | Asus ROG Strix Scar 17 SE G733CX-LL014W GeForce RTX 3080 Ti Laptop GPU, i9-12950HX, Samsung PM9A1 MZVL22T0HBLB | |
|---|---|---|---|---|---|---|---|
| Noise | 8% | -5% | 11% | -9% | -17% | 13% | |
| off / környezet * (dB) | 23.9 | 23.5 2% | 24 -0% | 23 4% | 24.6 -3% | 26 -9% | 23.9 -0% |
| Idle Minimum * (dB) | 23.9 | 23.8 -0% | 26 -9% | 23 4% | 29.2 -22% | 26 -9% | 23.9 -0% |
| Idle Average * (dB) | 32.6 | 23.8 27% | 28 14% | 23 29% | 29.2 10% | 34 -4% | 23.9 27% |
| Idle Maximum * (dB) | 32.6 | 26.8 18% | 34 -4% | 23.6 28% | 29.2 10% | 46 -41% | 23.9 27% |
| Load Average * (dB) | 35.9 | 37.3 -4% | 47 -31% | 39 -9% | 50.7 -41% | 50 -39% | 34.3 4% |
| Load Maximum * (dB) | 55.8 | 53.5 4% | 56 -0% | 51.3 8% | 61 -9% | 57 -2% | 45.9 18% |
| Witcher 3 ultra * (dB) | 48 | 55 | 51.6 | 53.3 | 55 |
* ... a kisebb jobb
(-) A felső oldalon a maximális hőmérséklet 54 °C / 129 F, összehasonlítva a 40.4 °C / 105 F átlagával , 21.2 és 68.8 °C között a Gaming osztálynál.
(-) Az alsó maximum 46 °C / 115 F-ig melegszik fel, összehasonlítva a 43.2 °C / 110 F átlagával
(+) Üresjáratban a felső oldal átlagos hőmérséklete 27.2 °C / 81 F, összehasonlítva a 33.9 °C / ### eszközátlaggal class_avg_f### F.
(±) A The Witcher 3 játék során a felső oldal átlaghőmérséklete 36 °C / 97 F, összehasonlítva a 33.9 °C / ## eszközátlaggal #class_avg_f### F.
(+) A csuklótámasz és az érintőpad hűvösebb, mint a bőr hőmérséklete, maximum 28 °C / 82.4 F, ezért hűvös tapintású.
(±) A hasonló eszközök csuklótámasz területének átlagos hőmérséklete 28.8 °C / 83.8 F volt (+0.8 °C / 1.4 F).
| Asus ROG Strix Scar 18 2023 G834JY-N6005W Intel Core i9-13980HX, NVIDIA GeForce RTX 4090 Laptop GPU | Razer Blade 16 Early 2023 Intel Core i9-13950HX, NVIDIA GeForce RTX 4080 Laptop GPU | MSI Titan GT77 HX 13VI Intel Core i9-13950HX, NVIDIA GeForce RTX 4090 Laptop GPU | MSI Raider GE77 HX 12UHS Intel Core i9-12900HX, NVIDIA GeForce RTX 3080 Ti Laptop GPU | Asus ROG Strix Scar 17 SE G733CX-LL014W Intel Core i9-12950HX, NVIDIA GeForce RTX 3080 Ti Laptop GPU | |
|---|---|---|---|---|---|
| Heat | 9% | 13% | -23% | -4% | |
| Maximum Upper Side * (°C) | 54 | 40 26% | 40.6 25% | 53 2% | 48.8 10% |
| Maximum Bottom * (°C) | 46 | 37.6 18% | 41.1 11% | 58 -26% | 52.4 -14% |
| Idle Upper Side * (°C) | 30 | 32.4 -8% | 26.2 13% | 38 -27% | 30.4 -1% |
| Idle Bottom * (°C) | 31 | 31.4 -1% | 30.3 2% | 43 -39% | 34.1 -10% |
* ... a kisebb jobb
Asus ROG Strix Scar 18 2023 G834JY-N6005W hangelemzés
(+) | a hangszórók viszonylag hangosan tudnak játszani (82.7 dB)
Basszus 100 - 315 Hz
(+) | jó basszus – csak 4.8% választja el a mediántól
(±) | a basszus linearitása átlagos (7% delta az előző frekvenciához)
Közepes 400-2000 Hz
(±) | magasabb középértékek – átlagosan 9%-kal magasabb, mint a medián
(+) | a középpontok lineárisak (5% delta az előző frekvenciához)
Maximum 2-16 kHz
(+) | kiegyensúlyozott csúcsok – csak 3.7% választja el a mediántól
(+) | a csúcsok lineárisak (6.1% delta az előző frekvenciához képest)
Összességében 100 - 16.000 Hz
(±) | az általános hang linearitása átlagos (19% eltérés a mediánhoz képest)
Ugyanazon osztályhoz képest
» 63%Ebben az osztályban az összes tesztelt eszköz %-a jobb volt, 8% hasonló, 29%-kal rosszabb
» A legjobb delta értéke 6%, az átlag 18%, a legrosszabb 132% volt
Az összes tesztelt eszközzel összehasonlítva
» 45% az összes tesztelt eszköz jobb volt, 7% hasonló, 48%-kal rosszabb
» A legjobb delta értéke 4%, az átlag 24%, a legrosszabb 134% volt
Apple MacBook Pro 16 2021 M1 Pro hangelemzés
(+) | a hangszórók viszonylag hangosan tudnak játszani (84.7 dB)
Basszus 100 - 315 Hz
(+) | jó basszus – csak 3.8% választja el a mediántól
(+) | a basszus lineáris (5.2% delta az előző frekvenciához)
Közepes 400-2000 Hz
(+) | kiegyensúlyozott középpontok – csak 1.3% választja el a mediántól
(+) | a középpontok lineárisak (2.1% delta az előző frekvenciához)
Maximum 2-16 kHz
(+) | kiegyensúlyozott csúcsok – csak 1.9% választja el a mediántól
(+) | a csúcsok lineárisak (2.7% delta az előző frekvenciához képest)
Összességében 100 - 16.000 Hz
(+) | általános hangzás lineáris (4.6% eltérés a mediánhoz képest)
Ugyanazon osztályhoz képest
» 0%Ebben az osztályban az összes tesztelt eszköz %-a jobb volt, 0% hasonló, 100%-kal rosszabb
» A legjobb delta értéke 5%, az átlag 17%, a legrosszabb 45% volt
Az összes tesztelt eszközzel összehasonlítva
» 0% az összes tesztelt eszköz jobb volt, 0% hasonló, 100%-kal rosszabb
» A legjobb delta értéke 4%, az átlag 24%, a legrosszabb 134% volt
| Kikapcsolt állapot / Készenlét | |
| Üresjárat | |
| Terhelés |
|
Kulcs:
min: | |
| Asus ROG Strix Scar 18 2023 G834JY-N6005W i9-13980HX, GeForce RTX 4090 Laptop GPU, 2x Samsung PM9A1 MZVL21T0HCLR (RAID 0), IPS, 2560x1600, 18" | Razer Blade 16 Early 2023 i9-13950HX, GeForce RTX 4080 Laptop GPU, SSSTC CA6-8D1024, IPS, 2560x1600, 16" | MSI Titan GT77 HX 13VI i9-13950HX, GeForce RTX 4090 Laptop GPU, Samsung PM9A1 MZVL22T0HBLB, Mini-LED, 3840x2160, 17.3" | MSI Raider GE77 HX 12UHS i9-12900HX, GeForce RTX 3080 Ti Laptop GPU, Samsung PM9A1 MZVL22T0HBLB, IPS, 3840x2160, 17.3" | Asus ROG Strix Scar 17 SE G733CX-LL014W i9-12950HX, GeForce RTX 3080 Ti Laptop GPU, Samsung PM9A1 MZVL22T0HBLB, IPS, 2560x1440, 17.3" | Az osztály átlaga Gaming | |
|---|---|---|---|---|---|---|
| Power Consumption | 9% | 13% | 15% | 6% | 28% | |
| Idle Minimum * (Watt) | 17.3 | 15.2 12% | 14 19% | 13 25% | 19.3 -12% | 13.3 ? 23% |
| Idle Average * (Watt) | 27 | 22.8 16% | 21.6 20% | 19 30% | 26.5 2% | 19 ? 30% |
| Idle Maximum * (Watt) | 46 | 49.8 -8% | 24.8 46% | 29 37% | 27.1 41% | 24.5 ? 47% |
| Load Average * (Watt) | 133 | 121.2 9% | 122.5 8% | 143 -8% | 141 -6% | 108.1 ? 19% |
| Load Maximum * (Watt) | 329 | 273.7 17% | 418 -27% | 352 -7% | 307.9 6% | 254 ? 23% |
| Witcher 3 ultra * (Watt) | 242 | 265 | 247 | 225 |
* ... a kisebb jobb
Power Consumption The Witcher 3 / Stress Test
Power Consumption with External Monitor
| Asus ROG Strix Scar 18 2023 G834JY-N6005W i9-13980HX, GeForce RTX 4090 Laptop GPU, 90 Wh | Razer Blade 16 Early 2023 i9-13950HX, GeForce RTX 4080 Laptop GPU, 95.2 Wh | MSI Titan GT77 HX 13VI i9-13950HX, GeForce RTX 4090 Laptop GPU, 99.9 Wh | MSI Raider GE77 HX 12UHS i9-12900HX, GeForce RTX 3080 Ti Laptop GPU, 99.99 Wh | Asus ROG Strix Scar 17 SE G733CX-LL014W i9-12950HX, GeForce RTX 3080 Ti Laptop GPU, 90 Wh | Az osztály átlaga Gaming | |
|---|---|---|---|---|---|---|
| Akkumulátor üzemidő | 21% | 6% | 30% | -41% | 27% | |
| H.264 (h) | 7 | 6 -14% | 6.5 -7% | 8.26 ? 18% | ||
| WiFi v1.3 (h) | 7.1 | 6.1 -14% | 5.3 -25% | 5.4 -24% | 4.2 -41% | 7.01 ? -1% |
| Witcher 3 ultra (h) | 0.9 | |||||
| Load (h) | 0.9 | 1.4 56% | 1.4 56% | 2 122% | 1.47 ? 63% | |
| Reader / Idle (h) | 8.9 | 9.8 | 8.71 ? |
Pro
Kontra
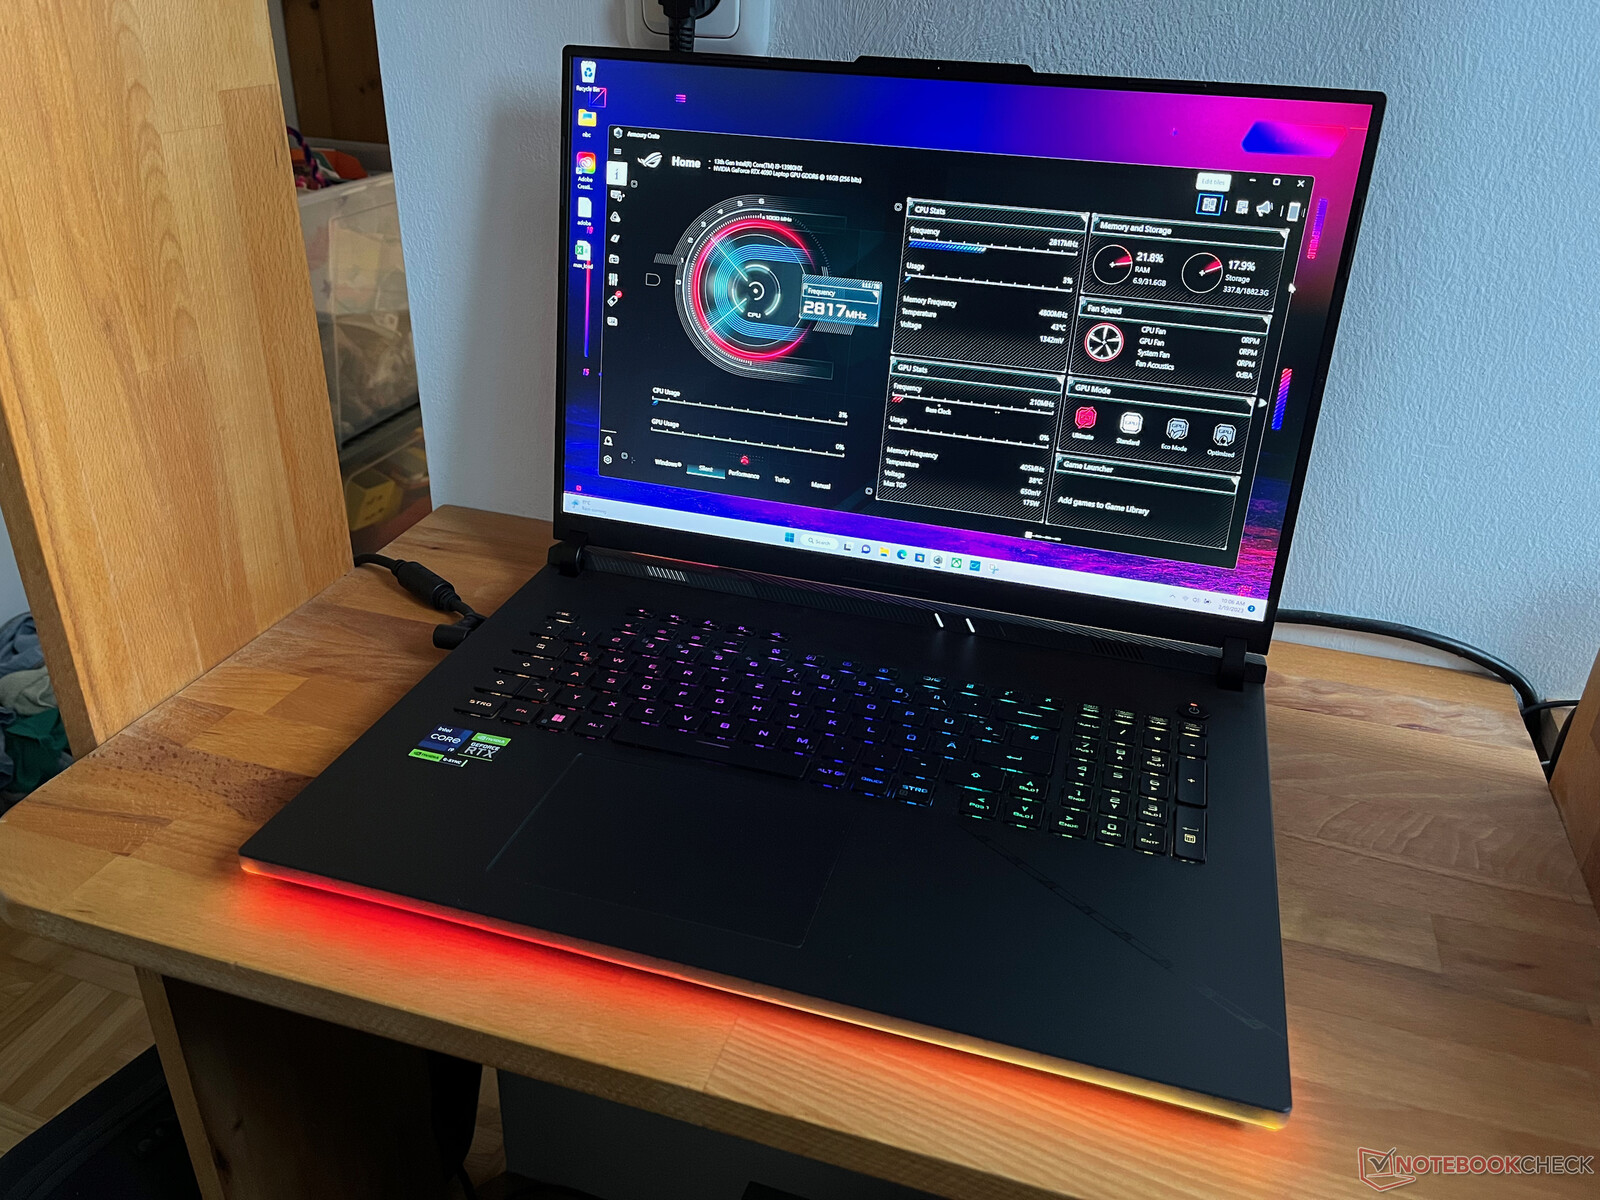
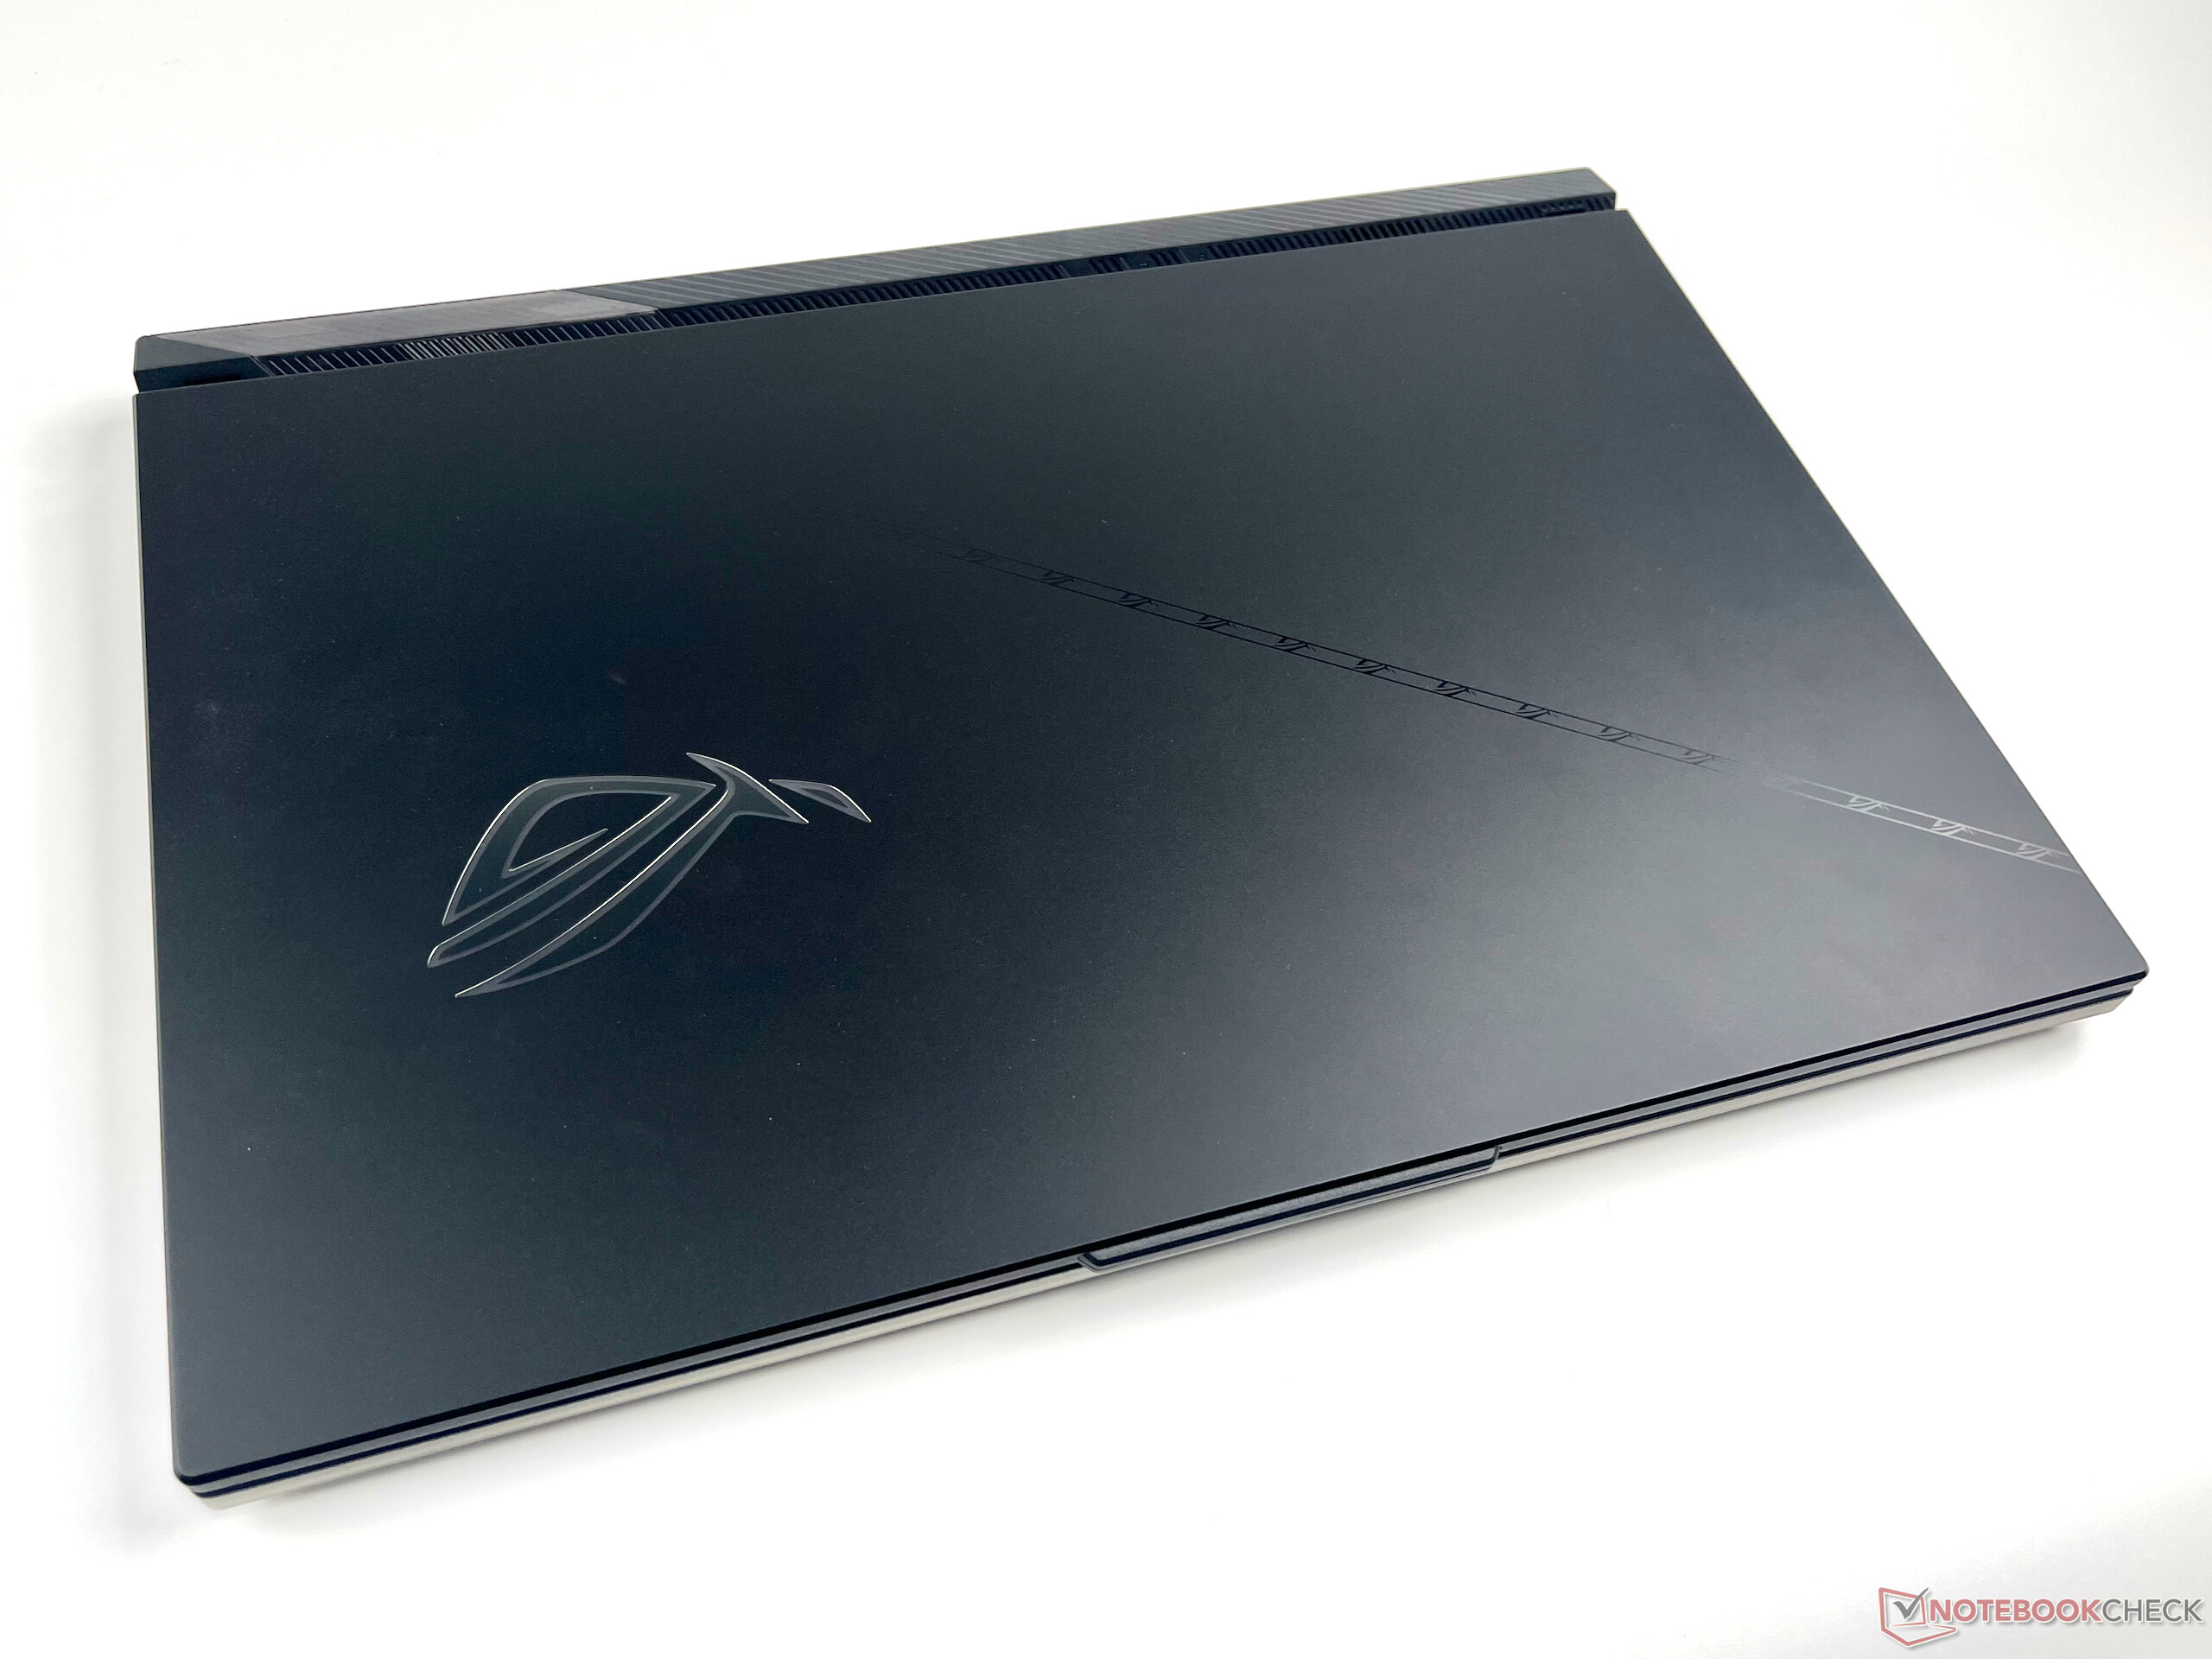
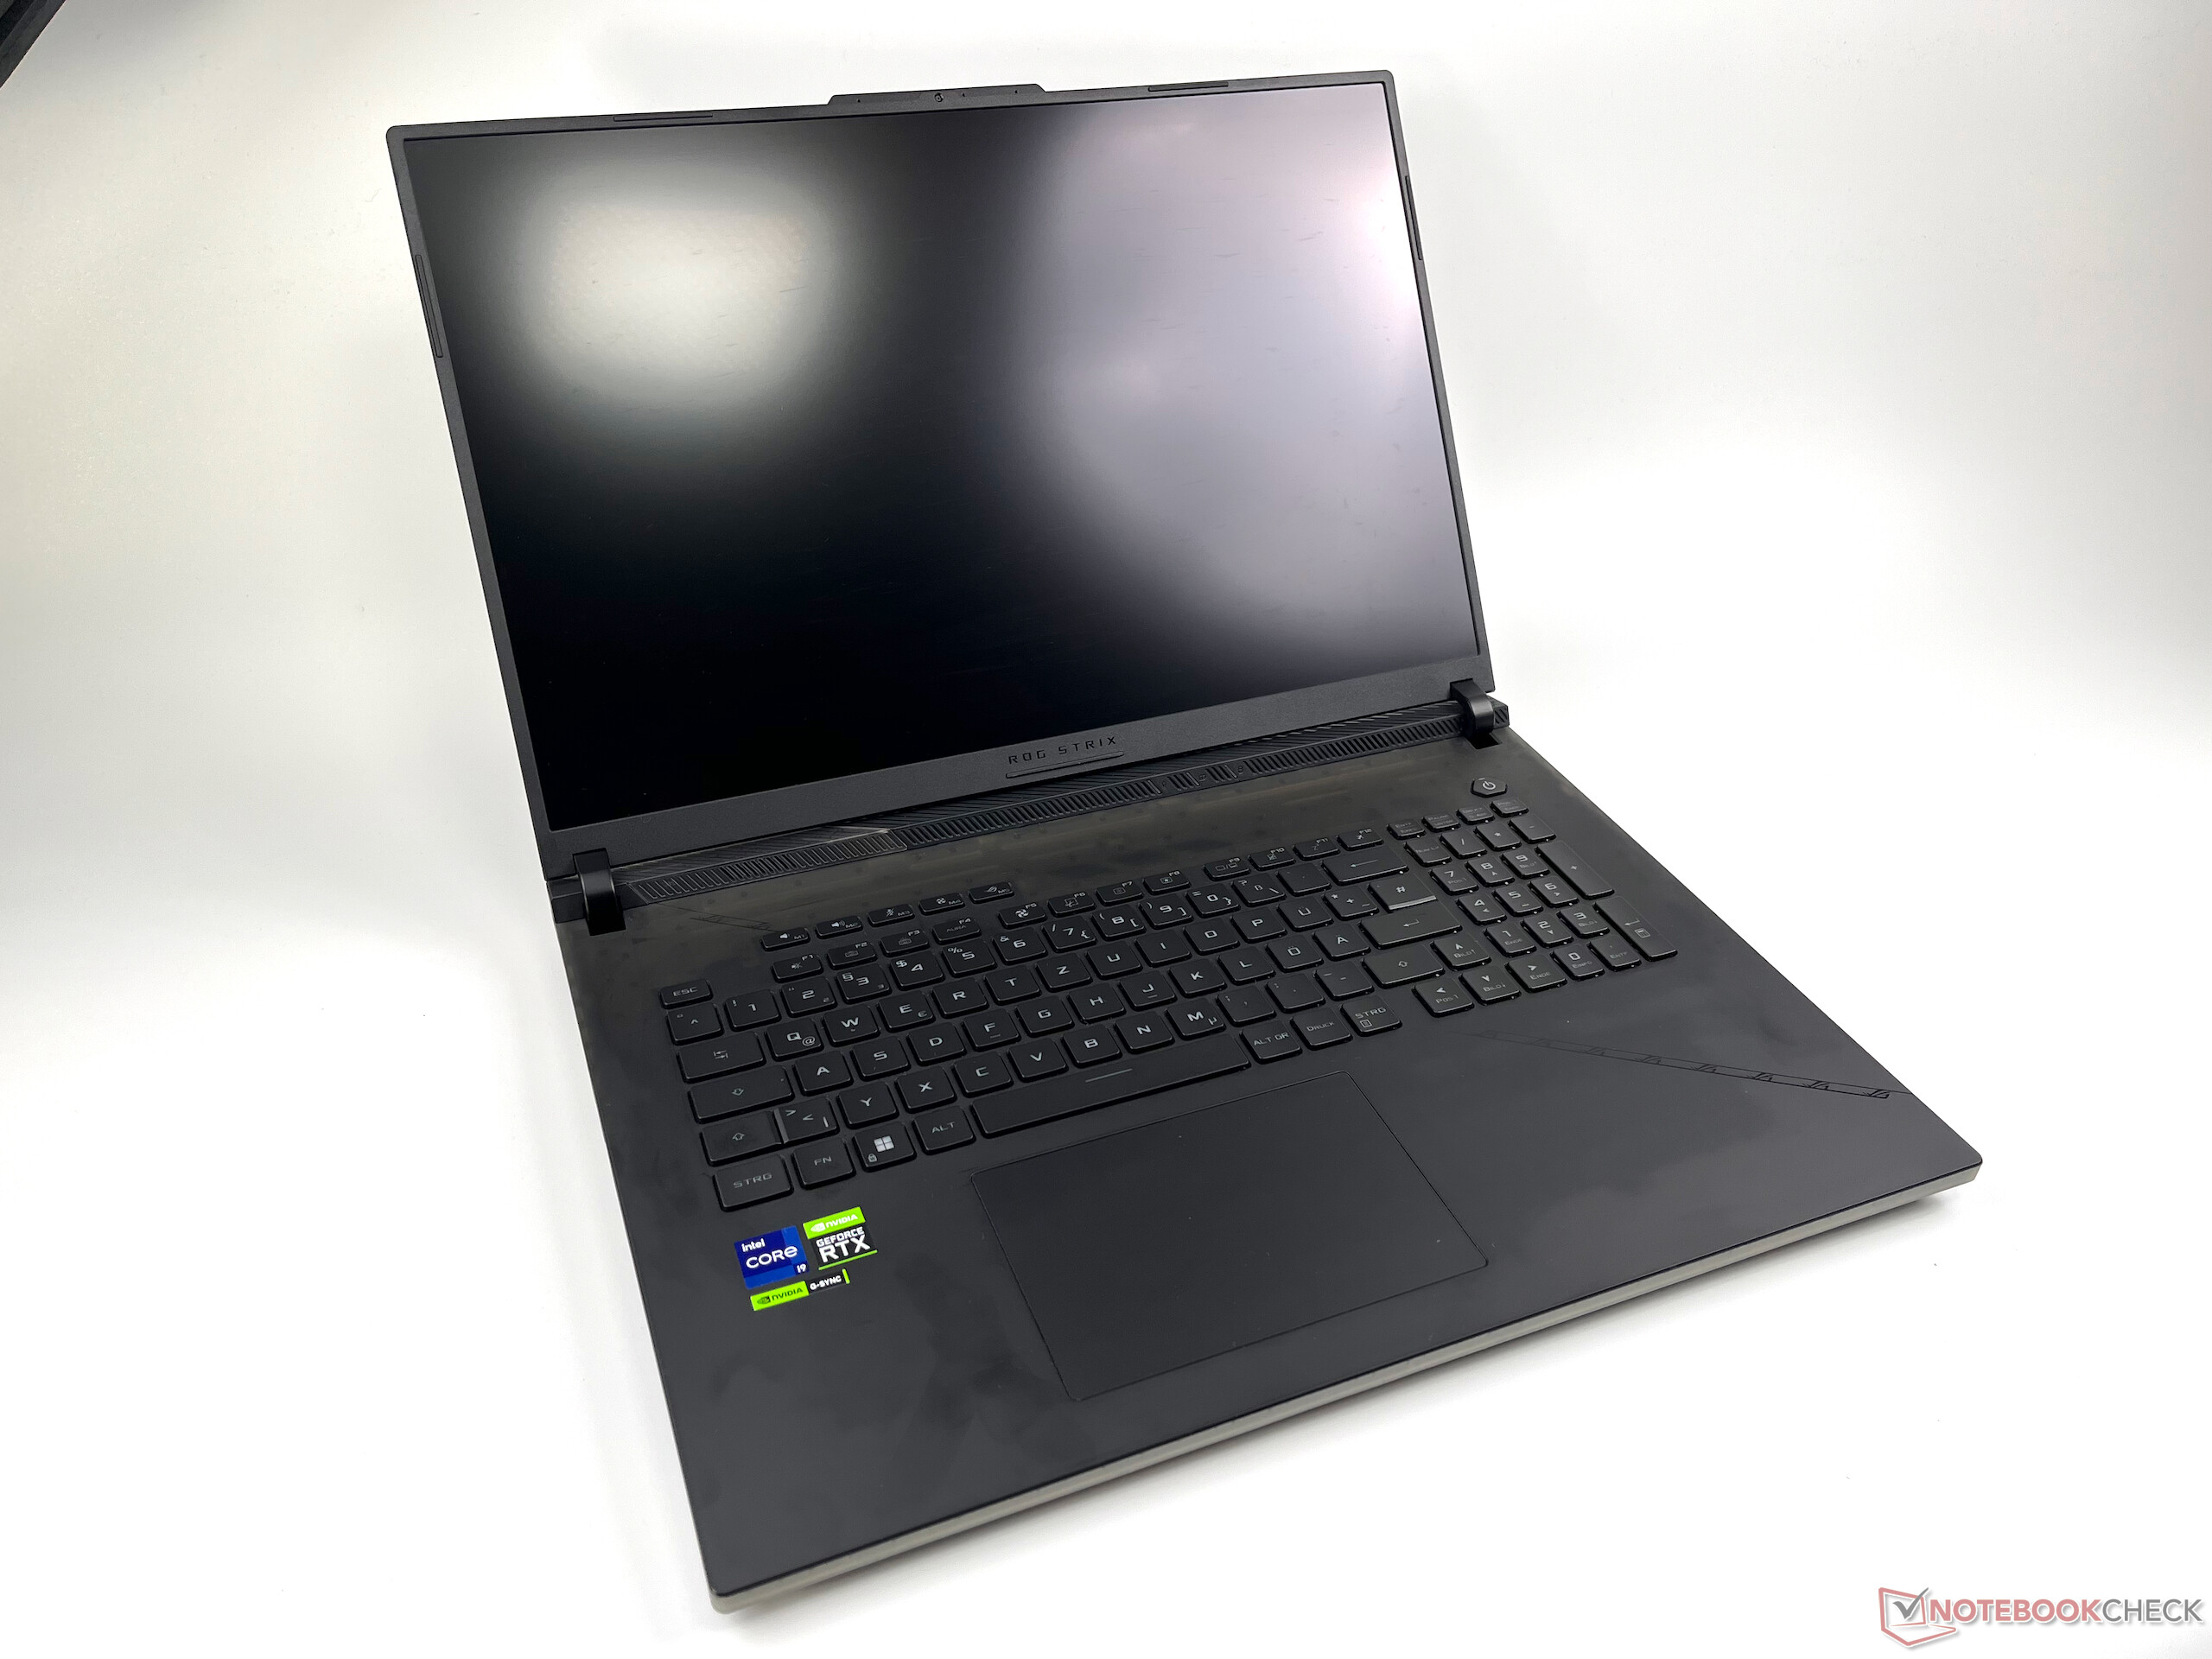
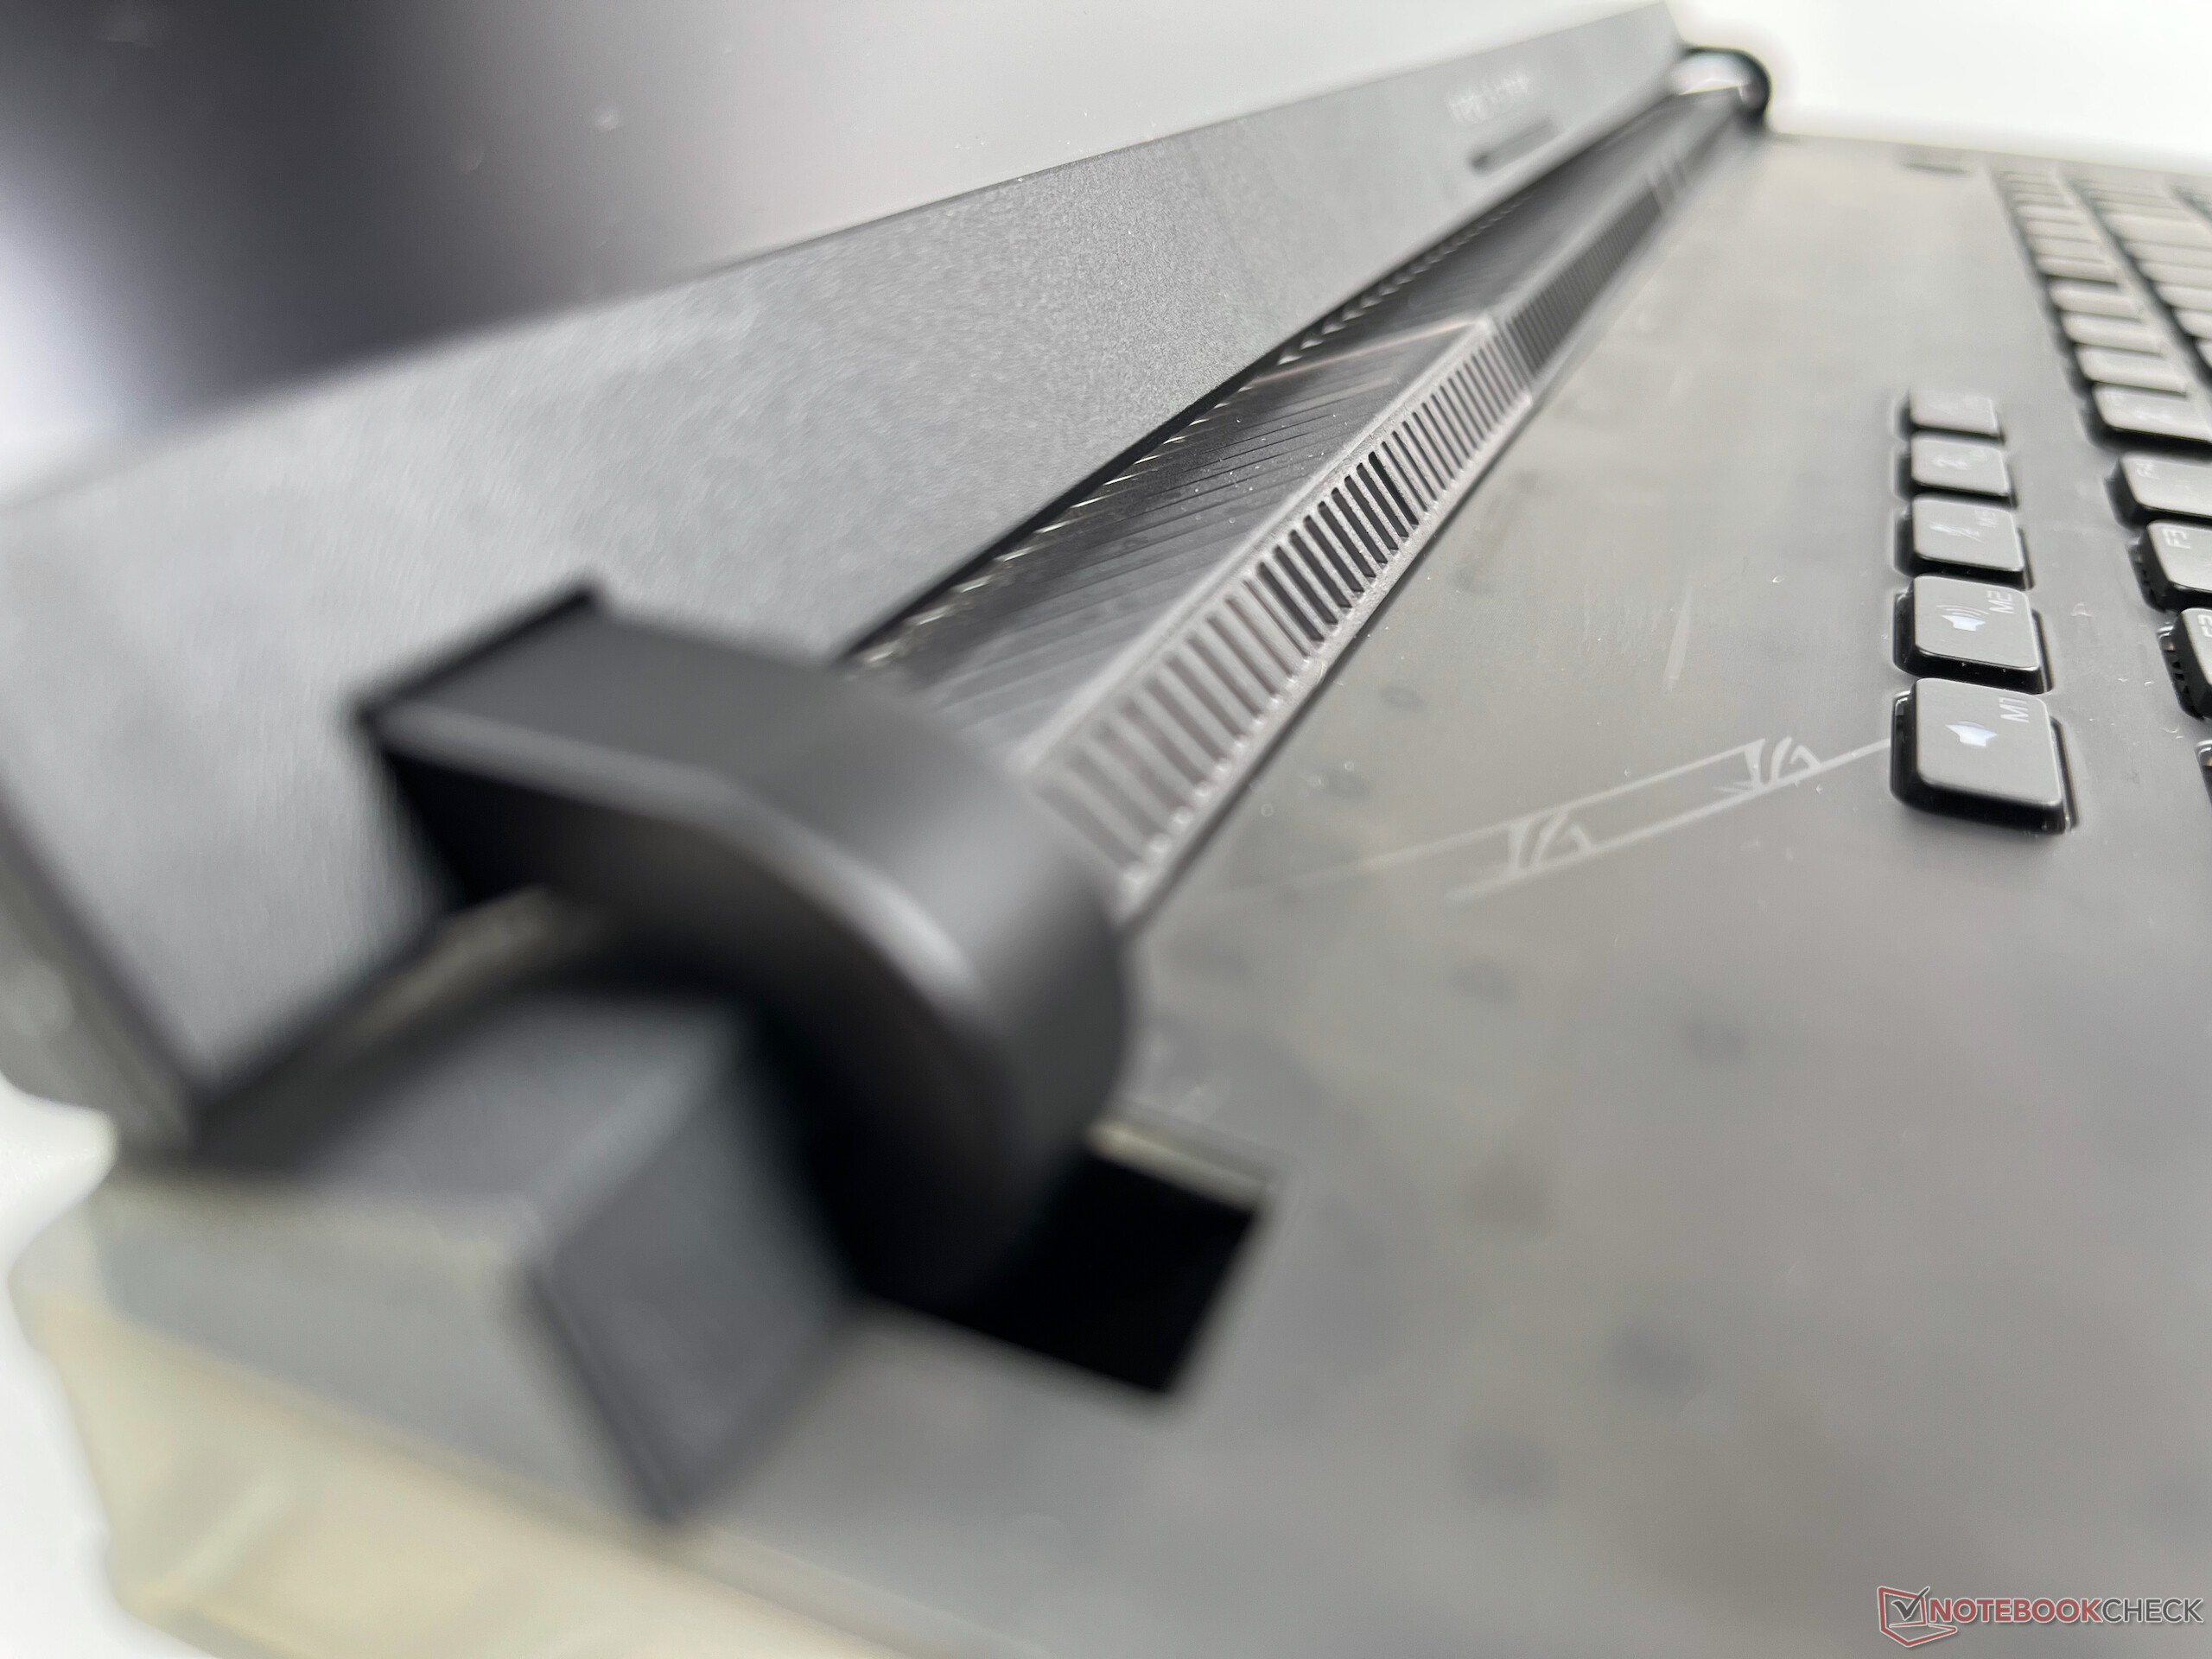
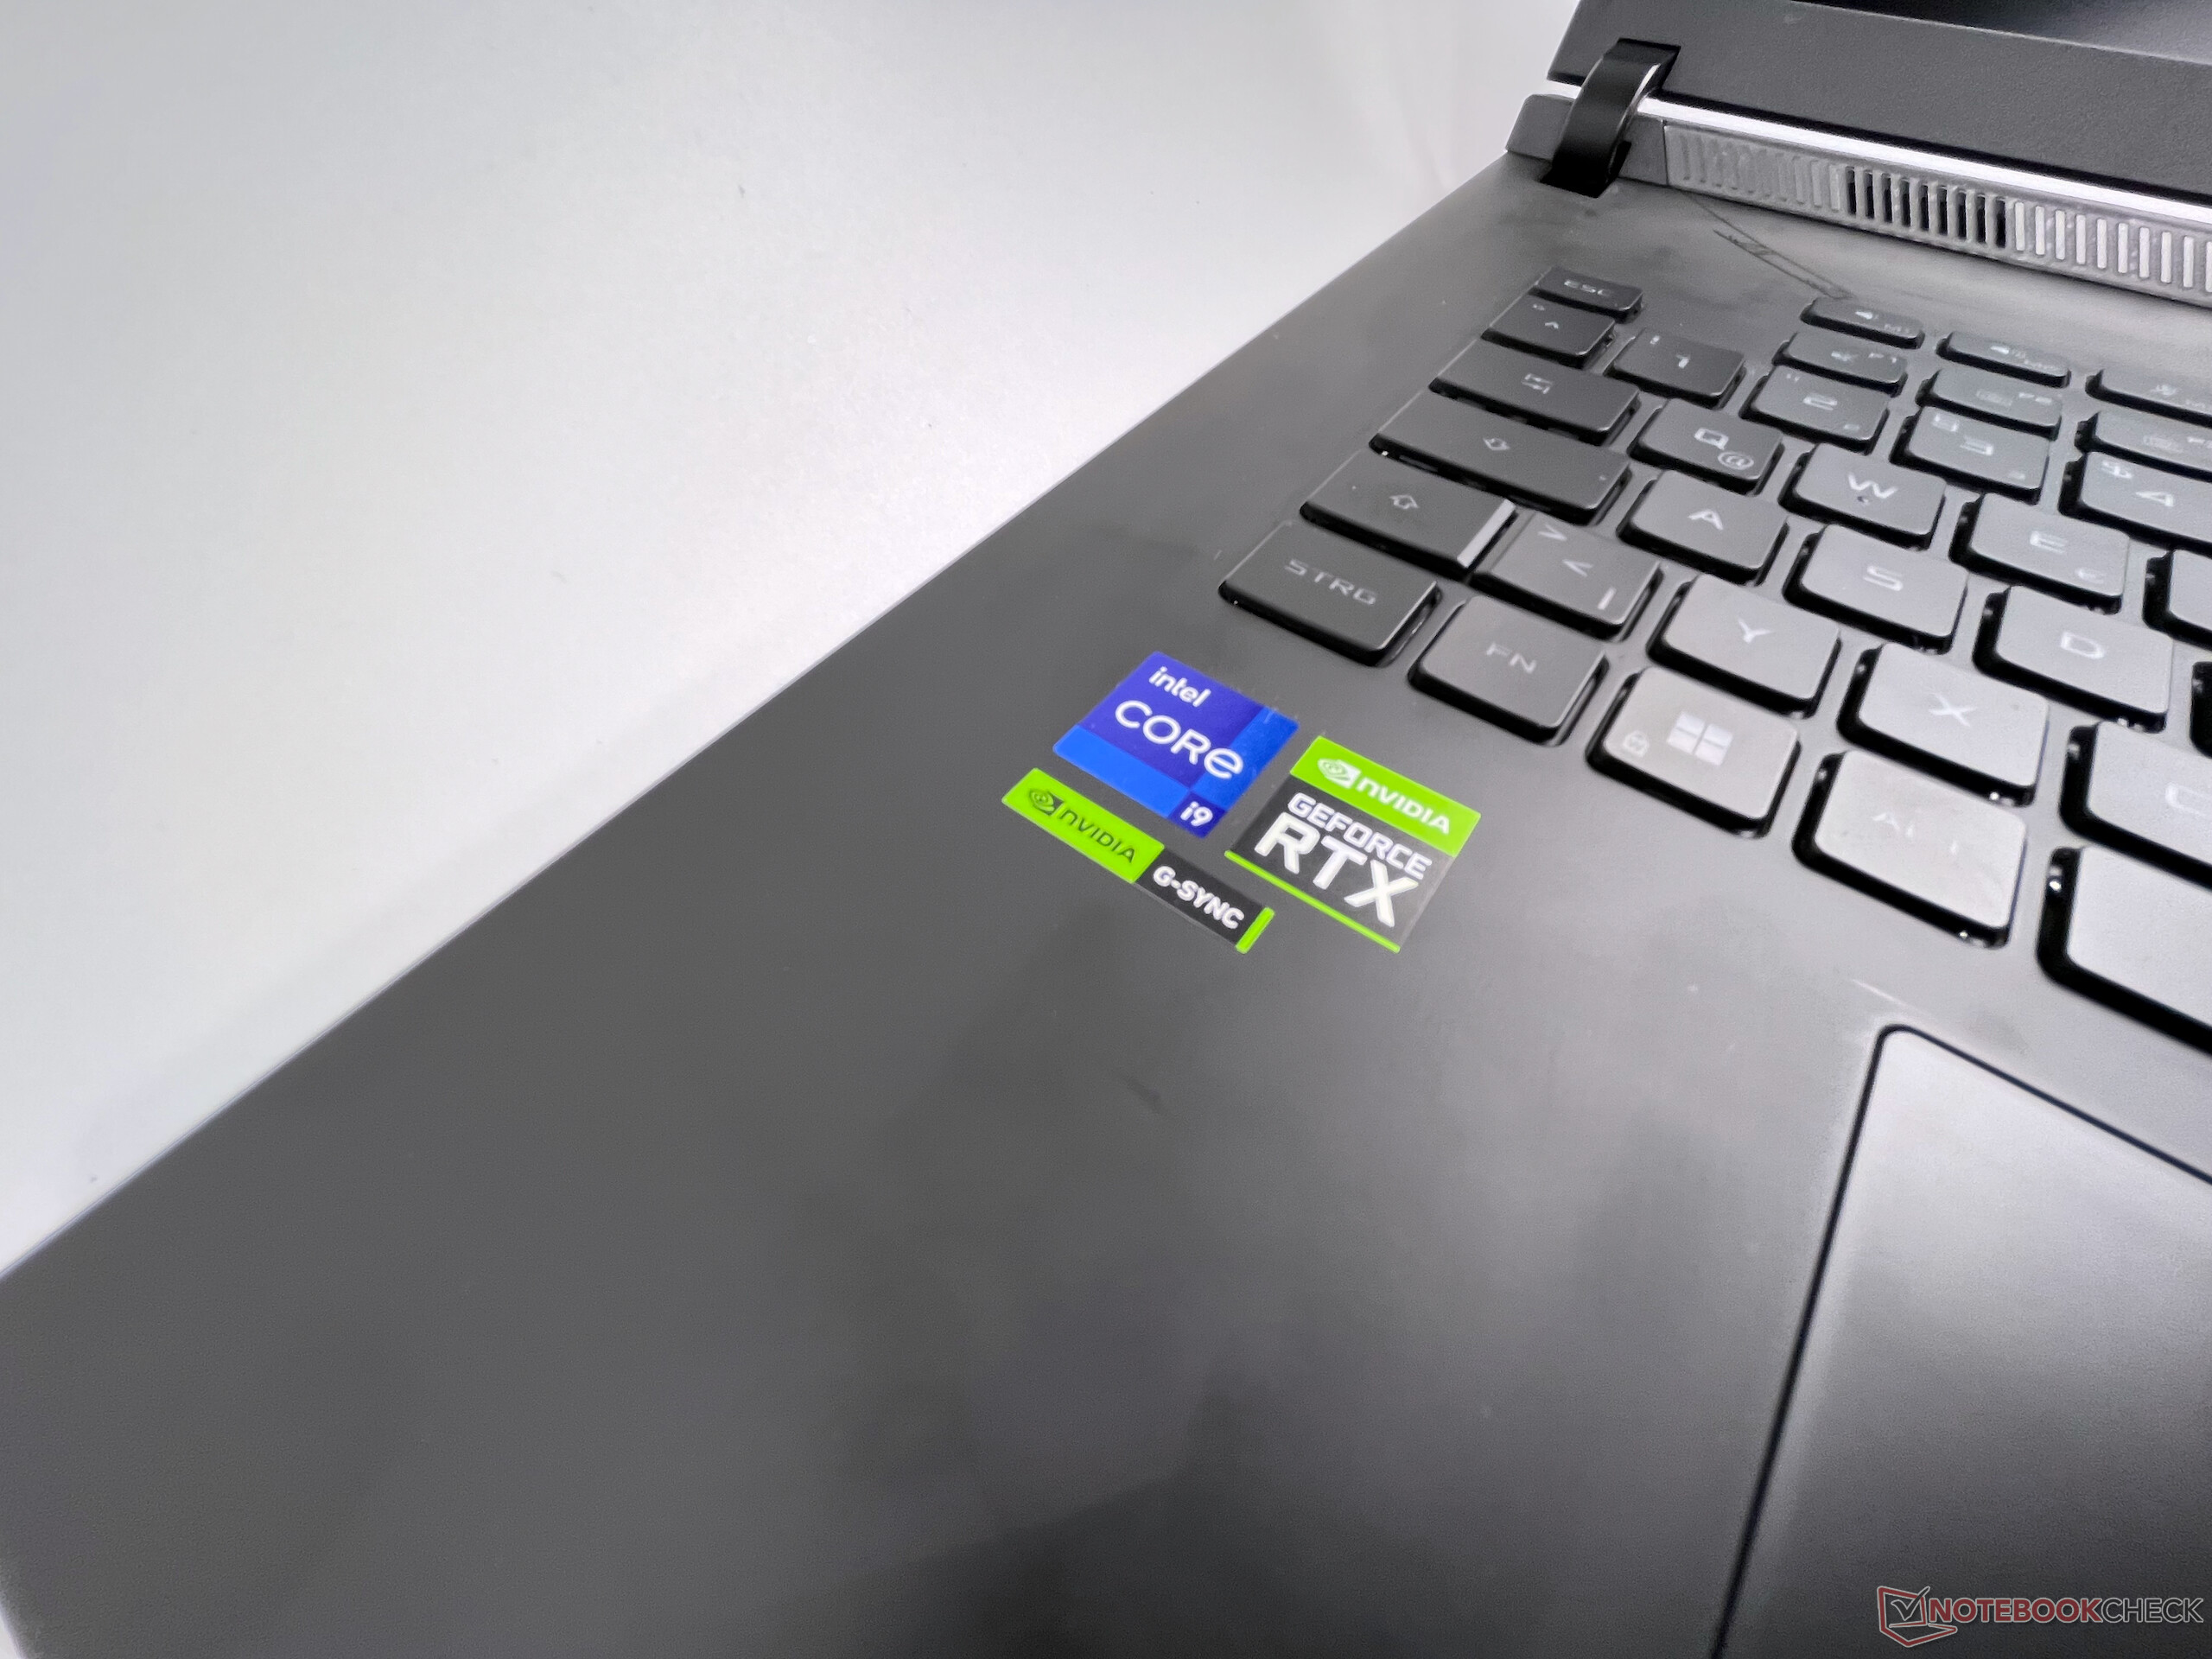
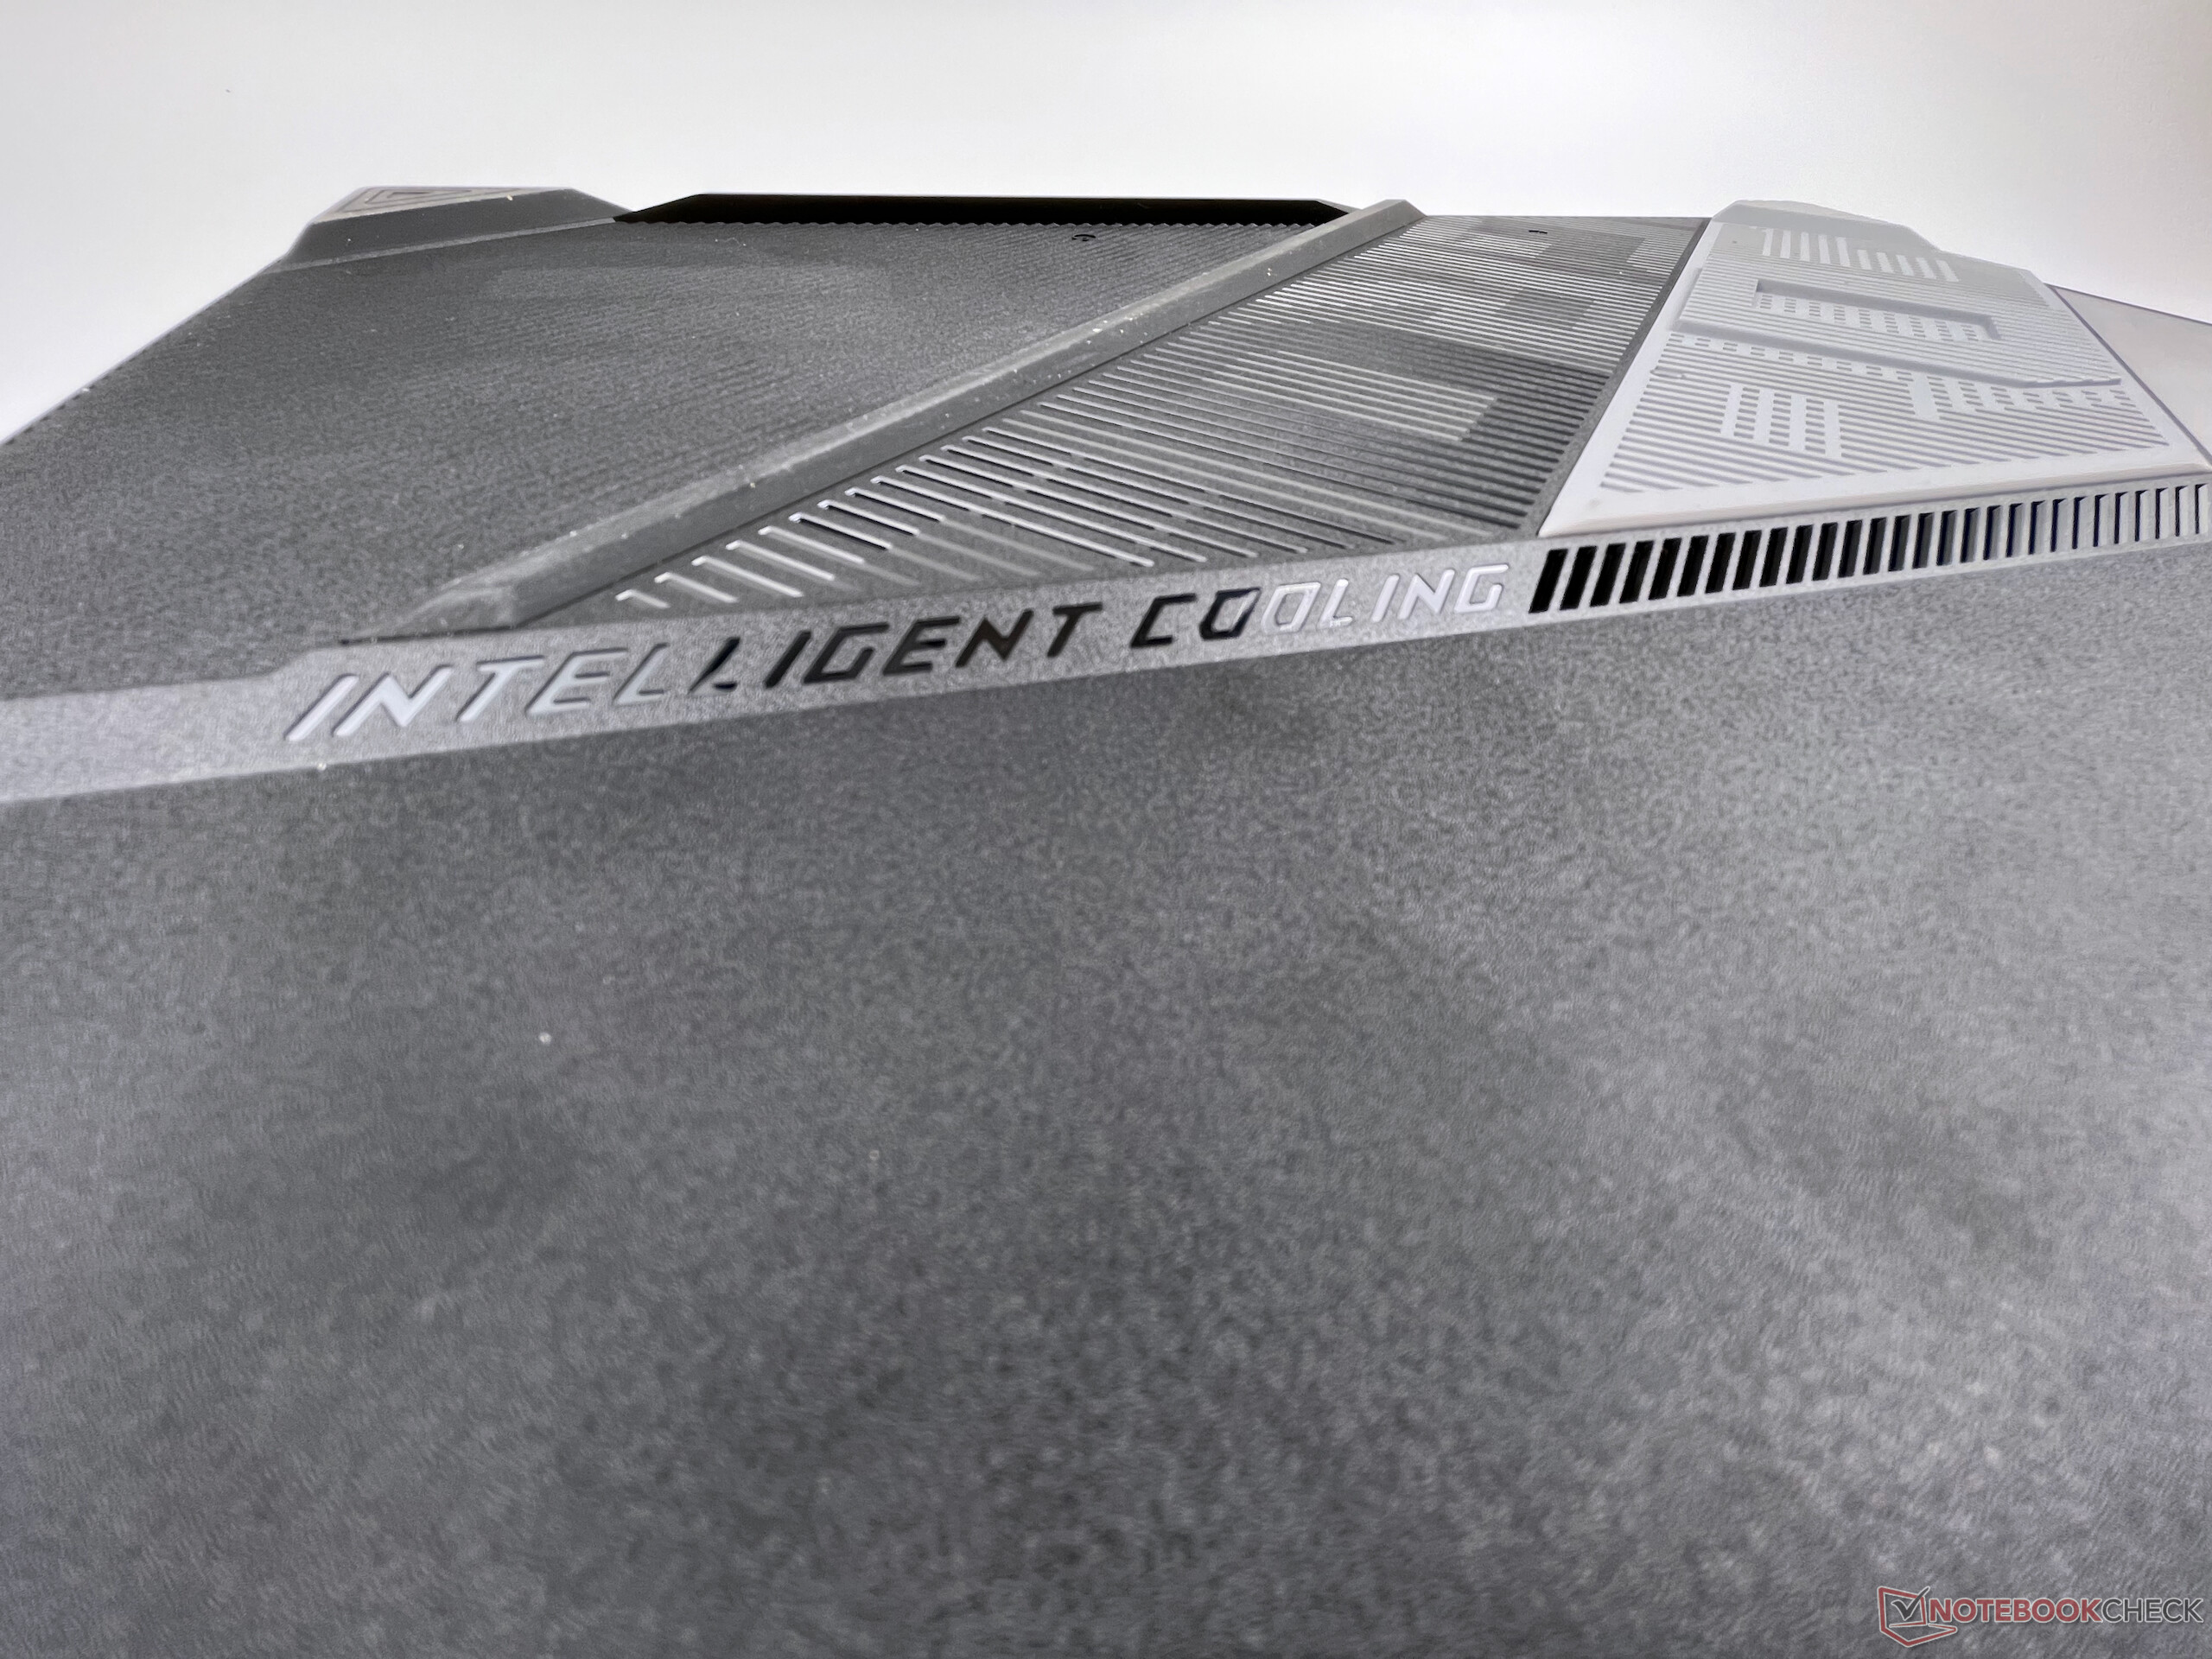
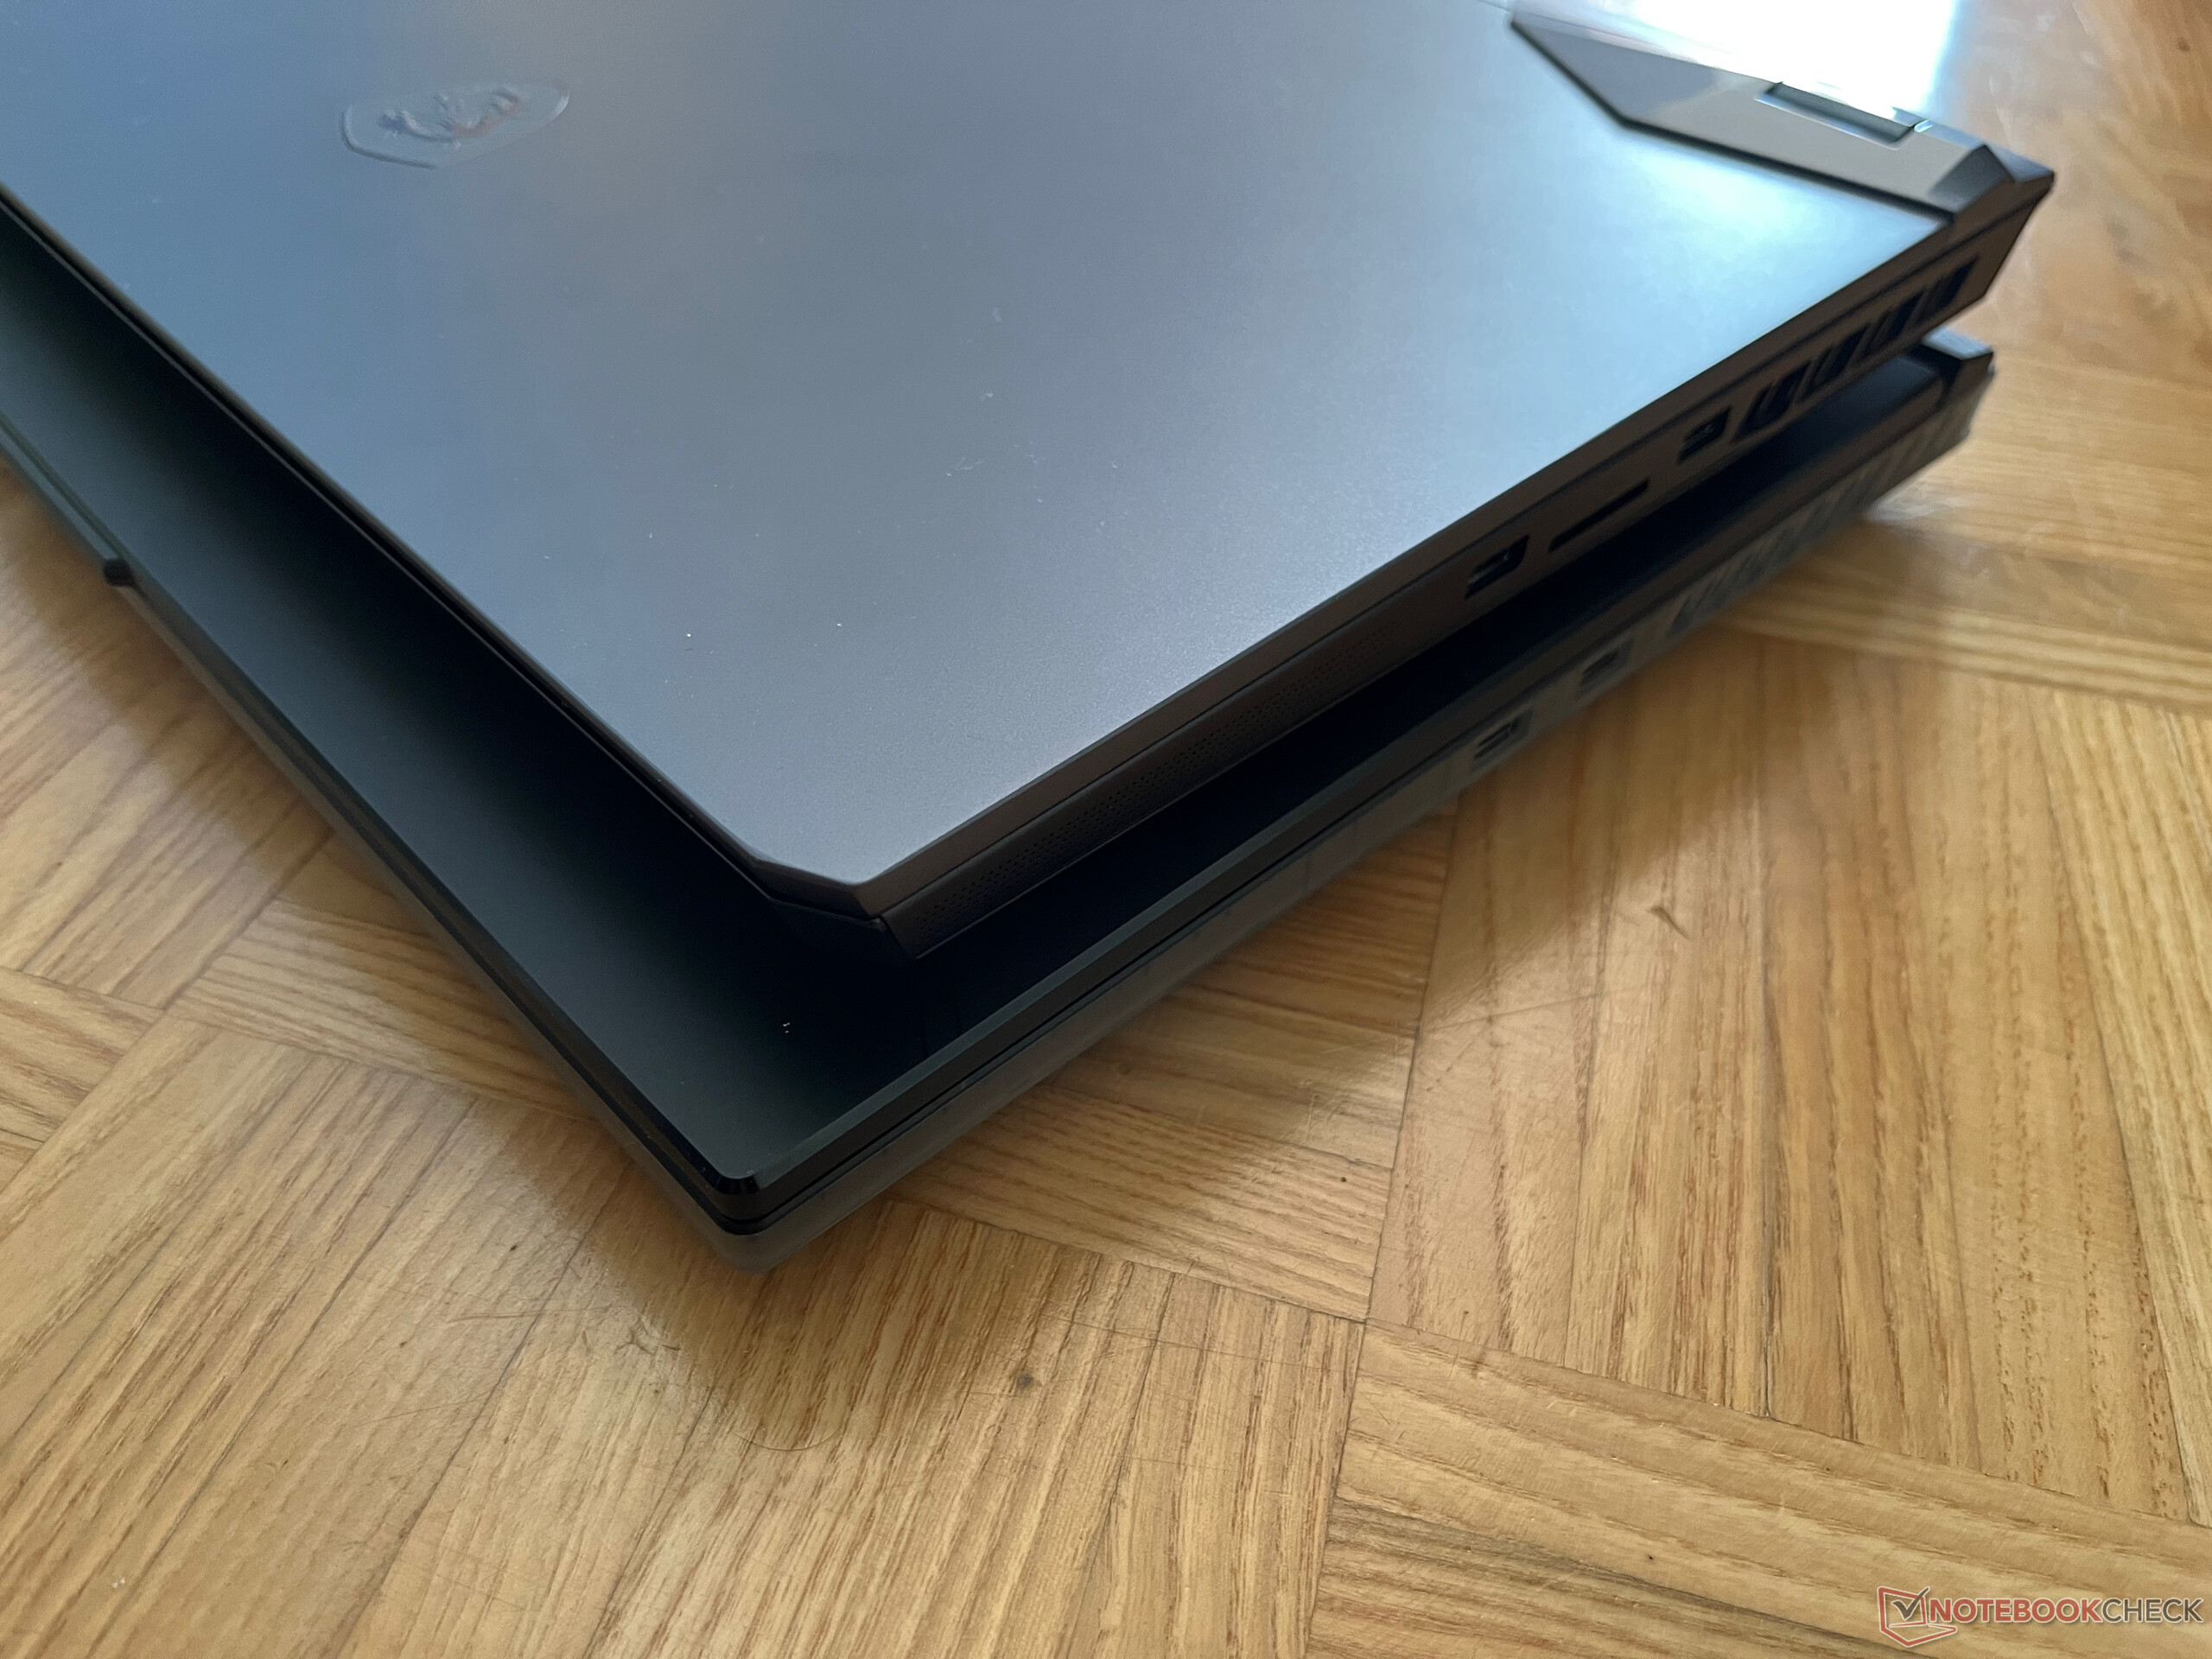
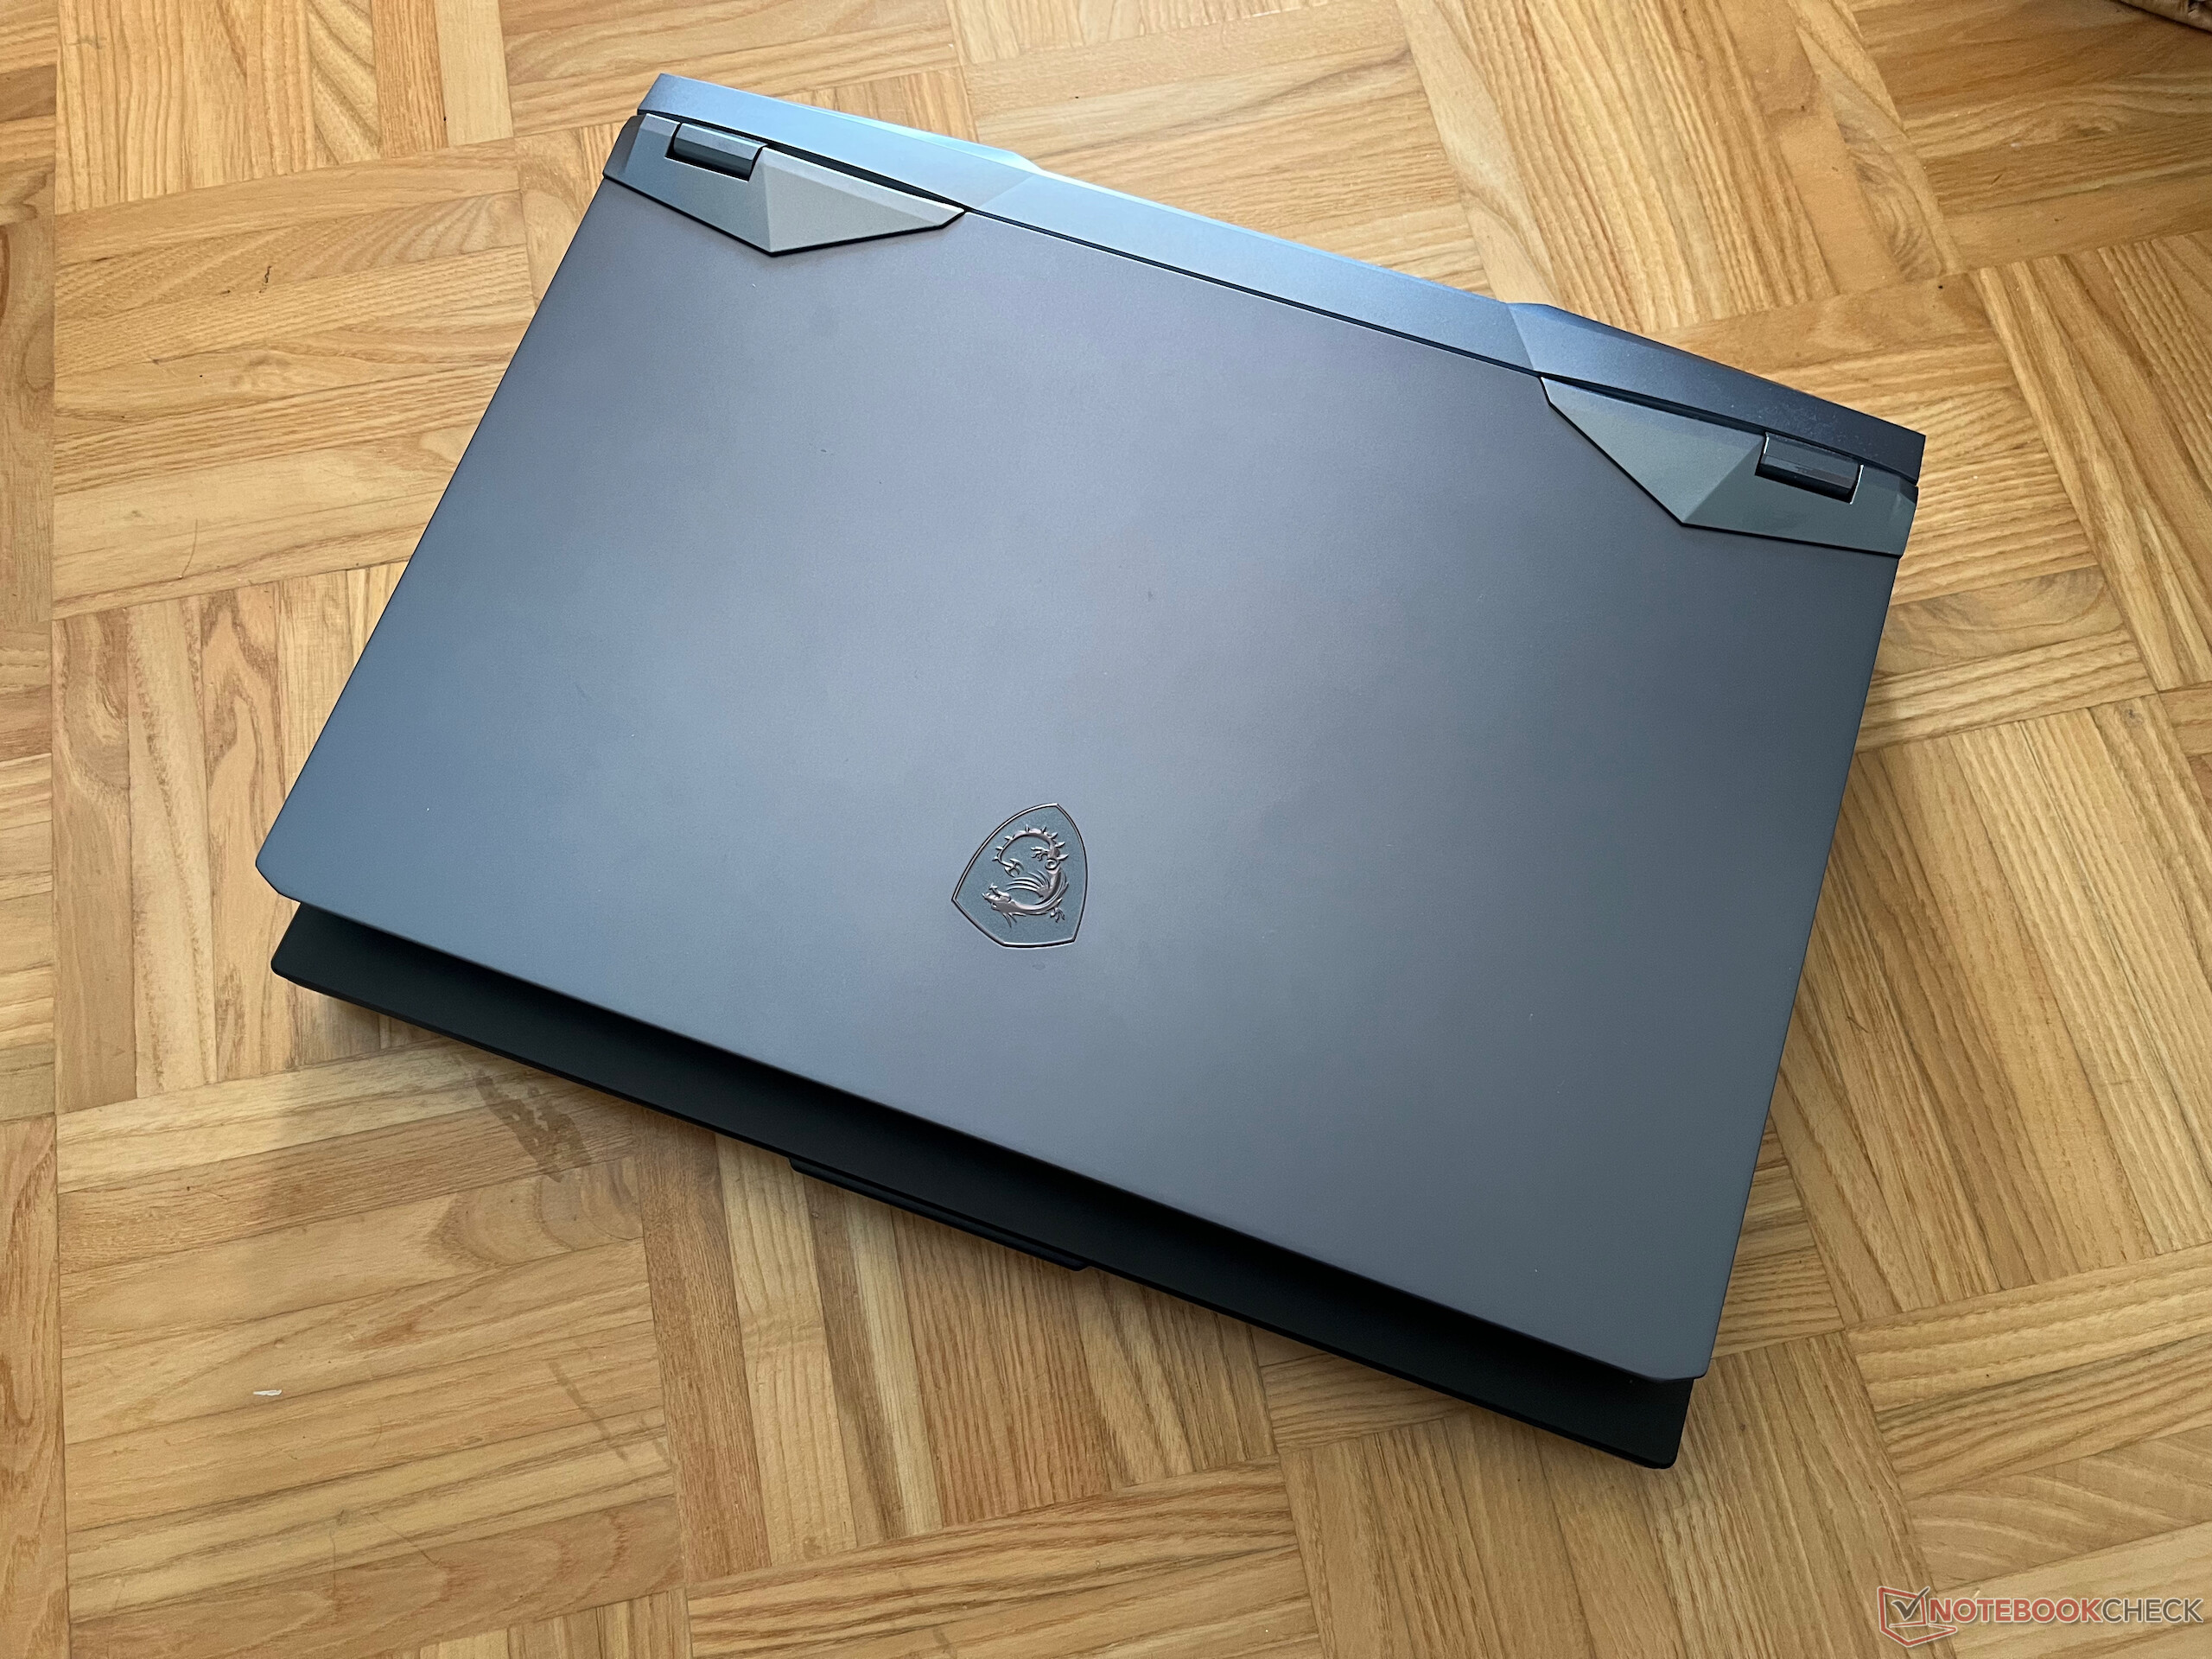
Az Asus ROG Strix SCAR 18 (2023) G834JY egy csúcskategóriás gamer laptop, amelyet az Asus a jelenleg elérhető legerősebb mobil komponensekkel szerelt fel. A nagyméretű házban egy nagyon jó 18 hüvelykes kijelző kapott helyet, amely gyors válaszidőt, G-SYNC-et és jó képminőséget biztosít a gamereknek. A G834JY csúcspontja azonban minden bizonnyal a nagy teljesítményű hardver: Core i9-13980HX, GeForce RTX 4090 laptop GPU (175 W TGP) és RAID-0 NVMe SSD. Bár ezek a komponensek terhelés alatt hatalmas mennyiségű hőt termelnek, az Asus ezt jól kordában tartja a három ventilátoros hűtőrendszerrel, nagy hűtőbordával és folyékony fém pasztával.
A ROG Strix SCAR 18 egy jól összeállított csomag, lenyűgöző teljesítménnyel és borsos áron.
Csak néhány apróbb ponton kritizálhatjuk, mint például az általunk tesztelt készülékben magas képkockasebességnél a „coil whine”, a gyenge webkamera vagy a portok elhelyezése, ami bizonyos esetekben nem optimális.
Alternatívaként ajánlhatjuk az Alienware (m18 R1) és a Razer (Blade 18) 18 hüvelykes, RTX 4090 GPU-val szerelt modelljeit. Az MSI a kicsivel gyorsabb Titan GT77 HX 13VI-t kínálja 17 hüvelykes kijelzővel. Aki beéri valamivel kevesebb teljesítménnyel, az megvizsgálhatja az RTX 4080 alapú modelleket, amelyek lényegesen kedvezőbb árúak. A Scar 18 modell G834JZ változata itt is érdekes alternatívát jelenthet.
Ár és Elérhetőség
Az általunk tesztelt G834JY-N6000W jelenleg csak Angliában kapható 3999.99 fontért (listaár). Egyes amerikai üzletek jelenleg 3899.99 dollárért kínálják a G834JY-XS97-et (az Asus-nál már nincs raktáron), az Amazon pedig 5390 dollárért kínálja a G834JY-XS97-et.
Asus ROG Strix Scar 18 2023 G834JY-N6005W
- 03/07/2023 v7 (old)
Klaus Hinum
Átláthatóság
A felülvizsgálandó készülékek kiválasztását szerkesztőségünk végzi. A tesztmintát a gyártó vagy a kiskereskedő kölcsönként bocsátotta a szerző rendelkezésére a felülvizsgálat céljából. A hitelezőnek nem volt befolyása erre a felülvizsgálatra, és a gyártó sem kapott másolatot erről a felülvizsgálatról a közzététel előtt. Nem volt kötelesség ezt az ismertetőt közzétenni. Független médiavállalatként a Notebookcheck nincs alávetve a gyártók, kiskereskedők vagy kiadók felhatalmazásának.
Így tesztel a Notebookcheck
A Notebookcheck minden évben független, laptopok és okostelefonok százait vizsgálja meg szabványosított eljárások alkalmazásával annak érdekében, hogy minden eredmény összehasonlítható legyen. Körülbelül 20 éve folyamatosan fejlesztjük vizsgálati módszereinket, és ennek során iparági szabványokat állítottunk fel. Tesztlaboratóriumainkban kiváló minőségű mérőberendezéseket használnak tapasztalt technikusok és szerkesztők. Ezek a tesztek többlépcsős validációs folyamatot foglalnak magukban. Komplex minősítési rendszerünk több száz megalapozott mérésen és benchmarkon alapul, ami megőrzi az objektivitást.Price comparison

