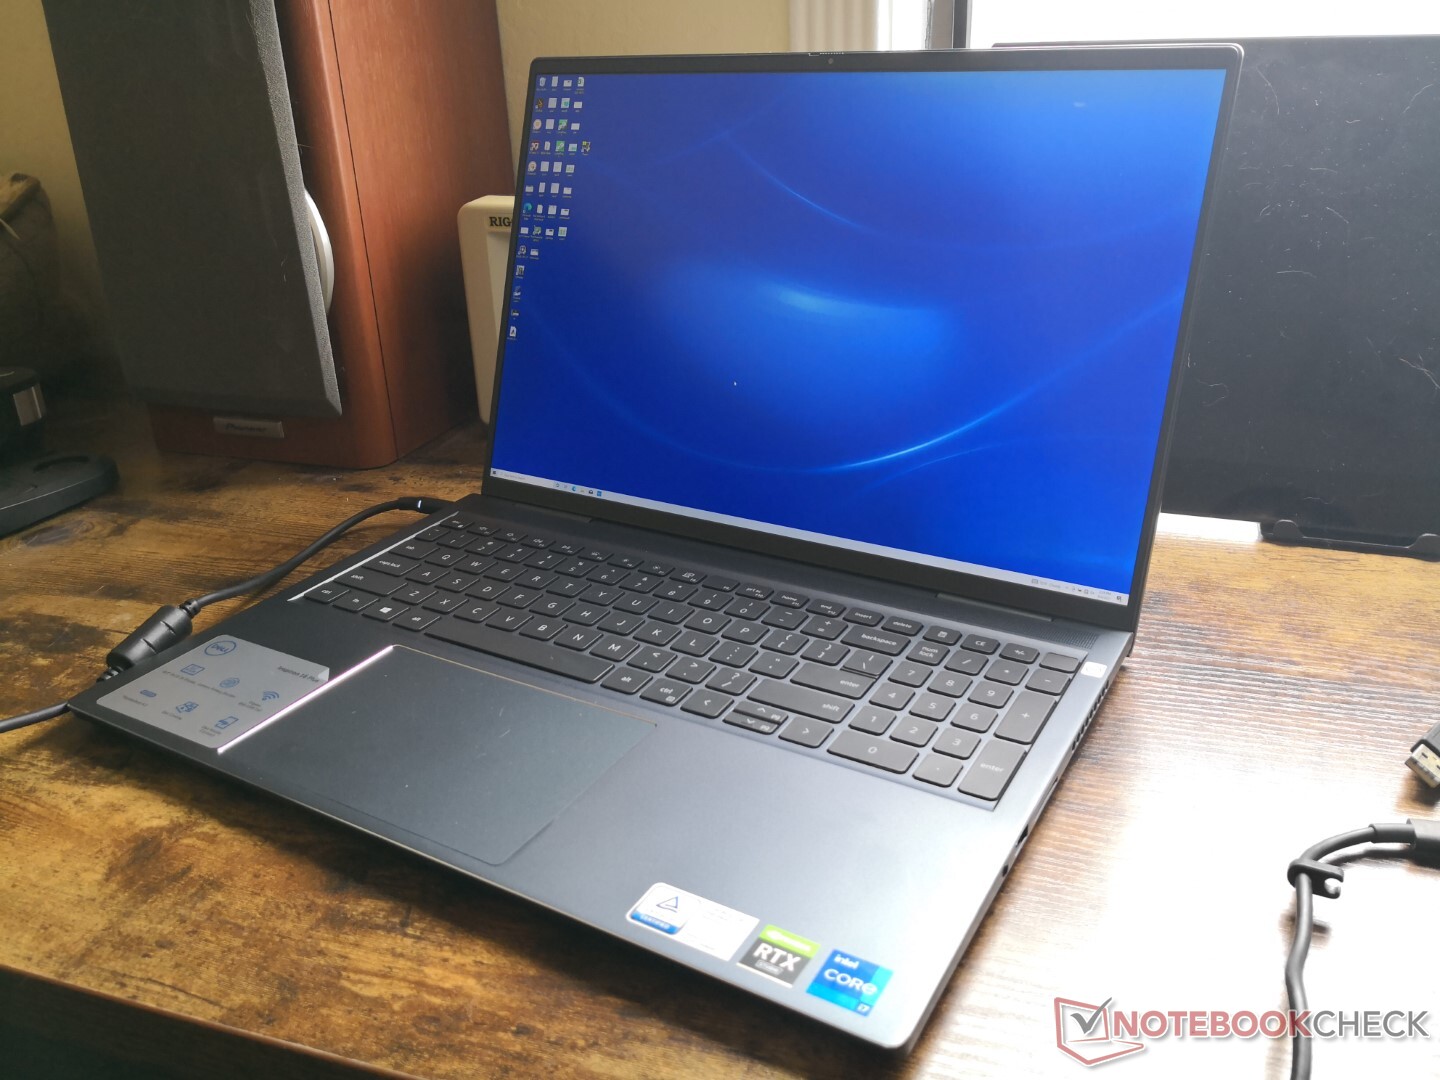
Szinte egy XPS 16: Dell Inspiron 16 Plus 7610 laptop rövid értékelés
potential competitors in comparison
Értékelés | Dátum | Modell | Súly | Magasság | Méret | Felbontás | Legjobb ár |
|---|---|---|---|---|---|---|---|
| 86.7 % v7 (old) | 09/2021 | Dell Inspiron 16 Plus 7610 i7-11800H, GeForce RTX 3050 4GB Laptop GPU | 2 kg | 18.99 mm | 16.00" | 3072x1920 | |
| 87.4 % v7 (old) | 09/2021 | Lenovo Legion 5 Pro 16ACH6H (82JQ001PGE) R7 5800H, GeForce RTX 3070 Laptop GPU | 2.6 kg | 26.85 mm | 16.00" | 2560x1600 | |
| 85.6 % v7 (old) | 09/2021 | Asus ROG Zephyrus M16 GU603H i9-11900H, GeForce RTX 3070 Laptop GPU | 2 kg | 20 mm | 16.00" | 2560x1600 | |
| 86.3 % v7 (old) | 09/2021 | LG Gram 16 (2021) i7-1165G7, Iris Xe G7 96EUs | 1.2 kg | 16.8 mm | 16.00" | 2560x1600 | |
| 79.9 % v7 (old) | HP Pavilion Gaming 16-a0242ng i5-10300H, GeForce GTX 1650 Ti Mobile | 2.2 kg | 23.5 mm | 16.10" | 1920x1080 | ||
| 82.4 % v7 (old) | 02/2021 | Dell Inspiron 15 7000 7506 2-in-1 Black Edition i7-1165G7, Xe MAX | 1.9 kg | 17.94 mm | 15.60" | 3840x2160 |
| SD Card Reader | |
| average JPG Copy Test (av. of 3 runs) | |
| Asus ROG Zephyrus M16 GU603H (AV PRO microSD 128 GB V60) | |
| LG Gram 16 (2021) (Toshiba Exceria Pro M501 microSDXC 64GB) | |
| HP Pavilion Gaming 16-a0242ng (Toshiba Exceria Pro SDXC 64 GB UHS-II) | |
| Dell Inspiron 15 7000 7506 2-in-1 Black Edition (Toshiba Exceria Pro M501 microSDXC 32GB) | |
| Dell Inspiron 16 Plus 7610 (AV PRO microSD 128 GB V60) | |
| maximum AS SSD Seq Read Test (1GB) | |
| Asus ROG Zephyrus M16 GU603H (AV PRO microSD 128 GB V60) | |
| LG Gram 16 (2021) (Toshiba Exceria Pro M501 microSDXC 64GB) | |
| HP Pavilion Gaming 16-a0242ng (Toshiba Exceria Pro SDXC 64 GB UHS-II) | |
| Dell Inspiron 15 7000 7506 2-in-1 Black Edition (Toshiba Exceria Pro M501 microSDXC 32GB) | |
| Dell Inspiron 16 Plus 7610 (AV PRO microSD 128 GB V60) | |
| Networking | |
| iperf3 transmit AX12 | |
| Lenovo Legion 5 Pro 16ACH6H (82JQ001PGE) | |
| LG Gram 16 (2021) | |
| Dell Inspiron 16 Plus 7610 | |
| Dell Inspiron 15 7000 7506 2-in-1 Black Edition | |
| HP Pavilion Gaming 16-a0242ng | |
| Asus ROG Zephyrus M16 GU603H | |
| iperf3 receive AX12 | |
| Dell Inspiron 16 Plus 7610 | |
| Lenovo Legion 5 Pro 16ACH6H (82JQ001PGE) | |
| Dell Inspiron 15 7000 7506 2-in-1 Black Edition | |
| Asus ROG Zephyrus M16 GU603H | |
| LG Gram 16 (2021) | |
| HP Pavilion Gaming 16-a0242ng | |


| |||||||||||||||||||||||||
Fényerő megoszlás: 87 %
Centrumban: 296.8 cd/m²
Kontraszt: 1413:1 (Fekete: 0.21 cd/m²)
ΔE ColorChecker Calman: 2.56 | ∀{0.5-29.43 Ø4.73}
calibrated: 1.86
ΔE Greyscale Calman: 2.6 | ∀{0.09-98 Ø4.97}
75.8% AdobeRGB 1998 (Argyll 3D)
99.4% sRGB (Argyll 3D)
74.1% Display P3 (Argyll 3D)
Gamma: 2.07
CCT: 6628 K
| Dell Inspiron 16 Plus 7610 AU Optronics B160QAN, IPS, 16", 3072x1920 | Lenovo Legion 5 Pro 16ACH6H (82JQ001PGE) CSOT T3 MNG007DA1-1, IPS, 16", 2560x1600 | Asus ROG Zephyrus M16 GU603H AU Optronics AUOC199, IPS, 16", 2560x1600 | LG Gram 16 (2021) LG Philips LP160WQ1-SPA1, IPS, 16", 2560x1600 | HP Pavilion Gaming 16-a0242ng BOE08F6, IPS, 16.1", 1920x1080 | Dell Inspiron 15 7000 7506 2-in-1 Black Edition AU Optronics B156ZAN, IPS, 15.6", 3840x2160 | |
|---|---|---|---|---|---|---|
| Display | -2% | 13% | -43% | -1% | ||
| Display P3 Coverage (%) | 74.1 | 95.8 29% | 40.42 -45% | 74.3 0% | ||
| sRGB Coverage (%) | 99.4 | 99 0% | 99.8 0% | 60.7 -39% | 99 0% | |
| AdobeRGB 1998 Coverage (%) | 75.8 | 73 -4% | 83.8 11% | 41.77 -45% | 74.6 -2% | |
| Response Times | 84% | 87% | 29% | 15% | -2% | |
| Response Time Grey 50% / Grey 80% * (ms) | 49.2 ? | 9.2 ? 81% | 4.8 ? 90% | 44 ? 11% | 43.2 ? 12% | 55.2 ? -12% |
| Response Time Black / White * (ms) | 36.8 ? | 4.8 87% | 6 ? 84% | 20 ? 46% | 30.4 ? 17% | 34 ? 8% |
| PWM Frequency (Hz) | ||||||
| Screen | 11% | -21% | -45% | -20% | -39% | |
| Brightness middle (cd/m²) | 296.8 | 551 86% | 448 51% | 331 12% | 319 7% | 303.8 2% |
| Brightness (cd/m²) | 292 | 523 79% | 446 53% | 309 6% | 306 5% | 296 1% |
| Brightness Distribution (%) | 87 | 88 1% | 86 -1% | 88 1% | 91 5% | 93 7% |
| Black Level * (cd/m²) | 0.21 | 0.54 -157% | 0.48 -129% | 0.22 -5% | 0.18 14% | 0.24 -14% |
| Contrast (:1) | 1413 | 1020 -28% | 933 -34% | 1505 7% | 1772 25% | 1266 -10% |
| Colorchecker dE 2000 * | 2.56 | 1.8 30% | 2.76 -8% | 4.64 -81% | 4 -56% | 4.58 -79% |
| Colorchecker dE 2000 max. * | 4.76 | 2.53 47% | 7.09 -49% | 9.82 -106% | 11.18 -135% | 9.4 -97% |
| Colorchecker dE 2000 calibrated * | 1.86 | 1.66 11% | 2.86 -54% | 3.16 -70% | 3.52 -89% | 2.17 -17% |
| Greyscale dE 2000 * | 2.6 | 1.85 29% | 3.1 -19% | 6.9 -165% | 1.53 41% | 6.4 -146% |
| Gamma | 2.07 106% | 2.3 96% | 2.153 102% | 2.34 94% | 2.39 92% | 2.3 96% |
| CCT | 6628 98% | 6338 103% | 6826 95% | 7904 82% | 6533 99% | 7414 88% |
| Color Space (Percent of AdobeRGB 1998) (%) | 72.81 | 87 | 75.1 | 38 | 66.7 | |
| Color Space (Percent of sRGB) (%) | 99.41 | 100 | 100 | 60 | 99 | |
| Teljes átlag (program / beállítások) | 31% /
20% | 33% /
-1% | -1% /
-22% | -16% /
-20% | -14% /
-26% |
* ... a kisebb jobb
Megjelenítési válaszidők
| ↔ Válaszidő Fekete-fehér | ||
|---|---|---|
| 36.8 ms ... emelkedés és süllyedés ↘ kombinálva | ↗ 20.8 ms emelkedés | 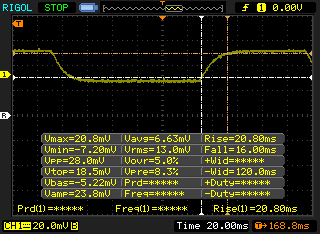 |
| ↘ 16 ms ősz | ||
| A képernyő lassú reakciósebességet mutat tesztjeinkben, és nem lesz kielégítő a játékosok számára. Összehasonlításképpen, az összes tesztelt eszköz 0.1 (minimum) és 240 (maximum) ms között mozog. » 95 % of all devices are better. Ez azt jelenti, hogy a mért válaszidő rosszabb, mint az összes vizsgált eszköz átlaga (19.9 ms). | ||
| ↔ Válaszidő 50% szürke és 80% szürke között | ||
| 49.2 ms ... emelkedés és süllyedés ↘ kombinálva | ↗ 24.8 ms emelkedés | 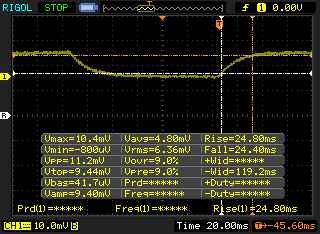 |
| ↘ 24.4 ms ősz | ||
| A képernyő lassú reakciósebességet mutat tesztjeinkben, és nem lesz kielégítő a játékosok számára. Összehasonlításképpen, az összes tesztelt eszköz 0.165 (minimum) és 636 (maximum) ms között mozog. » 85 % of all devices are better. Ez azt jelenti, hogy a mért válaszidő rosszabb, mint az összes vizsgált eszköz átlaga (31.1 ms). | ||
Képernyő villogása / PWM (impulzusszélesség-moduláció)
| Képernyő villogása / PWM nem érzékelhető |  | ||
Összehasonlításképpen: az összes tesztelt eszköz 52 %-a nem használja a PWM-et a kijelző elsötétítésére. Ha PWM-et észleltek, akkor átlagosan 7798 (minimum: 5 - maximum: 343500) Hz-t mértek. | |||
Cinebench R15 Multi Loop
Cinebench R23: Multi Core | Single Core
Cinebench R15: CPU Multi 64Bit | CPU Single 64Bit
Blender: v2.79 BMW27 CPU
7-Zip 18.03: 7z b 4 -mmt1 | 7z b 4
Geekbench 5.5: Single-Core | Multi-Core
HWBOT x265 Benchmark v2.2: 4k Preset
LibreOffice : 20 Documents To PDF
R Benchmark 2.5: Overall mean
| Cinebench R20 / CPU (Multi Core) | |
| Asus ROG Zephyrus M16 GU603H | |
| Asus TUF Gaming A15 FA506QR-AZ061T | |
| Átlagos Intel Core i7-11800H (2498 - 5408, n=50) | |
| Schenker XMG Core 15 Ampere | |
| Dell Inspiron 16 Plus 7610 | |
| Gigabyte Aero 15 OLED XC | |
| Asus ProArt StudioBook Pro 15 W500G5T | |
| Razer Blade 15 Advanced Model Early 2021 | |
| Acer Aspire Nitro 5 AN515-55-57GF | |
| Cinebench R20 / CPU (Single Core) | |
| Asus ROG Zephyrus M16 GU603H | |
| Dell Inspiron 16 Plus 7610 | |
| Átlagos Intel Core i7-11800H (520 - 586, n=47) | |
| Asus TUF Gaming A15 FA506QR-AZ061T | |
| Schenker XMG Core 15 Ampere | |
| Gigabyte Aero 15 OLED XC | |
| Razer Blade 15 Advanced Model Early 2021 | |
| Asus ProArt StudioBook Pro 15 W500G5T | |
| Acer Aspire Nitro 5 AN515-55-57GF | |
| Cinebench R23 / Multi Core | |
| Átlagos Intel Core i7-11800H (6508 - 14088, n=48) | |
| Schenker XMG Core 15 Ampere | |
| Dell Inspiron 16 Plus 7610 | |
| Gigabyte Aero 15 OLED XC | |
| Razer Blade 15 Advanced Model Early 2021 | |
| Acer Aspire Nitro 5 AN515-55-57GF | |
| Cinebench R23 / Single Core | |
| Dell Inspiron 16 Plus 7610 | |
| Átlagos Intel Core i7-11800H (1386 - 1522, n=45) | |
| Schenker XMG Core 15 Ampere | |
| Gigabyte Aero 15 OLED XC | |
| Razer Blade 15 Advanced Model Early 2021 | |
| Acer Aspire Nitro 5 AN515-55-57GF | |
| Cinebench R15 / CPU Multi 64Bit | |
| Asus ROG Zephyrus M16 GU603H | |
| Asus TUF Gaming A15 FA506QR-AZ061T | |
| Schenker XMG Core 15 Ampere | |
| Átlagos Intel Core i7-11800H (1342 - 2173, n=50) | |
| Gigabyte Aero 15 OLED XC | |
| Dell Inspiron 16 Plus 7610 | |
| Asus ProArt StudioBook Pro 15 W500G5T | |
| Razer Blade 15 Advanced Model Early 2021 | |
| Acer Aspire Nitro 5 AN515-55-57GF | |
| Cinebench R15 / CPU Single 64Bit | |
| Asus ROG Zephyrus M16 GU603H | |
| Asus TUF Gaming A15 FA506QR-AZ061T | |
| Dell Inspiron 16 Plus 7610 | |
| Átlagos Intel Core i7-11800H (201 - 231, n=46) | |
| Gigabyte Aero 15 OLED XC | |
| Razer Blade 15 Advanced Model Early 2021 | |
| Schenker XMG Core 15 Ampere | |
| Asus ProArt StudioBook Pro 15 W500G5T | |
| Acer Aspire Nitro 5 AN515-55-57GF | |
| Blender / v2.79 BMW27 CPU | |
| Acer Aspire Nitro 5 AN515-55-57GF | |
| Asus ProArt StudioBook Pro 15 W500G5T | |
| Razer Blade 15 Advanced Model Early 2021 | |
| Gigabyte Aero 15 OLED XC | |
| Átlagos Intel Core i7-11800H (217 - 454, n=46) | |
| Dell Inspiron 16 Plus 7610 | |
| Asus TUF Gaming A15 FA506QR-AZ061T | |
| Schenker XMG Core 15 Ampere | |
| Asus ROG Zephyrus M16 GU603H | |
| 7-Zip 18.03 / 7z b 4 -mmt1 | |
| Asus ROG Zephyrus M16 GU603H | |
| Asus TUF Gaming A15 FA506QR-AZ061T | |
| Dell Inspiron 16 Plus 7610 | |
| Átlagos Intel Core i7-11800H (5138 - 5732, n=46) | |
| Razer Blade 15 Advanced Model Early 2021 | |
| Gigabyte Aero 15 OLED XC | |
| Asus ProArt StudioBook Pro 15 W500G5T | |
| Acer Aspire Nitro 5 AN515-55-57GF | |
| Schenker XMG Core 15 Ampere | |
| 7-Zip 18.03 / 7z b 4 | |
| Asus ROG Zephyrus M16 GU603H | |
| Asus TUF Gaming A15 FA506QR-AZ061T | |
| Schenker XMG Core 15 Ampere | |
| Átlagos Intel Core i7-11800H (33718 - 56758, n=46) | |
| Dell Inspiron 16 Plus 7610 | |
| Gigabyte Aero 15 OLED XC | |
| Razer Blade 15 Advanced Model Early 2021 | |
| Asus ProArt StudioBook Pro 15 W500G5T | |
| Acer Aspire Nitro 5 AN515-55-57GF | |
| Geekbench 5.5 / Single-Core | |
| Asus ROG Zephyrus M16 GU603H | |
| Átlagos Intel Core i7-11800H (1429 - 1625, n=40) | |
| Asus TUF Gaming A15 FA506QR-AZ061T | |
| Razer Blade 15 Advanced Model Early 2021 | |
| Gigabyte Aero 15 OLED XC | |
| Asus ProArt StudioBook Pro 15 W500G5T | |
| Schenker XMG Core 15 Ampere | |
| Acer Aspire Nitro 5 AN515-55-57GF | |
| Geekbench 5.5 / Multi-Core | |
| Asus ROG Zephyrus M16 GU603H | |
| Átlagos Intel Core i7-11800H (4655 - 9851, n=40) | |
| Schenker XMG Core 15 Ampere | |
| Gigabyte Aero 15 OLED XC | |
| Asus TUF Gaming A15 FA506QR-AZ061T | |
| Razer Blade 15 Advanced Model Early 2021 | |
| Asus ProArt StudioBook Pro 15 W500G5T | |
| Acer Aspire Nitro 5 AN515-55-57GF | |
| HWBOT x265 Benchmark v2.2 / 4k Preset | |
| Asus ROG Zephyrus M16 GU603H | |
| Átlagos Intel Core i7-11800H (7.38 - 17.4, n=46) | |
| Schenker XMG Core 15 Ampere | |
| Asus TUF Gaming A15 FA506QR-AZ061T | |
| Dell Inspiron 16 Plus 7610 | |
| Gigabyte Aero 15 OLED XC | |
| Razer Blade 15 Advanced Model Early 2021 | |
| Asus ProArt StudioBook Pro 15 W500G5T | |
| Acer Aspire Nitro 5 AN515-55-57GF | |
| LibreOffice / 20 Documents To PDF | |
| Gigabyte Aero 15 OLED XC | |
| Acer Aspire Nitro 5 AN515-55-57GF | |
| Asus ProArt StudioBook Pro 15 W500G5T | |
| Schenker XMG Core 15 Ampere | |
| Razer Blade 15 Advanced Model Early 2021 | |
| Asus TUF Gaming A15 FA506QR-AZ061T | |
| Átlagos Intel Core i7-11800H (38.6 - 59.9, n=45) | |
| Dell Inspiron 16 Plus 7610 | |
| Asus ROG Zephyrus M16 GU603H | |
| R Benchmark 2.5 / Overall mean | |
| Asus ProArt StudioBook Pro 15 W500G5T | |
| Acer Aspire Nitro 5 AN515-55-57GF | |
| Razer Blade 15 Advanced Model Early 2021 | |
| Gigabyte Aero 15 OLED XC | |
| Schenker XMG Core 15 Ampere | |
| Átlagos Intel Core i7-11800H (0.548 - 0.615, n=46) | |
| Dell Inspiron 16 Plus 7610 | |
| Asus ROG Zephyrus M16 GU603H | |
| Asus TUF Gaming A15 FA506QR-AZ061T | |
* ... a kisebb jobb
| PCMark 10 / Score | |
| Asus ROG Zephyrus M16 GU603H | |
| Lenovo Legion 5 Pro 16ACH6H (82JQ001PGE) | |
| Dell Inspiron 16 Plus 7610 | |
| Átlagos Intel Core i7-11800H, NVIDIA GeForce RTX 3050 4GB Laptop GPU (n=1) | |
| Dell Inspiron 15 7000 7506 2-in-1 Black Edition | |
| LG Gram 16 (2021) | |
| HP Pavilion Gaming 16-a0242ng | |
| PCMark 10 / Essentials | |
| Asus ROG Zephyrus M16 GU603H | |
| LG Gram 16 (2021) | |
| Dell Inspiron 16 Plus 7610 | |
| Átlagos Intel Core i7-11800H, NVIDIA GeForce RTX 3050 4GB Laptop GPU (n=1) | |
| Dell Inspiron 15 7000 7506 2-in-1 Black Edition | |
| Lenovo Legion 5 Pro 16ACH6H (82JQ001PGE) | |
| HP Pavilion Gaming 16-a0242ng | |
| PCMark 10 / Productivity | |
| Asus ROG Zephyrus M16 GU603H | |
| Lenovo Legion 5 Pro 16ACH6H (82JQ001PGE) | |
| Dell Inspiron 16 Plus 7610 | |
| Átlagos Intel Core i7-11800H, NVIDIA GeForce RTX 3050 4GB Laptop GPU (n=1) | |
| HP Pavilion Gaming 16-a0242ng | |
| LG Gram 16 (2021) | |
| Dell Inspiron 15 7000 7506 2-in-1 Black Edition | |
| PCMark 10 / Digital Content Creation | |
| Asus ROG Zephyrus M16 GU603H | |
| Lenovo Legion 5 Pro 16ACH6H (82JQ001PGE) | |
| Dell Inspiron 16 Plus 7610 | |
| Átlagos Intel Core i7-11800H, NVIDIA GeForce RTX 3050 4GB Laptop GPU (n=1) | |
| Dell Inspiron 15 7000 7506 2-in-1 Black Edition | |
| HP Pavilion Gaming 16-a0242ng | |
| LG Gram 16 (2021) | |
| PCMark 10 Score | 6282 pontok | |
Segítség | ||
| DPC Latencies / LatencyMon - interrupt to process latency (max), Web, Youtube, Prime95 | |
| HP Pavilion Gaming 16-a0242ng | |
| Dell Inspiron 16 Plus 7610 | |
| Lenovo Legion 5 Pro 16ACH6H (82JQ001PGE) | |
| Asus ROG Zephyrus M16 GU603H | |
| LG Gram 16 (2021) | |
| Dell Inspiron 15 7000 7506 2-in-1 Black Edition | |
* ... a kisebb jobb
| Dell Inspiron 16 Plus 7610 Kingston OM3PDP3512B | Lenovo Legion 5 Pro 16ACH6H (82JQ001PGE) WDC PC SN730 SDBPNTY-1T00 | LG Gram 16 (2021) SK Hynix PC601 1TB HFS001TD9TNG | HP Pavilion Gaming 16-a0242ng Intel SSD 660p SSDPEKNW512G8 | Dell Inspiron 15 7000 7506 2-in-1 Black Edition Micron 2300 1TB MTFDHBA1T0TDV | |
|---|---|---|---|---|---|
| AS SSD | -28% | 57% | -23% | 31% | |
| Seq Read (MB/s) | 2077 | 2695 30% | 2808 35% | 1438 -31% | 1910 -8% |
| Seq Write (MB/s) | 778 | 2384 206% | 2345 201% | 905 16% | 2795 259% |
| 4K Read (MB/s) | 49.6 | 29.75 -40% | 50.2 1% | 50.3 1% | 50.5 2% |
| 4K Write (MB/s) | 236.1 | 52 -78% | 138.6 -41% | 111.7 -53% | 103.8 -56% |
| 4K-64 Read (MB/s) | 801 | 1193 49% | 1584 98% | 324 -60% | 1485 85% |
| 4K-64 Write (MB/s) | 942 | 1107 18% | 1687 79% | 729 -23% | 1820 93% |
| Access Time Read * (ms) | 0.06 | 0.136 -127% | 0.035 42% | 0.105 -75% | 0.056 7% |
| Access Time Write * (ms) | 0.073 | 0.36 -393% | 0.028 62% | 0.047 36% | 0.282 -286% |
| Score Read (Points) | 1059 | 1493 41% | 1915 81% | 518 -51% | 1727 63% |
| Score Write (Points) | 1256 | 1397 11% | 2060 64% | 931 -26% | 2203 75% |
| Score Total (Points) | 2804 | 3636 30% | 4934 76% | 1707 -39% | 4863 73% |
| Copy ISO MB/s (MB/s) | 1028 | 1007 -2% | 1852 80% | 1145 11% | 1892 84% |
| Copy Program MB/s (MB/s) | 794 | 43.11 -95% | 704 -11% | 602 -24% | 649 -18% |
| Copy Game MB/s (MB/s) | 987 | 621 -37% | 1329 35% | 929 -6% | 1558 58% |
| CrystalDiskMark 5.2 / 6 | 13% | 49% | 51% | ||
| Write 4K (MB/s) | 176.8 | 89.9 -49% | 204.2 15% | 111.4 -37% | |
| Read 4K (MB/s) | 52.3 | 30.98 -41% | 47.14 -10% | 53.4 2% | |
| Write Seq (MB/s) | 1170 | 2521 115% | 2598 122% | ||
| Read Seq (MB/s) | 1557 | 1748 12% | 2308 48% | ||
| Write 4K Q32T1 (MB/s) | 471.5 | 371.6 -21% | 669 42% | 644 37% | |
| Read 4K Q32T1 (MB/s) | 437.9 | 470.6 7% | 760 74% | 665 52% | |
| Write Seq Q32T1 (MB/s) | 1214 | 3065 152% | 2513 107% | 3147 159% | |
| Read Seq Q32T1 (MB/s) | 2549 | 3370 32% | 3452 35% | 3242 27% | |
| Write 4K Q8T8 (MB/s) | 1619 | ||||
| Read 4K Q8T8 (MB/s) | 1670 | ||||
| Teljes átlag (program / beállítások) | -8% /
-15% | 53% /
54% | -23% /
-23% | 41% /
38% |
* ... a kisebb jobb

Disk Throttling: DiskSpd Read Loop, Queue Depth 8
| 3DMark | |
| 1920x1080 Fire Strike Graphics | |
| Asus TUF Gaming F15 FX506HM | |
| Lenovo Legion C7 15IMH05 82EH0030GE | |
| MSI Stealth 15M A11SEK | |
| HP Gaming Pavilion 15-dk0009ng | |
| Dell Inspiron 16 Plus 7610 | |
| Asus Zephyrus S GX531GM | |
| Acer Nitro 5 AN515-45-R05E | |
| 2560x1440 Time Spy Graphics | |
| Asus TUF Gaming F15 FX506HM | |
| Lenovo Legion C7 15IMH05 82EH0030GE | |
| MSI Stealth 15M A11SEK | |
| HP Gaming Pavilion 15-dk0009ng | |
| Dell Inspiron 16 Plus 7610 | |
| Asus Zephyrus S GX531GM | |
| Acer Nitro 5 AN515-45-R05E | |
| 2560x1440 Time Spy Score | |
| Lenovo Legion 5 Pro 16ACH6H (82JQ001PGE) | |
| Asus TUF Gaming F15 FX506HM | |
| Lenovo Legion C7 15IMH05 82EH0030GE | |
| MSI Stealth 15M A11SEK | |
| Dell Inspiron 16 Plus 7610 | |
| HP Gaming Pavilion 15-dk0009ng | |
| Acer Nitro 5 AN515-45-R05E | |
| Asus Zephyrus S GX531GM | |
| 2560x1440 Port Royal Graphics | |
| Lenovo Legion 5 Pro 16ACH6H (82JQ001PGE) | |
| Asus TUF Gaming F15 FX506HM | |
| Lenovo Legion C7 15IMH05 82EH0030GE | |
| HP Gaming Pavilion 15-dk0009ng | |
| Dell Inspiron 16 Plus 7610 | |
| 3DMark 11 | |
| 1280x720 Performance GPU | |
| Lenovo Legion 5 Pro 16ACH6H (82JQ001PGE) | |
| Asus TUF Gaming F15 FX506HM | |
| Lenovo Legion C7 15IMH05 82EH0030GE | |
| MSI Stealth 15M A11SEK | |
| HP Gaming Pavilion 15-dk0009ng | |
| Dell Inspiron 16 Plus 7610 | |
| Asus Zephyrus S GX531GM | |
| 1280x720 Performance Combined | |
| Lenovo Legion 5 Pro 16ACH6H (82JQ001PGE) | |
| Asus TUF Gaming F15 FX506HM | |
| Dell Inspiron 16 Plus 7610 | |
| HP Gaming Pavilion 15-dk0009ng | |
| MSI Stealth 15M A11SEK | |
| Asus Zephyrus S GX531GM | |
| 3DMark 11 Performance | 15605 pontok | |
| 3DMark Cloud Gate Standard Score | 32553 pontok | |
| 3DMark Fire Strike Score | 11545 pontok | |
| 3DMark Time Spy Score | 5078 pontok | |
Segítség | ||
Witcher 3 FPS Chart
| alacsony | közepes | magas | ultra | QHD | |
|---|---|---|---|---|---|
| GTA V (2015) | 179 | 174 | 131 | 68.3 | 48.9 |
| The Witcher 3 (2015) | 248.5 | 153.9 | 92.1 | 51.6 | |
| Dota 2 Reborn (2015) | 162 | 142 | 135 | 125 | |
| Final Fantasy XV Benchmark (2018) | 117 | 69.6 | 50.1 | 36.5 | |
| X-Plane 11.11 (2018) | 119 | 101 | 76.2 | ||
| Far Cry 5 (2018) | 138 | 88 | 80 | 74 | 51 |
| Strange Brigade (2018) | 274 | 125 | 101 | 87 | 63.4 |
| Shadow of the Tomb Raider (2018) | 118 | 81 | 71 | 61 | 39 |
| Far Cry New Dawn (2019) | 118 | 83 | 77 | 66 | 52 |
| Metro Exodus (2019) | 123 | 62.2 | 45.8 | 36.5 | 28.6 |
| The Division 2 (2019) | 132 | 77 | 66 | 50 | 32 |
| Borderlands 3 (2019) | 111.7 | 69.2 | 49.4 | 34.9 | 22.5 |
| GRID 2019 (2019) | 181 | 108 | 104 | 43 | 27 |
| Gears Tactics (2020) | 253 | 122 | 81 | 58 | 38 |
| F1 2020 (2020) | 218 | 134 | 113 | 81 | 59 |
| Horizon Zero Dawn (2020) | 99 | 75 | 62 | 56 | 46 |
| Watch Dogs Legion (2020) | 80 | 71 | 60 | 26 | 19 |
| Dirt 5 (2020) | 141 | 66 | 51 | 40 | 34 |
| Assassin´s Creed Valhalla (2020) | 99 | 56 | 36 | 27 | 24 |
| Immortals Fenyx Rising (2020) | 106 | 71 | 57 | 53 | 39 |
| Hitman 3 (2021) | 159.4 | 100.7 | 86.9 | 79.9 | 49.1 |
| F1 2021 (2021) | 186 | 130 | 110 | 52 | 36 |
| Dell Inspiron 16 Plus 7610 GeForce RTX 3050 4GB Laptop GPU, i7-11800H, Kingston OM3PDP3512B | Asus ROG Zephyrus M16 GU603H GeForce RTX 3070 Laptop GPU, i9-11900H, Samsung PM9A1 MZVL22T0HBLB | LG Gram 16 (2021) Iris Xe G7 96EUs, i7-1165G7, SK Hynix PC601 1TB HFS001TD9TNG | HP Pavilion Gaming 16-a0242ng GeForce GTX 1650 Ti Mobile, i5-10300H, Intel SSD 660p SSDPEKNW512G8 | Dell Inspiron 15 7000 7506 2-in-1 Black Edition Xe MAX, i7-1165G7, Micron 2300 1TB MTFDHBA1T0TDV | |
|---|---|---|---|---|---|
| Noise | -18% | 7% | -16% | -6% | |
| off / környezet * (dB) | 24.4 | 25 -2% | 26 -7% | 25 -2% | 27.3 -12% |
| Idle Minimum * (dB) | 24.4 | 25 -2% | 26 -7% | 25 -2% | 27.3 -12% |
| Idle Average * (dB) | 24.4 | 31 -27% | 26 -7% | 33 -35% | 27.3 -12% |
| Idle Maximum * (dB) | 24.4 | 42 -72% | 26 -7% | 42 -72% | 27.3 -12% |
| Load Average * (dB) | 48.3 | 48 1% | 30.8 36% | 48 1% | 47.4 2% |
| Witcher 3 ultra * (dB) | 48.9 | 52 -6% | 46 6% | 47.4 3% | |
| Load Maximum * (dB) | 48.9 | 56 -15% | 31.1 36% | 54 -10% | 47.5 3% |
* ... a kisebb jobb
Zajszint
| Üresjárat |
| 24.4 / 24.4 / 24.4 dB(A) |
| Terhelés |
| 48.3 / 48.9 dB(A) |
 | ||
30 dB csendes 40 dB(A) hallható 50 dB(A) hangos |
||
min: | ||
(-) A felső oldalon a maximális hőmérséklet 46.4 °C / 116 F, összehasonlítva a 36.8 °C / 98 F átlagával , 21 és 71 °C között a Multimedia osztálynál.
(-) Az alsó maximum 54.8 °C / 131 F-ig melegszik fel, összehasonlítva a 39.1 °C / 102 F átlagával
(+) Üresjáratban a felső oldal átlagos hőmérséklete 28.3 °C / 83 F, összehasonlítva a 31.3 °C / ### eszközátlaggal class_avg_f### F.
(±) A The Witcher 3 játék során a felső oldal átlaghőmérséklete 35.4 °C / 96 F, összehasonlítva a 31.3 °C / ## eszközátlaggal #class_avg_f### F.
(+) A csuklótámasz és az érintőpad hűvösebb, mint a bőr hőmérséklete, maximum 29 °C / 84.2 F, ezért hűvös tapintású.
(±) A hasonló eszközök csuklótámasz területének átlagos hőmérséklete 28.7 °C / 83.7 F volt (-0.3 °C / -0.5 F).
Dell Inspiron 16 Plus 7610 hangelemzés
(±) | a hangszóró hangereje átlagos, de jó (75.3 dB)
Basszus 100 - 315 Hz
(±) | csökkentett basszus – átlagosan 14.4%-kal alacsonyabb, mint a medián
(±) | a basszus linearitása átlagos (8.4% delta az előző frekvenciához)
Közepes 400-2000 Hz
(±) | magasabb középértékek – átlagosan 5.6%-kal magasabb, mint a medián
(±) | a középpontok linearitása átlagos (7.9% delta az előző gyakorisághoz)
Maximum 2-16 kHz
(+) | kiegyensúlyozott csúcsok – csak 3.9% választja el a mediántól
(±) | a csúcsok linearitása átlagos (7.2% delta az előző gyakorisághoz)
Összességében 100 - 16.000 Hz
(±) | az általános hang linearitása átlagos (19.3% eltérés a mediánhoz képest)
Ugyanazon osztályhoz képest
» 62%Ebben az osztályban az összes tesztelt eszköz %-a jobb volt, 8% hasonló, 30%-kal rosszabb
» A legjobb delta értéke 5%, az átlag 17%, a legrosszabb 45% volt
Az összes tesztelt eszközzel összehasonlítva
» 47% az összes tesztelt eszköz jobb volt, 8% hasonló, 46%-kal rosszabb
» A legjobb delta értéke 4%, az átlag 24%, a legrosszabb 134% volt
Apple MacBook 12 (Early 2016) 1.1 GHz hangelemzés
(+) | a hangszórók viszonylag hangosan tudnak játszani (83.6 dB)
Basszus 100 - 315 Hz
(±) | csökkentett basszus – átlagosan 11.3%-kal alacsonyabb, mint a medián
(±) | a basszus linearitása átlagos (14.2% delta az előző frekvenciához)
Közepes 400-2000 Hz
(+) | kiegyensúlyozott középpontok – csak 2.4% választja el a mediántól
(+) | a középpontok lineárisak (5.5% delta az előző frekvenciához)
Maximum 2-16 kHz
(+) | kiegyensúlyozott csúcsok – csak 2% választja el a mediántól
(+) | a csúcsok lineárisak (4.5% delta az előző frekvenciához képest)
Összességében 100 - 16.000 Hz
(+) | általános hangzás lineáris (10.2% eltérés a mediánhoz képest)
Ugyanazon osztályhoz képest
» 7%Ebben az osztályban az összes tesztelt eszköz %-a jobb volt, 2% hasonló, 91%-kal rosszabb
» A legjobb delta értéke 5%, az átlag 18%, a legrosszabb 53% volt
Az összes tesztelt eszközzel összehasonlítva
» 5% az összes tesztelt eszköz jobb volt, 1% hasonló, 94%-kal rosszabb
» A legjobb delta értéke 4%, az átlag 24%, a legrosszabb 134% volt
| Kikapcsolt állapot / Készenlét | |
| Üresjárat | |
| Terhelés |
|
Kulcs:
min: | |
| Dell Inspiron 16 Plus 7610 i7-11800H, GeForce RTX 3050 4GB Laptop GPU, Kingston OM3PDP3512B, IPS, 3072x1920, 16" | Asus ROG Zephyrus M16 GU603H i9-11900H, GeForce RTX 3070 Laptop GPU, Samsung PM9A1 MZVL22T0HBLB, IPS, 2560x1600, 16" | LG Gram 16 (2021) i7-1165G7, Iris Xe G7 96EUs, SK Hynix PC601 1TB HFS001TD9TNG, IPS, 2560x1600, 16" | HP Pavilion Gaming 16-a0242ng i5-10300H, GeForce GTX 1650 Ti Mobile, Intel SSD 660p SSDPEKNW512G8, IPS, 1920x1080, 16.1" | Dell Inspiron 15 7000 7506 2-in-1 Black Edition i7-1165G7, Xe MAX, Micron 2300 1TB MTFDHBA1T0TDV, IPS, 3840x2160, 15.6" | |
|---|---|---|---|---|---|
| Power Consumption | -53% | 46% | 19% | 23% | |
| Idle Minimum * (Watt) | 7.7 | 11 -43% | 3.8 51% | 3 61% | 4 48% |
| Idle Average * (Watt) | 10.7 | 20 -87% | 9 16% | 7 35% | 15.5 -45% |
| Idle Maximum * (Watt) | 16.8 | 30 -79% | 11.3 33% | 18 -7% | 16.2 4% |
| Load Average * (Watt) | 100.39 | 111 -11% | 35.2 65% | 86 14% | 49.7 50% |
| Witcher 3 ultra * (Watt) | 108 | 156 -44% | 82 24% | 52.2 52% | |
| Load Maximum * (Watt) | 129 | 197 -53% | 43.5 66% | 144 -12% | 92.7 28% |
* ... a kisebb jobb
Power Consumption Witcher 3 / Stresstest
| Dell Inspiron 16 Plus 7610 i7-11800H, GeForce RTX 3050 4GB Laptop GPU, 86 Wh | Lenovo Legion 5 Pro 16ACH6H (82JQ001PGE) R7 5800H, GeForce RTX 3070 Laptop GPU, 80 Wh | Asus ROG Zephyrus M16 GU603H i9-11900H, GeForce RTX 3070 Laptop GPU, 90 Wh | LG Gram 16 (2021) i7-1165G7, Iris Xe G7 96EUs, 80 Wh | HP Pavilion Gaming 16-a0242ng i5-10300H, GeForce GTX 1650 Ti Mobile, 52 Wh | Dell Inspiron 15 7000 7506 2-in-1 Black Edition i7-1165G7, Xe MAX, 68 Wh | |
|---|---|---|---|---|---|---|
| Akkumulátor üzemidő | -55% | -36% | 43% | -25% | -11% | |
| Reader / Idle (h) | 20.5 | 9.1 -56% | 13.3 -35% | 28.6 40% | 16.5 -20% | 25 22% |
| WiFi v1.3 (h) | 9.9 | 7 -29% | 7.7 -22% | 15.7 59% | 8.3 -16% | 9.7 -2% |
| Load (h) | 3.3 | 0.7 -79% | 1.6 -52% | 4.3 30% | 2 -39% | 1.6 -52% |
Pro
Kontra
Összegzés — Nagyszerű megjelenés, nem túl meggyőző teljesítmény
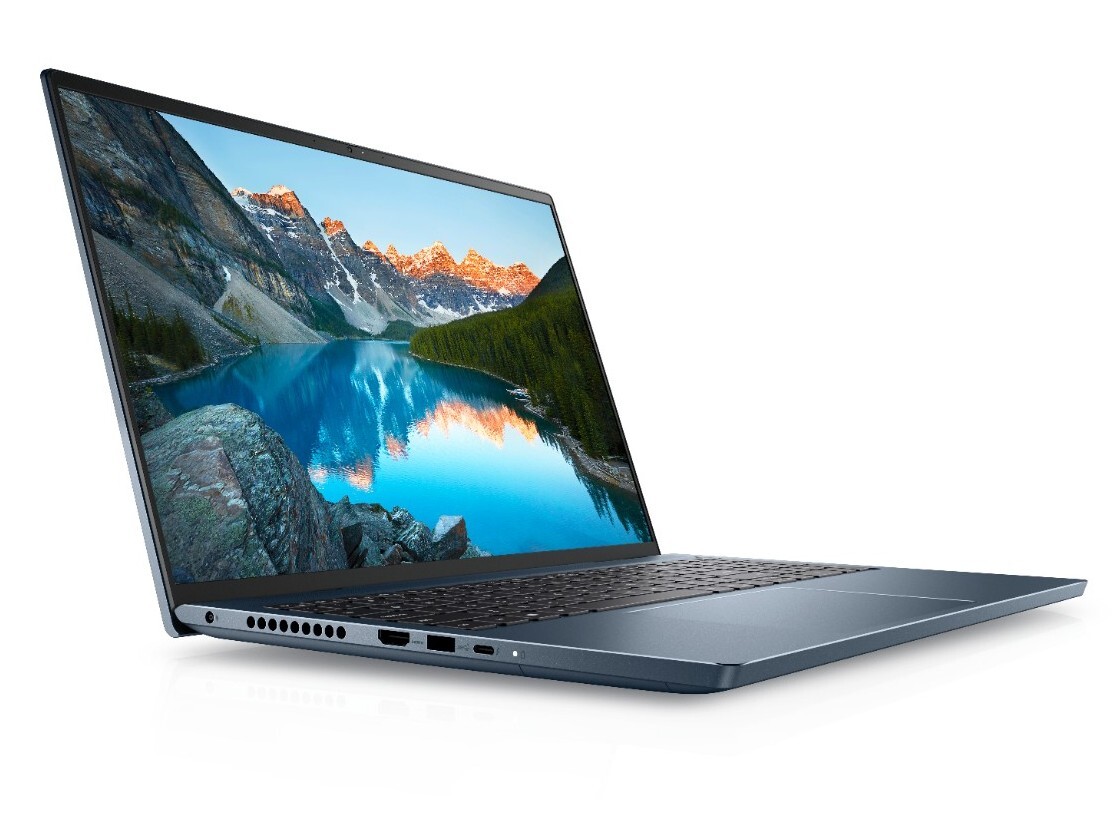
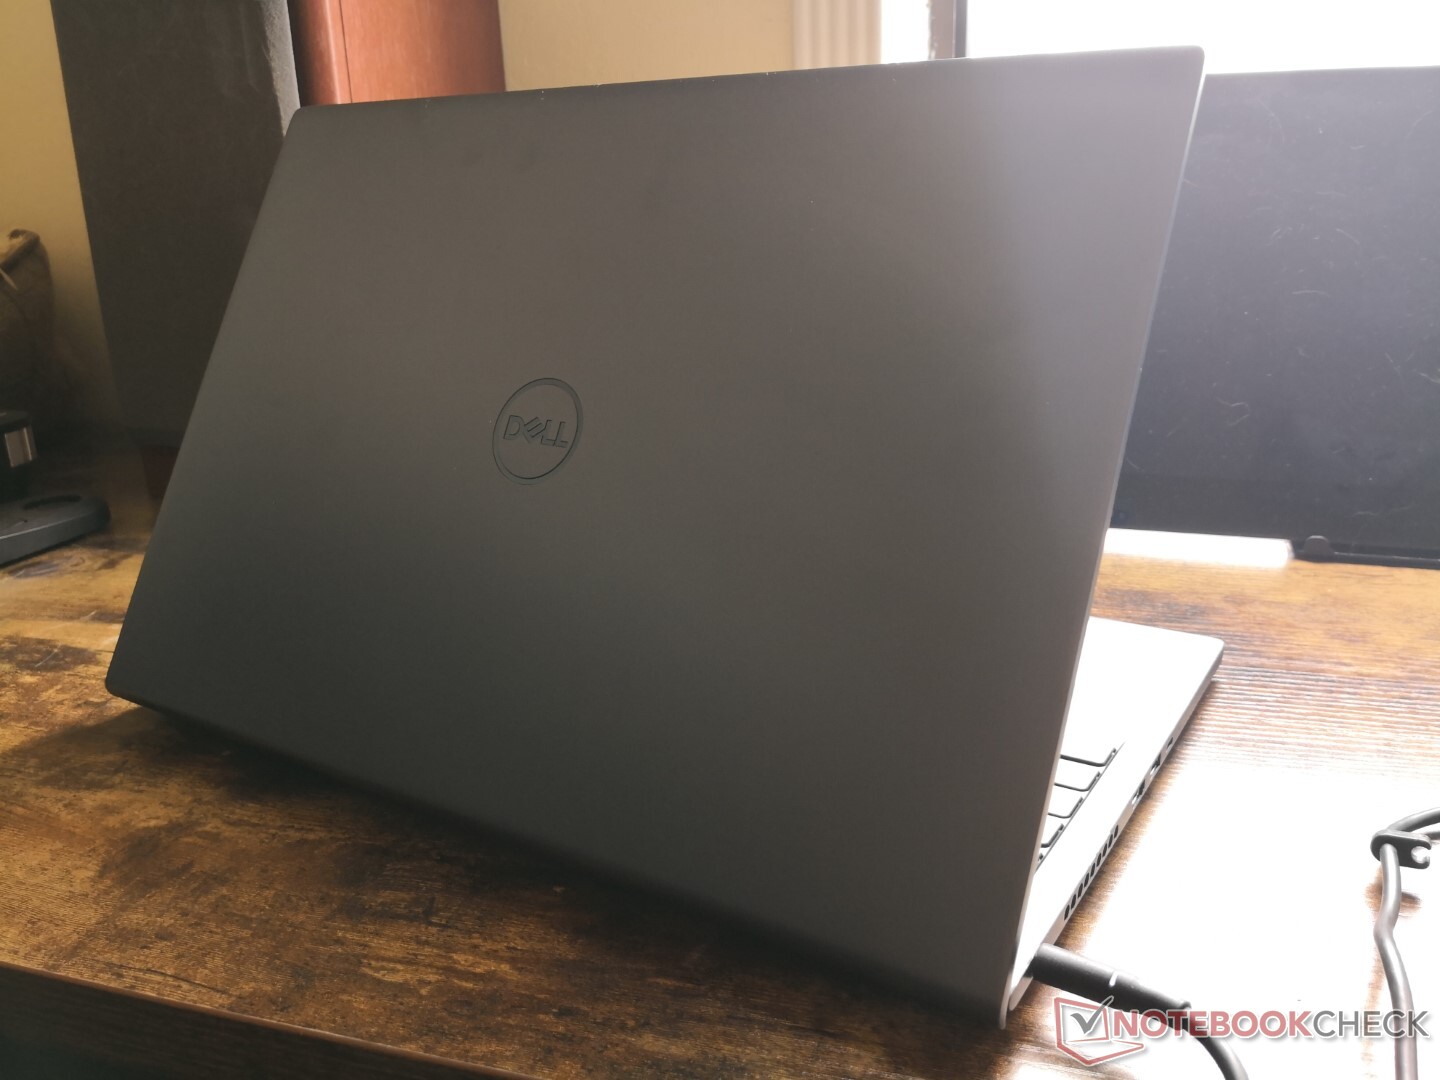
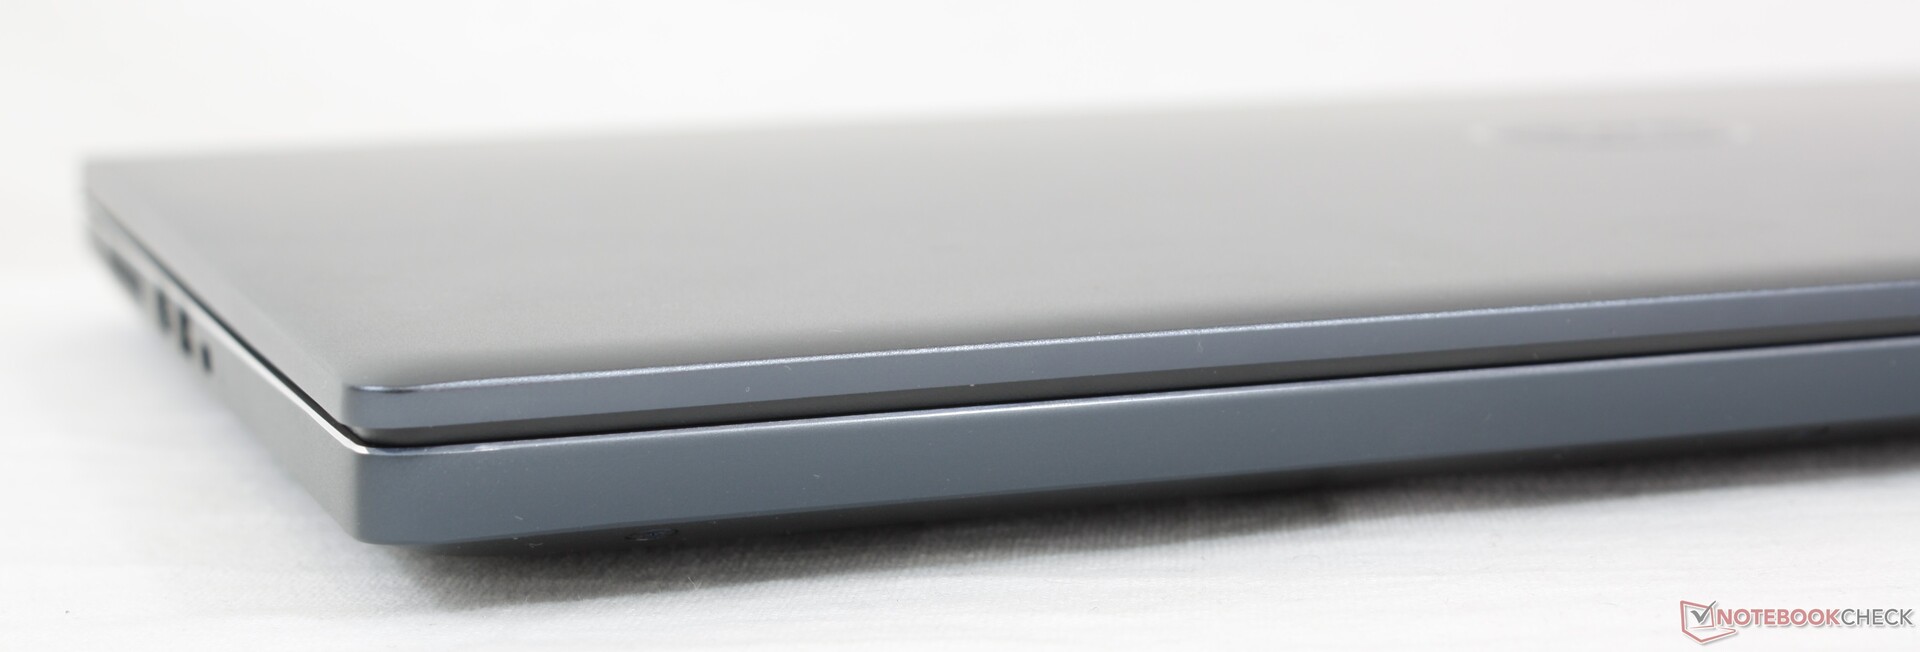
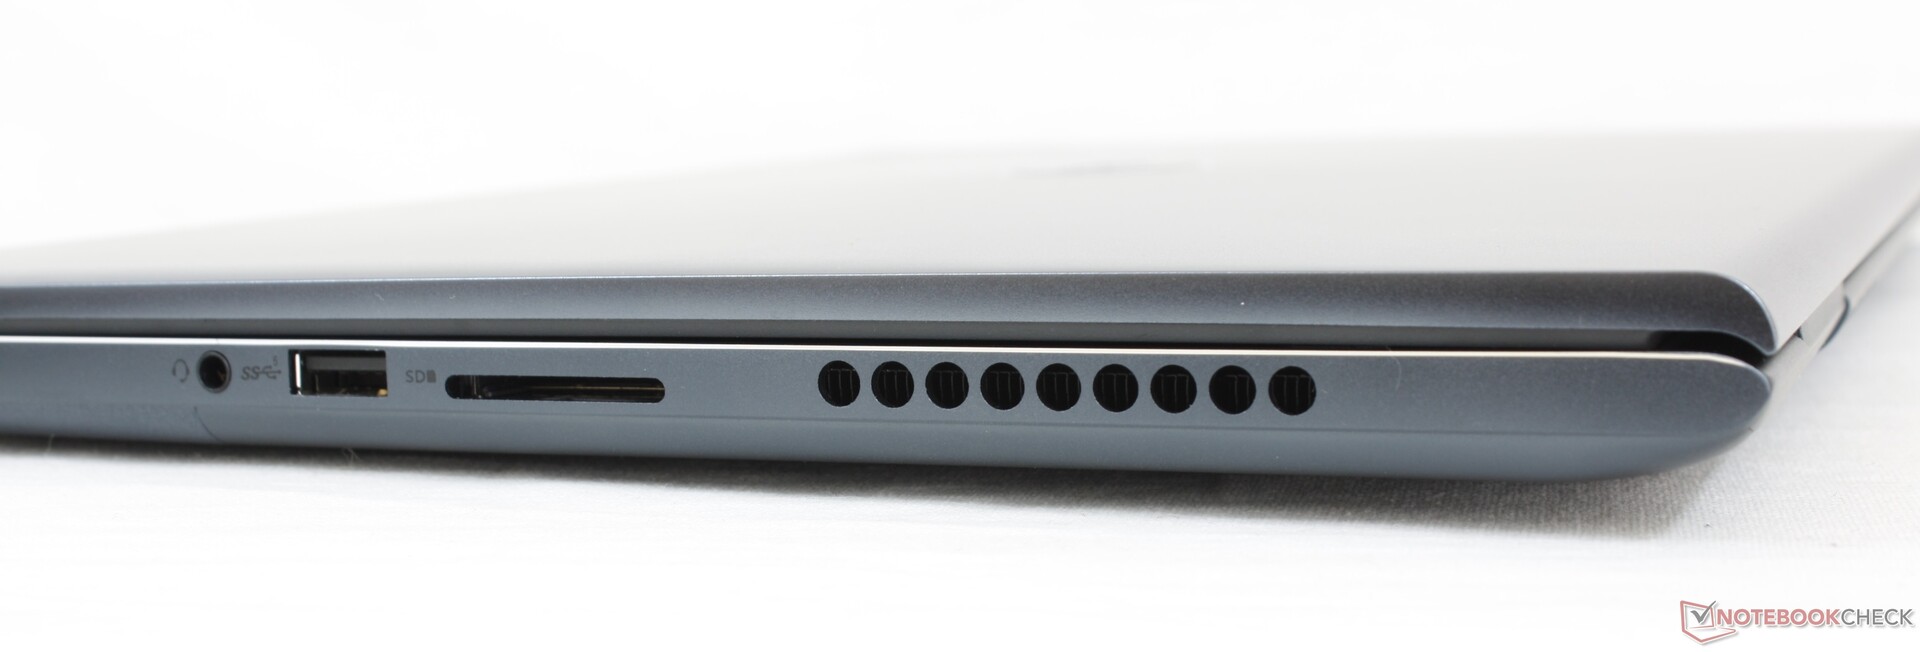
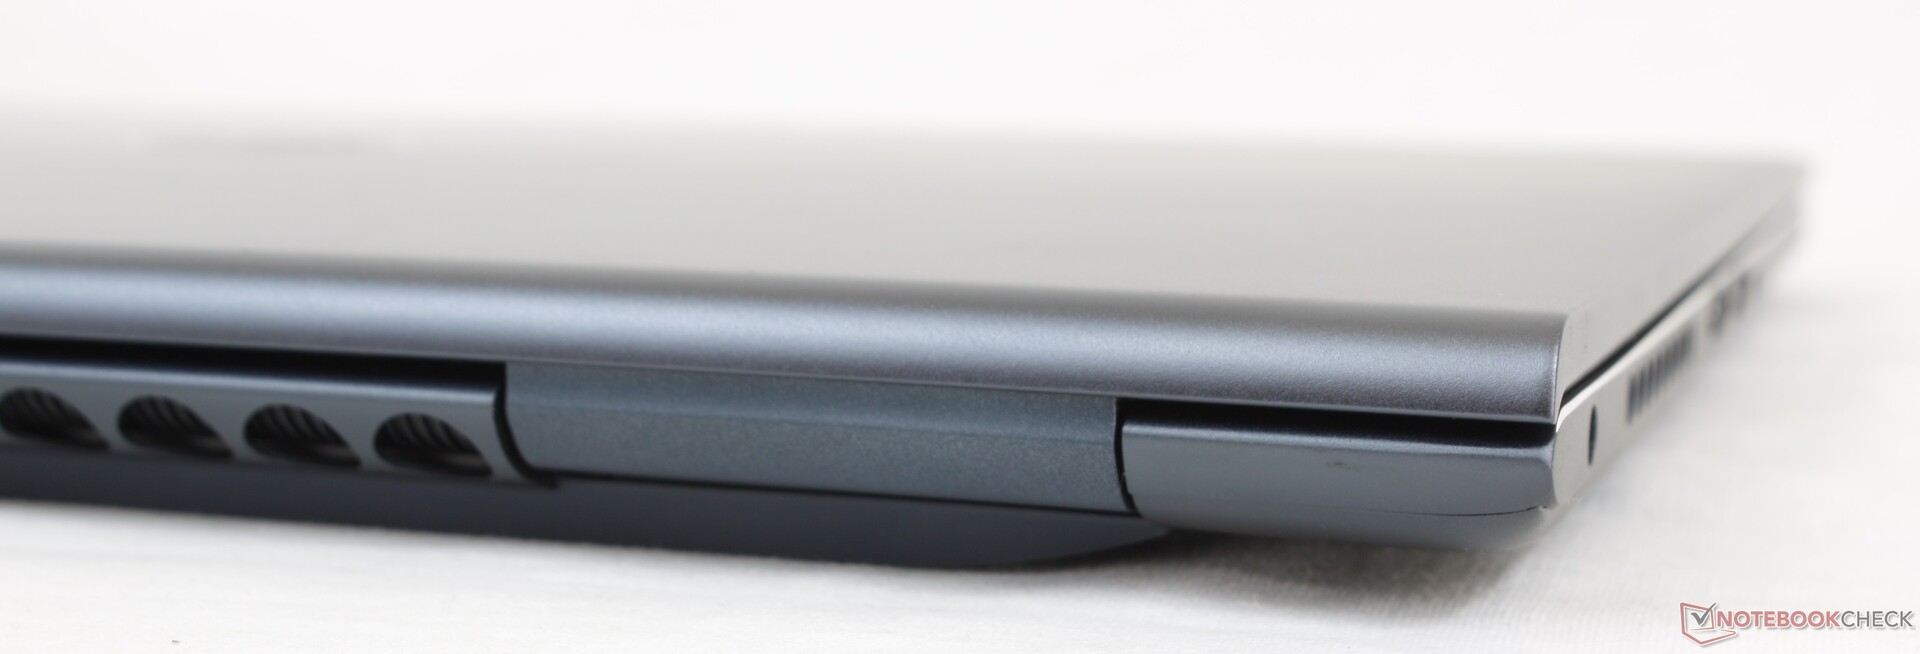
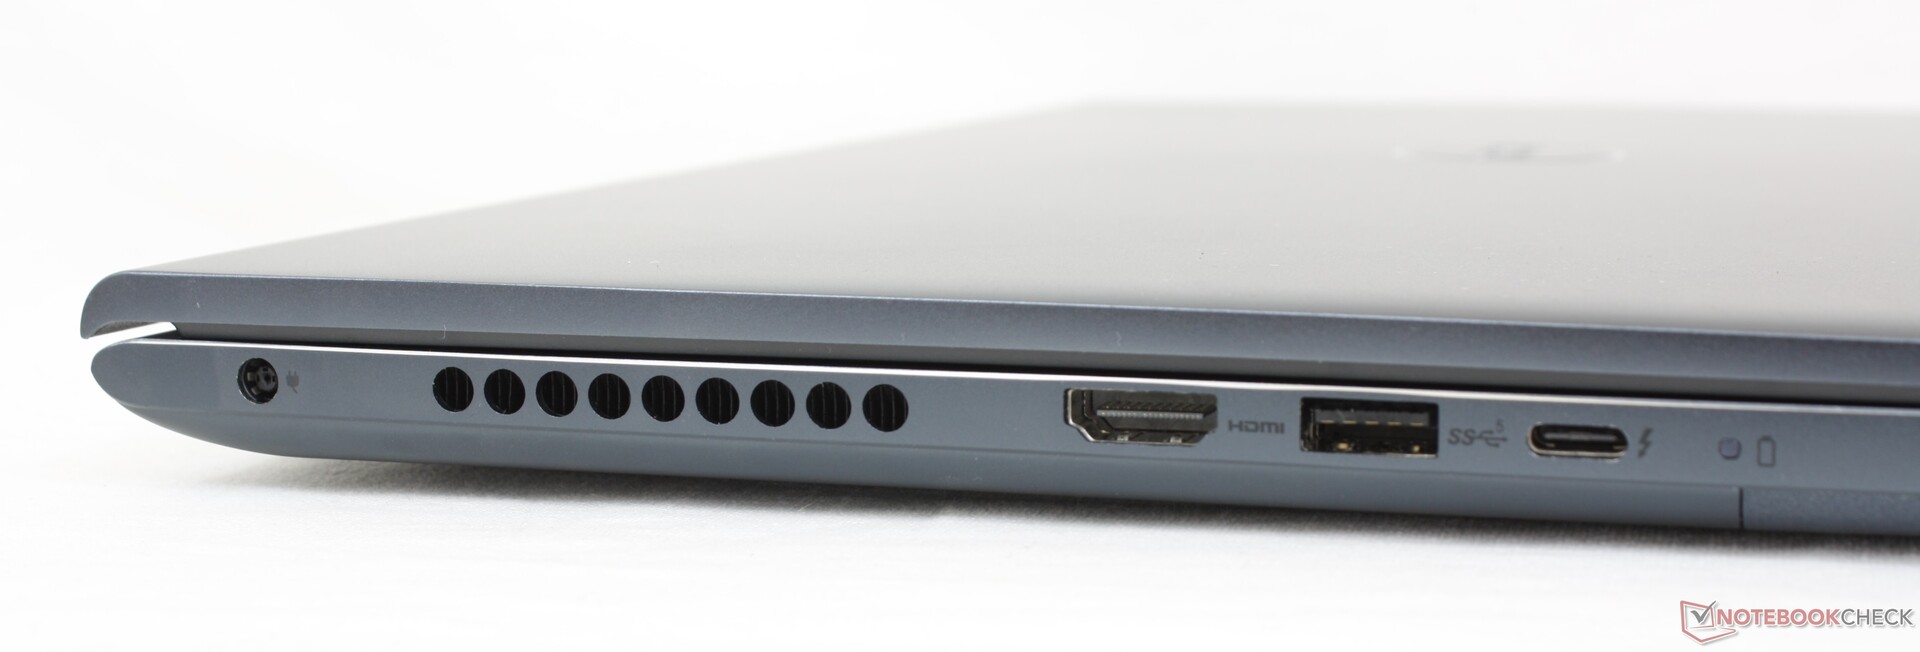
Vizuálisan az Inspiron 16 a legjobban kinéző modell a családban. Figyelembe véve a belsőben lévő energiaigényes processzorokat, a keretek keskenyebbek a vártnál, a súlyos fémváz pedig a tapintható minőség benyomását kelti, amely a drágább XPS 15-öséhez közelít. A portválaszték bőséges, a szervizelés viszonylag egyszerű, a matt 3K kijelző pedig megkoronázza az egészet, és mindez ami egy nagyszerű első megjelenést ad.
Az Inspiron 16 Plus 7610 egy remekül kinéző rendszer, rengeteg porttal és frissítési lehetőséggel, de az energiaéhes tartalomkészítők és multimédiás felhasználók számára elkelne néhány teljesítménybeli finomítás.
Teljesítmény szempontjából nem néznek ki ilyen rózsásan a dolgok. Sem a processzor, sem a GPU nem olyan gyors, mint vártuk, amikor más, azonos vagy hasonló opciókkal rendelkező modellekkel hasonlítjuk össze. Az ugyanazzal a Core i7-11800H CPU-val rendelkező Asus TUF F155 25 százalékkal gyorsabban fut, míg az MSI Stealth 15M régebbi RTX 2060-as videokártyával a legtöbb esetben jobban teljesít, mint a mi RTX 3050-esünk. Még a GTX 1660 Ti videokártyával rendelkező kétéves HP Gaming Pavilion 15 is eléri vagy megelőzi a mi Dell gépünket grafikus teljesítményben. Az érdeklődő felhasználóknak inkább a gyorsabb RTX 3060-as konfigurációt lenne érdemes fontolóra venniük. AMacBook Pro 16-tal vagy a Legion 5 Pro-val egyenrangú világosabb kijelző sem ártana azoknak a felhasználóknak, akik úton vannak.
Ár és elérhetőség
Az online elérhetőség a cikk írásakor korlátozott. Az Amazon jelenleg csak egy SKU-t kínál 989 USD-ért. A felhasználók ehelyett közvetlenül a Dell-től vásárolhatnak, ahol több konfigurálható opció is elérhető.
Dell Inspiron 16 Plus 7610
- 08/11/2021 v7 (old)
Allen Ngo
Price comparison

