MSI Katana 17 B13V laptop rövid értékelés: Bemutatkozik az Nvidia GeForce RTX 4060
Possible competitors compared
Értékelés | Dátum | Modell | Súly | Magasság | Méret | Felbontás | Legjobb ár |
|---|---|---|---|---|---|---|---|
| 82.1 % v7 (old) | 03/2023 | MSI Katana 17 B13VFK i7-13620H, GeForce RTX 4060 Laptop GPU | 2.8 kg | 25.2 mm | 17.30" | 1920x1080 | |
| 89 % v7 (old) | 05/2023 | MSI Titan GT77 HX 13VI i9-13950HX, GeForce RTX 4090 Laptop GPU | 3.5 kg | 23 mm | 17.30" | 3840x2160 | |
| 83.2 % v7 (old) | MSI Pulse GL76 12UGK i7-12700H, GeForce RTX 3070 Laptop GPU | 2.6 kg | 24.2 mm | 17.30" | 1920x1080 | ||
| 83.3 % v7 (old) | Gigabyte G7 KE i5-12500H, GeForce RTX 3060 Laptop GPU | 2.6 kg | 25 mm | 17.30" | 1920x1080 | ||
| 86.9 % v7 (old) | 01/2023 | Asus ROG Strix Scar 17 SE G733CX-LL014W i9-12950HX, GeForce RTX 3080 Ti Laptop GPU | 2.9 kg | 28.3 mm | 17.30" | 2560x1440 | |
| 86.5 % v7 (old) | Acer Predator Helios 300 (i7-12700H, RTX 3070 Ti) i7-12700H, GeForce RTX 3070 Ti Laptop GPU | 3 kg | 27.65 mm | 17.30" | 2560x1440 |
| Networking | |
| iperf3 transmit AXE11000 | |
| Gigabyte G7 KE | |
| MSI Titan GT77 HX 13VI | |
| MSI Katana 17 B13VFK | |
| MSI Pulse GL76 12UGK | |
| Átlagos Intel Wi-Fi 6 AX201 (438 - 1715, n=74) | |
| Az osztály átlaga Gaming (560 - 1862, n=87, az elmúlt 2 évben) | |
| iperf3 receive AXE11000 | |
| MSI Katana 17 B13VFK | |
| Gigabyte G7 KE | |
| MSI Titan GT77 HX 13VI | |
| Az osztály átlaga Gaming (680 - 1745, n=87, az elmúlt 2 évben) | |
| Átlagos Intel Wi-Fi 6 AX201 (390 - 1734, n=79) | |
| MSI Pulse GL76 12UGK | |
| iperf3 transmit AXE11000 6GHz | |
| Asus ROG Strix Scar 17 SE G733CX-LL014W | |
| Az osztály átlaga Gaming (723 - 1868, n=36, az elmúlt 2 évben) | |
| Acer Predator Helios 300 (i7-12700H, RTX 3070 Ti) | |
| Átlagos Intel Wi-Fi 6 AX201 (745 - 1252, n=3) | |
| iperf3 receive AXE11000 6GHz | |
| Asus ROG Strix Scar 17 SE G733CX-LL014W | |
| Az osztály átlaga Gaming (975 - 1775, n=35, az elmúlt 2 évben) | |
| Acer Predator Helios 300 (i7-12700H, RTX 3070 Ti) | |
| Átlagos Intel Wi-Fi 6 AX201 (390 - 1670, n=3) | |


| |||||||||||||||||||||||||
Fényerő megoszlás: 93 %
Centrumban: 267 cd/m²
Kontraszt: 1271:1 (Fekete: 0.21 cd/m²)
ΔE ColorChecker Calman: 4.7 | ∀{0.5-29.43 Ø4.71}
calibrated: 4.5
ΔE Greyscale Calman: 1.5 | ∀{0.09-98 Ø4.96}
42.2% AdobeRGB 1998 (Argyll 3D)
61% sRGB (Argyll 3D)
40.8% Display P3 (Argyll 3D)
Gamma: 2.12
CCT: 6552 K
| MSI Katana 17 B13VFK B173HAN04.9, IPS LED, 1920x1080, 17.3" | MSI Titan GT77 HX 13VI B173ZAN06.C, Mini-LED, 3840x2160, 17.3" | MSI Pulse GL76 12UGK Sharp LQ173M1JW08, IPS, 1920x1080, 17.3" | Gigabyte G7 KE AU Optronics B173HAN05.1, IPS, 1920x1080, 17.3" | Asus ROG Strix Scar 17 SE G733CX-LL014W NE173QHM-NZ2, IPS, 2560x1440, 17.3" | Acer Predator Helios 300 (i7-12700H, RTX 3070 Ti) BOE0A1A, IPS, 2560x1440, 17.3" | |
|---|---|---|---|---|---|---|
| Display | 105% | 72% | 69% | 101% | 101% | |
| Display P3 Coverage (%) | 40.8 | 94.9 133% | 71.9 76% | 70.4 73% | 97.1 138% | 96.8 137% |
| sRGB Coverage (%) | 61 | 99.9 64% | 99.9 64% | 99.8 64% | 99.9 64% | 99.9 64% |
| AdobeRGB 1998 Coverage (%) | 42.2 | 92.4 119% | 73.7 75% | 71.7 70% | 84.8 101% | 84.8 101% |
| Response Times | -9% | 72% | 77% | 72% | 54% | |
| Response Time Grey 50% / Grey 80% * (ms) | 33 ? | 38.4 ? -16% | 4.6 ? 86% | 5 ? 85% | 5.7 ? 83% | 16.4 ? 50% |
| Response Time Black / White * (ms) | 26 ? | 26.6 ? -2% | 11.2 ? 57% | 8.3 ? 68% | 10.1 ? 61% | 11.2 ? 57% |
| PWM Frequency (Hz) | 2380 ? | |||||
| Screen | 52982% | -21% | 27% | 21% | 4% | |
| Brightness middle (cd/m²) | 267 | 606 127% | 337.7 26% | 307 15% | 320 20% | 366 37% |
| Brightness (cd/m²) | 256 | 602 135% | 331 29% | 301 18% | 303 18% | 340 33% |
| Brightness Distribution (%) | 93 | 93 0% | 82 -12% | 93 0% | 87 -6% | 85 -9% |
| Black Level * (cd/m²) | 0.21 | 0.0001 100% | 0.31 -48% | 0.2 5% | 0.3 -43% | 0.31 -48% |
| Contrast (:1) | 1271 | 6060000 476690% | 1089 -14% | 1535 21% | 1067 -16% | 1181 -7% |
| Colorchecker dE 2000 * | 4.7 | 4.8 -2% | 4.12 12% | 1.32 72% | 1.1 77% | 3.56 24% |
| Colorchecker dE 2000 max. * | 20.4 | 8.2 60% | 8.89 56% | 4.6 77% | 2.7 87% | 5.66 72% |
| Colorchecker dE 2000 calibrated * | 4.5 | 1.8 60% | 0.98 78% | 1.03 77% | 3.31 26% | |
| Greyscale dE 2000 * | 1.5 | 6.5 -333% | 6.3 -320% | 2.1 -40% | 1.1 27% | 2.84 -89% |
| Gamma | 2.12 104% | 2.63 84% | 2.48 89% | 2.247 98% | 2.13 103% | 2.29 96% |
| CCT | 6552 99% | 6596 99% | 6542 99% | 6815 95% | 6599 98% | 6835 95% |
| Teljes átlag (program / beállítások) | 17693% /
34081% | 41% /
12% | 58% /
43% | 65% /
47% | 53% /
32% |
* ... a kisebb jobb
Megjelenítési válaszidők
| ↔ Válaszidő Fekete-fehér | ||
|---|---|---|
| 26 ms ... emelkedés és süllyedés ↘ kombinálva | ↗ 13 ms emelkedés | 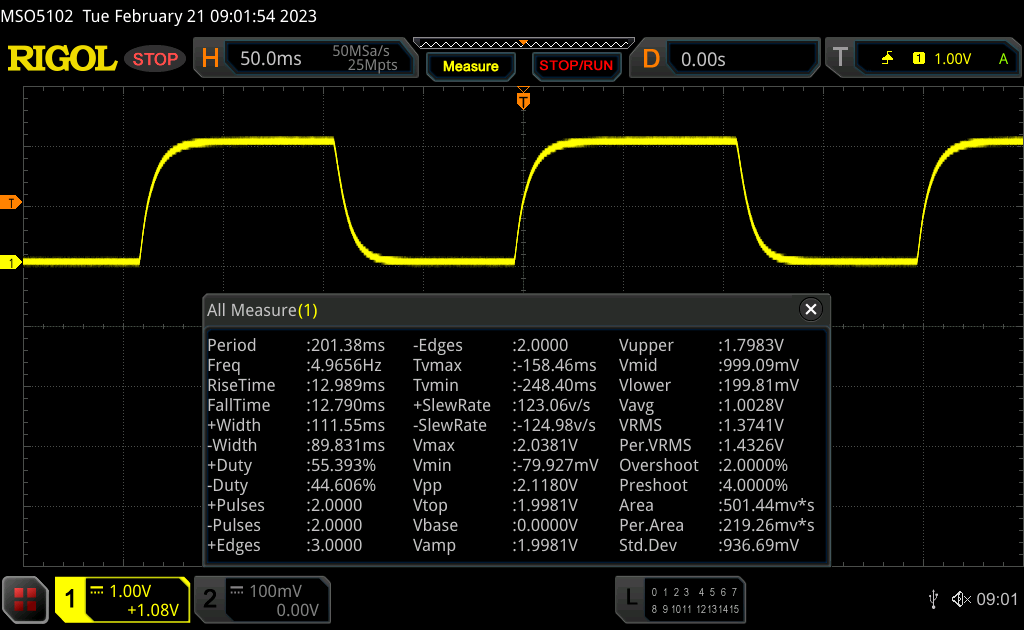 |
| ↘ 13 ms ősz | ||
| A képernyő viszonylag lassú reakciósebességet mutat tesztjeinkben, és túl lassú lehet a játékosok számára. Összehasonlításképpen, az összes tesztelt eszköz 0.1 (minimum) és 240 (maximum) ms között mozog. » 63 % of all devices are better. Ez azt jelenti, hogy a mért válaszidő rosszabb, mint az összes vizsgált eszköz átlaga (19.8 ms). | ||
| ↔ Válaszidő 50% szürke és 80% szürke között | ||
| 33 ms ... emelkedés és süllyedés ↘ kombinálva | ↗ 16 ms emelkedés | 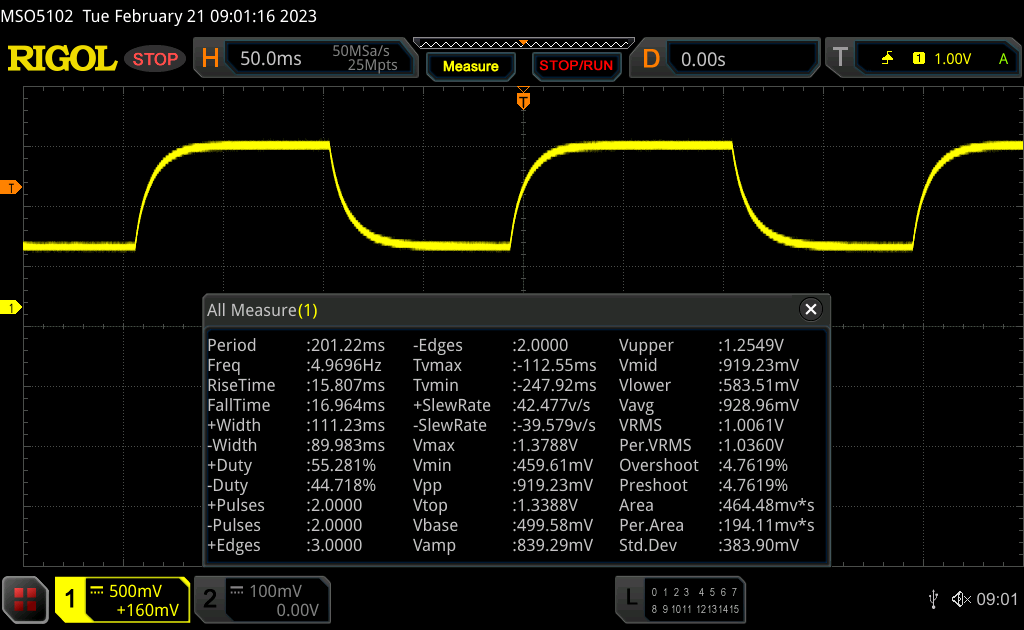 |
| ↘ 17 ms ősz | ||
| A képernyő lassú reakciósebességet mutat tesztjeinkben, és nem lesz kielégítő a játékosok számára. Összehasonlításképpen, az összes tesztelt eszköz 0.165 (minimum) és 636 (maximum) ms között mozog. » 45 % of all devices are better. Ez azt jelenti, hogy a mért válaszidő hasonló az összes vizsgált eszköz átlagához (30.9 ms). | ||
Képernyő villogása / PWM (impulzusszélesség-moduláció)
| Képernyő villogása / PWM nem érzékelhető | 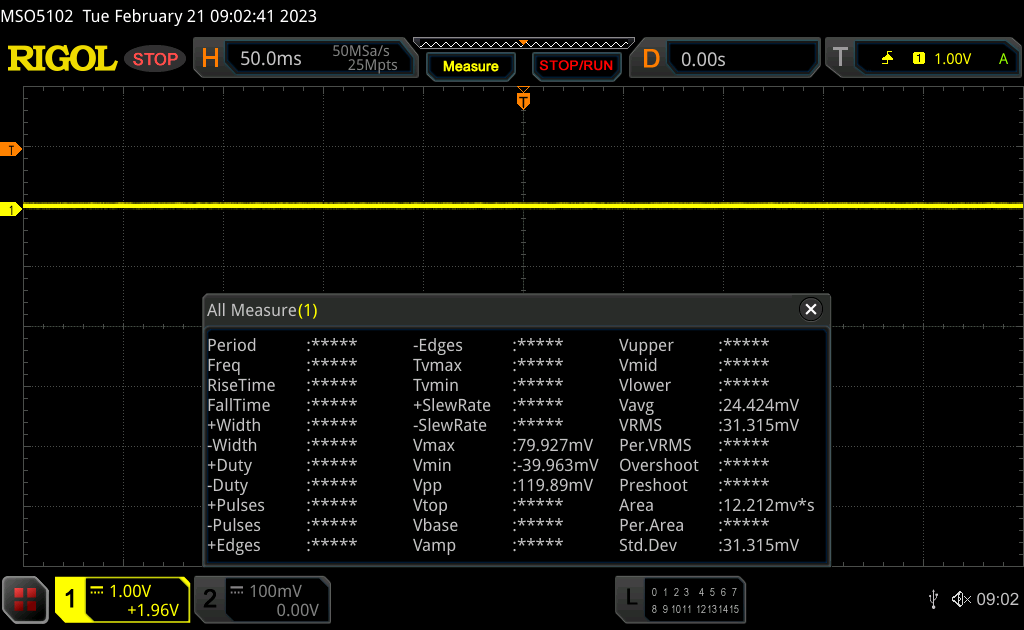 | ||
Összehasonlításképpen: az összes tesztelt eszköz 52 %-a nem használja a PWM-et a kijelző elsötétítésére. Ha PWM-et észleltek, akkor átlagosan 7744 (minimum: 5 - maximum: 343500) Hz-t mértek. | |||
Cinebench R15 Multi Continuous Test
Cinebench R23: Multi Core | Single Core
Cinebench R20: CPU (Multi Core) | CPU (Single Core)
Cinebench R15: CPU Multi 64Bit | CPU Single 64Bit
Blender: v2.79 BMW27 CPU
7-Zip 18.03: 7z b 4 | 7z b 4 -mmt1
Geekbench 5.5: Multi-Core | Single-Core
HWBOT x265 Benchmark v2.2: 4k Preset
LibreOffice : 20 Documents To PDF
R Benchmark 2.5: Overall mean
| CPU Performance rating | |
| MSI Titan GT77 HX 13VI | |
| Az osztály átlaga Gaming | |
| Asus ROG Strix Scar 17 SE G733CX-LL014W | |
| MSI Pulse GL76 12UGK | |
| MSI Katana 17 B13VFK | |
| Acer Predator Helios 300 (i7-12700H, RTX 3070 Ti) | |
| Átlagos Intel Core i7-13620H | |
| Gigabyte G7 KE | |
| Cinebench R23 / Multi Core | |
| MSI Titan GT77 HX 13VI | |
| Az osztály átlaga Gaming (10488 - 42661, n=104, az elmúlt 2 évben) | |
| Asus ROG Strix Scar 17 SE G733CX-LL014W | |
| Acer Predator Helios 300 (i7-12700H, RTX 3070 Ti) | |
| MSI Pulse GL76 12UGK | |
| MSI Katana 17 B13VFK | |
| Gigabyte G7 KE | |
| Átlagos Intel Core i7-13620H (10819 - 15496, n=7) | |
| Cinebench R23 / Single Core | |
| MSI Titan GT77 HX 13VI | |
| Az osztály átlaga Gaming (1601 - 2415, n=104, az elmúlt 2 évben) | |
| Asus ROG Strix Scar 17 SE G733CX-LL014W | |
| Átlagos Intel Core i7-13620H (1716 - 1871, n=7) | |
| MSI Katana 17 B13VFK | |
| Acer Predator Helios 300 (i7-12700H, RTX 3070 Ti) | |
| MSI Pulse GL76 12UGK | |
| Gigabyte G7 KE | |
| Cinebench R20 / CPU (Multi Core) | |
| MSI Titan GT77 HX 13VI | |
| Az osztály átlaga Gaming (4029 - 16433, n=103, az elmúlt 2 évben) | |
| Asus ROG Strix Scar 17 SE G733CX-LL014W | |
| MSI Pulse GL76 12UGK | |
| MSI Katana 17 B13VFK | |
| Acer Predator Helios 300 (i7-12700H, RTX 3070 Ti) | |
| Átlagos Intel Core i7-13620H (4214 - 5905, n=7) | |
| Gigabyte G7 KE | |
| Cinebench R20 / CPU (Single Core) | |
| MSI Titan GT77 HX 13VI | |
| Az osztály átlaga Gaming (622 - 913, n=103, az elmúlt 2 évben) | |
| Asus ROG Strix Scar 17 SE G733CX-LL014W | |
| Acer Predator Helios 300 (i7-12700H, RTX 3070 Ti) | |
| Átlagos Intel Core i7-13620H (657 - 719, n=7) | |
| MSI Katana 17 B13VFK | |
| MSI Pulse GL76 12UGK | |
| Gigabyte G7 KE | |
| Cinebench R15 / CPU Multi 64Bit | |
| MSI Titan GT77 HX 13VI | |
| Az osztály átlaga Gaming (1578 - 6330, n=102, az elmúlt 2 évben) | |
| Asus ROG Strix Scar 17 SE G733CX-LL014W | |
| Acer Predator Helios 300 (i7-12700H, RTX 3070 Ti) | |
| MSI Pulse GL76 12UGK | |
| MSI Katana 17 B13VFK | |
| Gigabyte G7 KE | |
| Átlagos Intel Core i7-13620H (1681 - 2492, n=7) | |
| Cinebench R15 / CPU Single 64Bit | |
| MSI Titan GT77 HX 13VI | |
| Az osztály átlaga Gaming (188.8 - 350, n=103, az elmúlt 2 évben) | |
| Asus ROG Strix Scar 17 SE G733CX-LL014W | |
| Átlagos Intel Core i7-13620H (250 - 269, n=7) | |
| MSI Katana 17 B13VFK | |
| MSI Pulse GL76 12UGK | |
| Acer Predator Helios 300 (i7-12700H, RTX 3070 Ti) | |
| Gigabyte G7 KE | |
| Blender / v2.79 BMW27 CPU | |
| Átlagos Intel Core i7-13620H (215 - 297, n=7) | |
| Gigabyte G7 KE | |
| MSI Katana 17 B13VFK | |
| Acer Predator Helios 300 (i7-12700H, RTX 3070 Ti) | |
| MSI Pulse GL76 12UGK | |
| Asus ROG Strix Scar 17 SE G733CX-LL014W | |
| Az osztály átlaga Gaming (79 - 330, n=101, az elmúlt 2 évben) | |
| MSI Titan GT77 HX 13VI | |
| 7-Zip 18.03 / 7z b 4 | |
| MSI Titan GT77 HX 13VI | |
| Az osztály átlaga Gaming (33491 - 148086, n=102, az elmúlt 2 évben) | |
| Asus ROG Strix Scar 17 SE G733CX-LL014W | |
| Acer Predator Helios 300 (i7-12700H, RTX 3070 Ti) | |
| MSI Pulse GL76 12UGK | |
| MSI Katana 17 B13VFK | |
| Átlagos Intel Core i7-13620H (45092 - 62324, n=7) | |
| Gigabyte G7 KE | |
| 7-Zip 18.03 / 7z b 4 -mmt1 | |
| MSI Titan GT77 HX 13VI | |
| Az osztály átlaga Gaming (4824 - 7436, n=102, az elmúlt 2 évben) | |
| Asus ROG Strix Scar 17 SE G733CX-LL014W | |
| Átlagos Intel Core i7-13620H (5648 - 6326, n=7) | |
| Acer Predator Helios 300 (i7-12700H, RTX 3070 Ti) | |
| MSI Katana 17 B13VFK | |
| MSI Pulse GL76 12UGK | |
| Gigabyte G7 KE | |
| Geekbench 5.5 / Multi-Core | |
| MSI Titan GT77 HX 13VI | |
| Az osztály átlaga Gaming (6460 - 28263, n=102, az elmúlt 2 évben) | |
| Asus ROG Strix Scar 17 SE G733CX-LL014W | |
| Acer Predator Helios 300 (i7-12700H, RTX 3070 Ti) | |
| MSI Pulse GL76 12UGK | |
| MSI Katana 17 B13VFK | |
| Átlagos Intel Core i7-13620H (8112 - 12223, n=7) | |
| Gigabyte G7 KE | |
| Geekbench 5.5 / Single-Core | |
| Az osztály átlaga Gaming (1403 - 2474, n=102, az elmúlt 2 évben) | |
| MSI Titan GT77 HX 13VI | |
| Asus ROG Strix Scar 17 SE G733CX-LL014W | |
| Átlagos Intel Core i7-13620H (1703 - 1865, n=7) | |
| MSI Katana 17 B13VFK | |
| Acer Predator Helios 300 (i7-12700H, RTX 3070 Ti) | |
| Gigabyte G7 KE | |
| MSI Pulse GL76 12UGK | |
| HWBOT x265 Benchmark v2.2 / 4k Preset | |
| MSI Titan GT77 HX 13VI | |
| Az osztály átlaga Gaming (11.5 - 44.4, n=102, az elmúlt 2 évben) | |
| Asus ROG Strix Scar 17 SE G733CX-LL014W | |
| MSI Pulse GL76 12UGK | |
| MSI Katana 17 B13VFK | |
| Gigabyte G7 KE | |
| Acer Predator Helios 300 (i7-12700H, RTX 3070 Ti) | |
| Átlagos Intel Core i7-13620H (12.2 - 17.7, n=7) | |
| LibreOffice / 20 Documents To PDF | |
| Acer Predator Helios 300 (i7-12700H, RTX 3070 Ti) | |
| MSI Katana 17 B13VFK | |
| Átlagos Intel Core i7-13620H (41.5 - 78.9, n=7) | |
| Az osztály átlaga Gaming (33.2 - 88.8, n=102, az elmúlt 2 évben) | |
| MSI Titan GT77 HX 13VI | |
| MSI Pulse GL76 12UGK | |
| Gigabyte G7 KE | |
| Asus ROG Strix Scar 17 SE G733CX-LL014W | |
| R Benchmark 2.5 / Overall mean | |
| Gigabyte G7 KE | |
| MSI Pulse GL76 12UGK | |
| Acer Predator Helios 300 (i7-12700H, RTX 3070 Ti) | |
| Átlagos Intel Core i7-13620H (0.4438 - 0.4762, n=7) | |
| MSI Katana 17 B13VFK | |
| Asus ROG Strix Scar 17 SE G733CX-LL014W | |
| Az osztály átlaga Gaming (0.3439 - 0.59, n=102, az elmúlt 2 évben) | |
| MSI Titan GT77 HX 13VI | |
* ... a kisebb jobb
AIDA64: FP32 Ray-Trace | FPU Julia | CPU SHA3 | CPU Queen | FPU SinJulia | FPU Mandel | CPU AES | CPU ZLib | FP64 Ray-Trace | CPU PhotoWorxx
| Performance rating | |
| MSI Titan GT77 HX 13VI | |
| Az osztály átlaga Gaming | |
| Asus ROG Strix Scar 17 SE G733CX-LL014W | |
| Acer Predator Helios 300 (i7-12700H, RTX 3070 Ti) | |
| MSI Pulse GL76 12UGK | |
| Gigabyte G7 KE | |
| MSI Katana 17 B13VFK | |
| Átlagos Intel Core i7-13620H | |
| AIDA64 / FP32 Ray-Trace | |
| Az osztály átlaga Gaming (10227 - 85542, n=102, az elmúlt 2 évben) | |
| MSI Titan GT77 HX 13VI | |
| Asus ROG Strix Scar 17 SE G733CX-LL014W | |
| Acer Predator Helios 300 (i7-12700H, RTX 3070 Ti) | |
| MSI Pulse GL76 12UGK | |
| MSI Katana 17 B13VFK | |
| Gigabyte G7 KE | |
| Átlagos Intel Core i7-13620H (10779 - 13601, n=7) | |
| AIDA64 / FPU Julia | |
| Az osztály átlaga Gaming (51376 - 372155, n=102, az elmúlt 2 évben) | |
| MSI Titan GT77 HX 13VI | |
| Acer Predator Helios 300 (i7-12700H, RTX 3070 Ti) | |
| Asus ROG Strix Scar 17 SE G733CX-LL014W | |
| MSI Pulse GL76 12UGK | |
| MSI Katana 17 B13VFK | |
| Gigabyte G7 KE | |
| Átlagos Intel Core i7-13620H (54287 - 67187, n=7) | |
| AIDA64 / CPU SHA3 | |
| MSI Titan GT77 HX 13VI | |
| Az osztály átlaga Gaming (2180 - 10115, n=102, az elmúlt 2 évben) | |
| Asus ROG Strix Scar 17 SE G733CX-LL014W | |
| Acer Predator Helios 300 (i7-12700H, RTX 3070 Ti) | |
| MSI Pulse GL76 12UGK | |
| Gigabyte G7 KE | |
| MSI Katana 17 B13VFK | |
| Átlagos Intel Core i7-13620H (2327 - 2773, n=7) | |
| AIDA64 / CPU Queen | |
| MSI Titan GT77 HX 13VI | |
| Az osztály átlaga Gaming (49785 - 173351, n=86, az elmúlt 2 évben) | |
| Asus ROG Strix Scar 17 SE G733CX-LL014W | |
| MSI Pulse GL76 12UGK | |
| Acer Predator Helios 300 (i7-12700H, RTX 3070 Ti) | |
| Gigabyte G7 KE | |
| MSI Katana 17 B13VFK | |
| Átlagos Intel Core i7-13620H (66885 - 78867, n=7) | |
| AIDA64 / FPU SinJulia | |
| MSI Titan GT77 HX 13VI | |
| Az osztály átlaga Gaming (4424 - 33636, n=102, az elmúlt 2 évben) | |
| Asus ROG Strix Scar 17 SE G733CX-LL014W | |
| Acer Predator Helios 300 (i7-12700H, RTX 3070 Ti) | |
| MSI Pulse GL76 12UGK | |
| MSI Katana 17 B13VFK | |
| Átlagos Intel Core i7-13620H (6737 - 8421, n=7) | |
| Gigabyte G7 KE | |
| AIDA64 / FPU Mandel | |
| Az osztály átlaga Gaming (25115 - 196829, n=102, az elmúlt 2 évben) | |
| MSI Titan GT77 HX 13VI | |
| Acer Predator Helios 300 (i7-12700H, RTX 3070 Ti) | |
| Asus ROG Strix Scar 17 SE G733CX-LL014W | |
| MSI Pulse GL76 12UGK | |
| MSI Katana 17 B13VFK | |
| Gigabyte G7 KE | |
| Átlagos Intel Core i7-13620H (27242 - 32787, n=7) | |
| AIDA64 / CPU AES | |
| Asus ROG Strix Scar 17 SE G733CX-LL014W | |
| MSI Pulse GL76 12UGK | |
| MSI Titan GT77 HX 13VI | |
| Gigabyte G7 KE | |
| Az osztály átlaga Gaming (39258 - 247074, n=102, az elmúlt 2 évben) | |
| Acer Predator Helios 300 (i7-12700H, RTX 3070 Ti) | |
| Átlagos Intel Core i7-13620H (48646 - 85895, n=7) | |
| MSI Katana 17 B13VFK | |
| AIDA64 / CPU ZLib | |
| MSI Titan GT77 HX 13VI | |
| Az osztály átlaga Gaming (574 - 2531, n=102, az elmúlt 2 évben) | |
| Asus ROG Strix Scar 17 SE G733CX-LL014W | |
| Acer Predator Helios 300 (i7-12700H, RTX 3070 Ti) | |
| MSI Pulse GL76 12UGK | |
| Gigabyte G7 KE | |
| MSI Katana 17 B13VFK | |
| Átlagos Intel Core i7-13620H (688 - 835, n=7) | |
| AIDA64 / FP64 Ray-Trace | |
| Az osztály átlaga Gaming (5509 - 45446, n=102, az elmúlt 2 évben) | |
| MSI Titan GT77 HX 13VI | |
| Acer Predator Helios 300 (i7-12700H, RTX 3070 Ti) | |
| Asus ROG Strix Scar 17 SE G733CX-LL014W | |
| MSI Pulse GL76 12UGK | |
| MSI Katana 17 B13VFK | |
| Gigabyte G7 KE | |
| Átlagos Intel Core i7-13620H (5919 - 7364, n=7) | |
| AIDA64 / CPU PhotoWorxx | |
| Az osztály átlaga Gaming (12271 - 89891, n=102, az elmúlt 2 évben) | |
| Asus ROG Strix Scar 17 SE G733CX-LL014W | |
| MSI Titan GT77 HX 13VI | |
| Acer Predator Helios 300 (i7-12700H, RTX 3070 Ti) | |
| MSI Katana 17 B13VFK | |
| Gigabyte G7 KE | |
| Átlagos Intel Core i7-13620H (19421 - 34544, n=7) | |
| MSI Pulse GL76 12UGK | |
CrossMark: Overall | Productivity | Creativity | Responsiveness
| PCMark 10 / Score | |
| MSI Titan GT77 HX 13VI | |
| Az osztály átlaga Gaming (5828 - 12414, n=93, az elmúlt 2 évben) | |
| Acer Predator Helios 300 (i7-12700H, RTX 3070 Ti) | |
| MSI Pulse GL76 12UGK | |
| Asus ROG Strix Scar 17 SE G733CX-LL014W | |
| MSI Katana 17 B13VFK | |
| Átlagos Intel Core i7-13620H, NVIDIA GeForce RTX 4060 Laptop GPU (6678 - 7256, n=3) | |
| Gigabyte G7 KE | |
| PCMark 10 / Essentials | |
| MSI Titan GT77 HX 13VI | |
| MSI Pulse GL76 12UGK | |
| MSI Katana 17 B13VFK | |
| Acer Predator Helios 300 (i7-12700H, RTX 3070 Ti) | |
| Az osztály átlaga Gaming (8810 - 11935, n=97, az elmúlt 2 évben) | |
| Átlagos Intel Core i7-13620H, NVIDIA GeForce RTX 4060 Laptop GPU (9909 - 10809, n=3) | |
| Asus ROG Strix Scar 17 SE G733CX-LL014W | |
| Gigabyte G7 KE | |
| PCMark 10 / Productivity | |
| Az osztály átlaga Gaming (6845 - 25323, n=95, az elmúlt 2 évben) | |
| Acer Predator Helios 300 (i7-12700H, RTX 3070 Ti) | |
| MSI Pulse GL76 12UGK | |
| Asus ROG Strix Scar 17 SE G733CX-LL014W | |
| MSI Titan GT77 HX 13VI | |
| MSI Katana 17 B13VFK | |
| Átlagos Intel Core i7-13620H, NVIDIA GeForce RTX 4060 Laptop GPU (8642 - 9781, n=3) | |
| Gigabyte G7 KE | |
| PCMark 10 / Digital Content Creation | |
| MSI Titan GT77 HX 13VI | |
| Az osztály átlaga Gaming (7602 - 19954, n=95, az elmúlt 2 évben) | |
| Acer Predator Helios 300 (i7-12700H, RTX 3070 Ti) | |
| MSI Pulse GL76 12UGK | |
| Asus ROG Strix Scar 17 SE G733CX-LL014W | |
| MSI Katana 17 B13VFK | |
| Átlagos Intel Core i7-13620H, NVIDIA GeForce RTX 4060 Laptop GPU (9437 - 10204, n=3) | |
| Gigabyte G7 KE | |
| CrossMark / Overall | |
| MSI Titan GT77 HX 13VI | |
| Asus ROG Strix Scar 17 SE G733CX-LL014W | |
| Az osztály átlaga Gaming (1366 - 2409, n=94, az elmúlt 2 évben) | |
| Átlagos Intel Core i7-13620H, NVIDIA GeForce RTX 4060 Laptop GPU (1857 - 1986, n=3) | |
| Acer Predator Helios 300 (i7-12700H, RTX 3070 Ti) | |
| MSI Katana 17 B13VFK | |
| MSI Pulse GL76 12UGK | |
| Gigabyte G7 KE | |
| CrossMark / Productivity | |
| MSI Titan GT77 HX 13VI | |
| Asus ROG Strix Scar 17 SE G733CX-LL014W | |
| Az osztály átlaga Gaming (1386 - 2254, n=94, az elmúlt 2 évben) | |
| Átlagos Intel Core i7-13620H, NVIDIA GeForce RTX 4060 Laptop GPU (1765 - 1908, n=3) | |
| Gigabyte G7 KE | |
| MSI Pulse GL76 12UGK | |
| Acer Predator Helios 300 (i7-12700H, RTX 3070 Ti) | |
| MSI Katana 17 B13VFK | |
| CrossMark / Creativity | |
| MSI Titan GT77 HX 13VI | |
| Asus ROG Strix Scar 17 SE G733CX-LL014W | |
| Az osztály átlaga Gaming (1343 - 2786, n=94, az elmúlt 2 évben) | |
| Acer Predator Helios 300 (i7-12700H, RTX 3070 Ti) | |
| Átlagos Intel Core i7-13620H, NVIDIA GeForce RTX 4060 Laptop GPU (2013 - 2067, n=3) | |
| MSI Katana 17 B13VFK | |
| MSI Pulse GL76 12UGK | |
| Gigabyte G7 KE | |
| CrossMark / Responsiveness | |
| Gigabyte G7 KE | |
| Asus ROG Strix Scar 17 SE G733CX-LL014W | |
| Átlagos Intel Core i7-13620H, NVIDIA GeForce RTX 4060 Laptop GPU (1734 - 1989, n=3) | |
| MSI Titan GT77 HX 13VI | |
| MSI Pulse GL76 12UGK | |
| MSI Katana 17 B13VFK | |
| Acer Predator Helios 300 (i7-12700H, RTX 3070 Ti) | |
| Az osztály átlaga Gaming (1226 - 2334, n=94, az elmúlt 2 évben) | |
| PCMark 10 Score | 7160 pontok | |
Segítség | ||
| AIDA64 / Memory Copy | |
| Az osztály átlaga Gaming (21750 - 129946, n=102, az elmúlt 2 évben) | |
| MSI Titan GT77 HX 13VI | |
| Asus ROG Strix Scar 17 SE G733CX-LL014W | |
| Acer Predator Helios 300 (i7-12700H, RTX 3070 Ti) | |
| MSI Katana 17 B13VFK | |
| MSI Pulse GL76 12UGK | |
| Átlagos Intel Core i7-13620H (31629 - 53927, n=7) | |
| Gigabyte G7 KE | |
| AIDA64 / Memory Read | |
| Az osztály átlaga Gaming (22956 - 118858, n=102, az elmúlt 2 évben) | |
| Asus ROG Strix Scar 17 SE G733CX-LL014W | |
| MSI Titan GT77 HX 13VI | |
| MSI Katana 17 B13VFK | |
| Acer Predator Helios 300 (i7-12700H, RTX 3070 Ti) | |
| Átlagos Intel Core i7-13620H (35115 - 61853, n=7) | |
| MSI Pulse GL76 12UGK | |
| Gigabyte G7 KE | |
| AIDA64 / Memory Write | |
| Az osztály átlaga Gaming (22297 - 135096, n=102, az elmúlt 2 évben) | |
| Asus ROG Strix Scar 17 SE G733CX-LL014W | |
| MSI Titan GT77 HX 13VI | |
| Acer Predator Helios 300 (i7-12700H, RTX 3070 Ti) | |
| MSI Katana 17 B13VFK | |
| Gigabyte G7 KE | |
| MSI Pulse GL76 12UGK | |
| Átlagos Intel Core i7-13620H (30611 - 54111, n=7) | |
| AIDA64 / Memory Latency | |
| Az osztály átlaga Gaming (75.3 - 165.4, n=102, az elmúlt 2 évben) | |
| MSI Katana 17 B13VFK | |
| Átlagos Intel Core i7-13620H (75.9 - 108.2, n=7) | |
| MSI Pulse GL76 12UGK | |
| MSI Titan GT77 HX 13VI | |
| Acer Predator Helios 300 (i7-12700H, RTX 3070 Ti) | |
| Gigabyte G7 KE | |
| Asus ROG Strix Scar 17 SE G733CX-LL014W | |
* ... a kisebb jobb
| DPC Latencies / LatencyMon - interrupt to process latency (max), Web, Youtube, Prime95 | |
| MSI Titan GT77 HX 13VI | |
| Asus ROG Strix Scar 17 SE G733CX-LL014W | |
| MSI Katana 17 B13VFK | |
| Gigabyte G7 KE | |
| Acer Predator Helios 300 (i7-12700H, RTX 3070 Ti) | |
| MSI Pulse GL76 12UGK | |
* ... a kisebb jobb

| Drive Performance rating - Percent | |
| Asus ROG Strix Scar 17 SE G733CX-LL014W | |
| Gigabyte G7 KE | |
| Acer Predator Helios 300 (i7-12700H, RTX 3070 Ti) | |
| MSI Titan GT77 HX 13VI | |
| MSI Pulse GL76 12UGK | |
| Az osztály átlaga Gaming | |
| MSI Katana 17 B13VFK | |
| Átlagos Micron 2400 MTFDKBA1T0QFM | |
* ... a kisebb jobb
Continuous Performance Read: DiskSpd Read Loop, Queue Depth 8
| 3DMark Performance rating - Percent | |
| MSI Titan GT77 HX 13VI | |
| Az osztály átlaga Gaming | |
| Asus ROG Strix Scar 17 SE G733CX-LL014W | |
| Acer Predator Helios 300 (i7-12700H, RTX 3070 Ti) | |
| MSI Katana 17 B13VFK | |
| Átlagos NVIDIA GeForce RTX 4060 Laptop GPU | |
| MSI Pulse GL76 12UGK | |
| Gigabyte G7 KE | |
| 3DMark 11 - 1280x720 Performance GPU | |
| MSI Titan GT77 HX 13VI | |
| Az osztály átlaga Gaming (21841 - 80022, n=103, az elmúlt 2 évben) | |
| Asus ROG Strix Scar 17 SE G733CX-LL014W | |
| Acer Predator Helios 300 (i7-12700H, RTX 3070 Ti) | |
| MSI Katana 17 B13VFK | |
| Átlagos NVIDIA GeForce RTX 4060 Laptop GPU (28136 - 38912, n=57) | |
| MSI Pulse GL76 12UGK | |
| Gigabyte G7 KE | |
| 3DMark | |
| 1920x1080 Fire Strike Graphics | |
| MSI Titan GT77 HX 13VI | |
| Az osztály átlaga Gaming (18629 - 62849, n=112, az elmúlt 2 évben) | |
| Asus ROG Strix Scar 17 SE G733CX-LL014W | |
| Acer Predator Helios 300 (i7-12700H, RTX 3070 Ti) | |
| MSI Katana 17 B13VFK | |
| Átlagos NVIDIA GeForce RTX 4060 Laptop GPU (20533 - 29656, n=54) | |
| MSI Pulse GL76 12UGK | |
| Gigabyte G7 KE | |
| 2560x1440 Time Spy Graphics | |
| MSI Titan GT77 HX 13VI | |
| Az osztály átlaga Gaming (6387 - 26212, n=112, az elmúlt 2 évben) | |
| Asus ROG Strix Scar 17 SE G733CX-LL014W | |
| Acer Predator Helios 300 (i7-12700H, RTX 3070 Ti) | |
| MSI Katana 17 B13VFK | |
| Átlagos NVIDIA GeForce RTX 4060 Laptop GPU (7484 - 11451, n=56) | |
| MSI Pulse GL76 12UGK | |
| Gigabyte G7 KE | |
| 3DMark 06 Standard Score | 50607 pontok | |
| 3DMark Vantage P Result | 90275 pontok | |
| 3DMark 11 Performance | 30831 pontok | |
| 3DMark Ice Storm Standard Score | 185655 pontok | |
| 3DMark Cloud Gate Standard Score | 59494 pontok | |
| 3DMark Fire Strike Score | 22497 pontok | |
| 3DMark Time Spy Score | 10345 pontok | |
Segítség | ||
| Blender | |
| v3.3 Classroom OPTIX/RTX | |
| Gigabyte G7 KE | |
| MSI Pulse GL76 12UGK | |
| MSI Katana 17 B13VFK | |
| Acer Predator Helios 300 (i7-12700H, RTX 3070 Ti) | |
| Asus ROG Strix Scar 17 SE G733CX-LL014W | |
| Átlagos NVIDIA GeForce RTX 4060 Laptop GPU (19 - 28, n=53) | |
| Az osztály átlaga Gaming (9 - 32, n=103, az elmúlt 2 évben) | |
| MSI Titan GT77 HX 13VI | |
| v3.3 Classroom CUDA | |
| Gigabyte G7 KE | |
| MSI Pulse GL76 12UGK | |
| MSI Katana 17 B13VFK | |
| Átlagos NVIDIA GeForce RTX 4060 Laptop GPU (39 - 53, n=53) | |
| Acer Predator Helios 300 (i7-12700H, RTX 3070 Ti) | |
| Asus ROG Strix Scar 17 SE G733CX-LL014W | |
| Az osztály átlaga Gaming (15 - 228, n=103, az elmúlt 2 évben) | |
| MSI Titan GT77 HX 13VI | |
| v3.3 Classroom CPU | |
| Gigabyte G7 KE | |
| Acer Predator Helios 300 (i7-12700H, RTX 3070 Ti) | |
| MSI Katana 17 B13VFK | |
| MSI Pulse GL76 12UGK | |
| Átlagos NVIDIA GeForce RTX 4060 Laptop GPU (189 - 452, n=53) | |
| Asus ROG Strix Scar 17 SE G733CX-LL014W | |
| Az osztály átlaga Gaming (122 - 565, n=99, az elmúlt 2 évben) | |
| MSI Titan GT77 HX 13VI | |
* ... a kisebb jobb
| Performance rating - Percent | |
| MSI Titan GT77 HX 13VI | |
| Az osztály átlaga Gaming | |
| Asus ROG Strix Scar 17 SE G733CX-LL014W | |
| MSI Katana 17 B13VFK | |
| Acer Predator Helios 300 (i7-12700H, RTX 3070 Ti) | |
| MSI Pulse GL76 12UGK | |
| Gigabyte G7 KE | |
| The Witcher 3 - 1920x1080 Ultra Graphics & Postprocessing (HBAO+) | |
| MSI Titan GT77 HX 13VI | |
| Az osztály átlaga Gaming (104.7 - 240, n=7, az elmúlt 2 évben) | |
| Acer Predator Helios 300 (i7-12700H, RTX 3070 Ti) | |
| Asus ROG Strix Scar 17 SE G733CX-LL014W | |
| MSI Katana 17 B13VFK | |
| MSI Pulse GL76 12UGK | |
| Gigabyte G7 KE | |
| GTA V - 1920x1080 Highest AA:4xMSAA + FX AF:16x | |
| MSI Titan GT77 HX 13VI | |
| Az osztály átlaga Gaming (67.1 - 186.9, n=90, az elmúlt 2 évben) | |
| Asus ROG Strix Scar 17 SE G733CX-LL014W | |
| Acer Predator Helios 300 (i7-12700H, RTX 3070 Ti) | |
| MSI Katana 17 B13VFK | |
| MSI Pulse GL76 12UGK | |
| Gigabyte G7 KE | |
| Final Fantasy XV Benchmark - 1920x1080 High Quality | |
| MSI Titan GT77 HX 13VI | |
| Az osztály átlaga Gaming (64.2 - 215, n=91, az elmúlt 2 évben) | |
| Asus ROG Strix Scar 17 SE G733CX-LL014W | |
| Acer Predator Helios 300 (i7-12700H, RTX 3070 Ti) | |
| MSI Katana 17 B13VFK | |
| MSI Pulse GL76 12UGK | |
| Gigabyte G7 KE | |
| Strange Brigade - 1920x1080 ultra AA:ultra AF:16 | |
| MSI Titan GT77 HX 13VI | |
| Az osztály átlaga Gaming (113.6 - 458, n=83, az elmúlt 2 évben) | |
| Asus ROG Strix Scar 17 SE G733CX-LL014W | |
| Acer Predator Helios 300 (i7-12700H, RTX 3070 Ti) | |
| MSI Katana 17 B13VFK | |
| MSI Pulse GL76 12UGK | |
| Gigabyte G7 KE | |
| Dota 2 Reborn - 1920x1080 ultra (3/3) best looking | |
| MSI Titan GT77 HX 13VI | |
| Asus ROG Strix Scar 17 SE G733CX-LL014W | |
| MSI Katana 17 B13VFK | |
| Az osztály átlaga Gaming (84.8 - 252, n=104, az elmúlt 2 évben) | |
| Gigabyte G7 KE | |
| Acer Predator Helios 300 (i7-12700H, RTX 3070 Ti) | |
| MSI Pulse GL76 12UGK | |
| X-Plane 11.11 - 1920x1080 high (fps_test=3) | |
| MSI Titan GT77 HX 13VI | |
| MSI Titan GT77 HX 13VI | |
| MSI Katana 17 B13VFK | |
| Asus ROG Strix Scar 17 SE G733CX-LL014W | |
| Az osztály átlaga Gaming (55.5 - 148.5, n=106, az elmúlt 2 évben) | |
| MSI Pulse GL76 12UGK | |
| Acer Predator Helios 300 (i7-12700H, RTX 3070 Ti) | |
| Gigabyte G7 KE | |
Witcher 3 frame rate diagram
| alacsony | közepes | magas | ultra | QHD | 4K DLSS | 4K | |
|---|---|---|---|---|---|---|---|
| GTA V (2015) | 186.1 | 184.7 | 180.2 | 112.1 | 83 | 82.1 | |
| The Witcher 3 (2015) | 435 | 322 | 206 | 104.7 | 62.6 | ||
| Dota 2 Reborn (2015) | 184.6 | 171 | 164.1 | 156.3 | 126 | ||
| Final Fantasy XV Benchmark (2018) | 204 | 135.1 | 96.1 | 70.1 | 40.2 | ||
| X-Plane 11.11 (2018) | 178.6 | 154.9 | 118.9 | 98.9 | |||
| Far Cry 5 (2018) | 134 | 99 | 51 | ||||
| Strange Brigade (2018) | 508 | 270 | 216 | 185.1 | 126.4 | 67.2 | |
| Shadow of the Tomb Raider (2018) | 155.6 | 120.7 | 67.2 | ||||
| Metro Exodus (2019) | 74.3 | 59 | 36.8 | ||||
| Control (2019) | 238 | 119 | 89 | ||||
| Borderlands 3 (2019) | 171.3 | 144.6 | 106.5 | 83.9 | |||
| Death Stranding (2020) | 200 | 158.9 | 150.3 | 146.7 | |||
| Horizon Zero Dawn (2020) | 108.3 | 85.9 | 46.5 | ||||
| Flight Simulator 2020 (2020) | 96.9 | 69.4 | 52.5 | ||||
| Crysis Remastered (2020) | 312 | 224 | 85.9 | 72.5 | |||
| Watch Dogs Legion (2020) | 65 | 44 | 25 | ||||
| Dirt 5 (2020) | 218 | 147.2 | 116.1 | 89.5 | |||
| Assassin´s Creed Valhalla (2020) | 135 | 111 | 96 | ||||
| Yakuza Like a Dragon (2020) | 131.7 | 123.2 | 117.4 | 109.6 | |||
| Hitman 3 (2021) | 267.5 | 197.7 | 172.7 | 163.5 | |||
| Days Gone (2021) | 148 | 131.4 | 100.2 | ||||
| F1 2021 (2021) | 389 | 312 | 244 | 128.9 | 93 | 50.2 | |
| Alan Wake Remastered (2021) | 149.8 | 144.9 | |||||
| Far Cry 6 (2021) | 97.2 | 32.6 | 3.38 | ||||
| Back 4 Blood (2021) | 245 | 197.5 | 188.2 | ||||
| Guardians of the Galaxy (2021) | 134 | 135 | 133 | ||||
| Riders Republic (2021) | 177 | 145 | 122 | 112 | |||
| Forza Horizon 5 (2021) | 137 | 125 | 84 | ||||
| Battlefield 2042 (2021) | 145.6 | 123 | 106.1 | ||||
| Halo Infinite (2021) | 144.9 | 123.6 | 114.2 | ||||
| God of War (2022) | 67.5 | 55.6 | 34.7 | ||||
| Rainbow Six Extraction (2022) | 149.1 | 106 | 52.4 | ||||
| Dying Light 2 (2022) | 64.7 | 43.8 | 23 | ||||
| GRID Legends (2022) | 126.4 | 102.2 | 63.9 | ||||
| Elden Ring (2022) | 59.5 | ||||||
| Cyberpunk 2077 1.6 (2022) | 73.81 | 45.9 | 21.1 | ||||
| Elex 2 (2022) | 115.4 | 115.4 | 113.5 | 96 | |||
| Ghostwire Tokyo (2022) | 68.6 | 65.9 | 36.8 | 29.6 | |||
| Tiny Tina's Wonderlands (2022) | 198.6 | 164.9 | 110 | 85.2 | |||
| Vampire Bloodhunt (2022) | 220 | 201 | 185.7 | ||||
| F1 22 (2022) | 247 | 240 | 179.2 | 65.4 | 41 | 19.7 | |
| The Quarry (2022) | 154.8 | 121.3 | 100.5 | 77.9 | |||
| A Plague Tale Requiem (2022) | 100.7 | 84.9 | 73 | 63.3 | |||
| Uncharted Legacy of Thieves Collection (2022) | 87.9 | 85.1 | 79.1 | 76.9 | |||
| Call of Duty Modern Warfare 2 2022 (2022) | 87 | 59 | 55 | 34 | |||
| Spider-Man Miles Morales (2022) | 77.3 | 59.7 | 35.3 | ||||
| The Callisto Protocol (2022) | 68.9 | 48.6 | 27 | ||||
| Need for Speed Unbound (2022) | 127.4 | 117.2 | 98.9 | 98.6 | |||
| High On Life (2023) | 220 | 165.8 | 125.6 | 99.9 | |||
| The Witcher 3 v4 (2023) | 66.3 | 40.5 | 21.4 | ||||
| Dead Space Remake (2023) | 67 | 43.4 | 20.6 | ||||
| Hogwarts Legacy (2023) | 150 | 126.7 | 107.7 | 91.6 | |||
| Returnal (2023) | |||||||
| Atomic Heart (2023) | 167.3 | 129.2 | 81.6 | 66.8 | |||
| Company of Heroes 3 (2023) | 202.7 | 182.1 | 133.3 | 131.3 | |||
| Sons of the Forest (2023) | 82 | 79.1 | 73.3 | 71.8 |
Zajszint
| Üresjárat |
| 24.5 / 24.5 / 40 dB(A) |
| Terhelés |
| 48.3 / 59.1 dB(A) |
 | ||
30 dB csendes 40 dB(A) hallható 50 dB(A) hangos |
||
min: | ||
| MSI Katana 17 B13VFK GeForce RTX 4060 Laptop GPU, i7-13620H, Micron 2400 MTFDKBA1T0QFM | MSI Titan GT77 HX 13VI GeForce RTX 4090 Laptop GPU, i9-13950HX, Samsung PM9A1 MZVL22T0HBLB | MSI Pulse GL76 12UGK GeForce RTX 3070 Laptop GPU, i7-12700H, Micron 3400 1TB MTFDKBA1T0TFH | Gigabyte G7 KE GeForce RTX 3060 Laptop GPU, i5-12500H, Gigabyte AG470S1TB-SI B10 | Asus ROG Strix Scar 17 SE G733CX-LL014W GeForce RTX 3080 Ti Laptop GPU, i9-12950HX, Samsung PM9A1 MZVL22T0HBLB | Acer Predator Helios 300 (i7-12700H, RTX 3070 Ti) GeForce RTX 3070 Ti Laptop GPU, i7-12700H, Samsung PM9A1 MZVL21T0HCLR | |
|---|---|---|---|---|---|---|
| Noise | -2% | 6% | -9% | 16% | -0% | |
| off / környezet * (dB) | 24.5 | 24.6 -0% | 24.1 2% | 27 -10% | 23.9 2% | 23 6% |
| Idle Minimum * (dB) | 24.5 | 29.2 -19% | 26.9 -10% | 27 -10% | 23.9 2% | 23 6% |
| Idle Average * (dB) | 24.5 | 29.2 -19% | 26.9 -10% | 35 -43% | 23.9 2% | 25.92 -6% |
| Idle Maximum * (dB) | 40 | 29.2 27% | 27 32% | 38 5% | 23.9 40% | 40.67 -2% |
| Load Average * (dB) | 48.3 | 50.7 -5% | 43.8 9% | 52 -8% | 34.3 29% | 42.7 12% |
| Witcher 3 ultra * (dB) | 56 | 53.3 5% | 44.7 20% | 56 -0% | 62.48 -12% | |
| Load Maximum * (dB) | 59.1 | 61 -3% | 58.3 1% | 59 -0% | 45.9 22% | 62.67 -6% |
* ... a kisebb jobb
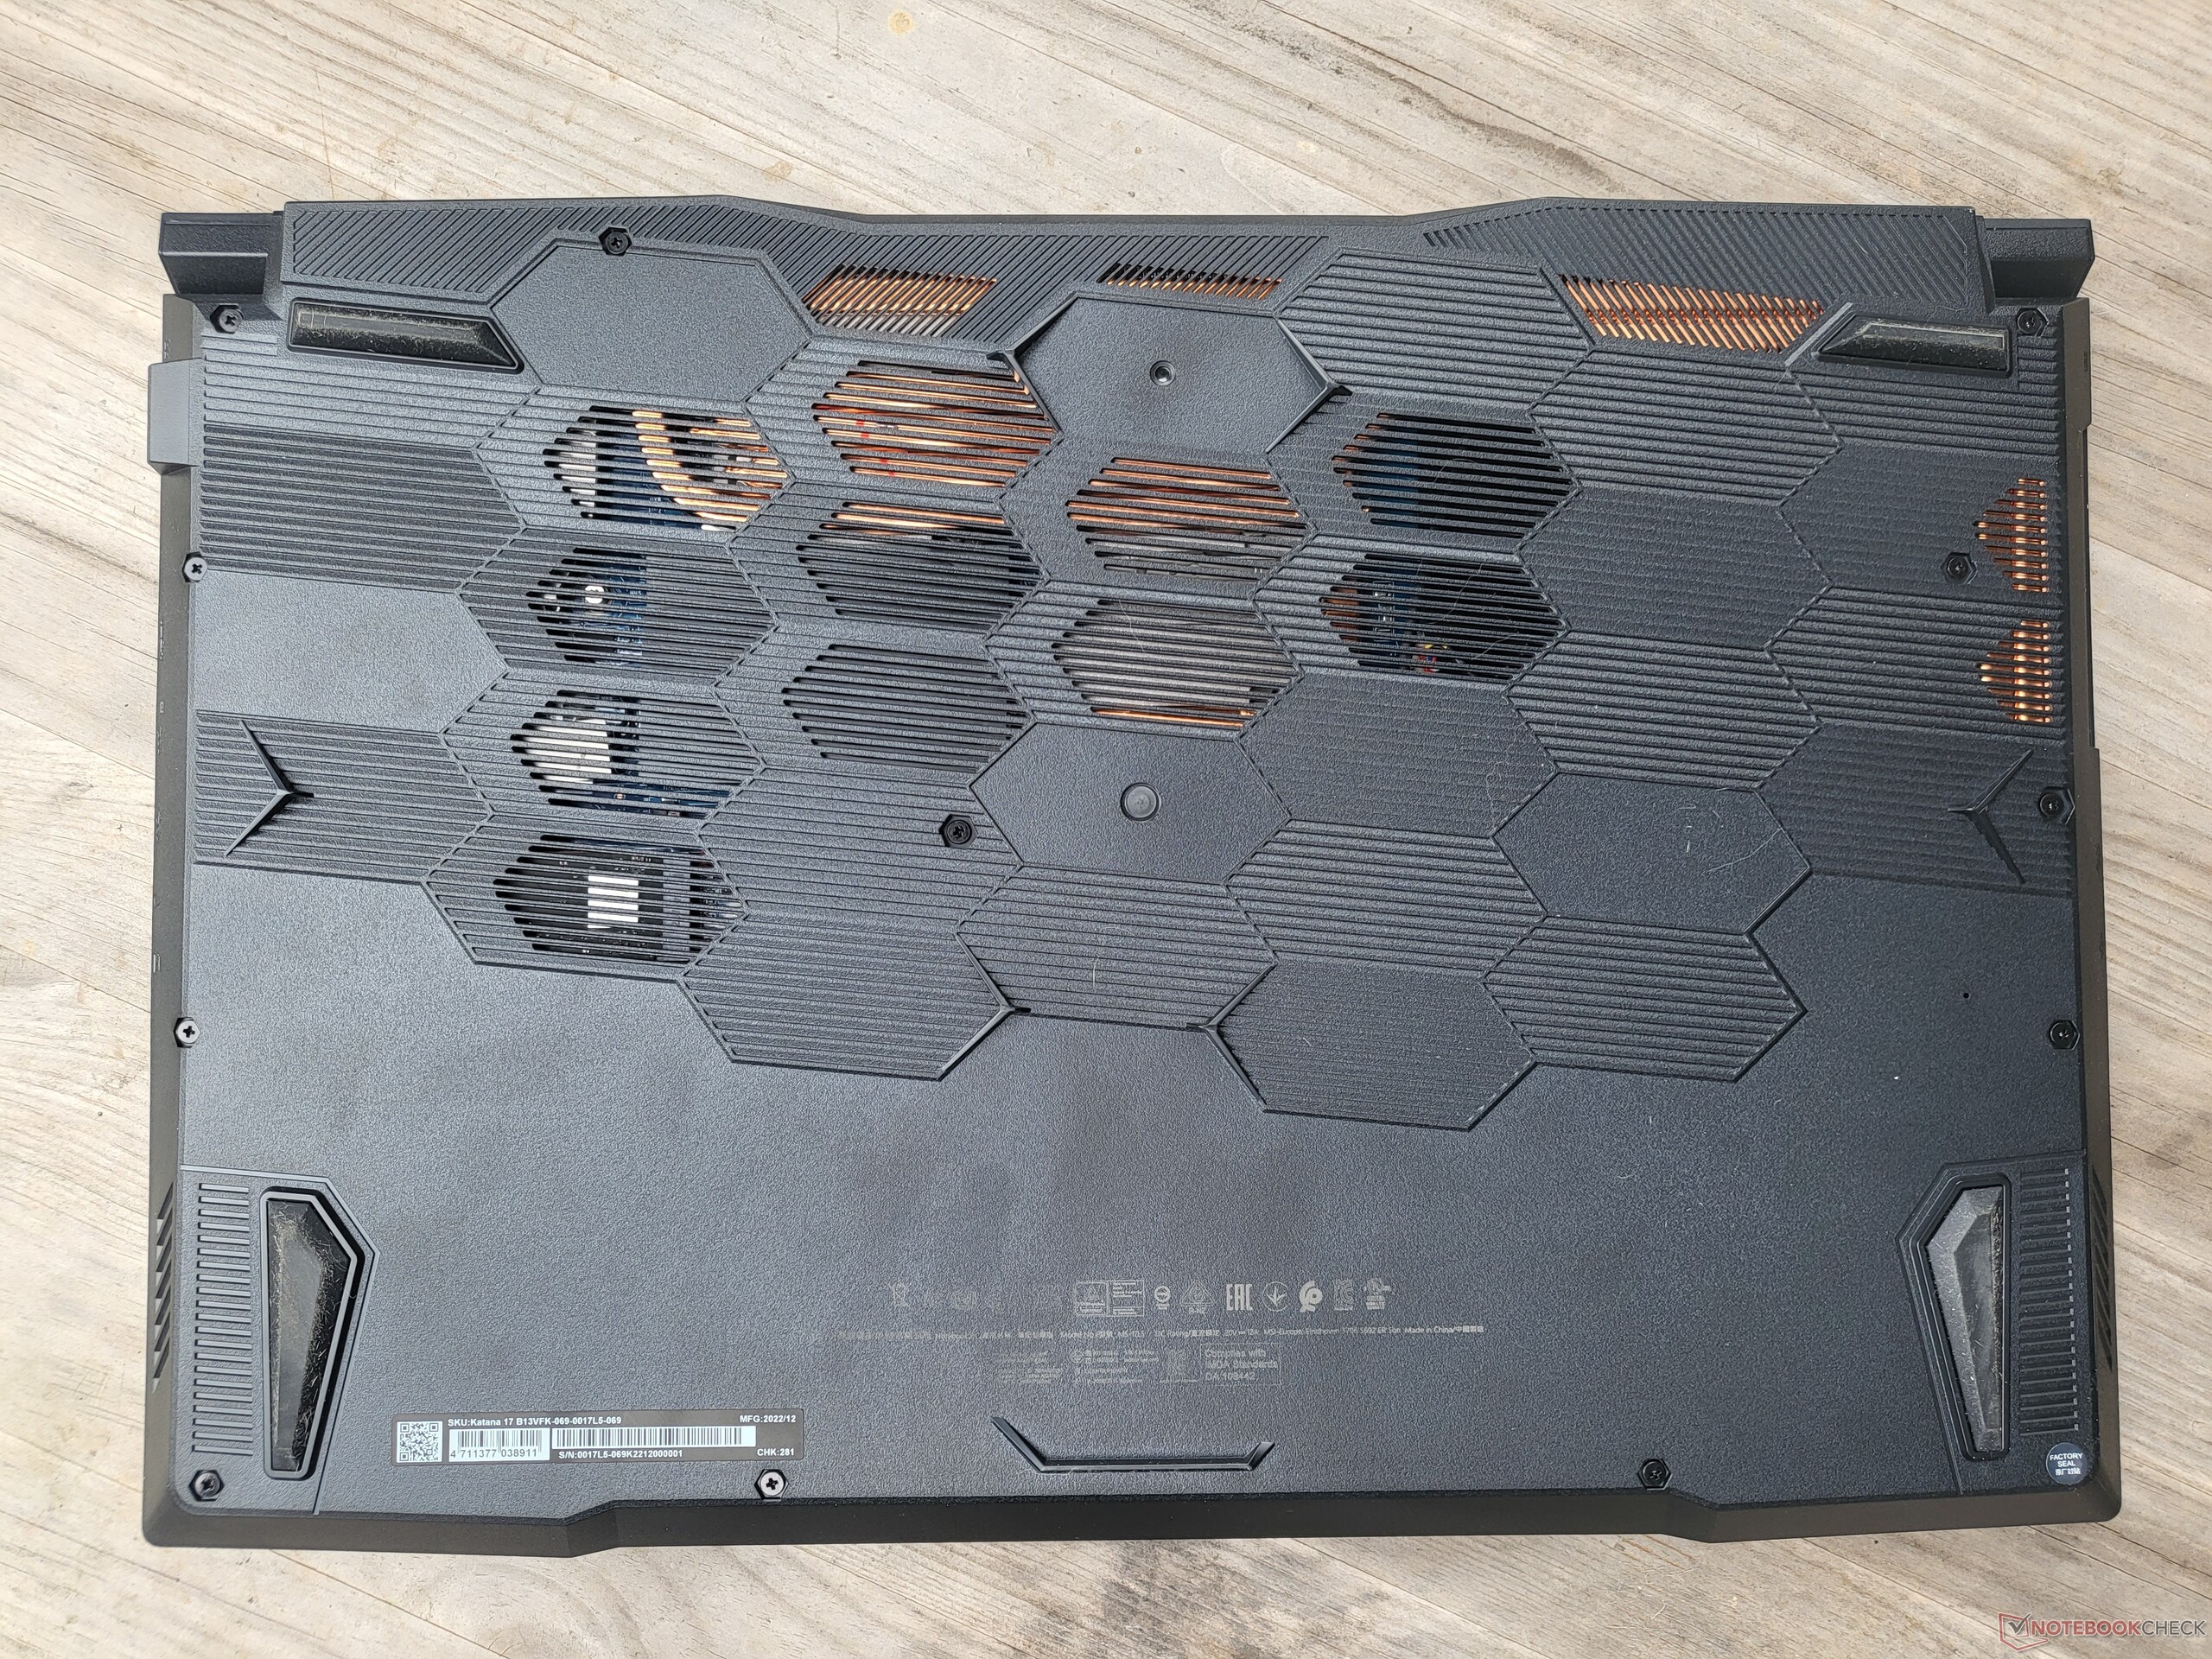
(±) A felső oldalon a maximális hőmérséklet 41.6 °C / 107 F, összehasonlítva a 40.4 °C / 105 F átlagával , 21.2 és 68.8 °C között a Gaming osztálynál.
(±) Az alsó maximum 43.1 °C / 110 F-ig melegszik fel, összehasonlítva a 43.2 °C / 110 F átlagával
(+) Üresjáratban a felső oldal átlagos hőmérséklete 27.8 °C / 82 F, összehasonlítva a 33.9 °C / ### eszközátlaggal class_avg_f### F.
(+) A The Witcher 3 játék során a felső oldal átlaghőmérséklete 31.8 °C / 89 F, összehasonlítva a 33.9 °C / ## eszközátlaggal #class_avg_f### F.
(+) A csuklótámasz és az érintőpad hűvösebb, mint a bőr hőmérséklete, maximum 24.2 °C / 75.6 F, ezért hűvös tapintású.
(+) A hasonló eszközök csuklótámasz területének átlagos hőmérséklete 28.8 °C / 83.8 F volt (+4.6 °C / 8.2 F).
| MSI Katana 17 B13VFK Intel Core i7-13620H, NVIDIA GeForce RTX 4060 Laptop GPU | MSI Titan GT77 HX 13VI Intel Core i9-13950HX, NVIDIA GeForce RTX 4090 Laptop GPU | MSI Pulse GL76 12UGK Intel Core i7-12700H, NVIDIA GeForce RTX 3070 Laptop GPU | Gigabyte G7 KE Intel Core i5-12500H, NVIDIA GeForce RTX 3060 Laptop GPU | Asus ROG Strix Scar 17 SE G733CX-LL014W Intel Core i9-12950HX, NVIDIA GeForce RTX 3080 Ti Laptop GPU | Acer Predator Helios 300 (i7-12700H, RTX 3070 Ti) Intel Core i7-12700H, NVIDIA GeForce RTX 3070 Ti Laptop GPU | |
|---|---|---|---|---|---|---|
| Heat | 10% | -5% | -7% | -7% | 2% | |
| Maximum Upper Side * (°C) | 41.6 | 40.6 2% | 44.2 -6% | 52 -25% | 48.8 -17% | 35 16% |
| Maximum Bottom * (°C) | 43.1 | 41.1 5% | 45.2 -5% | 54 -25% | 52.4 -22% | 53 -23% |
| Idle Upper Side * (°C) | 32 | 26.2 18% | 35.4 -11% | 28 12% | 30.4 5% | 29 9% |
| Idle Bottom * (°C) | 35.8 | 30.3 15% | 35 2% | 32 11% | 34.1 5% | 34 5% |
* ... a kisebb jobb
MSI Katana 17 B13VFK hangelemzés
(±) | a hangszóró hangereje átlagos, de jó (78.5 dB)
Basszus 100 - 315 Hz
(-) | szinte nincs basszus – átlagosan 17.7%-kal alacsonyabb a mediánnál
(±) | a basszus linearitása átlagos (11.7% delta az előző frekvenciához)
Közepes 400-2000 Hz
(±) | magasabb középértékek – átlagosan 6.8%-kal magasabb, mint a medián
(+) | a középpontok lineárisak (6.7% delta az előző frekvenciához)
Maximum 2-16 kHz
(+) | kiegyensúlyozott csúcsok – csak 3.2% választja el a mediántól
(±) | a csúcsok linearitása átlagos (7.2% delta az előző gyakorisághoz)
Összességében 100 - 16.000 Hz
(±) | az általános hang linearitása átlagos (19.4% eltérés a mediánhoz képest)
Ugyanazon osztályhoz képest
» 67%Ebben az osztályban az összes tesztelt eszköz %-a jobb volt, 7% hasonló, 26%-kal rosszabb
» A legjobb delta értéke 6%, az átlag 18%, a legrosszabb 132% volt
Az összes tesztelt eszközzel összehasonlítva
» 48% az összes tesztelt eszköz jobb volt, 7% hasonló, 45%-kal rosszabb
» A legjobb delta értéke 4%, az átlag 23%, a legrosszabb 134% volt
Acer Predator Helios 300 (i7-12700H, RTX 3070 Ti) hangelemzés
(±) | a hangszóró hangereje átlagos, de jó (73.83 dB)
Basszus 100 - 315 Hz
(±) | csökkentett basszus – átlagosan 12.7%-kal alacsonyabb, mint a medián
(±) | a basszus linearitása átlagos (11.2% delta az előző frekvenciához)
Közepes 400-2000 Hz
(±) | magasabb középértékek – átlagosan 5.5%-kal magasabb, mint a medián
(±) | a középpontok linearitása átlagos (7.9% delta az előző gyakorisághoz)
Maximum 2-16 kHz
(+) | kiegyensúlyozott csúcsok – csak 2.1% választja el a mediántól
(+) | a csúcsok lineárisak (3.5% delta az előző frekvenciához képest)
Összességében 100 - 16.000 Hz
(±) | az általános hang linearitása átlagos (15.8% eltérés a mediánhoz képest)
Ugyanazon osztályhoz képest
» 37%Ebben az osztályban az összes tesztelt eszköz %-a jobb volt, 7% hasonló, 56%-kal rosszabb
» A legjobb delta értéke 6%, az átlag 18%, a legrosszabb 132% volt
Az összes tesztelt eszközzel összehasonlítva
» 24% az összes tesztelt eszköz jobb volt, 5% hasonló, 70%-kal rosszabb
» A legjobb delta értéke 4%, az átlag 23%, a legrosszabb 134% volt
| Kikapcsolt állapot / Készenlét | |
| Üresjárat | |
| Terhelés |
|
Kulcs:
min: | |
| MSI Katana 17 B13VFK i7-13620H, GeForce RTX 4060 Laptop GPU, Micron 2400 MTFDKBA1T0QFM, IPS LED, 1920x1080, 17.3" | MSI Titan GT77 HX 13VI i9-13950HX, GeForce RTX 4090 Laptop GPU, Samsung PM9A1 MZVL22T0HBLB, Mini-LED, 3840x2160, 17.3" | MSI Pulse GL76 12UGK i7-12700H, GeForce RTX 3070 Laptop GPU, Micron 3400 1TB MTFDKBA1T0TFH, IPS, 1920x1080, 17.3" | Gigabyte G7 KE i5-12500H, GeForce RTX 3060 Laptop GPU, Gigabyte AG470S1TB-SI B10, IPS, 1920x1080, 17.3" | Asus ROG Strix Scar 17 SE G733CX-LL014W i9-12950HX, GeForce RTX 3080 Ti Laptop GPU, Samsung PM9A1 MZVL22T0HBLB, IPS, 2560x1440, 17.3" | Acer Predator Helios 300 (i7-12700H, RTX 3070 Ti) i7-12700H, GeForce RTX 3070 Ti Laptop GPU, Samsung PM9A1 MZVL21T0HCLR, IPS, 2560x1440, 17.3" | Átlagos NVIDIA GeForce RTX 4060 Laptop GPU | Az osztály átlaga Gaming | |
|---|---|---|---|---|---|---|---|---|
| Power Consumption | -55% | -14% | -22% | -61% | -41% | -7% | -29% | |
| Idle Minimum * (Watt) | 12.2 | 14 -15% | 12.4 -2% | 15 -23% | 19.3 -58% | 15 -23% | 11.5 ? 6% | 13.1 ? -7% |
| Idle Average * (Watt) | 14.9 | 21.6 -45% | 13.1 12% | 17 -14% | 26.5 -78% | 20 -34% | 16 ? -7% | 19 ? -28% |
| Idle Maximum * (Watt) | 15.8 | 24.8 -57% | 25.3 -60% | 24 -52% | 27.1 -72% | 22.3 -41% | 20.3 ? -28% | 24.6 ? -56% |
| Load Average * (Watt) | 85.22 | 122.5 -44% | 105.4 -24% | 111 -30% | 141 -65% | 133 -56% | 92.9 ? -9% | 111.3 ? -31% |
| Witcher 3 ultra * (Watt) | 151.1 | 265 -75% | 150 1% | 174.1 -15% | 225 -49% | 231 -53% | ||
| Load Maximum * (Watt) | 212.8 | 418 -96% | 240.5 -13% | 208 2% | 307.9 -45% | 290 -36% | 210 ? 1% | 260 ? -22% |
* ... a kisebb jobb
Power consumption Witcher 3 / stress test
Power consumption with an external monitor
| MSI Katana 17 B13VFK i7-13620H, GeForce RTX 4060 Laptop GPU, 53.5 Wh | MSI Titan GT77 HX 13VI i9-13950HX, GeForce RTX 4090 Laptop GPU, 99.9 Wh | MSI Pulse GL76 12UGK i7-12700H, GeForce RTX 3070 Laptop GPU, 90 Wh | Gigabyte G7 KE i5-12500H, GeForce RTX 3060 Laptop GPU, 54 Wh | Asus ROG Strix Scar 17 SE G733CX-LL014W i9-12950HX, GeForce RTX 3080 Ti Laptop GPU, 90 Wh | Acer Predator Helios 300 (i7-12700H, RTX 3070 Ti) i7-12700H, GeForce RTX 3070 Ti Laptop GPU, 90 Wh | Az osztály átlaga Gaming | |
|---|---|---|---|---|---|---|---|
| Akkumulátor üzemidő | 62% | 107% | 57% | 45% | 94% | 97% | |
| WiFi v1.3 (h) | 2.9 | 5.3 83% | 5.9 103% | 5.3 83% | 4.2 45% | 6 107% | 7.08 ? 144% |
| Load (h) | 1 | 1.4 40% | 2.1 110% | 1.3 30% | 1.8 80% | 1.496 ? 50% | |
| H.264 (h) | 6 | 2.2 | 5.9 | 8.27 ? | |||
| Reader / Idle (h) | 7.3 | 7.1 | 7.84 ? |
Pro
Kontra
Összegzés: Az MSI Katana 17 B13V egy jó gamer rendszer
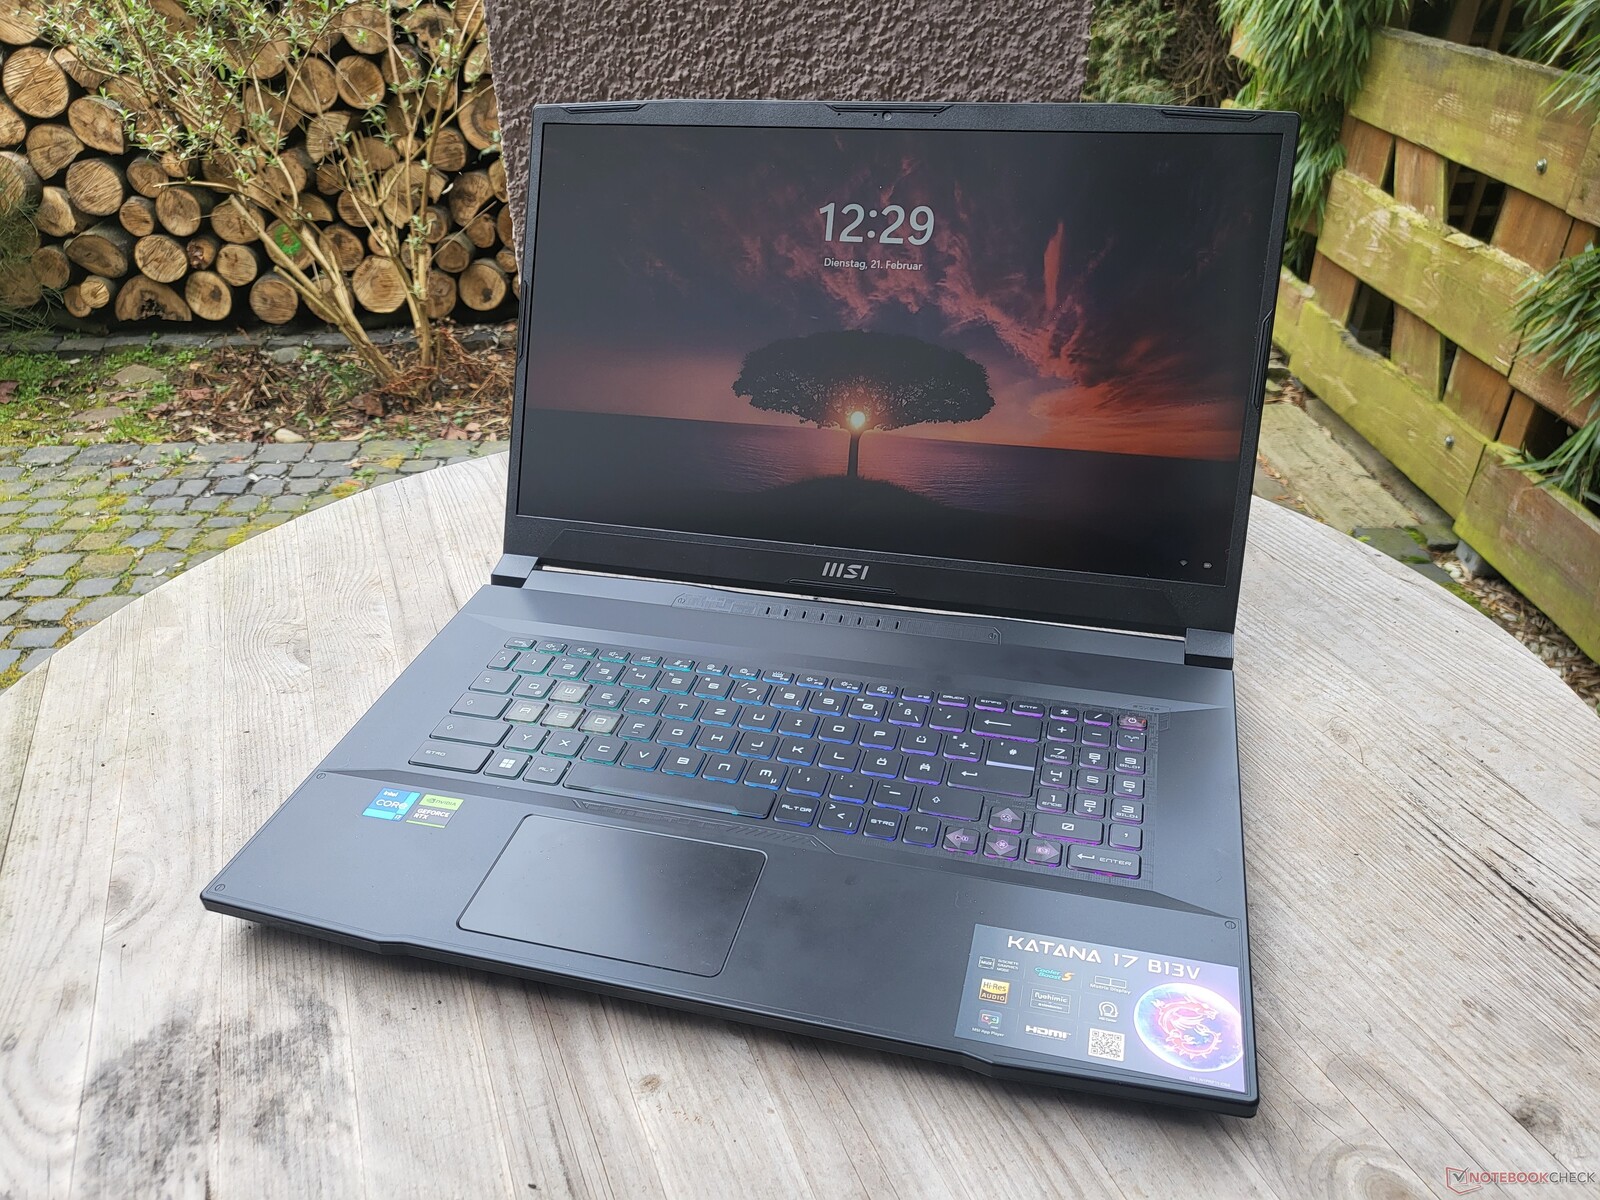
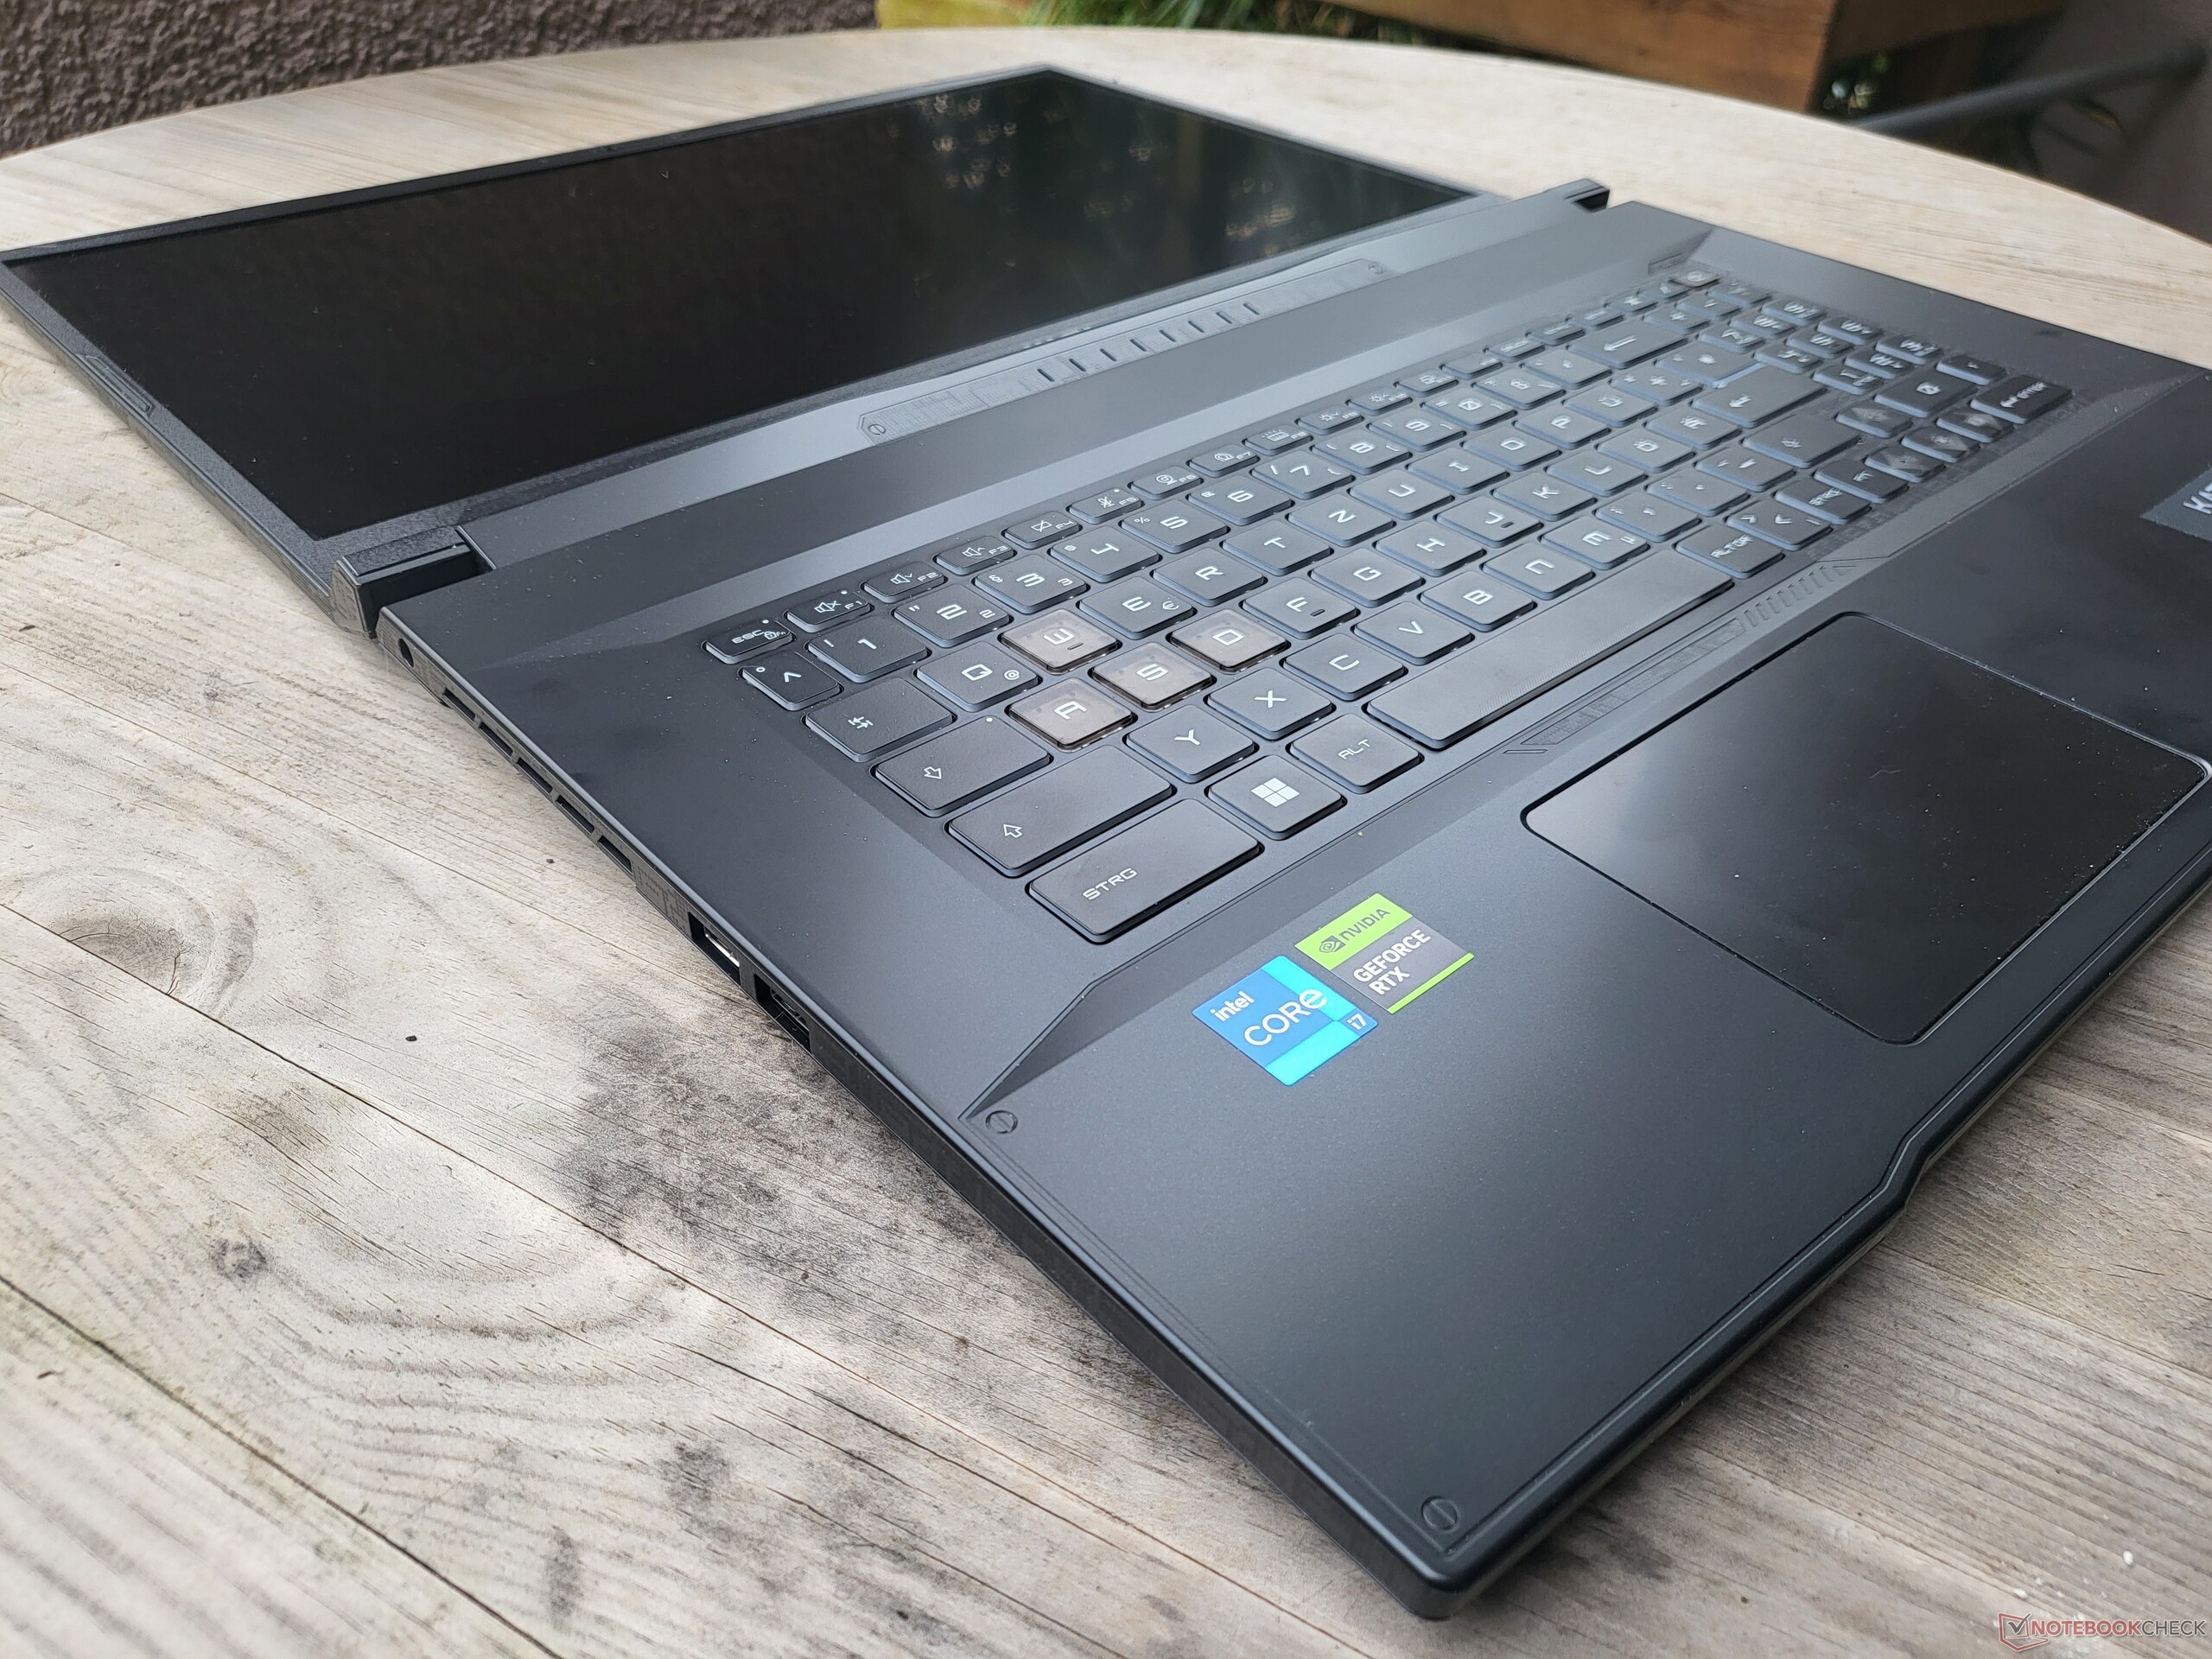
Az MSI Katana 17 B13V laptop fő kompetenciaterületén - a játékokban - nyűgözött le minket. Az Nvidia GeForce RTX 4060 olyan nagy teljesítményt biztosít, amely felveszi a versenyt az előző generációs RTX 3070 Ti-vel. A gyors GPU mellett az MSI 144 Hz-es kijelzővel, valamint RGB billentyűzettel érkezik, és nagyon jó gépelési élményt nyújt. Teljesítménye ellenére a laptop viszonylag hűvös marad.
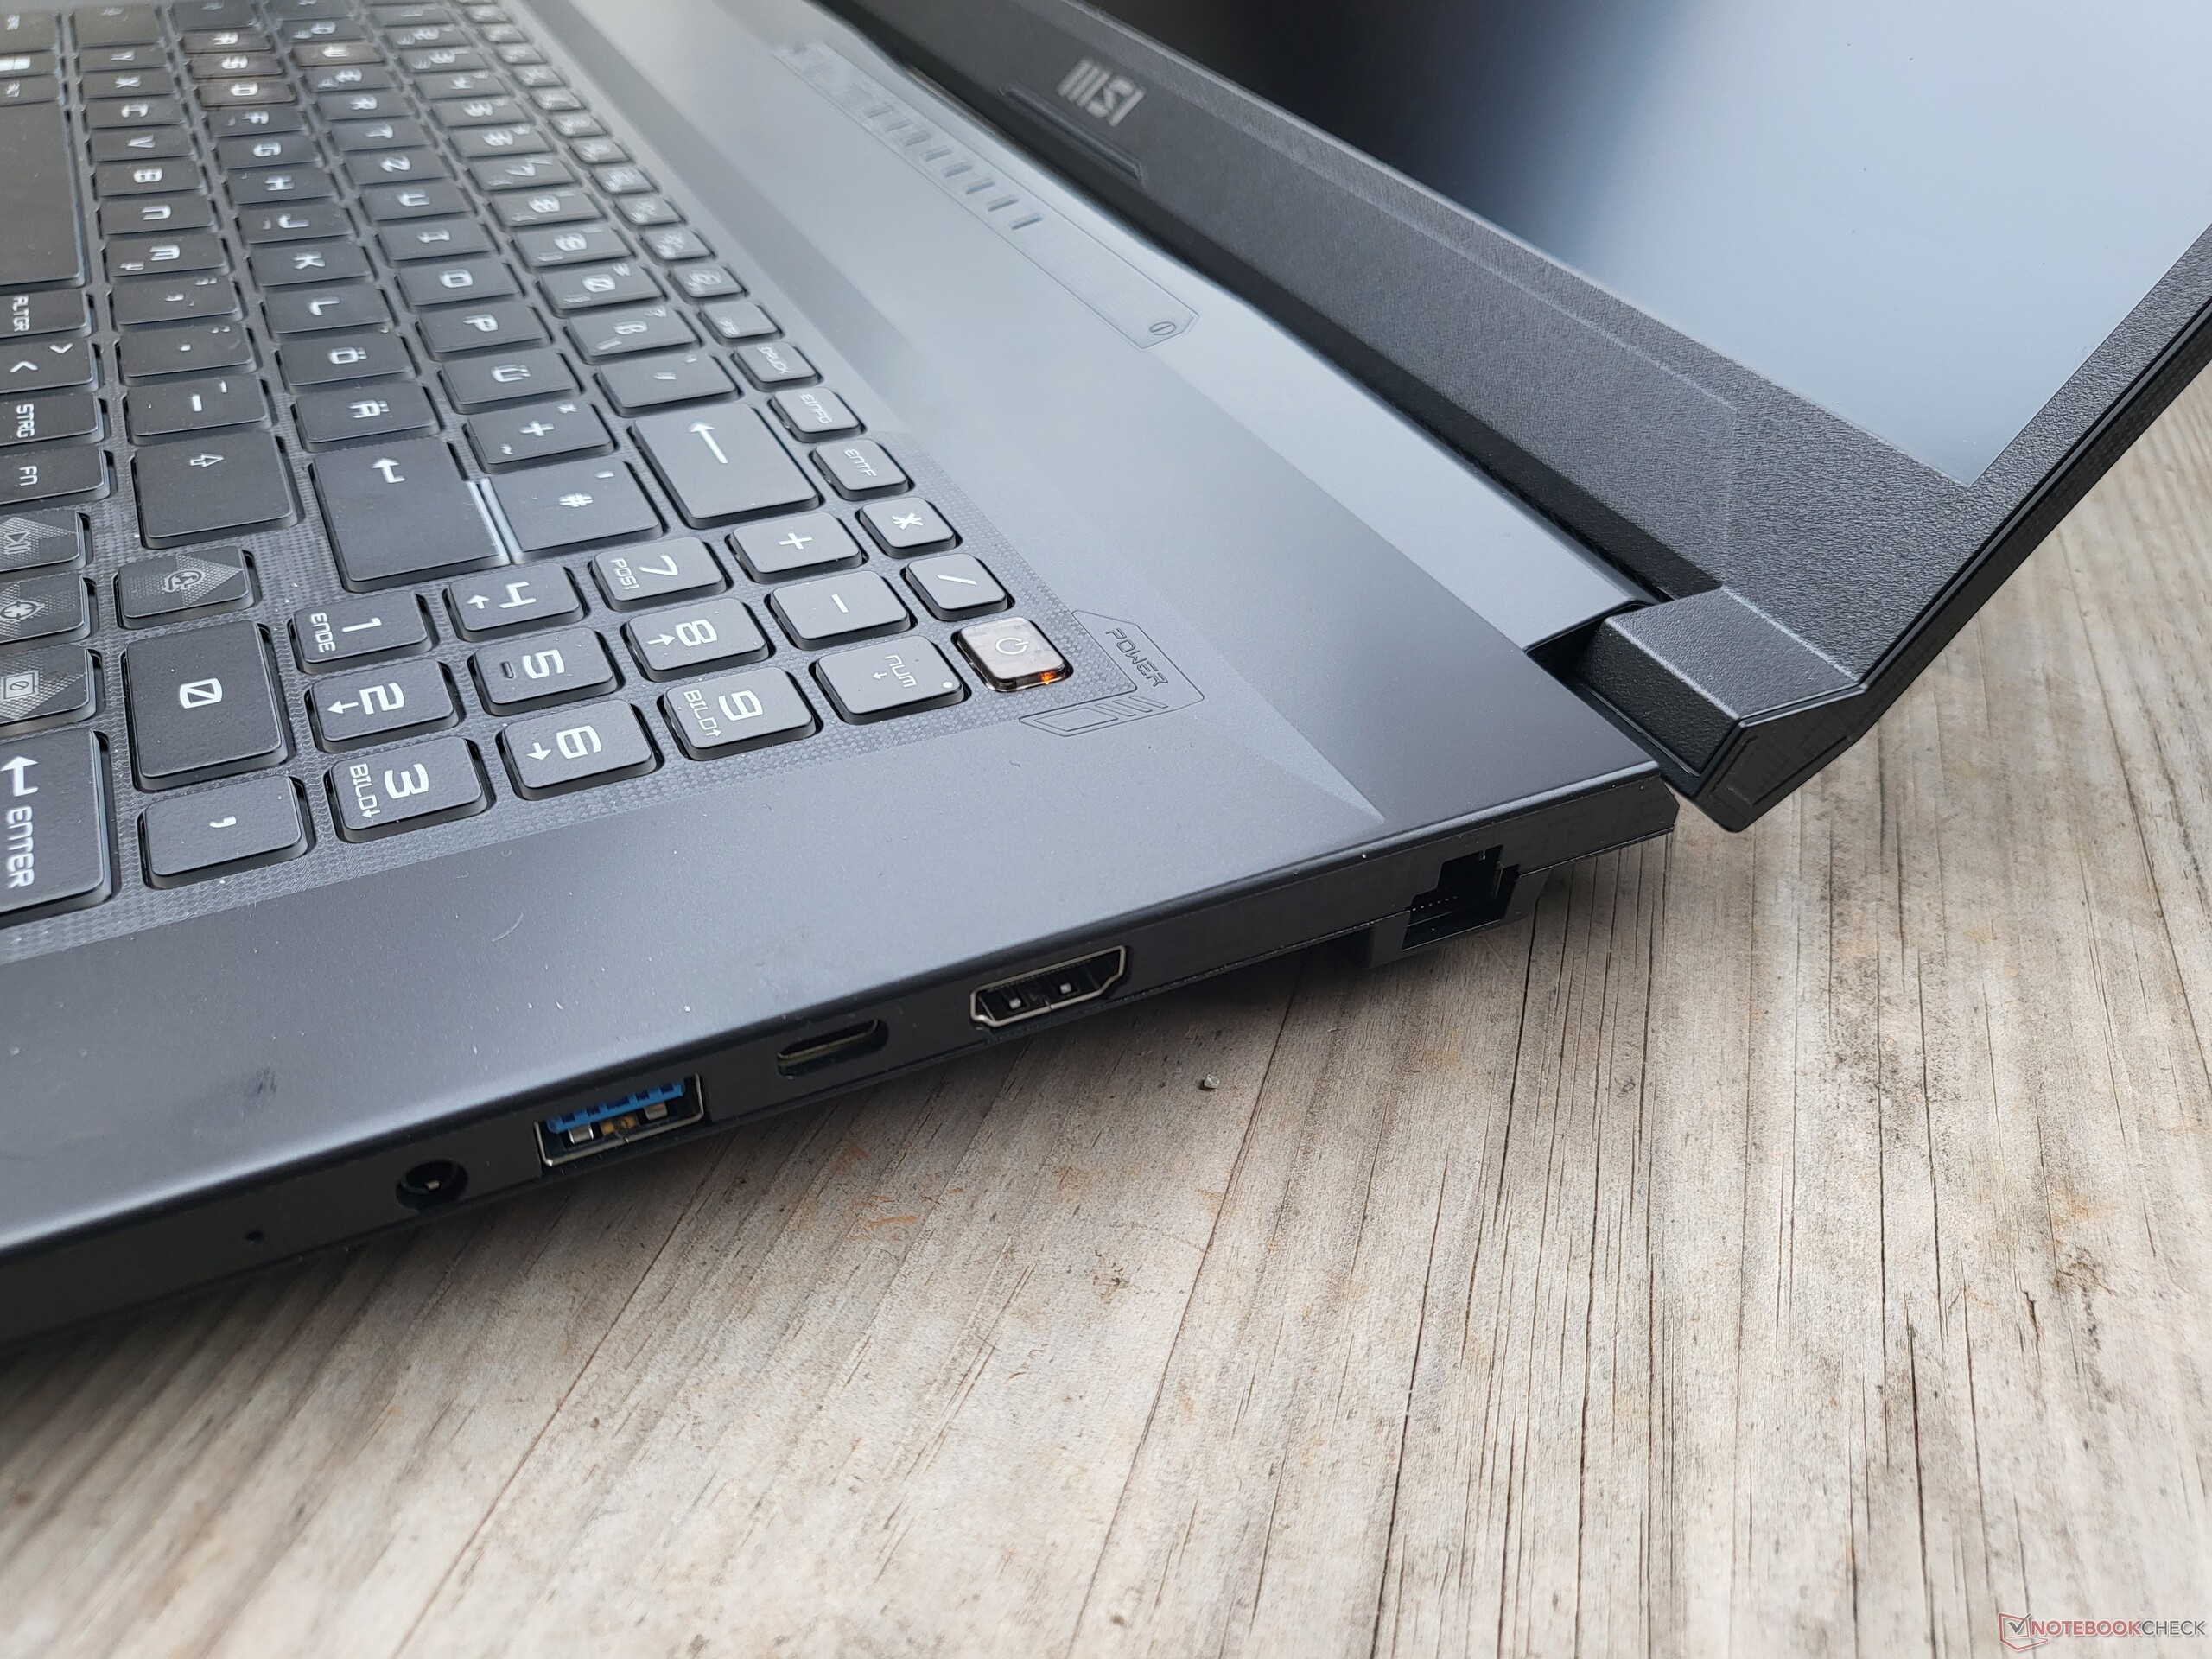
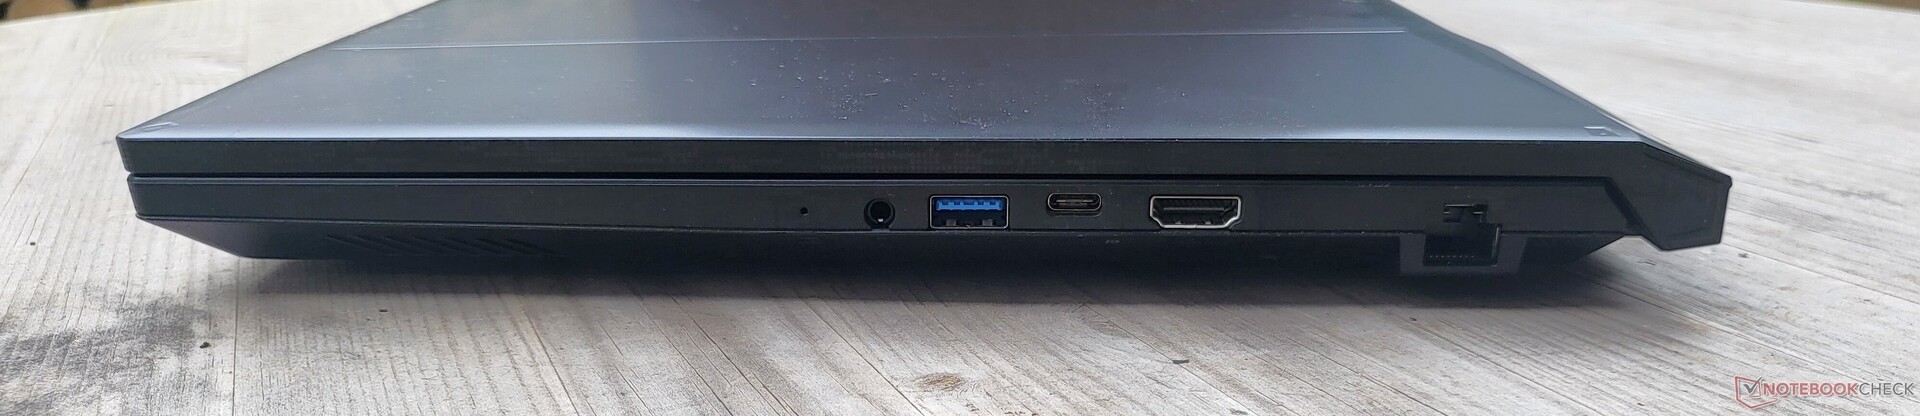
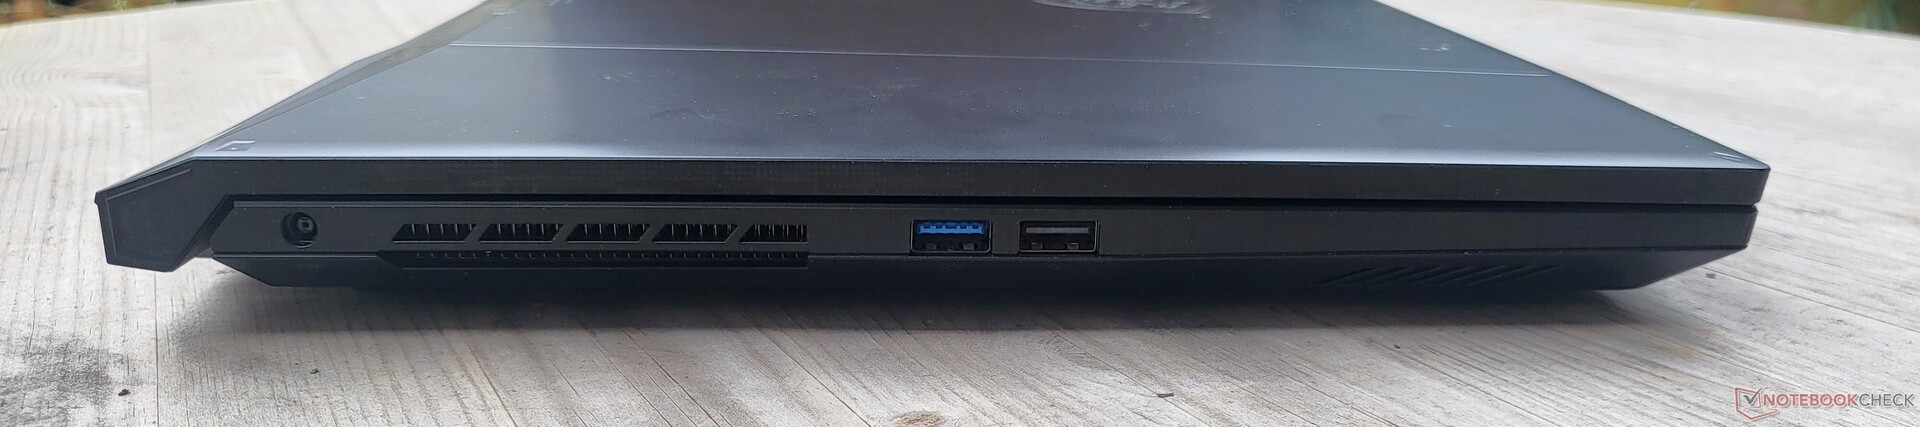
Legfőbb kritikánk a kijelzőt célozza: nem elég világos, a színtérlefedettség gyenge, a válaszidő pedig hosszú. Emellett az USB-2.0 portot 2023 már nélkülözheti. Ezen felül szerintünk a billentyűzetkiosztás is rosszul kivitelezett, mivel az olyan billentyűk, mint például az FN, meglehetősen szokatlan helyre kerültek. A gyenge üzemidőre számítani lehet egy gamer laptop esetében, de ettől függetlenül kritikára érdemes.
GeForce RTX 4060: Az MSI 17 Katana B13V vonzereje a GPU-n áll vagy bukik.
Összességében az MSI Katana 17 jó pontszámot érdemelt ki, és az RTX 4060-nal mindenképpen érdekes választásnak számít a gamerek számára. Infláció idején viszont ez az előző generációs modellekre is igaz, mint például a Gigabyte G7 KE RTX 3060-nal. Az ártudatos vásárlók sok pénzt takaríthatnak meg az előző generációs modellek valamelyikén.
Ár és elérhetőség
Az értékelés közzétételének idején az MSI Katana 17 B14V nem érhető el az Amazonon és a Best Buy-on. Az előző generációs modell (3070Ti) azonban jelenleg 1499 dollár körüli áron kapható az Amazonon.
MSI Katana 17 B13VFK
- 02/21/2023 v7 (old)
Benjamin Herzig
Átláthatóság
A felülvizsgálandó készülékek kiválasztását szerkesztőségünk végzi. A tesztmintát a gyártó vagy a kiskereskedő kölcsönként bocsátotta a szerző rendelkezésére a felülvizsgálat céljából. A hitelezőnek nem volt befolyása erre a felülvizsgálatra, és a gyártó sem kapott másolatot erről a felülvizsgálatról a közzététel előtt. Nem volt kötelesség ezt az ismertetőt közzétenni. Független médiavállalatként a Notebookcheck nincs alávetve a gyártók, kiskereskedők vagy kiadók felhatalmazásának.
Így tesztel a Notebookcheck
A Notebookcheck minden évben független, laptopok és okostelefonok százait vizsgálja meg szabványosított eljárások alkalmazásával annak érdekében, hogy minden eredmény összehasonlítható legyen. Körülbelül 20 éve folyamatosan fejlesztjük vizsgálati módszereinket, és ennek során iparági szabványokat állítottunk fel. Tesztlaboratóriumainkban kiváló minőségű mérőberendezéseket használnak tapasztalt technikusok és szerkesztők. Ezek a tesztek többlépcsős validációs folyamatot foglalnak magukban. Komplex minősítési rendszerünk több száz megalapozott mérésen és benchmarkon alapul, ami megőrzi az objektivitást.Price comparison

