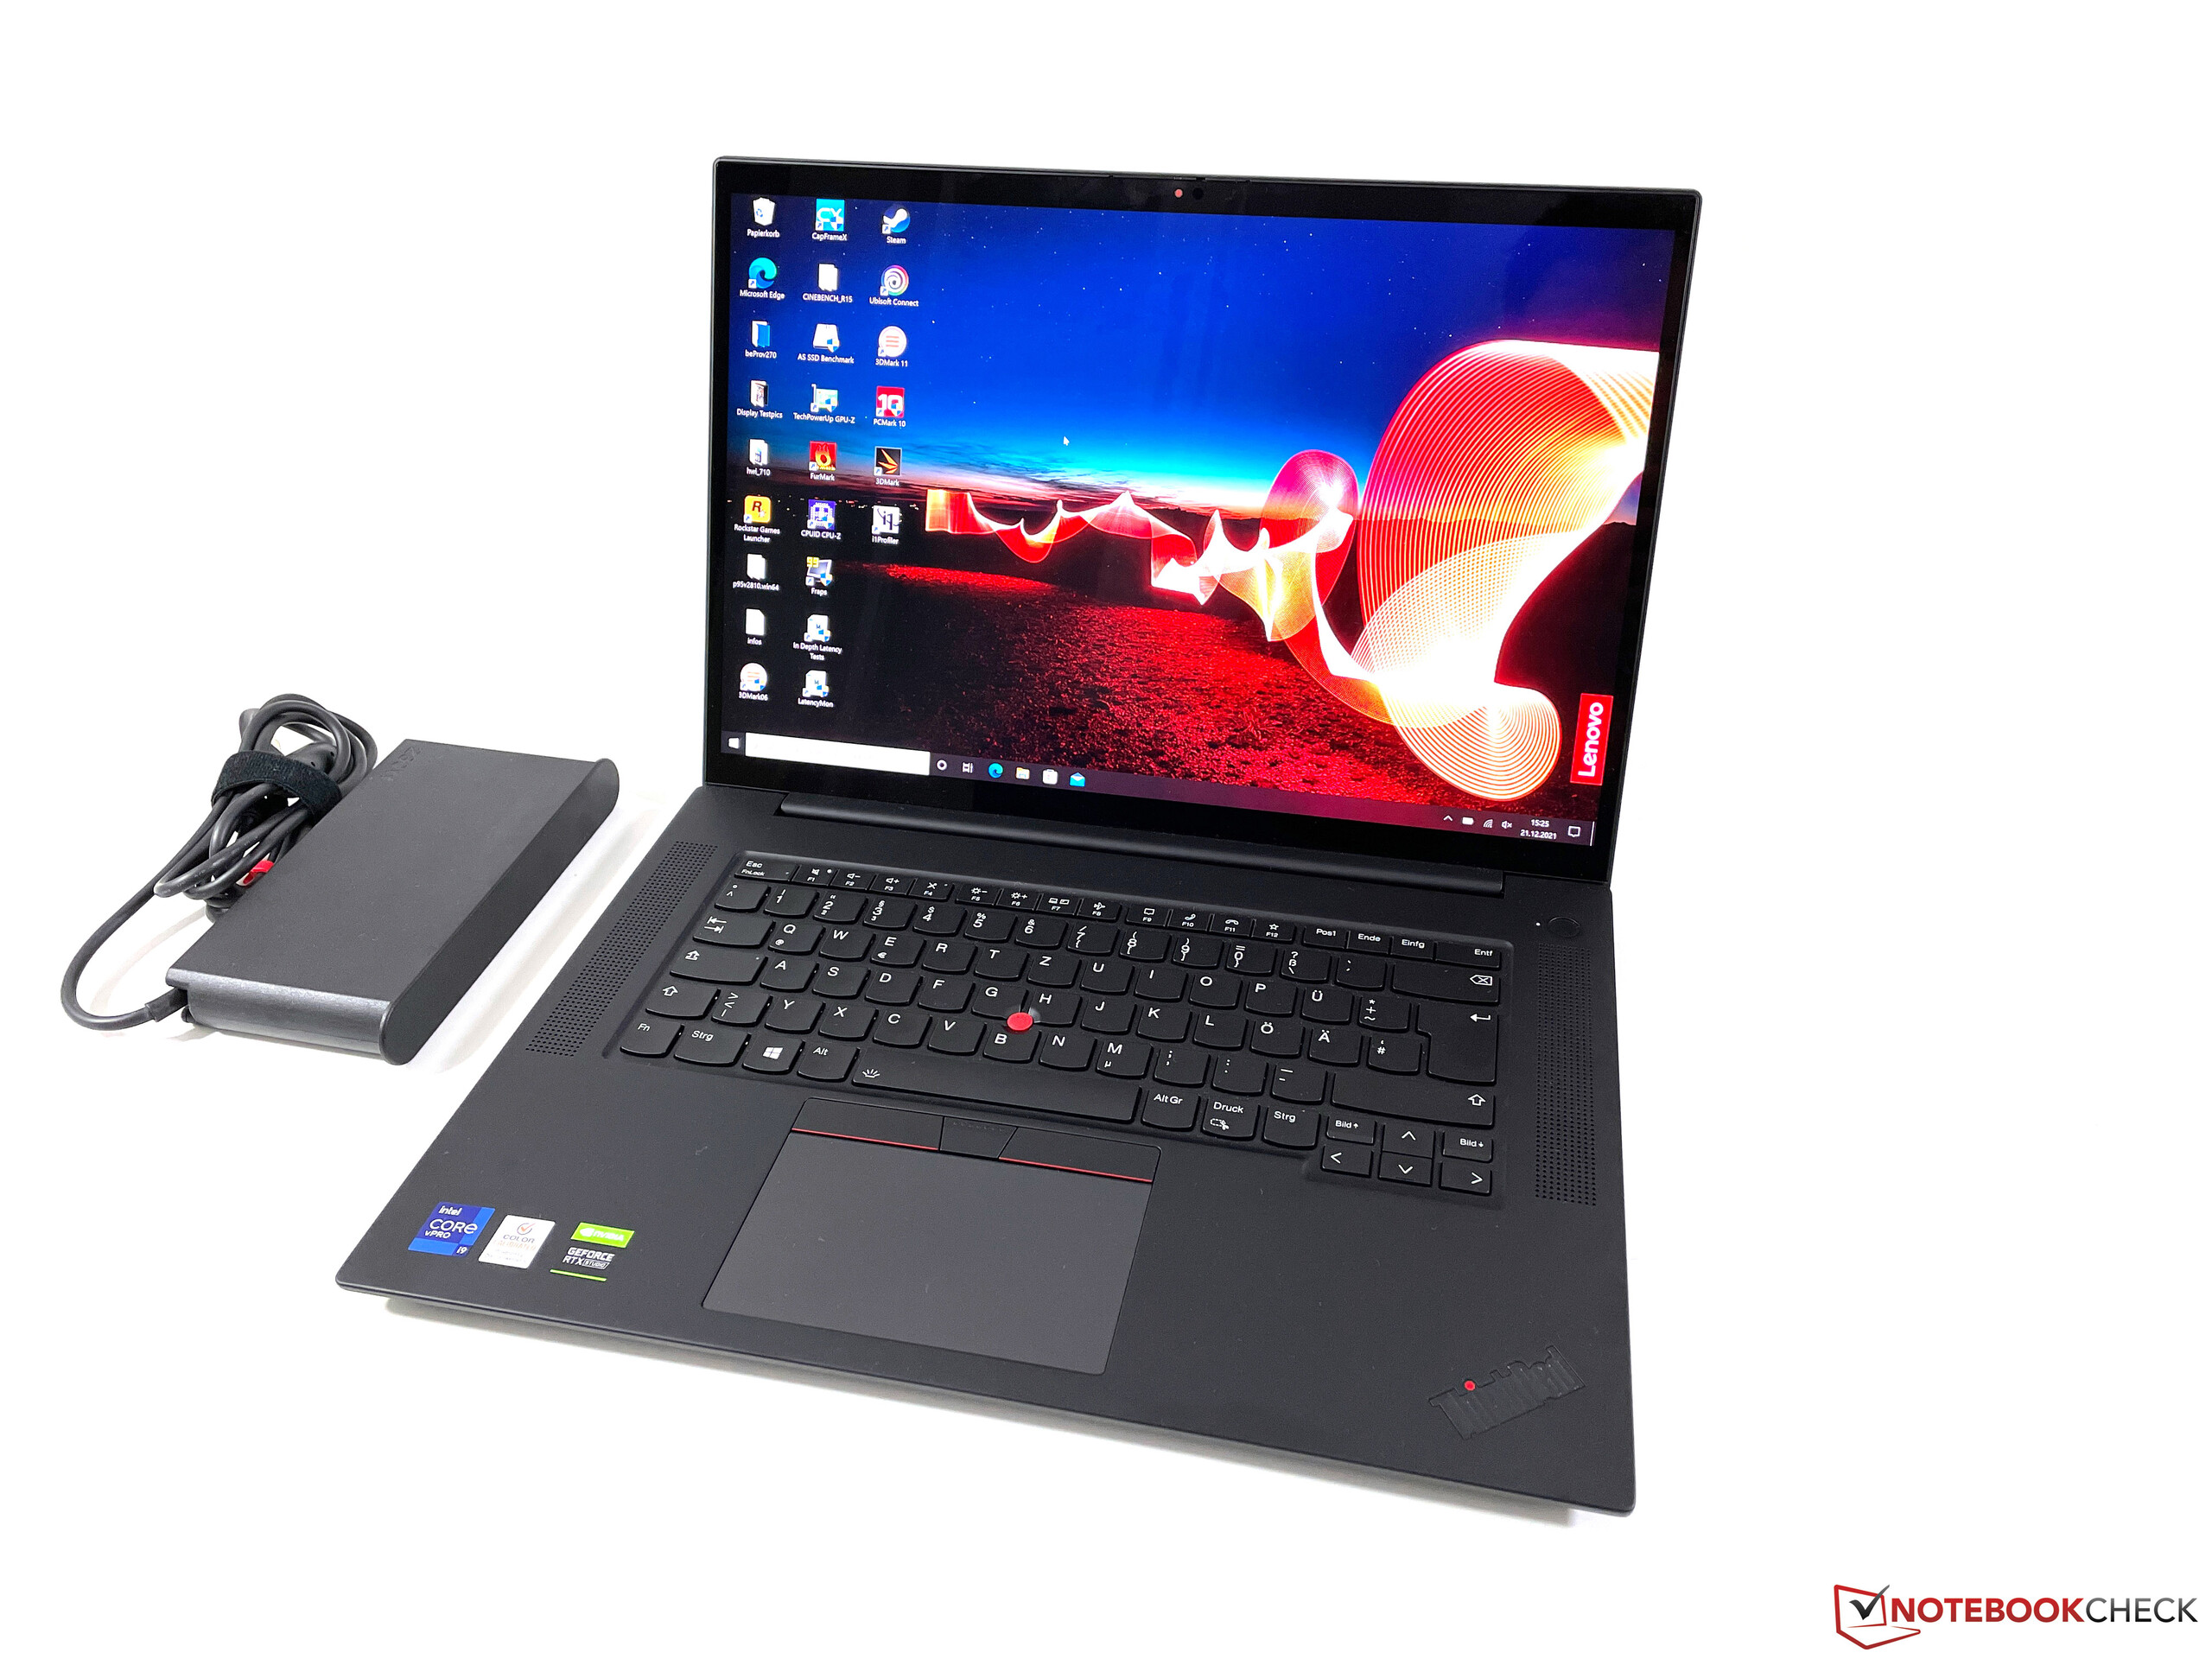
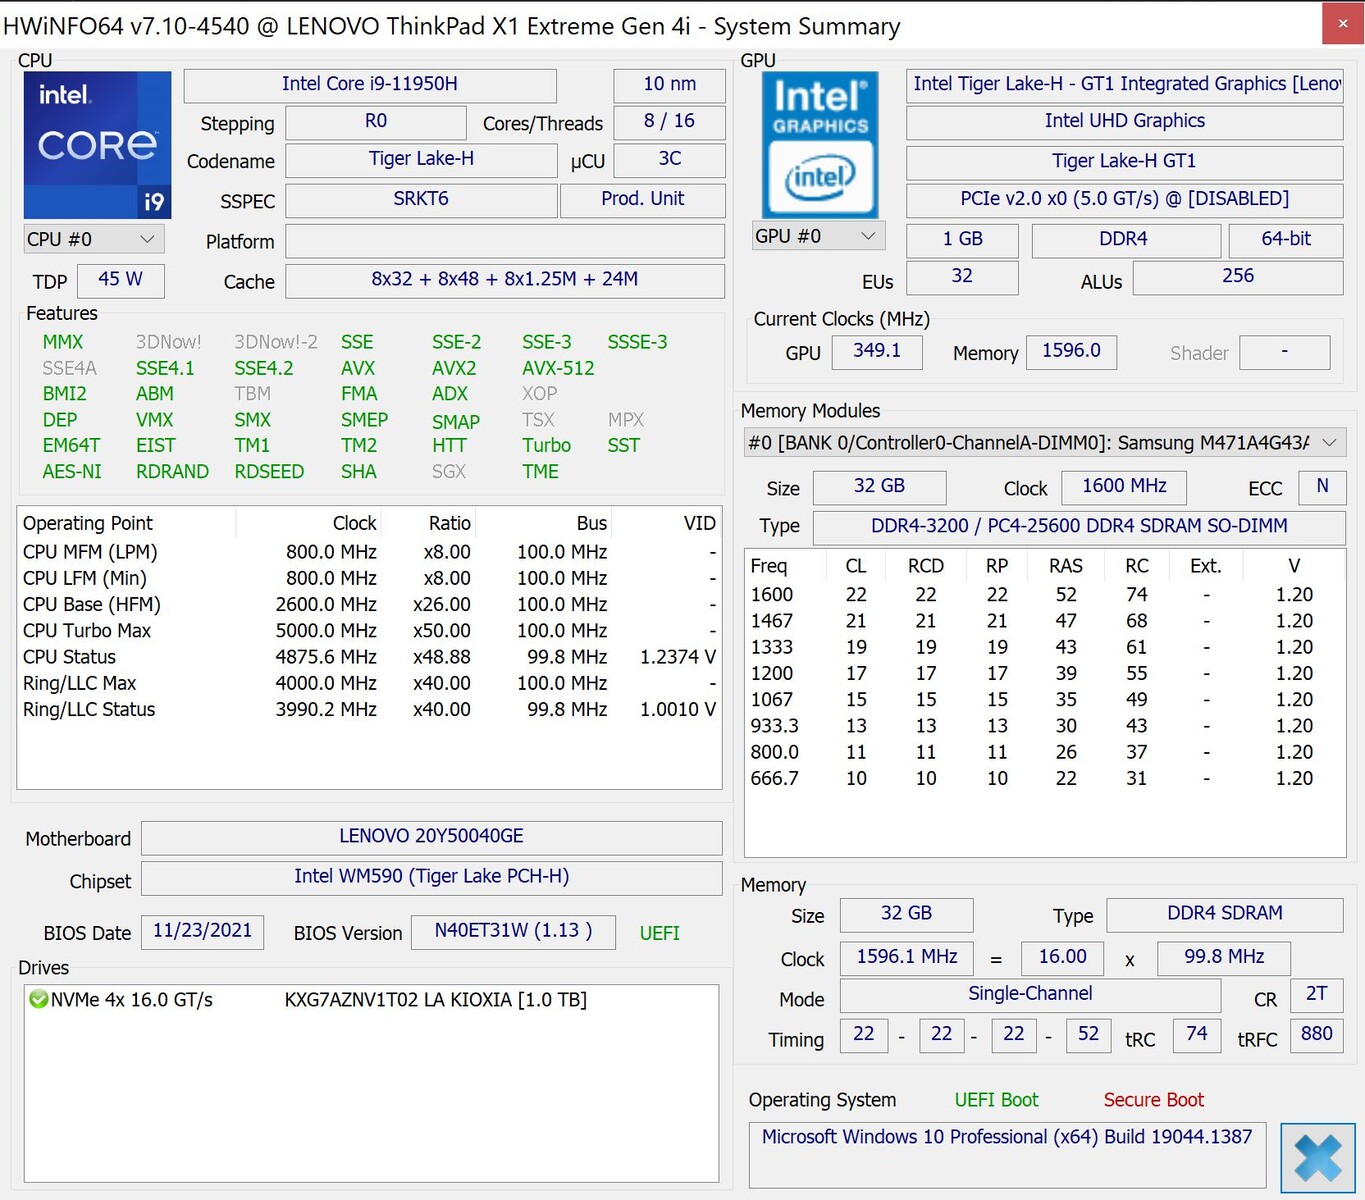
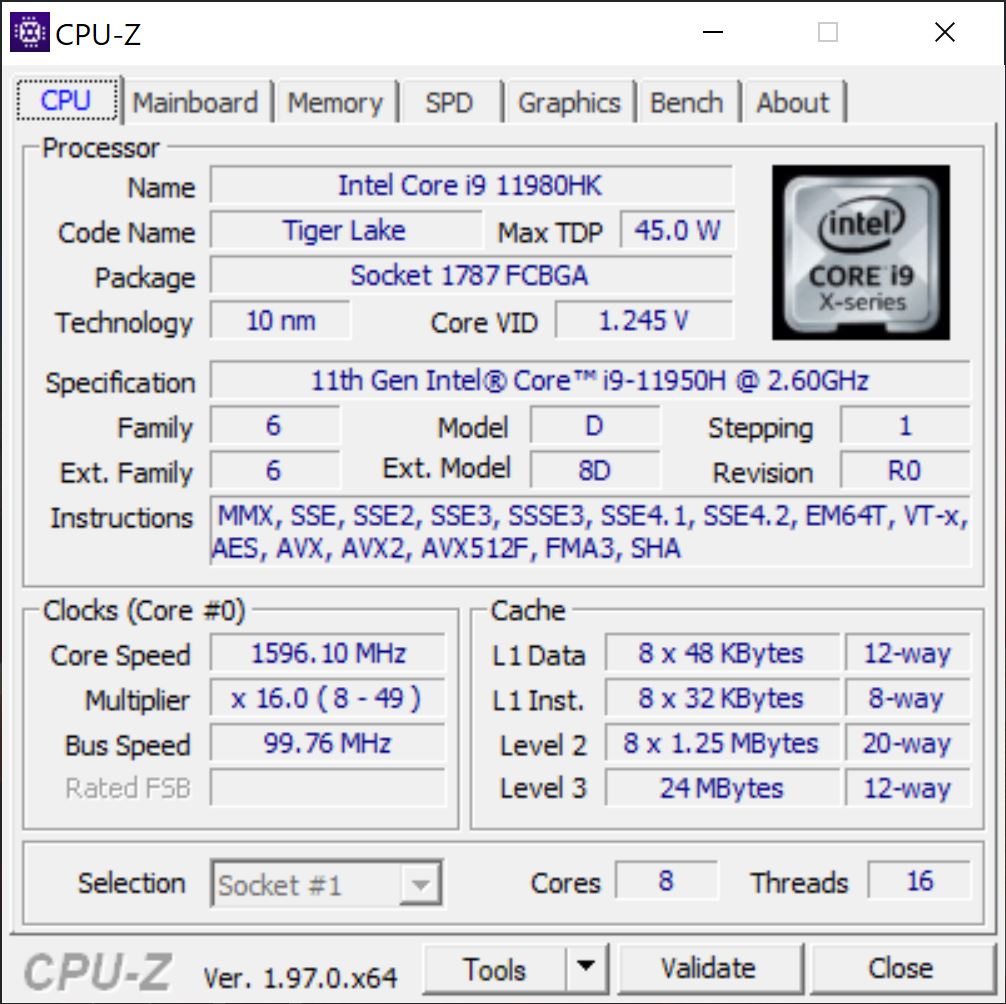
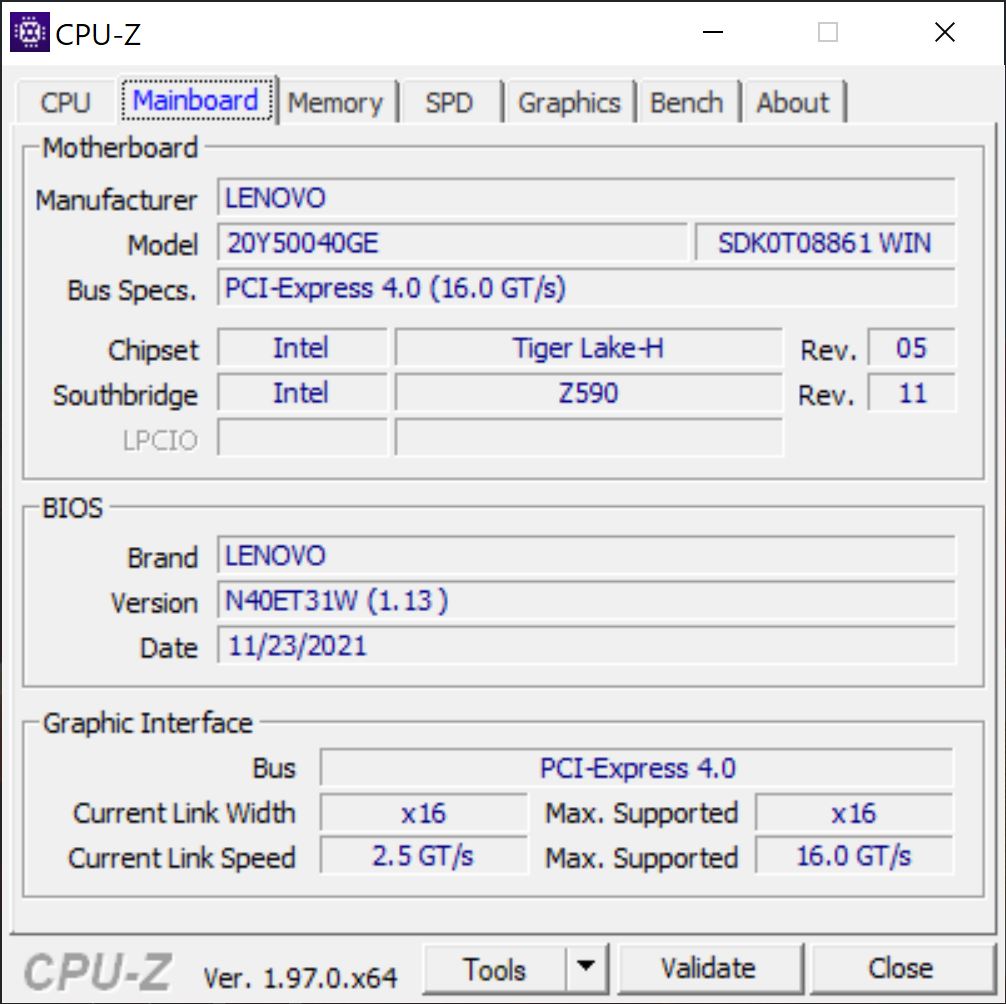
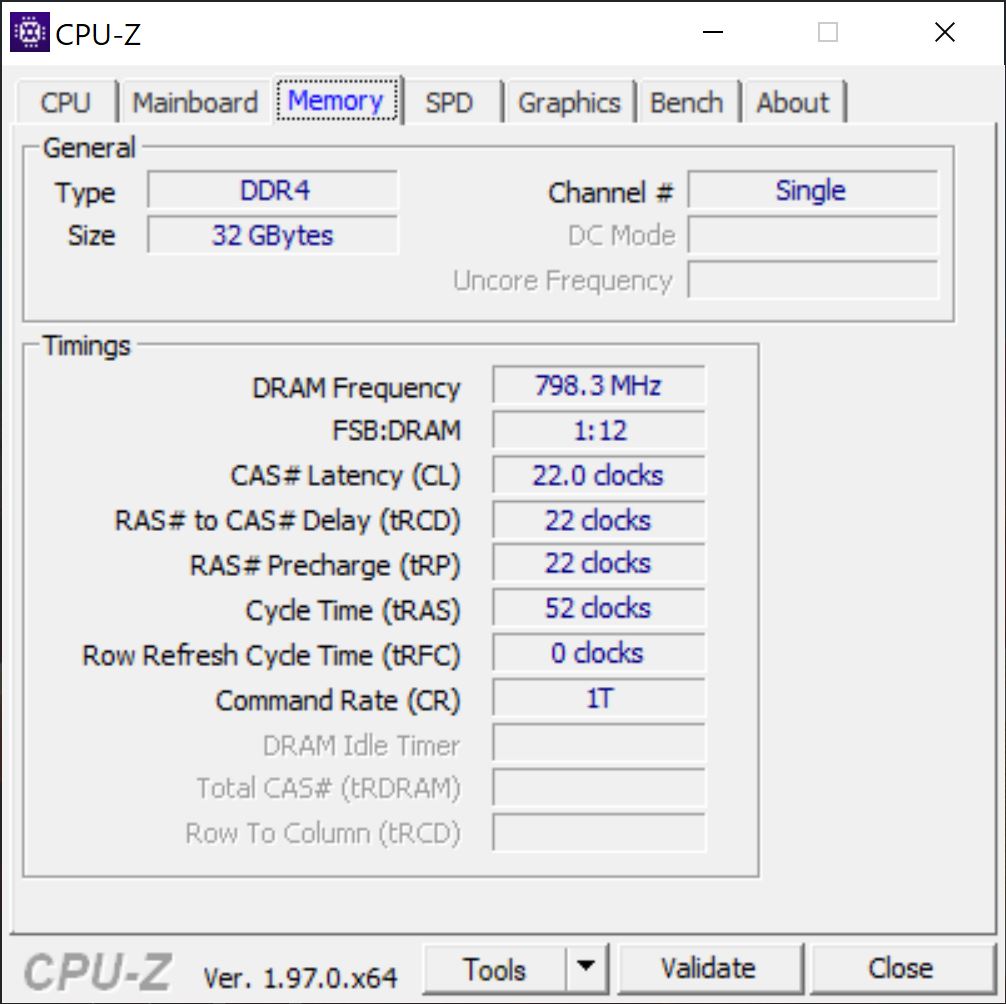
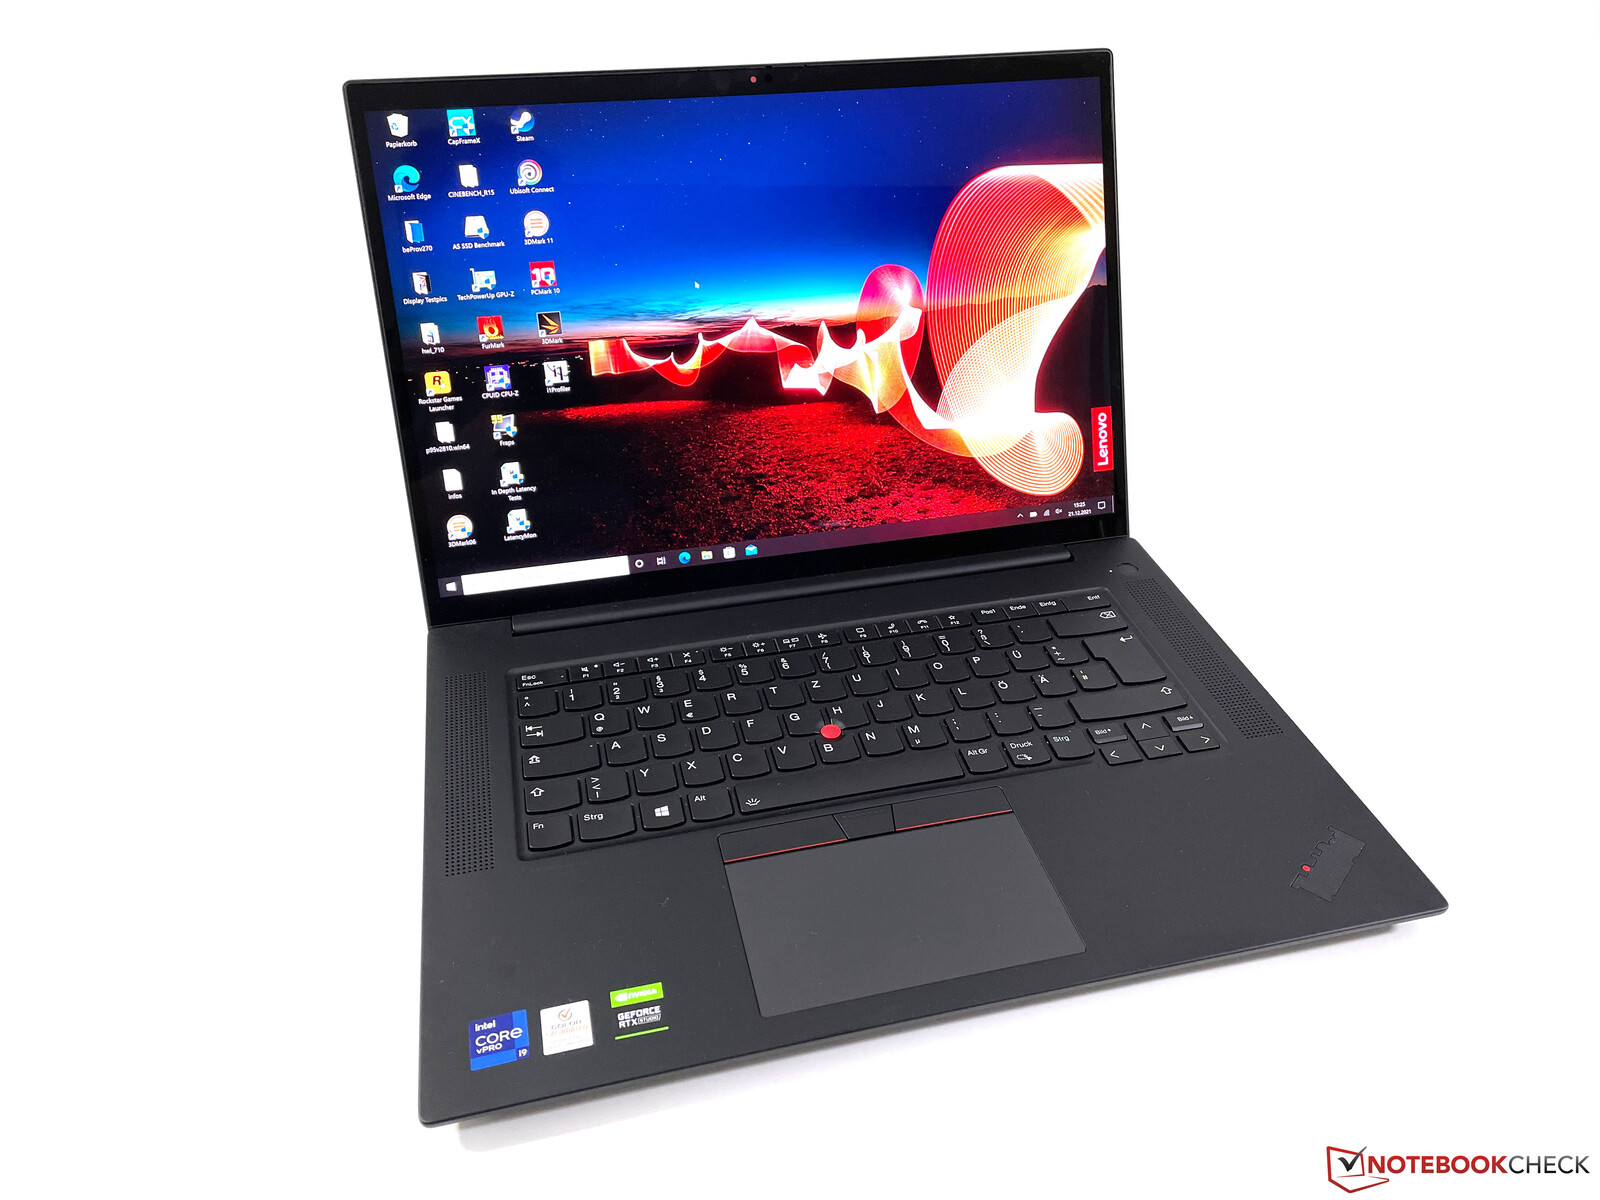
Lenovo ThinkPad X1 Extreme G4 rövid értékelés: A legjobb multimédiás laptop a Core i9 processzornak és az RTX 3080-as videokártyának köszönhetően?
Possible Competitors
Értékelés | Dátum | Modell | Súly | Magasság | Méret | Felbontás | Legjobb ár |
|---|---|---|---|---|---|---|---|
| 88.3 % v7 (old) | 06/2022 | Lenovo ThinkPad X1 Extreme G4-20Y50040GE i9-11950H, GeForce RTX 3080 Laptop GPU | 1.9 kg | 18.2 mm | 16.00" | 3840x2400 | |
| 89.8 % v7 (old) | 06/2022 | Lenovo ThinkPad P1 G4-20Y4S0KS00 i7-11850H, GeForce RTX 3070 Laptop GPU | 2 kg | 17.7 mm | 16.00" | 3840x2400 | |
| 92.5 % v7 (old) | 03/2022 | Apple MacBook Pro 16 2021 M1 Max M1 Max, M1 Max 32-Core GPU | 2.2 kg | 16.8 mm | 16.20" | 3456x2234 | |
| 87.8 % v7 (old) | 10/2021 | HP ZBook Studio 15 G8 i9-11950H, GeForce RTX 3070 Laptop GPU | 1.9 kg | 18 mm | 15.60" | 3840x2160 | |
| 88.9 % v7 (old) | 10/2021 | Razer Blade 15 Advanced (Mid 2021) i7-11800H, GeForce RTX 3080 Laptop GPU | 2 kg | 16.99 mm | 15.60" | 1920x1080 | |
| 86.6 % v7 (old) | 07/2021 | Asus ROG Zephyrus Duo 15 SE GX551QS R9 5900HX, GeForce RTX 3080 Laptop GPU | 2.5 kg | 20.9 mm | 15.60" | 3840x2160 |
| Lenovo ThinkPad X1 Extreme G4-20Y50040GE LP160UQ1-SPB1, IPS, 3840x2400, 16" | Lenovo ThinkPad X1 Extreme G4-20Y5CTO1WW (3050 Ti) LP160UQ1-SPB1, IPS LED, 3840x2400, 16" | Lenovo ThinkPad P1 G4-20Y4S0KS00 LP160UQ1-SPB1, IPS LED, 3840x2400, 16" | Lenovo ThinkPad P1 G4-20Y30017GE B160QAN02.M, IPS, 2560x1600, 16" | |
|---|---|---|---|---|
| Display | ||||
| Display P3 Coverage (%) | 84.3 | 85.7 | 77.3 | |
| sRGB Coverage (%) | 98.3 | 99.4 | 99.9 | |
| AdobeRGB 1998 Coverage (%) | 97.8 | 98.9 | 78.1 | |
| Response Times | ||||
| Response Time Grey 50% / Grey 80% * (ms) | 60 ? | 55.2 ? | 40.8 ? | |
| Response Time Black / White * (ms) | 42 ? | 31.2 ? | 26.4 ? | |
| PWM Frequency (Hz) | ||||
| Screen | ||||
| Brightness middle (cd/m²) | 639 | 630 | 420 | |
| Black Level * (cd/m²) | 0.47 | 0.41 | 0.3 | |
| Brightness (cd/m²) | 612 | 622 | 401 | |
| Brightness Distribution (%) | 84 | 90 | 90 | |
| Contrast (:1) | 1360 | 1537 | 1400 | |
| Colorchecker dE 2000 * | 2.2 | 2.2 | 2.5 | |
| Colorchecker dE 2000 max. * | 5.3 | 5 | 4.9 | |
| Colorchecker dE 2000 calibrated * | 1.4 | 1 | 1.6 | |
| Greyscale dE 2000 * | 1.7 | 2.7 | 3.4 | |
| Gamma | 2.31 95% | 2.26 97% | 2.24 98% | |
| CCT | 6390 102% | 6886 94% | 6479 100% | |
| Teljes átlag (program / beállítások) |
* ... a kisebb jobb
Cinebench R15 Multi Loop
Cinebench R23: Multi Core | Single Core
Cinebench R20: CPU (Multi Core) | CPU (Single Core)
Cinebench R15: CPU Multi 64Bit | CPU Single 64Bit
Blender: v2.79 BMW27 CPU
7-Zip 18.03: 7z b 4 | 7z b 4 -mmt1
Geekbench 5.5: Multi-Core | Single-Core
HWBOT x265 Benchmark v2.2: 4k Preset
LibreOffice : 20 Documents To PDF
R Benchmark 2.5: Overall mean
| CPU Performance rating | |
| Az osztály átlaga Multimedia | |
| Asus ROG Zephyrus Duo 15 SE GX551QS | |
| Apple MacBook Pro 16 2021 M1 Max -5! | |
| Lenovo ThinkPad X1 Extreme G4-20Y50040GE -3! | |
| Lenovo ThinkPad P1 G4-20Y4S0KS00 | |
| Átlagos Intel Core i9-11950H | |
| HP ZBook Studio 15 G8 | |
| Razer Blade 15 Advanced (Mid 2021) -2! | |
| Cinebench R23 / Multi Core | |
| Az osztály átlaga Multimedia (4861 - 33362, n=65, az elmúlt 2 évben) | |
| Asus ROG Zephyrus Duo 15 SE GX551QS | |
| Átlagos Intel Core i9-11950H (12048 - 13113, n=4) | |
| Apple MacBook Pro 16 2021 M1 Max | |
| Razer Blade 15 Advanced (Mid 2021) | |
| HP ZBook Studio 15 G8 | |
| Lenovo ThinkPad X1 Extreme G4-20Y50040GE | |
| Lenovo ThinkPad P1 G4-20Y4S0KS00 | |
| Cinebench R23 / Single Core | |
| Az osztály átlaga Multimedia (1128 - 2459, n=64, az elmúlt 2 évben) | |
| Átlagos Intel Core i9-11950H (1569 - 1633, n=4) | |
| Lenovo ThinkPad X1 Extreme G4-20Y50040GE | |
| HP ZBook Studio 15 G8 | |
| Lenovo ThinkPad P1 G4-20Y4S0KS00 | |
| Apple MacBook Pro 16 2021 M1 Max | |
| Razer Blade 15 Advanced (Mid 2021) | |
| Asus ROG Zephyrus Duo 15 SE GX551QS | |
| Cinebench R20 / CPU (Multi Core) | |
| Az osztály átlaga Multimedia (1887 - 12912, n=56, az elmúlt 2 évben) | |
| Asus ROG Zephyrus Duo 15 SE GX551QS | |
| Razer Blade 15 Advanced (Mid 2021) | |
| Átlagos Intel Core i9-11950H (4471 - 5000, n=4) | |
| Lenovo ThinkPad P1 G4-20Y4S0KS00 | |
| HP ZBook Studio 15 G8 | |
| Lenovo ThinkPad X1 Extreme G4-20Y50040GE | |
| Apple MacBook Pro 16 2021 M1 Max | |
| Cinebench R20 / CPU (Single Core) | |
| Az osztály átlaga Multimedia (425 - 853, n=56, az elmúlt 2 évben) | |
| Lenovo ThinkPad X1 Extreme G4-20Y50040GE | |
| Átlagos Intel Core i9-11950H (610 - 632, n=4) | |
| HP ZBook Studio 15 G8 | |
| Lenovo ThinkPad P1 G4-20Y4S0KS00 | |
| Razer Blade 15 Advanced (Mid 2021) | |
| Asus ROG Zephyrus Duo 15 SE GX551QS | |
| Apple MacBook Pro 16 2021 M1 Max | |
| Cinebench R15 / CPU Multi 64Bit | |
| Az osztály átlaga Multimedia (856 - 5224, n=60, az elmúlt 2 évben) | |
| Asus ROG Zephyrus Duo 15 SE GX551QS | |
| Lenovo ThinkPad X1 Extreme G4-20Y50040GE | |
| Lenovo ThinkPad X1 Extreme G4-20Y50040GE | |
| Lenovo ThinkPad P1 G4-20Y4S0KS00 | |
| Átlagos Intel Core i9-11950H (1827 - 2130, n=5) | |
| Razer Blade 15 Advanced (Mid 2021) | |
| HP ZBook Studio 15 G8 | |
| Apple MacBook Pro 16 2021 M1 Max | |
| Cinebench R15 / CPU Single 64Bit | |
| Az osztály átlaga Multimedia (184.8 - 326, n=58, az elmúlt 2 évben) | |
| Lenovo ThinkPad X1 Extreme G4-20Y50040GE | |
| Átlagos Intel Core i9-11950H (236 - 249, n=4) | |
| HP ZBook Studio 15 G8 | |
| Asus ROG Zephyrus Duo 15 SE GX551QS | |
| Lenovo ThinkPad P1 G4-20Y4S0KS00 | |
| Razer Blade 15 Advanced (Mid 2021) | |
| Apple MacBook Pro 16 2021 M1 Max | |
| Blender / v2.79 BMW27 CPU | |
| Razer Blade 15 Advanced (Mid 2021) | |
| Lenovo ThinkPad P1 G4-20Y4S0KS00 | |
| HP ZBook Studio 15 G8 | |
| Átlagos Intel Core i9-11950H (244 - 261, n=3) | |
| Az osztály átlaga Multimedia (100 - 557, n=57, az elmúlt 2 évben) | |
| Asus ROG Zephyrus Duo 15 SE GX551QS | |
| Apple MacBook Pro 16 2021 M1 Max | |
| 7-Zip 18.03 / 7z b 4 | |
| Asus ROG Zephyrus Duo 15 SE GX551QS | |
| Az osztály átlaga Multimedia (26062 - 130368, n=54, az elmúlt 2 évben) | |
| Razer Blade 15 Advanced (Mid 2021) | |
| Lenovo ThinkPad P1 G4-20Y4S0KS00 | |
| Átlagos Intel Core i9-11950H (50050 - 51402, n=3) | |
| HP ZBook Studio 15 G8 | |
| 7-Zip 18.03 / 7z b 4 -mmt1 | |
| Az osztály átlaga Multimedia (3666 - 7545, n=55, az elmúlt 2 évben) | |
| Átlagos Intel Core i9-11950H (5755 - 5919, n=3) | |
| HP ZBook Studio 15 G8 | |
| Lenovo ThinkPad P1 G4-20Y4S0KS00 | |
| Asus ROG Zephyrus Duo 15 SE GX551QS | |
| Razer Blade 15 Advanced (Mid 2021) | |
| Geekbench 5.5 / Multi-Core | |
| Az osztály átlaga Multimedia (4652 - 20422, n=55, az elmúlt 2 évben) | |
| Apple MacBook Pro 16 2021 M1 Max | |
| Lenovo ThinkPad P1 G4-20Y4S0KS00 | |
| Asus ROG Zephyrus Duo 15 SE GX551QS | |
| Lenovo ThinkPad X1 Extreme G4-20Y50040GE | |
| Átlagos Intel Core i9-11950H (7286 - 8152, n=3) | |
| HP ZBook Studio 15 G8 | |
| Geekbench 5.5 / Single-Core | |
| Az osztály átlaga Multimedia (805 - 2974, n=55, az elmúlt 2 évben) | |
| Apple MacBook Pro 16 2021 M1 Max | |
| HP ZBook Studio 15 G8 | |
| Lenovo ThinkPad P1 G4-20Y4S0KS00 | |
| Átlagos Intel Core i9-11950H (1623 - 1702, n=3) | |
| Lenovo ThinkPad X1 Extreme G4-20Y50040GE | |
| Asus ROG Zephyrus Duo 15 SE GX551QS | |
| HWBOT x265 Benchmark v2.2 / 4k Preset | |
| Az osztály átlaga Multimedia (5.26 - 36.1, n=55, az elmúlt 2 évben) | |
| Asus ROG Zephyrus Duo 15 SE GX551QS | |
| Razer Blade 15 Advanced (Mid 2021) | |
| HP ZBook Studio 15 G8 | |
| Lenovo ThinkPad P1 G4-20Y4S0KS00 | |
| Átlagos Intel Core i9-11950H (13.8 - 14.5, n=4) | |
| Lenovo ThinkPad X1 Extreme G4-20Y50040GE | |
| LibreOffice / 20 Documents To PDF | |
| Az osztály átlaga Multimedia (23.9 - 146.7, n=56, az elmúlt 2 évben) | |
| HP ZBook Studio 15 G8 | |
| Átlagos Intel Core i9-11950H (38.6 - 53.2, n=4) | |
| Razer Blade 15 Advanced (Mid 2021) | |
| Lenovo ThinkPad P1 G4-20Y4S0KS00 | |
| Asus ROG Zephyrus Duo 15 SE GX551QS | |
| Lenovo ThinkPad X1 Extreme G4-20Y50040GE | |
| R Benchmark 2.5 / Overall mean | |
| HP ZBook Studio 15 G8 | |
| Razer Blade 15 Advanced (Mid 2021) | |
| Lenovo ThinkPad X1 Extreme G4-20Y50040GE | |
| Lenovo ThinkPad P1 G4-20Y4S0KS00 | |
| Átlagos Intel Core i9-11950H (0.521 - 0.551, n=4) | |
| Asus ROG Zephyrus Duo 15 SE GX551QS | |
| Az osztály átlaga Multimedia (0.3604 - 0.947, n=55, az elmúlt 2 évben) | |
* ... a kisebb jobb
AIDA64: FP32 Ray-Trace | FPU Julia | CPU SHA3 | CPU Queen | FPU SinJulia | FPU Mandel | CPU AES | CPU ZLib | FP64 Ray-Trace | CPU PhotoWorxx
| Performance rating | |
| Az osztály átlaga Multimedia | |
| Lenovo ThinkPad X1 Extreme G4-20Y50040GE | |
| Átlagos Intel Core i9-11950H | |
| HP ZBook Studio 15 G8 | |
| Lenovo ThinkPad P1 G4-20Y4S0KS00 -9! | |
| Razer Blade 15 Advanced (Mid 2021) -9! | |
| AIDA64 / FP32 Ray-Trace | |
| Az osztály átlaga Multimedia (2214 - 50388, n=53, az elmúlt 2 évben) | |
| Lenovo ThinkPad X1 Extreme G4-20Y50040GE | |
| Átlagos Intel Core i9-11950H (14407 - 15655, n=4) | |
| HP ZBook Studio 15 G8 | |
| AIDA64 / FPU Julia | |
| Az osztály átlaga Multimedia (12867 - 201874, n=53, az elmúlt 2 évben) | |
| Lenovo ThinkPad X1 Extreme G4-20Y50040GE | |
| Átlagos Intel Core i9-11950H (60286 - 63537, n=4) | |
| HP ZBook Studio 15 G8 | |
| AIDA64 / CPU SHA3 | |
| Lenovo ThinkPad X1 Extreme G4-20Y50040GE | |
| Átlagos Intel Core i9-11950H (4003 - 4254, n=4) | |
| HP ZBook Studio 15 G8 | |
| Az osztály átlaga Multimedia (626 - 8623, n=53, az elmúlt 2 évben) | |
| AIDA64 / CPU Queen | |
| HP ZBook Studio 15 G8 | |
| Átlagos Intel Core i9-11950H (97840 - 98772, n=4) | |
| Lenovo ThinkPad X1 Extreme G4-20Y50040GE | |
| Az osztály átlaga Multimedia (13483 - 181505, n=40, az elmúlt 2 évben) | |
| AIDA64 / FPU SinJulia | |
| Lenovo ThinkPad X1 Extreme G4-20Y50040GE | |
| Átlagos Intel Core i9-11950H (9828 - 10462, n=4) | |
| HP ZBook Studio 15 G8 | |
| Az osztály átlaga Multimedia (886 - 28794, n=53, az elmúlt 2 évben) | |
| AIDA64 / FPU Mandel | |
| Az osztály átlaga Multimedia (6395 - 105740, n=53, az elmúlt 2 évben) | |
| Lenovo ThinkPad X1 Extreme G4-20Y50040GE | |
| Átlagos Intel Core i9-11950H (35735 - 38450, n=4) | |
| HP ZBook Studio 15 G8 | |
| AIDA64 / CPU AES | |
| Lenovo ThinkPad X1 Extreme G4-20Y50040GE | |
| Átlagos Intel Core i9-11950H (83095 - 147249, n=4) | |
| HP ZBook Studio 15 G8 | |
| Az osztály átlaga Multimedia (8171 - 126790, n=53, az elmúlt 2 évben) | |
| AIDA64 / CPU ZLib | |
| Az osztály átlaga Multimedia (143.8 - 2022, n=53, az elmúlt 2 évben) | |
| Lenovo ThinkPad X1 Extreme G4-20Y50040GE | |
| Átlagos Intel Core i9-11950H (756 - 820, n=4) | |
| HP ZBook Studio 15 G8 | |
| Razer Blade 15 Advanced (Mid 2021) | |
| Lenovo ThinkPad P1 G4-20Y4S0KS00 | |
| AIDA64 / FP64 Ray-Trace | |
| Az osztály átlaga Multimedia (1014 - 26875, n=53, az elmúlt 2 évben) | |
| Lenovo ThinkPad X1 Extreme G4-20Y50040GE | |
| Átlagos Intel Core i9-11950H (7871 - 8549, n=4) | |
| HP ZBook Studio 15 G8 | |
| AIDA64 / CPU PhotoWorxx | |
| Az osztály átlaga Multimedia (8187 - 88154, n=53, az elmúlt 2 évben) | |
| HP ZBook Studio 15 G8 | |
| Átlagos Intel Core i9-11950H (12933 - 26370, n=4) | |
| Lenovo ThinkPad X1 Extreme G4-20Y50040GE | |
CrossMark: Overall | Productivity | Creativity | Responsiveness
| PCMark 10 / Score | |
| Az osztály átlaga Multimedia (4325 - 10386, n=51, az elmúlt 2 évben) | |
| Razer Blade 15 Advanced (Mid 2021) | |
| Lenovo ThinkPad P1 G4-20Y4S0KS00 | |
| Lenovo ThinkPad X1 Extreme G4-20Y50040GE | |
| Átlagos Intel Core i9-11950H, NVIDIA GeForce RTX 3080 Laptop GPU (n=1) | |
| Asus ROG Zephyrus Duo 15 SE GX551QS | |
| HP ZBook Studio 15 G8 | |
| PCMark 10 / Essentials | |
| Razer Blade 15 Advanced (Mid 2021) | |
| Lenovo ThinkPad P1 G4-20Y4S0KS00 | |
| Lenovo ThinkPad X1 Extreme G4-20Y50040GE | |
| Átlagos Intel Core i9-11950H, NVIDIA GeForce RTX 3080 Laptop GPU (n=1) | |
| Az osztály átlaga Multimedia (8025 - 11664, n=50, az elmúlt 2 évben) | |
| Asus ROG Zephyrus Duo 15 SE GX551QS | |
| HP ZBook Studio 15 G8 | |
| PCMark 10 / Productivity | |
| Az osztály átlaga Multimedia (7323 - 18233, n=50, az elmúlt 2 évben) | |
| Razer Blade 15 Advanced (Mid 2021) | |
| Lenovo ThinkPad P1 G4-20Y4S0KS00 | |
| Lenovo ThinkPad X1 Extreme G4-20Y50040GE | |
| Átlagos Intel Core i9-11950H, NVIDIA GeForce RTX 3080 Laptop GPU (n=1) | |
| Asus ROG Zephyrus Duo 15 SE GX551QS | |
| HP ZBook Studio 15 G8 | |
| PCMark 10 / Digital Content Creation | |
| Razer Blade 15 Advanced (Mid 2021) | |
| Az osztály átlaga Multimedia (3651 - 16240, n=50, az elmúlt 2 évben) | |
| Lenovo ThinkPad P1 G4-20Y4S0KS00 | |
| HP ZBook Studio 15 G8 | |
| Asus ROG Zephyrus Duo 15 SE GX551QS | |
| Lenovo ThinkPad X1 Extreme G4-20Y50040GE | |
| Átlagos Intel Core i9-11950H, NVIDIA GeForce RTX 3080 Laptop GPU (n=1) | |
| CrossMark / Overall | |
| Az osztály átlaga Multimedia (866 - 2728, n=59, az elmúlt 2 évben) | |
| Lenovo ThinkPad X1 Extreme G4-20Y50040GE | |
| Átlagos Intel Core i9-11950H, NVIDIA GeForce RTX 3080 Laptop GPU (n=1) | |
| Lenovo ThinkPad P1 G4-20Y4S0KS00 | |
| Apple MacBook Pro 16 2021 M1 Max | |
| CrossMark / Productivity | |
| Az osztály átlaga Multimedia (931 - 2489, n=59, az elmúlt 2 évben) | |
| Lenovo ThinkPad X1 Extreme G4-20Y50040GE | |
| Átlagos Intel Core i9-11950H, NVIDIA GeForce RTX 3080 Laptop GPU (n=1) | |
| Lenovo ThinkPad P1 G4-20Y4S0KS00 | |
| Apple MacBook Pro 16 2021 M1 Max | |
| CrossMark / Creativity | |
| Az osztály átlaga Multimedia (907 - 3465, n=59, az elmúlt 2 évben) | |
| Apple MacBook Pro 16 2021 M1 Max | |
| Lenovo ThinkPad P1 G4-20Y4S0KS00 | |
| Lenovo ThinkPad X1 Extreme G4-20Y50040GE | |
| Átlagos Intel Core i9-11950H, NVIDIA GeForce RTX 3080 Laptop GPU (n=1) | |
| CrossMark / Responsiveness | |
| Lenovo ThinkPad X1 Extreme G4-20Y50040GE | |
| Átlagos Intel Core i9-11950H, NVIDIA GeForce RTX 3080 Laptop GPU (n=1) | |
| Az osztály átlaga Multimedia (605 - 2024, n=59, az elmúlt 2 évben) | |
| Lenovo ThinkPad P1 G4-20Y4S0KS00 | |
| Apple MacBook Pro 16 2021 M1 Max | |
| PCMark 10 Score | 6919 pontok | |
Segítség | ||
| AIDA64 / Memory Copy | |
| Az osztály átlaga Multimedia (11299 - 132135, n=53, az elmúlt 2 évben) | |
| HP ZBook Studio 15 G8 | |
| Átlagos Intel Core i9-11950H (25952 - 48565, n=4) | |
| Lenovo ThinkPad X1 Extreme G4-20Y50040GE | |
| AIDA64 / Memory Read | |
| Az osztály átlaga Multimedia (11624 - 174586, n=53, az elmúlt 2 évben) | |
| HP ZBook Studio 15 G8 | |
| Átlagos Intel Core i9-11950H (26064 - 47921, n=4) | |
| Lenovo ThinkPad X1 Extreme G4-20Y50040GE | |
| AIDA64 / Memory Write | |
| Az osztály átlaga Multimedia (11755 - 134998, n=53, az elmúlt 2 évben) | |
| HP ZBook Studio 15 G8 | |
| Átlagos Intel Core i9-11950H (22302 - 46818, n=4) | |
| Lenovo ThinkPad X1 Extreme G4-20Y50040GE | |
| AIDA64 / Memory Latency | |
| Az osztály átlaga Multimedia (7 - 535, n=52, az elmúlt 2 évben) | |
| Lenovo ThinkPad X1 Extreme G4-20Y50040GE | |
| Átlagos Intel Core i9-11950H (82.6 - 88.6, n=4) | |
| HP ZBook Studio 15 G8 | |
| Razer Blade 15 Advanced (Mid 2021) | |
| Lenovo ThinkPad P1 G4-20Y4S0KS00 | |
* ... a kisebb jobb
| DPC Latencies / LatencyMon - interrupt to process latency (max), Web, Youtube, Prime95 | |
| Razer Blade 15 Advanced (Mid 2021) | |
| Lenovo ThinkPad X1 Extreme G4-20Y50040GE | |
| HP ZBook Studio 15 G8 | |
| Asus ROG Zephyrus Duo 15 SE GX551QS | |
| Lenovo ThinkPad P1 G4-20Y4S0KS00 | |
* ... a kisebb jobb

* ... a kisebb jobb
Disk Throttling: DiskSpd Read Loop, Queue Depth 8
| 3DMark 11 Performance | 24326 pontok | |
| 3DMark Fire Strike Score | 15666 pontok | |
| 3DMark Time Spy Score | 8195 pontok | |
Segítség | ||
| Cyberpunk 2077 1.0 - 1920x1080 Ultra Preset | |
| Átlagos NVIDIA GeForce RTX 3080 Laptop GPU (52.9 - 84.3, n=9) | |
| Lenovo ThinkPad X1 Extreme G4-20Y50040GE | |
| Lenovo ThinkPad P1 G4-20Y30017GE | |
Witcher 3 FPS Diagram
| alacsony | közepes | magas | ultra | QHD | 4K | |
|---|---|---|---|---|---|---|
| The Witcher 3 (2015) | 371 | 261 | 177 | 85.1 | ||
| Dota 2 Reborn (2015) | 133.5 | 111 | 108.1 | 98 | 55.2 | |
| Final Fantasy XV Benchmark (2018) | 123 | 97 | 78.2 | 61.6 | 37.5 | |
| X-Plane 11.11 (2018) | 112 | 90.8 | 74 | 39.9 | ||
| Far Cry 5 (2018) | 129 | 108 | 104 | 93 | 86 | |
| Cyberpunk 2077 1.0 (2020) | 105 | 86 | 72 | 61 | 40 | |
| Far Cry 6 (2021) | 101 | 73 | 65 | 55 |
Zajszint
| Üresjárat |
| 24.7 / 24.7 / 28.1 dB(A) |
| Terhelés |
| 42.5 / 52.1 dB(A) |
 | ||
30 dB csendes 40 dB(A) hallható 50 dB(A) hangos |
||
min: | ||
| Lenovo ThinkPad X1 Extreme G4-20Y50040GE GeForce RTX 3080 Laptop GPU, i9-11950H, Kioxia XG7 KXG7AZNV1T02 | Lenovo ThinkPad P1 G4-20Y4S0KS00 GeForce RTX 3070 Laptop GPU, i7-11850H, Samsung PM9A1 MZVL21T0HCLR | Apple MacBook Pro 16 2021 M1 Max M1 Max 32-Core GPU, M1 Max, Apple SSD AP2048R | HP ZBook Studio 15 G8 GeForce RTX 3070 Laptop GPU, i9-11950H, Samsung PM981a MZVLB2T0HALB | Razer Blade 15 Advanced (Mid 2021) GeForce RTX 3080 Laptop GPU, i7-11800H, SSSTC CA6-8D1024 | Asus ROG Zephyrus Duo 15 SE GX551QS GeForce RTX 3080 Laptop GPU, R9 5900HX, 2x Samsung PM981a MZVLB1T0HBLR (RAID 0) | |
|---|---|---|---|---|---|---|
| Noise | 4% | 7% | 2% | 1% | 1% | |
| off / környezet * (dB) | 24.7 | 23.8 4% | 24.2 2% | 23.5 5% | 25.1 -2% | 27 -9% |
| Idle Minimum * (dB) | 24.7 | 23.8 4% | 24.2 2% | 25.3 -2% | 25.3 -2% | 27 -9% |
| Idle Average * (dB) | 24.7 | 23.8 4% | 24.2 2% | 25.3 -2% | 25.3 -2% | 27 -9% |
| Idle Maximum * (dB) | 28.1 | 28.3 -1% | 24.2 14% | 25.3 10% | 25.3 10% | 27 4% |
| Load Average * (dB) | 42.5 | 38.6 9% | 42.9 -1% | 41.2 3% | 42 1% | 31.2 27% |
| Witcher 3 ultra * (dB) | 46.4 | 47.4 -2% | 39.5 15% | 49.4 -6% | 45.6 2% | 44.5 4% |
| Load Maximum * (dB) | 52.1 | 47.4 9% | 42.9 18% | 49.4 5% | 51.6 1% | 53.5 -3% |
* ... a kisebb jobb
(-) A felső oldalon a maximális hőmérséklet 51.4 °C / 125 F, összehasonlítva a 36.8 °C / 98 F átlagával , 21 és 71 °C között a Multimedia osztálynál.
(-) Az alsó maximum 55.9 °C / 133 F-ig melegszik fel, összehasonlítva a 39.1 °C / 102 F átlagával
(+) Üresjáratban a felső oldal átlagos hőmérséklete 26.4 °C / 80 F, összehasonlítva a 31.3 °C / ### eszközátlaggal class_avg_f### F.
(-) A The Witcher 3 játék során a felső oldal átlaghőmérséklete 43.6 °C / 110 F, összehasonlítva a 31.3 °C / ## eszközátlaggal #class_avg_f### F.
(-) A csuklótámasz és az érintőpad tapintásra nagyon felforrósodhat, maximum 41.3 °C / 106.3 F.
(-) A hasonló eszközök csuklótámasz területének átlagos hőmérséklete 28.7 °C / 83.7 F volt (-12.6 °C / -22.6 F).
| Lenovo ThinkPad X1 Extreme G4-20Y50040GE Intel Core i9-11950H, NVIDIA GeForce RTX 3080 Laptop GPU | Lenovo ThinkPad P1 G4-20Y4S0KS00 Intel Core i7-11850H, NVIDIA GeForce RTX 3070 Laptop GPU | Apple MacBook Pro 16 2021 M1 Max Apple M1 Max, Apple M1 Max 32-Core GPU | HP ZBook Studio 15 G8 Intel Core i9-11950H, NVIDIA GeForce RTX 3070 Laptop GPU | Razer Blade 15 Advanced (Mid 2021) Intel Core i7-11800H, NVIDIA GeForce RTX 3080 Laptop GPU | Asus ROG Zephyrus Duo 15 SE GX551QS AMD Ryzen 9 5900HX, NVIDIA GeForce RTX 3080 Laptop GPU | |
|---|---|---|---|---|---|---|
| Heat | -1% | 18% | 2% | -13% | 5% | |
| Maximum Upper Side * (°C) | 51.4 | 51 1% | 42.3 18% | 49 5% | 51 1% | 33.4 35% |
| Maximum Bottom * (°C) | 55.9 | 53.5 4% | 41.7 25% | 54.2 3% | 52 7% | 45 19% |
| Idle Upper Side * (°C) | 27.2 | 28.8 -6% | 23.9 12% | 26.2 4% | 35.2 -29% | 30.8 -13% |
| Idle Bottom * (°C) | 28.8 | 29.3 -2% | 23.9 17% | 30.2 -5% | 37.8 -31% | 35.4 -23% |
* ... a kisebb jobb
| Kikapcsolt állapot / Készenlét | |
| Üresjárat | |
| Terhelés |
|
Kulcs:
min: | |
| Lenovo ThinkPad X1 Extreme G4-20Y50040GE i9-11950H, GeForce RTX 3080 Laptop GPU, Kioxia XG7 KXG7AZNV1T02, IPS, 3840x2400, 16" | Lenovo ThinkPad P1 G4-20Y4S0KS00 i7-11850H, GeForce RTX 3070 Laptop GPU, Samsung PM9A1 MZVL21T0HCLR, IPS LED, 3840x2400, 16" | Apple MacBook Pro 16 2021 M1 Max M1 Max, M1 Max 32-Core GPU, Apple SSD AP2048R, Mini-LED, 3456x2234, 16.2" | HP ZBook Studio 15 G8 i9-11950H, GeForce RTX 3070 Laptop GPU, Samsung PM981a MZVLB2T0HALB, OLED, 3840x2160, 15.6" | Razer Blade 15 Advanced (Mid 2021) i7-11800H, GeForce RTX 3080 Laptop GPU, SSSTC CA6-8D1024, IPS, 1920x1080, 15.6" | Asus ROG Zephyrus Duo 15 SE GX551QS R9 5900HX, GeForce RTX 3080 Laptop GPU, 2x Samsung PM981a MZVLB1T0HBLR (RAID 0), IPS, 3840x2160, 15.6" | Átlagos NVIDIA GeForce RTX 3080 Laptop GPU | Az osztály átlaga Multimedia | |
|---|---|---|---|---|---|---|---|---|
| Power Consumption | -0% | 20% | -18% | -49% | -46% | -51% | 37% | |
| Idle Minimum * (Watt) | 12.3 | 8.1 34% | 5.4 56% | 11 11% | 19.5 -59% | 16.3 -33% | 19.8 ? -61% | 5.62 ? 54% |
| Idle Average * (Watt) | 22.8 | 20.2 11% | 16.4 28% | 18.8 18% | 23.3 -2% | 22.5 1% | 24.3 ? -7% | 10.2 ? 55% |
| Idle Maximum * (Watt) | 13.9 | 21.9 -58% | 16.7 -20% | 31.7 -128% | 40.1 -188% | 39.9 -187% | 33.3 ? -140% | 12.5 ? 10% |
| Load Average * (Watt) | 95.4 | 88.2 8% | 94 1% | 105.2 -10% | 98.9 -4% | 116.1 -22% | 108.1 ? -13% | 65 ? 32% |
| Witcher 3 ultra * (Watt) | 154 | 149 3% | 104 32% | 148 4% | 174 -13% | 181.2 -18% | ||
| Load Maximum * (Watt) | 170.7 | 170.6 -0% | 135 21% | 171.8 -1% | 214 -25% | 196.7 -15% | 230 ? -35% | 111.9 ? 34% |
* ... a kisebb jobb
Energieaufnahme Witcher 3 / Stresstest
Power Consumption external monitor
| Lenovo ThinkPad X1 Extreme G4-20Y50040GE i9-11950H, GeForce RTX 3080 Laptop GPU, 90 Wh | Lenovo ThinkPad P1 G4-20Y4S0KS00 i7-11850H, GeForce RTX 3070 Laptop GPU, 90 Wh | Apple MacBook Pro 16 2021 M1 Max M1 Max, M1 Max 32-Core GPU, 99.6 Wh | HP ZBook Studio 15 G8 i9-11950H, GeForce RTX 3070 Laptop GPU, 83 Wh | Razer Blade 15 Advanced (Mid 2021) i7-11800H, GeForce RTX 3080 Laptop GPU, 80 Wh | Asus ROG Zephyrus Duo 15 SE GX551QS R9 5900HX, GeForce RTX 3080 Laptop GPU, 90 Wh | Lenovo ThinkPad P1 G4-20Y30017GE i7-11800H, T1200 Laptop GPU, 90 Wh | Az osztály átlaga Multimedia | |
|---|---|---|---|---|---|---|---|---|
| Akkumulátor üzemidő | 5% | 88% | 28% | -13% | -7% | 33% | 91% | |
| H.264 (h) | 6.9 | 7.2 4% | 17 146% | 9 30% | 16.8 ? 143% | |||
| WiFi v1.3 (h) | 6.8 | 7 3% | 14.9 119% | 6.2 -9% | 5.9 -13% | 5.3 -22% | 9 32% | 12.3 ? 81% |
| Load (h) | 1.1 | 1.2 9% | 1.1 0% | 1.8 64% | 1.2 9% | 1.5 36% | 1.645 ? 50% | |
| Reader / Idle (h) | 12.9 | 6.8 | 24.9 ? |
Pro
Kontra
Összegzés - A ThinkPad X1 Extreme G4 még mindig problémás
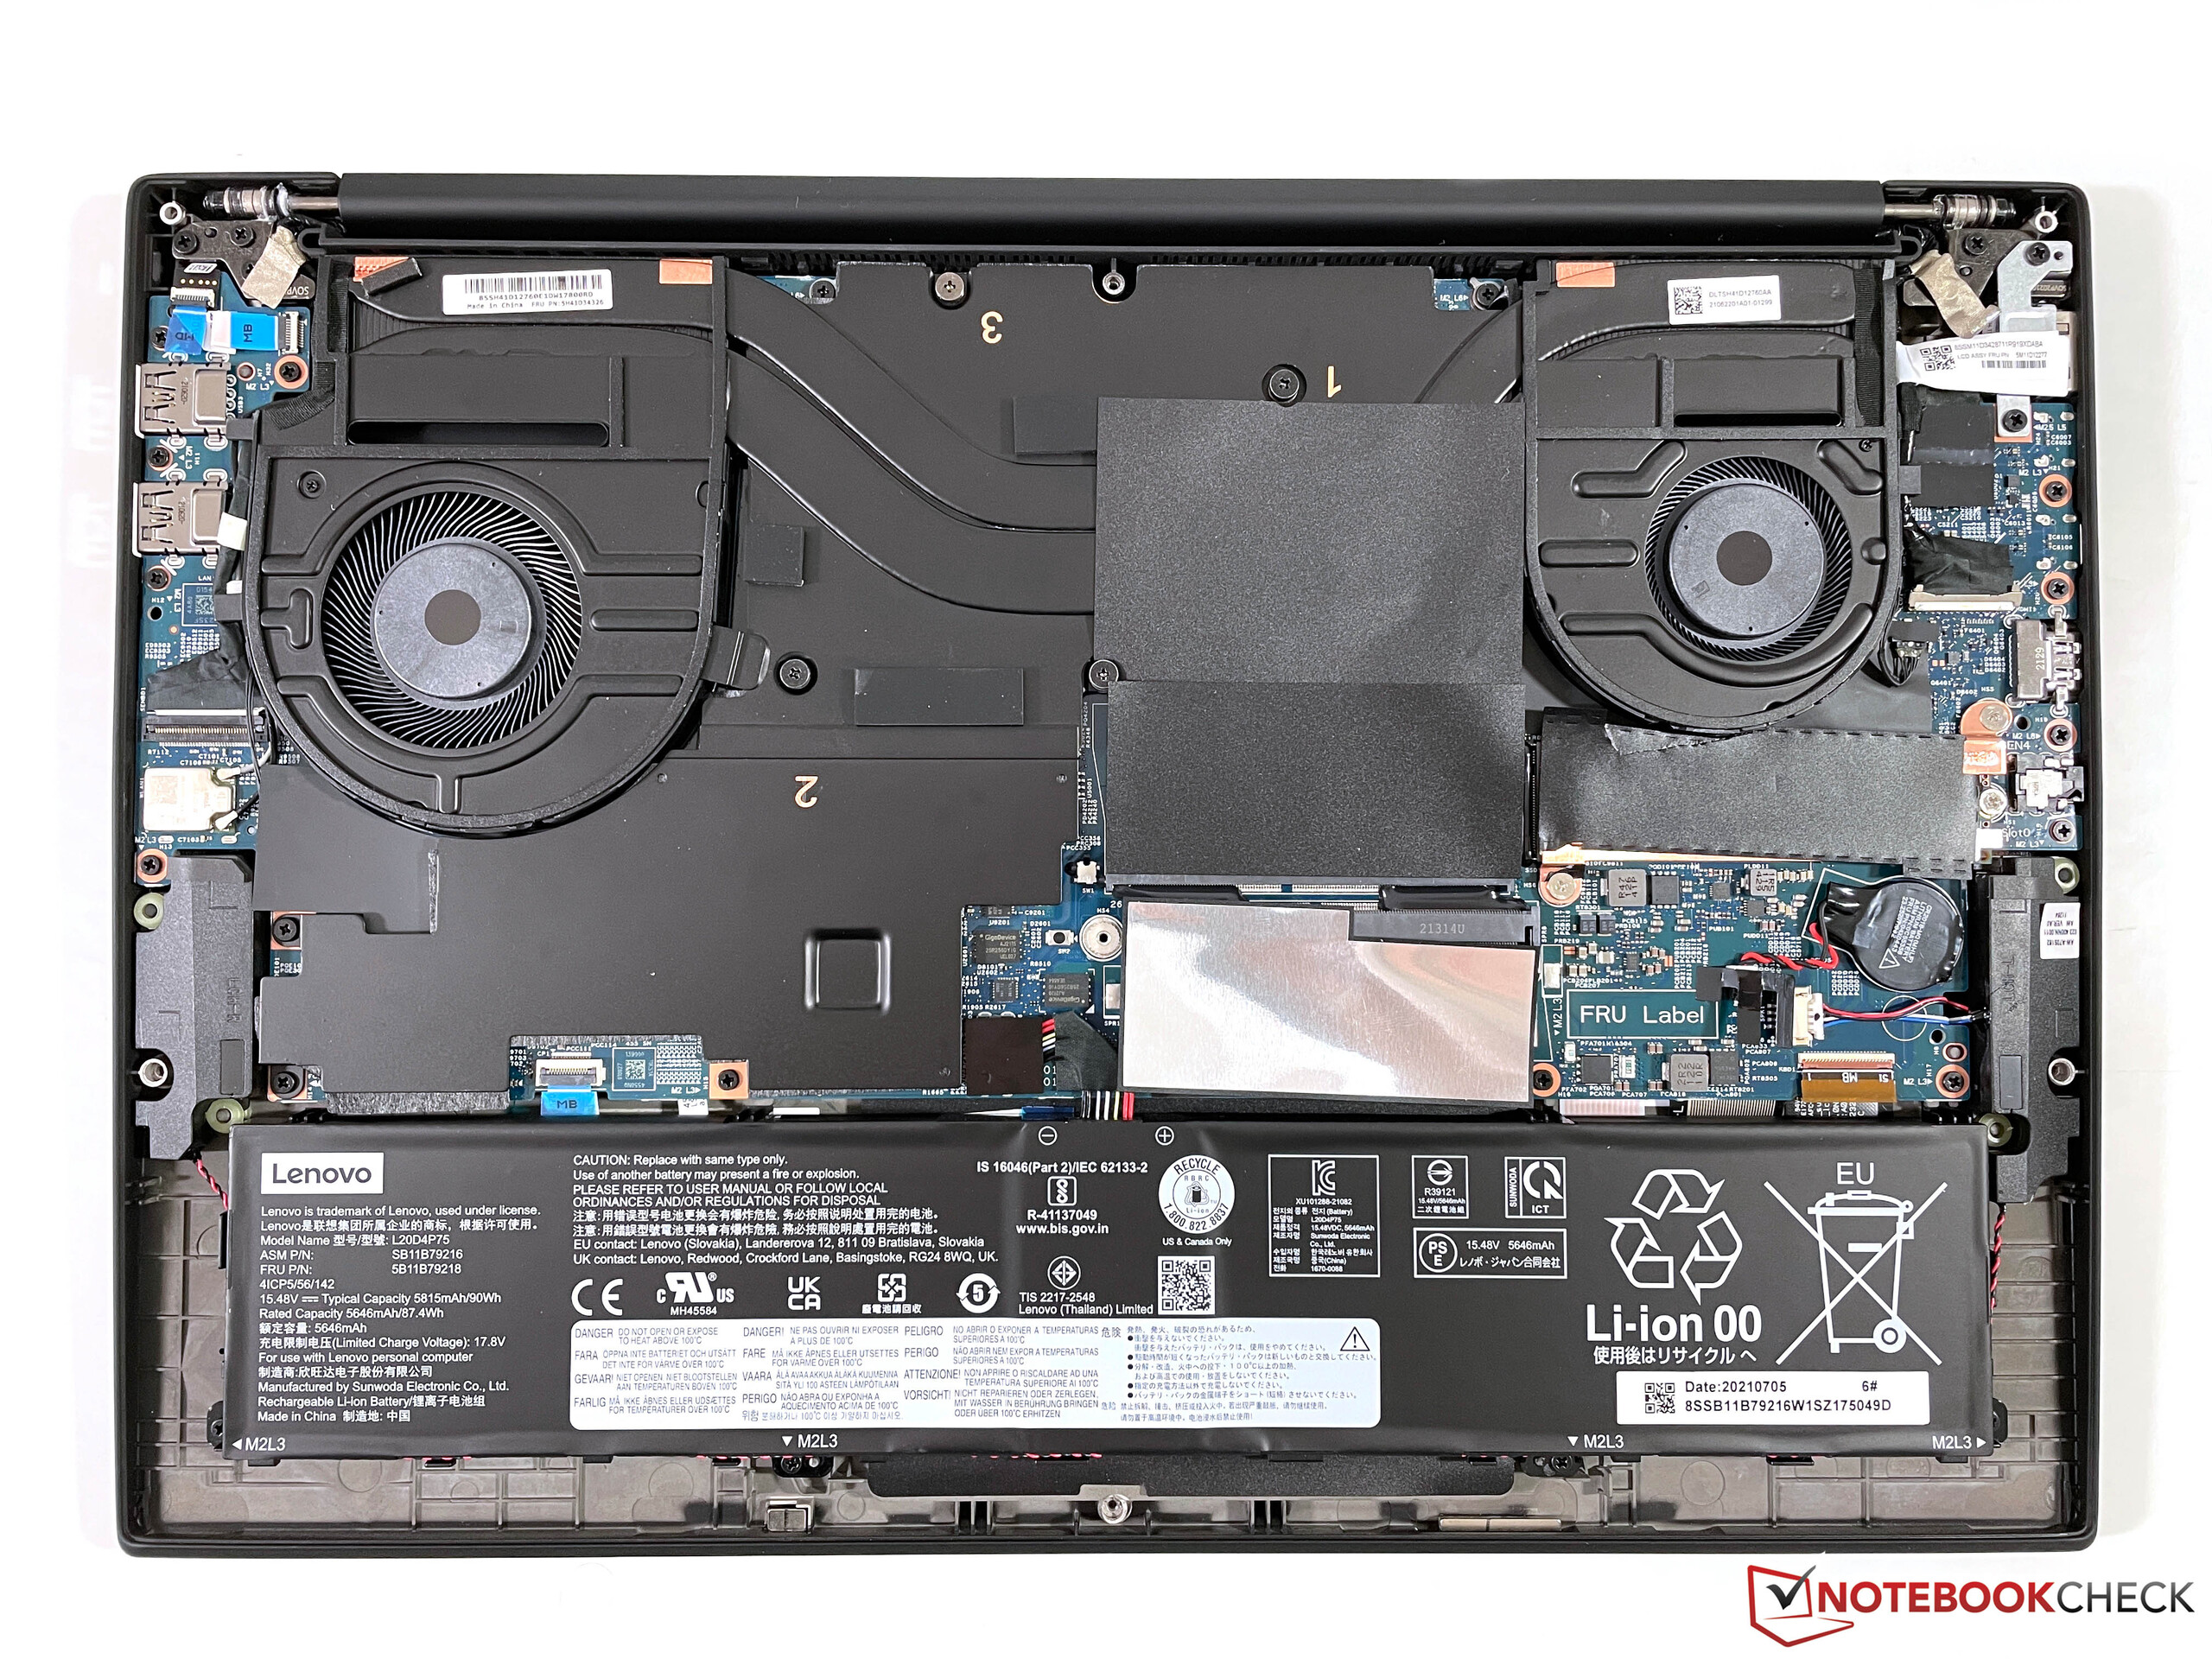
Összegzésünket azzal kell kezdenünk, hogy nagyon meglepődtünk, hogy a Lenovo közel két hónappal a munkaállomás megfelelője, a ThinkPad P1 G4 értékelése után még mindig nem javította ki a grafikával kapcsolatos problémát, ami nagyon zavaró, amikor egyszerűen csak használni szeretnénk a laptopot. A laptop újraindítására kényszerülünk, miután készenléti állapotban volt, és 3D-s alkalmazások használatakor is problémák adódhatnak. Az egyetlen megoldás jelenleg az iGPU kikapcsolása a BIOS-ban, de ez nyilván kihat az energiafogyasztásra és az üzemidőre is. A Lenovónak gyorsan ki kellene javítania ezt a problémát.
Sem a Core i9-11950H, sem a GeForce RTX 3080 nem igazán meggyőző az X1 Extreme G4 esetében. A teljesítmény nem rossz, de a ThinkPad P1 G4-ben lévő Core i7-11850H-hoz és a GeForce RTX 3070-hez képest (azonos teljesítményhatárok mellett) alig jobbak az eredmények. A hűtési megoldás itt egyértelműen a korlátozó tényező.
Sem a Core i9 CPU, sem az RTX 3080 GPU nem hagy jó benyomást, hiszen a teljesítménybeli előny a Core i7-hez és az RTX 3070-hez képest csak minimális. A nagyobb gondot azonban a grafikus probléma jelenti, amit a Lenovo még két hónap elteltével sem javított ki.
A 4K-s érintőképernyő, amelyet a ThinkPad X1 Extreme G4 kevésbé erős konfigurációjában már áttekintettünk, rengeteg energiát fogyaszt, és az üzemidőt is befolyásolja. A 90Wh-s akkumulátorból nem sikerült 7 óránál többet kihoznunk, sőt, a panel teljes fényerejét használva még ennél is jóval kevesebbet. Akinek hosszabb üzemidőre van szüksége, az válassza az alap WQHD képernyőt.
A gyors grafikus kártyáknak köszönhetően a ThinkPad X1 Extreme G4 jelenlegi generációja egyértelműen megkülönbözteti magát a Dell XPS 15-ös modelltől, amely csak a GeForce RTX 3050 Ti (a nagyobb XPS 17-en RTX 3060)grafikus kártyával érhető el. A tartalomkészítőknek mindenképpen érdemes egy pillantást vetniük az új Apple MacBook Pro 16-ra, amely néhány területen előnyben van az X1 Extreme G4-gyel szemben. A két csúcskategóriás multimédiás laptop közötti különbségeket egy külön cikkben fogjuk közelebbről megvizsgálni. A Razer Blade 15 szintén jó vetélytársnak számít a valamivel gyorsabb RTX 3080-val, de ez egy professzionális környezetben mindenképpen jobban érezhető.
<strike>A súlyos grafikai problémák miatt, amelyek gyakran kényszerítik a felhasználókat a gép újraindítására (ami bosszantó és időbe kerül), jelenleg nem tudjuk ajánlani a ThinkPad x1 Extreme G4-et. Akit érdekel a készülék, annak érdemes megvárnia, amíg a Lenovo megoldást kínál, különben nem lesz elégedett a készülékkel. Ez a probléma nem jelenik meg a végső pontszámban.</strike>
Frissítés December 24.: Megtaláltuk a megoldást a GPU-problémára. Aktiválni kell az Intel vezérlőpultban az Automatikus Képfrissítés opciót az Intel illesztőprogramok vezérlőpultjában (Rendszer -> Energia).
Ár és Elérhetőség
Az új ThinkPad X1 Extreme G4 elérhetősége egyelőre korlátozott. A Lenovo online áruházában összeállíthatjuk saját modellünket, az általunk tesztelt készülék körülbelül 6100 dollárért kerül forgalomba, de jelenleg ~3500 dollárért kapható automatikus kedvezménnyel.
Lenovo ThinkPad X1 Extreme G4-20Y50040GE
- 12/22/2021 v7 (old)
Andreas Osthoff
Price comparison

