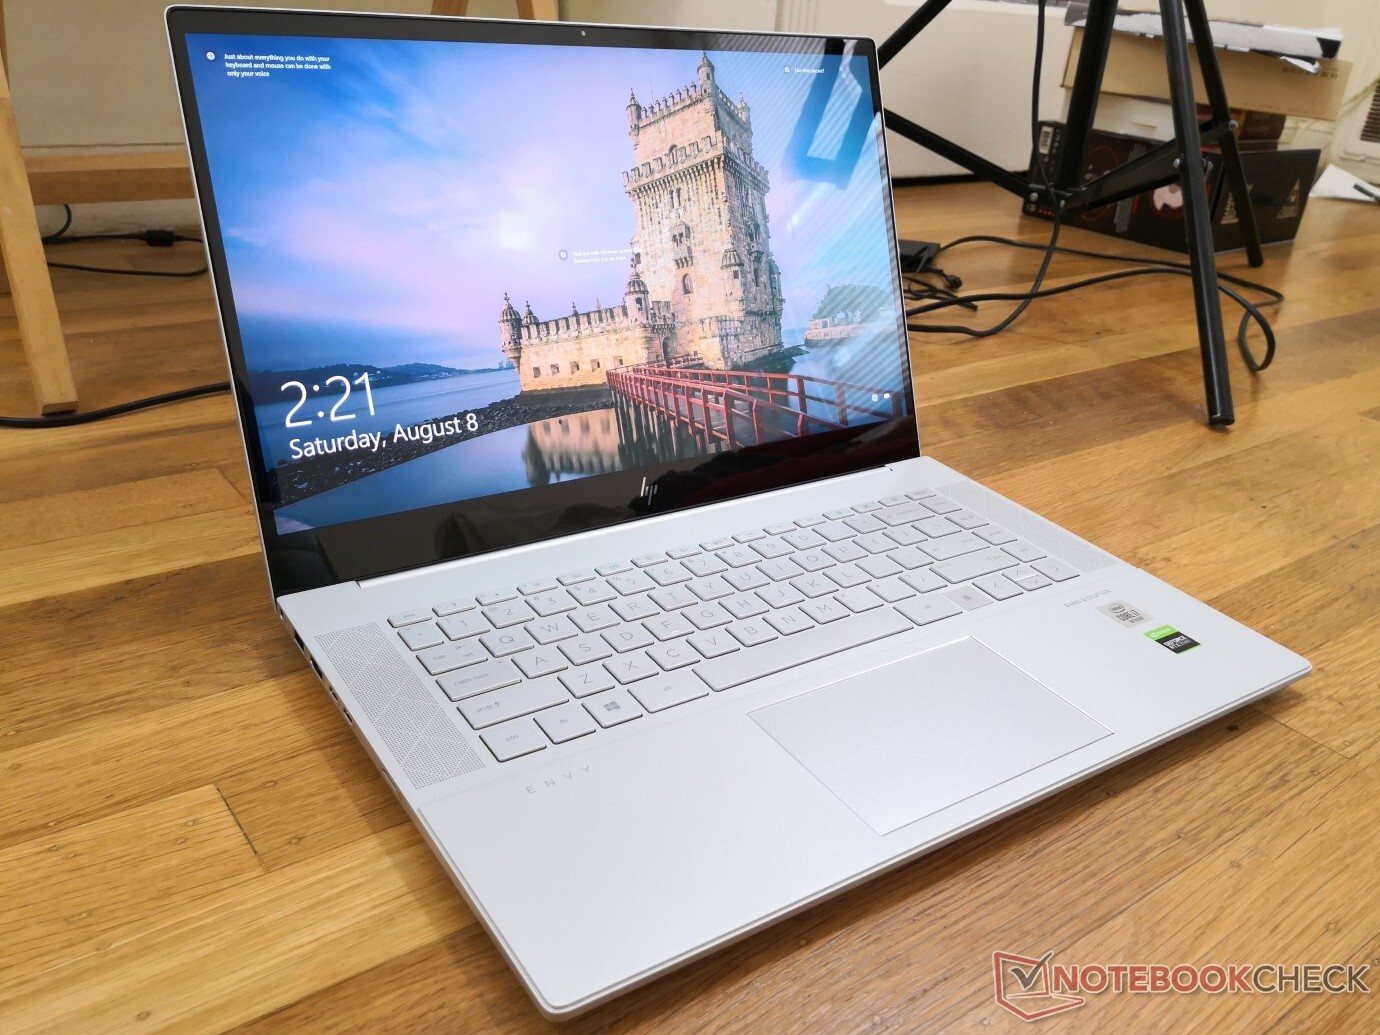
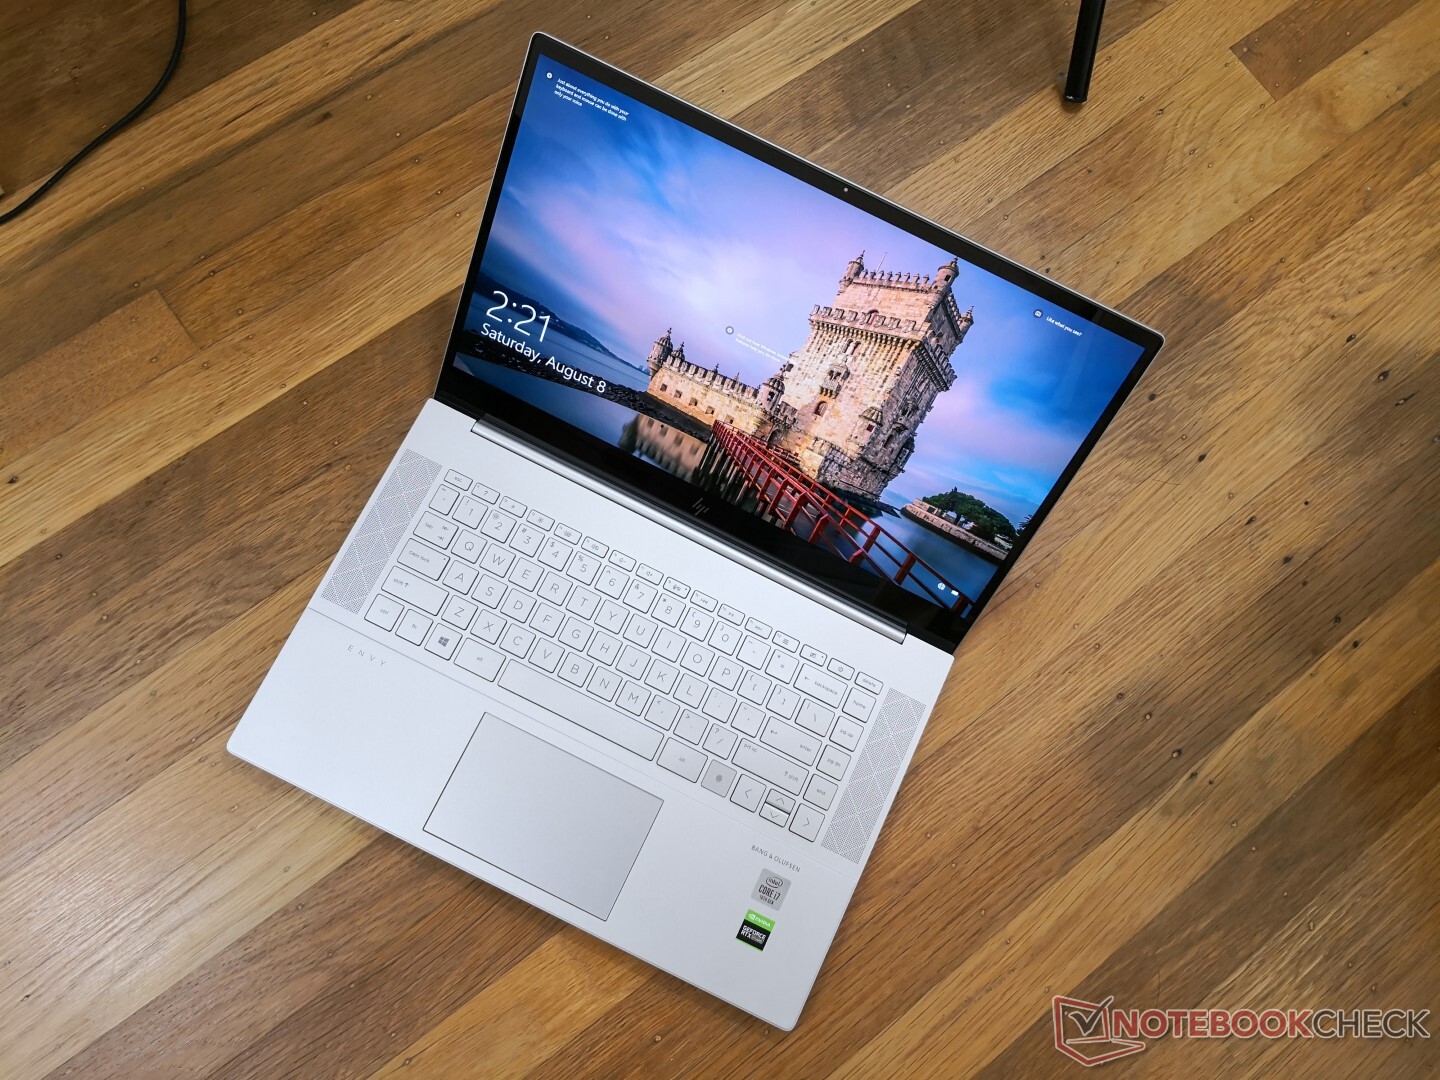
Ez a HP válasza az Apple MacBook Pro-ra: 2020 Envy 15 Creator Core i7 rövid értékelés
Értékelés | Dátum | Modell | Súly | Magasság | Méret | Felbontás | Legjobb ár |
|---|---|---|---|---|---|---|---|
| 83 % v7 (old) | 12/2020 | HP Envy 15-ep0098nr i7-10750H, GeForce RTX 2060 Max-Q | 2 kg | 19 mm | 15.60" | 3840x2160 | |
| 80.4 % v7 (old) | HP Envy x360 15-dr1679cl i7-10510U, UHD Graphics 620 | 2.1 kg | 17.2 mm | 15.60" | 1920x1080 | ||
| 85 % v7 (old) | HP Spectre X360 15-5ZV31AV i7-10510U, GeForce MX250 | 2.1 kg | 19.3 mm | 15.60" | 3840x2160 | ||
| 90.1 % v7 (old) | 07/2020 | Dell XPS 15 9500 Core i7 4K UHD i7-10875H, GeForce GTX 1650 Ti Mobile | 2 kg | 18 mm | 15.60" | 3840x2400 | |
| 86 % v7 (old) | 03/2020 | Lenovo Yoga C940-15IRH i7-9750H, GeForce GTX 1650 Max-Q | 2 kg | 19.7 mm | 15.60" | 1920x1080 | |
| 89.7 % v7 (old) | 01/2020 | Apple MacBook Pro 16 2019 i9 5500M i9-9880H, Radeon Pro 5500M | 2 kg | 16.2 mm | 16.00" | 3072x1920 |
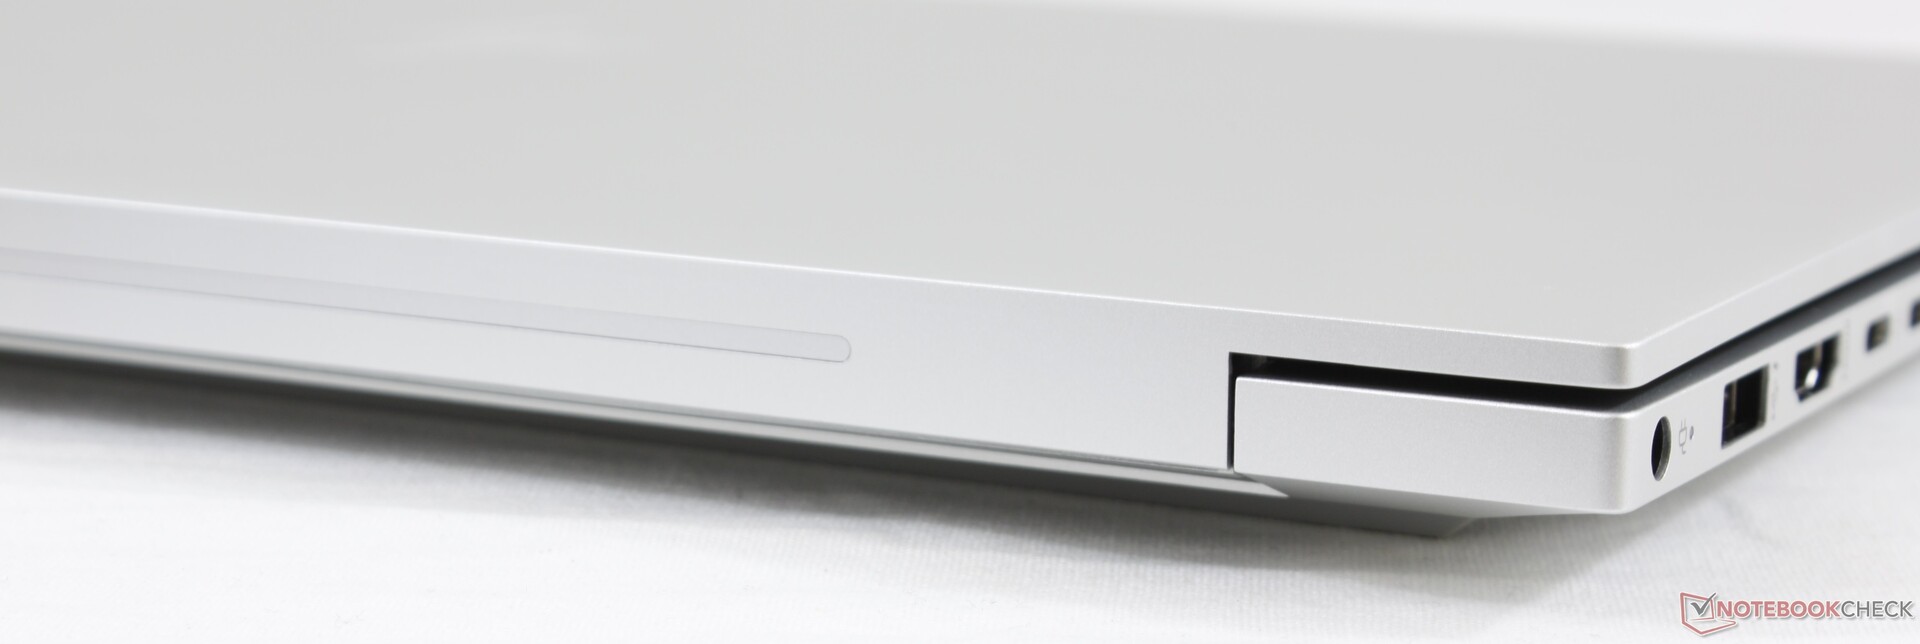
| SD Card Reader | |
| average JPG Copy Test (av. of 3 runs) | |
| Dell XPS 15 9500 Core i7 4K UHD (Toshiba Exceria Pro SDXC 64 GB UHS-II) | |
| HP Spectre X360 15-5ZV31AV (Toshiba Exceria Pro M501 UHS-II) | |
| HP Envy x360 15-dr1679cl (Toshiba Exceria Pro SDXC 64 GB UHS-II) | |
| HP Envy 15-ep0098nr (Toshiba Exceria Pro M501 UHS-II) | |
| maximum AS SSD Seq Read Test (1GB) | |
| Dell XPS 15 9500 Core i7 4K UHD (Toshiba Exceria Pro SDXC 64 GB UHS-II) | |
| HP Spectre X360 15-5ZV31AV (Toshiba Exceria Pro M501 UHS-II) | |
| HP Envy 15-ep0098nr (Toshiba Exceria Pro M501 UHS-II) | |
| HP Envy x360 15-dr1679cl (Toshiba Exceria Pro SDXC 64 GB UHS-II) | |
| Networking | |
| iperf3 transmit AX12 | |
| Razer Blade 15 RZ09-0328 | |
| HP Envy 15-ep0098nr | |
| Dell XPS 15 9500 Core i7 4K UHD | |
| Apple MacBook Pro 16 2019 i9 5500M | |
| iperf3 receive AX12 | |
| Razer Blade 15 RZ09-0328 | |
| Dell XPS 15 9500 Core i7 4K UHD | |
| HP Envy 15-ep0098nr | |
| Apple MacBook Pro 16 2019 i9 5500M | |

")
")
| |||||||||||||||||||||||||
Fényerő megoszlás: 91 %
Centrumban: 374.3 cd/m²
Kontraszt: ∞:1 (Fekete: 0 cd/m²)
ΔE ColorChecker Calman: 5.47 | ∀{0.5-29.43 Ø4.71}
calibrated: 4.61
ΔE Greyscale Calman: 2.3 | ∀{0.09-98 Ø4.96}
100% sRGB (Argyll 1.6.3 3D)
87.8% AdobeRGB 1998 (Argyll 1.6.3 3D)
99.9% AdobeRGB 1998 (Argyll 3D)
100% sRGB (Argyll 3D)
88.5% Display P3 (Argyll 3D)
Gamma: 2.09
CCT: 6340 K
| HP Envy 15-ep0098nr Samsung SDC4145, AMOLED, 15.6", 3840x2160 | HP Envy x360 15-dr1679cl AU Optronics B156HW02, IPS, 15.6", 1920x1080 | HP Spectre X360 15-5ZV31AV AU Optronics AUO30EB, IPS, 15.6", 3840x2160 | Dell XPS 15 9500 Core i7 4K UHD Sharp LQ156R1, IPS, 15.6", 3840x2400 | Lenovo Yoga C940-15IRH LG Philips LP156WFC-SPU1, IPS, 15.6", 1920x1080 | Apple MacBook Pro 16 2019 i9 5500M APPA044, IPS, 16", 3072x1920 | |
|---|---|---|---|---|---|---|
| Display | -52% | -20% | 0% | -25% | ||
| Display P3 Coverage (%) | 88.5 | 39.28 -56% | 68.3 -23% | 89.7 1% | 61.5 -31% | |
| sRGB Coverage (%) | 100 | 58.8 -41% | 94.3 -6% | 100 0% | 92.7 -7% | |
| AdobeRGB 1998 Coverage (%) | 99.9 | 40.58 -59% | 68.4 -32% | 99.8 0% | 63.6 -36% | |
| Response Times | -2812% | -4206% | -3890% | -3599% | -3822% | |
| Response Time Grey 50% / Grey 80% * (ms) | 0.8 ? | 39.6 ? -4850% | 56.8 ? -7000% | 54 ? -6650% | 48.4 ? -5950% | 52.4 ? -6450% |
| Response Time Black / White * (ms) | 2.7 ? | 23.6 ? -774% | 40.8 ? -1411% | 33.2 ? -1130% | 36.4 ? -1248% | 34.9 ? -1193% |
| PWM Frequency (Hz) | 242.7 ? | 131700 | ||||
| Screen | -36% | -3% | 10% | -5% | 34% | |
| Brightness middle (cd/m²) | 374.3 | 261.2 -30% | 284.6 -24% | 557.9 49% | 484.8 30% | 519 39% |
| Brightness (cd/m²) | 379 | 248 -35% | 285 -25% | 541 43% | 463 22% | 477 26% |
| Brightness Distribution (%) | 91 | 92 1% | 85 -7% | 91 0% | 82 -10% | 86 -5% |
| Black Level * (cd/m²) | 0.38 | 0.25 | 0.39 | 0.26 | 0.39 | |
| Colorchecker dE 2000 * | 5.47 | 5.4 1% | 3.52 36% | 4.54 17% | 4.5 18% | 2.28 58% |
| Colorchecker dE 2000 max. * | 8.22 | 16.31 -98% | 5.56 32% | 7.92 4% | 7.55 8% | 6.54 20% |
| Colorchecker dE 2000 calibrated * | 4.61 | 3.81 17% | 3 35% | 3.82 17% | 1.19 74% | 0.86 81% |
| Greyscale dE 2000 * | 2.3 | 4.1 -78% | 3.2 -39% | 3.2 -39% | 5.7 -148% | 0.9 61% |
| Gamma | 2.09 105% | 2.53 87% | 2.28 96% | 1.99 111% | 2.45 90% | 2145 0% |
| CCT | 6340 103% | 6611 98% | 7070 92% | 6451 101% | 6101 107% | 6572 99% |
| Color Space (Percent of AdobeRGB 1998) (%) | 87.8 | 37.4 -57% | 61.1 -30% | 89.5 2% | 58.7 -33% | 78 -11% |
| Color Space (Percent of sRGB) (%) | 100 | 58.7 -41% | 93.8 -6% | 100 0% | 92.8 -7% | |
| Contrast (:1) | 687 | 1138 | 1431 | 1865 | 1331 | |
| Teljes átlag (program / beállítások) | -967% /
-436% | -1410% /
-607% | -1293% /
-549% | -1210% /
-523% | -1894% /
-737% |
* ... a kisebb jobb
Megjelenítési válaszidők
| ↔ Válaszidő Fekete-fehér | ||
|---|---|---|
| 2.7 ms ... emelkedés és süllyedés ↘ kombinálva | ↗ 1.3 ms emelkedés | 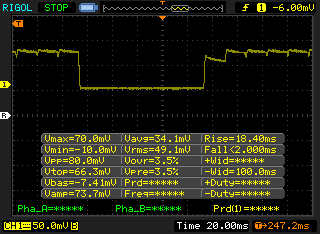 |
| ↘ 1.4 ms ősz | ||
| A képernyő tesztjeinkben nagyon gyors reakciósebességet mutatott, és nagyon jól használható gyors tempójú játékokhoz. Összehasonlításképpen, az összes tesztelt eszköz 0.1 (minimum) és 240 (maximum) ms között mozog. » 14 % of all devices are better. Ez azt jelenti, hogy a mért válaszidő jobb, mint az összes vizsgált eszköz átlaga (19.8 ms). | ||
| ↔ Válaszidő 50% szürke és 80% szürke között | ||
| 0.8 ms ... emelkedés és süllyedés ↘ kombinálva | ↗ 0.4 ms emelkedés | 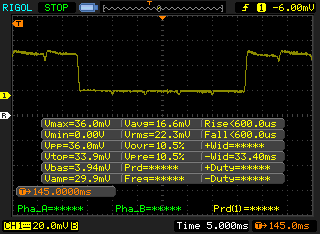 |
| ↘ 0.4 ms ősz | ||
| A képernyő tesztjeinkben nagyon gyors reakciósebességet mutatott, és nagyon jól használható gyors tempójú játékokhoz. Összehasonlításképpen, az összes tesztelt eszköz 0.165 (minimum) és 636 (maximum) ms között mozog. » 3 % of all devices are better. Ez azt jelenti, hogy a mért válaszidő jobb, mint az összes vizsgált eszköz átlaga (31 ms). | ||
Képernyő villogása / PWM (impulzusszélesség-moduláció)
| Képernyő villogása / PWM észlelve | 242.7 Hz | ≤ 44 % fényerő beállítása |  |
A kijelző háttérvilágítása 242.7 Hz-en villog (a legrosszabb esetben, pl. PWM használatával) Villódzás észlelve a 44 % vagy annál kisebb fényerő-beállításnál. E fényerő-beállítás felett nem lehet villogás vagy PWM. A 242.7 Hz frekvenciája viszonylag alacsony, így az érzékeny felhasználók valószínűleg villogást észlelnek, és megerőltetik a szemüket a megadott és az alatti fényerő-beállítás mellett. Összehasonlításképpen: az összes tesztelt eszköz 52 %-a nem használja a PWM-et a kijelző elsötétítésére. Ha PWM-et észleltek, akkor átlagosan 7754 (minimum: 5 - maximum: 343500) Hz-t mértek. | |||
Cinebench R15: CPU Multi 64Bit | CPU Single 64Bit
Blender: v2.79 BMW27 CPU
7-Zip 18.03: 7z b 4 -mmt1 | 7z b 4
Geekbench 5.5: Single-Core | Multi-Core
HWBOT x265 Benchmark v2.2: 4k Preset
LibreOffice : 20 Documents To PDF
R Benchmark 2.5: Overall mean
| Cinebench R20 / CPU (Multi Core) | |
| Eurocom Sky X4C i9-9900KS | |
| Asus TUF Gaming A15 FA506IV-HN172 | |
| MSI GS66 Stealth 10SFS | |
| MSI GE65 Raider 9SF-049US | |
| Dell XPS 15 9500 Core i7 4K UHD | |
| Acer Nitro 5 AN515-44-R5FT | |
| HP Envy 15-ep0098nr | |
| Átlagos Intel Core i7-10750H (1749 - 3325, n=43) | |
| Lenovo Yoga C940-15IRH | |
| Schenker Work 15 | |
| Cinebench R20 / CPU (Single Core) | |
| Eurocom Sky X4C i9-9900KS | |
| Dell XPS 15 9500 Core i7 4K UHD | |
| Asus TUF Gaming A15 FA506IV-HN172 | |
| MSI GS66 Stealth 10SFS | |
| MSI GE65 Raider 9SF-049US | |
| Átlagos Intel Core i7-10750H (431 - 504, n=43) | |
| Lenovo Yoga C940-15IRH | |
| HP Envy 15-ep0098nr | |
| Acer Nitro 5 AN515-44-R5FT | |
| Schenker Work 15 | |
| Cinebench R15 / CPU Multi 64Bit | |
| Eurocom Sky X4C i9-9900KS | |
| Asus TUF Gaming A15 FA506IV-HN172 | |
| MSI GS66 Stealth 10SFS | |
| MSI GE65 Raider 9SF-049US | |
| Acer Nitro 5 AN515-44-R5FT | |
| Dell XPS 15 9500 Core i7 4K UHD | |
| HP Envy 15-ep0098nr | |
| Átlagos Intel Core i7-10750H (804 - 1418, n=50) | |
| Lenovo Yoga C940-15IRH | |
| Schenker Work 15 | |
| Cinebench R15 / CPU Single 64Bit | |
| Eurocom Sky X4C i9-9900KS | |
| Dell XPS 15 9500 Core i7 4K UHD | |
| MSI GS66 Stealth 10SFS | |
| MSI GE65 Raider 9SF-049US | |
| HP Envy 15-ep0098nr | |
| Átlagos Intel Core i7-10750H (184 - 213, n=45) | |
| Asus TUF Gaming A15 FA506IV-HN172 | |
| Lenovo Yoga C940-15IRH | |
| Acer Nitro 5 AN515-44-R5FT | |
| Schenker Work 15 | |
| Blender / v2.79 BMW27 CPU | |
| Schenker Work 15 | |
| Schenker Work 15 | |
| Átlagos Intel Core i7-10750H (322 - 587, n=43) | |
| Dell XPS 15 9500 Core i7 4K UHD | |
| HP Envy 15-ep0098nr | |
| Acer Nitro 5 AN515-44-R5FT | |
| MSI GS66 Stealth 10SFS | |
| Asus TUF Gaming A15 FA506IV-HN172 | |
| Eurocom Sky X4C i9-9900KS | |
| 7-Zip 18.03 / 7z b 4 -mmt1 | |
| Eurocom Sky X4C i9-9900KS | |
| Dell XPS 15 9500 Core i7 4K UHD | |
| MSI GS66 Stealth 10SFS | |
| Átlagos Intel Core i7-10750H (4504 - 5470, n=43) | |
| Asus TUF Gaming A15 FA506IV-HN172 | |
| Schenker Work 15 | |
| Schenker Work 15 | |
| HP Envy 15-ep0098nr | |
| Acer Nitro 5 AN515-44-R5FT | |
| 7-Zip 18.03 / 7z b 4 | |
| Eurocom Sky X4C i9-9900KS | |
| Asus TUF Gaming A15 FA506IV-HN172 | |
| MSI GS66 Stealth 10SFS | |
| Acer Nitro 5 AN515-44-R5FT | |
| Dell XPS 15 9500 Core i7 4K UHD | |
| Átlagos Intel Core i7-10750H (26040 - 37345, n=43) | |
| HP Envy 15-ep0098nr | |
| Schenker Work 15 | |
| Schenker Work 15 | |
| Geekbench 5.5 / Single-Core | |
| Eurocom Sky X4C i9-9900KS | |
| Dell XPS 15 9500 Core i7 4K UHD | |
| MSI GS66 Stealth 10SFS | |
| HP Envy 15-ep0098nr | |
| Átlagos Intel Core i7-10750H (1114 - 1333, n=43) | |
| Asus TUF Gaming A15 FA506IV-HN172 | |
| Acer Nitro 5 AN515-44-R5FT | |
| Geekbench 5.5 / Multi-Core | |
| Eurocom Sky X4C i9-9900KS | |
| Dell XPS 15 9500 Core i7 4K UHD | |
| MSI GS66 Stealth 10SFS | |
| HP Envy 15-ep0098nr | |
| Átlagos Intel Core i7-10750H (4443 - 6674, n=43) | |
| Asus TUF Gaming A15 FA506IV-HN172 | |
| Acer Nitro 5 AN515-44-R5FT | |
| HWBOT x265 Benchmark v2.2 / 4k Preset | |
| Eurocom Sky X4C i9-9900KS | |
| MSI GS66 Stealth 10SFS | |
| Asus TUF Gaming A15 FA506IV-HN172 | |
| HP Envy 15-ep0098nr | |
| Dell XPS 15 9500 Core i7 4K UHD | |
| Átlagos Intel Core i7-10750H (5.54 - 11.6, n=43) | |
| Acer Nitro 5 AN515-44-R5FT | |
| Schenker Work 15 | |
| Schenker Work 15 | |
| LibreOffice / 20 Documents To PDF | |
| Acer Nitro 5 AN515-44-R5FT | |
| Átlagos Intel Core i7-10750H (43.1 - 99.2, n=43) | |
| Dell XPS 15 9500 Core i7 4K UHD | |
| MSI GS66 Stealth 10SFS | |
| HP Envy 15-ep0098nr | |
| Asus TUF Gaming A15 FA506IV-HN172 | |
| R Benchmark 2.5 / Overall mean | |
| Acer Nitro 5 AN515-44-R5FT | |
| Átlagos Intel Core i7-10750H (0.578 - 0.708, n=42) | |
| HP Envy 15-ep0098nr | |
| Asus TUF Gaming A15 FA506IV-HN172 | |
| MSI GS66 Stealth 10SFS | |
| Dell XPS 15 9500 Core i7 4K UHD | |
* ... a kisebb jobb
| PCMark 10 | |
| Score | |
| HP Envy 15-ep0098nr | |
| Apple MacBook Pro 16 2019 i9 5500M | |
| Dell XPS 15 9500 Core i7 4K UHD | |
| Lenovo Yoga C940-15IRH | |
| HP Envy x360 15-dr1679cl | |
| HP Spectre X360 15-5ZV31AV | |
| Essentials | |
| Lenovo Yoga C940-15IRH | |
| Dell XPS 15 9500 Core i7 4K UHD | |
| HP Envy x360 15-dr1679cl | |
| HP Spectre X360 15-5ZV31AV | |
| HP Envy 15-ep0098nr | |
| Productivity | |
| Dell XPS 15 9500 Core i7 4K UHD | |
| HP Envy 15-ep0098nr | |
| HP Envy x360 15-dr1679cl | |
| Lenovo Yoga C940-15IRH | |
| HP Spectre X360 15-5ZV31AV | |
| Digital Content Creation | |
| HP Envy 15-ep0098nr | |
| Dell XPS 15 9500 Core i7 4K UHD | |
| Lenovo Yoga C940-15IRH | |
| HP Envy x360 15-dr1679cl | |
| HP Spectre X360 15-5ZV31AV | |
| PCMark 8 | |
| Home Score Accelerated v2 | |
| Apple MacBook Pro 16 2019 i9 5500M | |
| Lenovo Yoga C940-15IRH | |
| Dell XPS 15 9500 Core i7 4K UHD | |
| HP Envy 15-ep0098nr | |
| HP Envy x360 15-dr1679cl | |
| HP Spectre X360 15-5ZV31AV | |
| Work Score Accelerated v2 | |
| Lenovo Yoga C940-15IRH | |
| HP Envy x360 15-dr1679cl | |
| Apple MacBook Pro 16 2019 i9 5500M | |
| HP Spectre X360 15-5ZV31AV | |
| Dell XPS 15 9500 Core i7 4K UHD | |
| HP Envy 15-ep0098nr | |
| PCMark 8 Home Score Accelerated v2 | 3463 pontok | |
| PCMark 8 Work Score Accelerated v2 | 4448 pontok | |
| PCMark 10 Score | 5553 pontok | |
Segítség | ||
| DPC Latencies / LatencyMon - interrupt to process latency (max), Web, Youtube, Prime95 | |
| Dell XPS 15 9500 Core i7 4K UHD | |
| HP Envy 15-ep0098nr | |
| HP Envy x360 15-dr1679cl | |
| MSI GS66 Stealth 10SFS | |
| MSI GS66 Stealth 10SE-045 | |
| Razer Blade 15 RZ09-0328 | |
| Asus TUF Gaming A15 FA506IV-HN172 | |
* ... a kisebb jobb
| HP Envy 15-ep0098nr Intel Optane Memory H10 with Solid State Storage 32GB + 512GB HBRPEKNX0202A(L/H) | HP Envy x360 15-dr1679cl Intel Optane Memory H10 with Solid State Storage 32GB + 512GB HBRPEKNX0202A(L/H) | HP Spectre X360 15-5ZV31AV Intel SSD 660p 2TB SSDPEKNW020T8 | Dell XPS 15 9500 Core i7 4K UHD SK Hynix PC611 512GB | Apple MacBook Pro 16 2019 i9 5500M Apple SSD AP1024 7171 | |
|---|---|---|---|---|---|
| AS SSD | -13% | 32% | 49% | 80% | |
| Seq Read (MB/s) | 1005 | 931 -7% | 1220 21% | 2072 106% | 2531 152% |
| Seq Write (MB/s) | 436.8 | 331.5 -24% | 1152 164% | 1486 240% | 2289 424% |
| 4K Read (MB/s) | 51.5 | 72.8 41% | 52.3 2% | 47.41 -8% | 15.85 -69% |
| 4K Write (MB/s) | 88 | 119 35% | 146.6 67% | 117.6 34% | 39.88 -55% |
| 4K-64 Read (MB/s) | 517 | 389.7 -25% | 652 26% | 967 87% | 1267 145% |
| 4K-64 Write (MB/s) | 839 | 573 -32% | 847 1% | 715 -15% | 1749 108% |
| Access Time Read * (ms) | 0.088 | 0.07 20% | 0.077 12% | 0.057 35% | 0.122 -39% |
| Access Time Write * (ms) | 0.151 | 0.138 9% | 0.106 30% | 0.096 36% | 0.095 37% |
| Score Read (Points) | 669 | 556 -17% | 826 23% | 1222 83% | 1536 130% |
| Score Write (Points) | 970 | 725 -25% | 1109 14% | 981 1% | 2018 108% |
| Score Total (Points) | 1972 | 1565 -21% | 2371 20% | 2809 42% | 4317 119% |
| Copy ISO MB/s (MB/s) | 1173 | 593 -49% | 2070 76% | 1999 70% | 1995 70% |
| Copy Program MB/s (MB/s) | 769 | 495.5 -36% | 571 -26% | 627 -18% | 584 -24% |
| Copy Game MB/s (MB/s) | 1045 | 566 -46% | 1219 17% | 1001 -4% | 1135 9% |
| CrystalDiskMark 5.2 / 6 | 4% | 26% | 51% | 48% | |
| Write 4K (MB/s) | 100.2 | 125.6 25% | 151.5 51% | 123.3 23% | 55.5 -45% |
| Read 4K (MB/s) | 112.8 | 145.8 29% | 59.3 -47% | 41.85 -63% | 16.21 -86% |
| Write Seq (MB/s) | 537 | 509 -5% | 1424 165% | 2054 282% | 1959 265% |
| Read Seq (MB/s) | 1270 | 1536 21% | 1609 27% | 1617 27% | 1763 39% |
| Write 4K Q32T1 (MB/s) | 480.6 | 362.4 -25% | 393.6 -18% | 413 -14% | 398.5 -17% |
| Read 4K Q32T1 (MB/s) | 364.9 | 307.3 -16% | 369.4 1% | 377.5 3% | 648 78% |
| Write Seq Q32T1 (MB/s) | 1224 | 1320 8% | 1946 59% | 2705 121% | 2727 123% |
| Read Seq Q32T1 (MB/s) | 2635 | 2489 -6% | 1934 -27% | 3442 31% | 3242 23% |
| Teljes átlag (program / beállítások) | -5% /
-7% | 29% /
30% | 50% /
50% | 64% /
68% |
* ... a kisebb jobb

Disk Throttling: DiskSpd Read Loop, Queue Depth 8
| 3DMark 11 | |
| 1280x720 Performance GPU | |
| Gigabyte Aero 15 OLED XB-8DE51B0SP | |
| MSI RTX 2060 Gaming Z 6G | |
| Dell G5 15 SE 5505 P89F | |
| Eluktronics RP-15 | |
| HP Envy 15-ep0098nr | |
| Átlagos NVIDIA GeForce RTX 2060 Max-Q (18863 - 21105, n=4) | |
| MSI P65 8RF-451 - Creator | |
| Microsoft Surface Book 3 15 | |
| Apple MacBook Pro 16 2019 i9 5500M | |
| Microsoft Surface Book 2 15 | |
| Dell XPS 15 9500 Core i7 4K UHD | |
| 1280x720 Performance Combined | |
| Gigabyte Aero 15 OLED XB-8DE51B0SP | |
| Eluktronics RP-15 | |
| MSI RTX 2060 Gaming Z 6G | |
| Átlagos NVIDIA GeForce RTX 2060 Max-Q (12071 - 15054, n=4) | |
| Dell G5 15 SE 5505 P89F | |
| HP Envy 15-ep0098nr | |
| Dell XPS 15 9500 Core i7 4K UHD | |
| Apple MacBook Pro 16 2019 i9 5500M | |
| Microsoft Surface Book 3 15 | |
| MSI P65 8RF-451 - Creator | |
| Microsoft Surface Book 2 15 | |
| 3DMark 11 Performance | 18109 pontok | |
| 3DMark Cloud Gate Standard Score | 25407 pontok | |
| 3DMark Fire Strike Score | 14259 pontok | |
| 3DMark Time Spy Score | 6052 pontok | |
Segítség | ||
| The Witcher 3 - 1920x1080 Ultra Graphics & Postprocessing (HBAO+) | |
| Eurocom Sky X4C i9-9900KS | |
| Gigabyte Aero 15 OLED XB-8DE51B0SP | |
| MSI GE65 Raider 9SF-049US | |
| MSI RTX 2060 Gaming Z 6G | |
| MSI GS66 Stealth 10SFS | |
| Dell G5 15 SE 5505 P89F | |
| HP Envy 15-ep0098nr | |
| Eluktronics RP-15 | |
| Razer Blade 15 RZ09-0328 | |
| Asus TUF Gaming A15 FA506IV-HN172 | |
| Átlagos NVIDIA GeForce RTX 2060 Max-Q (51.2 - 62.9, n=4) | |
| MSI P65 8RF-451 - Creator | |
| Microsoft Surface Book 3 15 | |
| Apple MacBook Pro 16 2019 i9 5500M | |
| Acer Nitro 5 AN515-44-R5FT | |
| Dell XPS 15 9500 Core i7 4K UHD | |
| Lenovo Yoga C940-15IRH | |
| Apple MacBook Pro 15 2019 i9 Vega 20 | |
| HP Spectre X360 15-5ZV31AV | |
| alacsony | közepes | magas | ultra | QHD | 4K | |
|---|---|---|---|---|---|---|
| The Witcher 3 (2015) | 310.8 | 209.6 | 119 | 62.9 | 45.5 | |
| Dota 2 Reborn (2015) | 141 | 129 | 120 | 114 | 83.2 | |
| Final Fantasy XV Benchmark (2018) | 139 | 79 | 61.3 | 43.6 | 24.9 | |
| X-Plane 11.11 (2018) | 103 | 90.7 | 77.4 | 59.3 |
| HP Envy 15-ep0098nr GeForce RTX 2060 Max-Q, i7-10750H, Intel Optane Memory H10 with Solid State Storage 32GB + 512GB HBRPEKNX0202A(L/H) | HP Envy x360 15-dr1679cl UHD Graphics 620, i7-10510U, Intel Optane Memory H10 with Solid State Storage 32GB + 512GB HBRPEKNX0202A(L/H) | HP Spectre X360 15-5ZV31AV GeForce MX250, i7-10510U, Intel SSD 660p 2TB SSDPEKNW020T8 | Dell XPS 15 9500 Core i7 4K UHD GeForce GTX 1650 Ti Mobile, i7-10875H, SK Hynix PC611 512GB | Apple MacBook Pro 16 2019 i9 5500M Radeon Pro 5500M, i9-9880H, Apple SSD AP1024 7171 | |
|---|---|---|---|---|---|
| Noise | 11% | 14% | 11% | 8% | |
| off / környezet * (dB) | 26.4 | 28 -6% | 30.1 -14% | 28.4 -8% | 29.8 -13% |
| Idle Minimum * (dB) | 32.2 | 28 13% | 30.1 7% | 28.4 12% | 29.9 7% |
| Idle Average * (dB) | 32.2 | 30.2 6% | 30.1 7% | 28.4 12% | 29.9 7% |
| Idle Maximum * (dB) | 32.2 | 31.5 2% | 30.1 7% | 28.4 12% | 29.9 7% |
| Load Average * (dB) | 48.3 | 35.7 26% | 30.1 38% | 46 5% | 43 11% |
| Witcher 3 ultra * (dB) | 53.7 | 39.7 26% | 42 22% | 45.4 15% | |
| Load Maximum * (dB) | 58.8 | 43.1 27% | 42 29% | 47.1 20% | 46.1 22% |
* ... a kisebb jobb
Zajszint
| Üresjárat |
| 32.2 / 32.2 / 32.2 dB(A) |
| Terhelés |
| 48.3 / 58.8 dB(A) |
 | ||
30 dB csendes 40 dB(A) hallható 50 dB(A) hangos |
||
min: | ||
(-) A felső oldalon a maximális hőmérséklet 47.6 °C / 118 F, összehasonlítva a 36.8 °C / 98 F átlagával , 21 és 71 °C között a Multimedia osztálynál.
(-) Az alsó maximum 52 °C / 126 F-ig melegszik fel, összehasonlítva a 39.1 °C / 102 F átlagával
(+) Üresjáratban a felső oldal átlagos hőmérséklete 26.1 °C / 79 F, összehasonlítva a 31.3 °C / ### eszközátlaggal class_avg_f### F.
(±) A The Witcher 3 játék során a felső oldal átlaghőmérséklete 32.4 °C / 90 F, összehasonlítva a 31.3 °C / ## eszközátlaggal #class_avg_f### F.
(+) A csuklótámasz és az érintőpad hűvösebb, mint a bőr hőmérséklete, maximum 31.8 °C / 89.2 F, ezért hűvös tapintású.
(-) A hasonló eszközök csuklótámasz területének átlagos hőmérséklete 28.7 °C / 83.7 F volt (-3.1 °C / -5.5 F).
HP Envy 15-ep0098nr hangelemzés
(±) | a hangszóró hangereje átlagos, de jó (79.9 dB)
Basszus 100 - 315 Hz
(-) | szinte nincs basszus – átlagosan 15.8%-kal alacsonyabb a mediánnál
(±) | a basszus linearitása átlagos (14.9% delta az előző frekvenciához)
Közepes 400-2000 Hz
(+) | kiegyensúlyozott középpontok – csak 3.7% választja el a mediántól
(+) | a középpontok lineárisak (5.9% delta az előző frekvenciához)
Maximum 2-16 kHz
(+) | kiegyensúlyozott csúcsok – csak 1.8% választja el a mediántól
(+) | a csúcsok lineárisak (4% delta az előző frekvenciához képest)
Összességében 100 - 16.000 Hz
(±) | az általános hang linearitása átlagos (16.2% eltérés a mediánhoz képest)
Ugyanazon osztályhoz képest
» 41%Ebben az osztályban az összes tesztelt eszköz %-a jobb volt, 7% hasonló, 51%-kal rosszabb
» A legjobb delta értéke 5%, az átlag 17%, a legrosszabb 45% volt
Az összes tesztelt eszközzel összehasonlítva
» 26% az összes tesztelt eszköz jobb volt, 6% hasonló, 68%-kal rosszabb
» A legjobb delta értéke 4%, az átlag 23%, a legrosszabb 134% volt
Apple MacBook 12 (Early 2016) 1.1 GHz hangelemzés
(+) | a hangszórók viszonylag hangosan tudnak játszani (83.6 dB)
Basszus 100 - 315 Hz
(±) | csökkentett basszus – átlagosan 11.3%-kal alacsonyabb, mint a medián
(±) | a basszus linearitása átlagos (14.2% delta az előző frekvenciához)
Közepes 400-2000 Hz
(+) | kiegyensúlyozott középpontok – csak 2.4% választja el a mediántól
(+) | a középpontok lineárisak (5.5% delta az előző frekvenciához)
Maximum 2-16 kHz
(+) | kiegyensúlyozott csúcsok – csak 2% választja el a mediántól
(+) | a csúcsok lineárisak (4.5% delta az előző frekvenciához képest)
Összességében 100 - 16.000 Hz
(+) | általános hangzás lineáris (10.2% eltérés a mediánhoz képest)
Ugyanazon osztályhoz képest
» 7%Ebben az osztályban az összes tesztelt eszköz %-a jobb volt, 2% hasonló, 90%-kal rosszabb
» A legjobb delta értéke 5%, az átlag 18%, a legrosszabb 53% volt
Az összes tesztelt eszközzel összehasonlítva
» 5% az összes tesztelt eszköz jobb volt, 1% hasonló, 94%-kal rosszabb
» A legjobb delta értéke 4%, az átlag 23%, a legrosszabb 134% volt
| Kikapcsolt állapot / Készenlét | |
| Üresjárat | |
| Terhelés |
|
Kulcs:
min: | |
| HP Envy 15-ep0098nr i7-10750H, GeForce RTX 2060 Max-Q, Intel Optane Memory H10 with Solid State Storage 32GB + 512GB HBRPEKNX0202A(L/H), AMOLED, 3840x2160, 15.6" | HP Envy x360 15-dr1679cl i7-10510U, UHD Graphics 620, Intel Optane Memory H10 with Solid State Storage 32GB + 512GB HBRPEKNX0202A(L/H), IPS, 1920x1080, 15.6" | HP Spectre X360 15-5ZV31AV i7-10510U, GeForce MX250, Intel SSD 660p 2TB SSDPEKNW020T8, IPS, 3840x2160, 15.6" | Dell XPS 15 9500 Core i7 4K UHD i7-10875H, GeForce GTX 1650 Ti Mobile, SK Hynix PC611 512GB, IPS, 3840x2400, 15.6" | Apple MacBook Pro 16 2019 i9 5500M i9-9880H, Radeon Pro 5500M, Apple SSD AP1024 7171, IPS, 3072x1920, 16" | Lenovo Yoga C940-15IRH i7-9750H, GeForce GTX 1650 Max-Q, Intel Optane Memory H10 with Solid State Storage 32GB + 512GB HBRPEKNX0202A(L/H), IPS, 1920x1080, 15.6" | |
|---|---|---|---|---|---|---|
| Power Consumption | 58% | 48% | 15% | 28% | 20% | |
| Idle Minimum * (Watt) | 9.2 | 4.3 53% | 5.2 43% | 5.7 38% | 3.7 60% | 5.2 43% |
| Idle Average * (Watt) | 14.5 | 7.2 50% | 8.5 41% | 13.5 7% | 12.1 17% | 10.7 26% |
| Idle Maximum * (Watt) | 18 | 7.5 58% | 8.7 52% | 19.6 -9% | 17 6% | 24.3 -35% |
| Load Average * (Watt) | 110.9 | 40.4 64% | 65.6 41% | 114.1 -3% | 91.5 17% | 84.4 24% |
| Witcher 3 ultra * (Watt) | 125.5 | 56.5 55% | 93 26% | 103 18% | 83.9 33% | |
| Load Maximum * (Watt) | 194.6 | 65.7 66% | 92.4 53% | 135.2 31% | 102.3 47% | 142.8 27% |
* ... a kisebb jobb
| HP Envy 15-ep0098nr i7-10750H, GeForce RTX 2060 Max-Q, 83 Wh | HP Envy x360 15-dr1679cl i7-10510U, UHD Graphics 620, 55.67 Wh | HP Spectre X360 15-5ZV31AV i7-10510U, GeForce MX250, 84 Wh | Dell XPS 15 9500 Core i7 4K UHD i7-10875H, GeForce GTX 1650 Ti Mobile, 86 Wh | Apple MacBook Pro 15 2019 i9 Vega 20 i9-9980HK, Radeon Pro Vega 20, 83 Wh | Lenovo Yoga C940-15IRH i7-9750H, GeForce GTX 1650 Max-Q, 69 Wh | |
|---|---|---|---|---|---|---|
| Akkumulátor üzemidő | 55% | 71% | 43% | 92% | 15% | |
| Reader / Idle (h) | 15 | 25.4 69% | 22.6 51% | 23 53% | 18.2 21% | |
| WiFi v1.3 (h) | 6 | 9.2 53% | 10.8 80% | 9.1 52% | 11.5 92% | 9.7 62% |
| Load (h) | 1.6 | 2.3 44% | 2.9 81% | 2 25% | 1 -37% |
Pro
Kontra
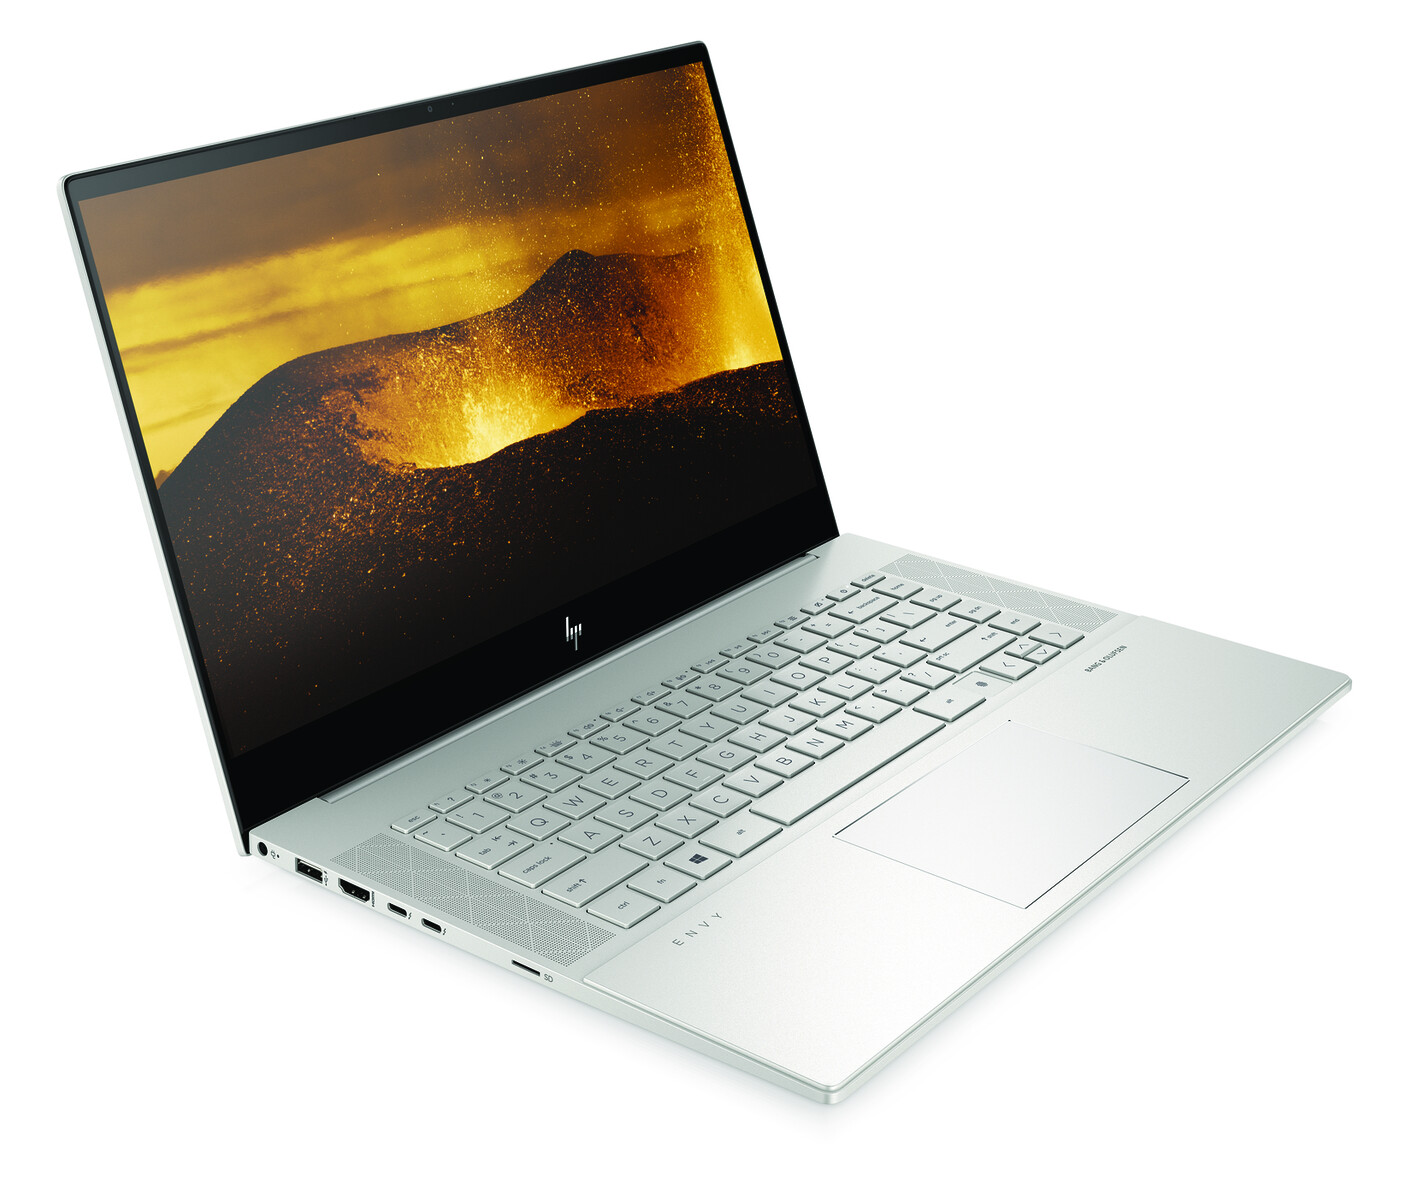
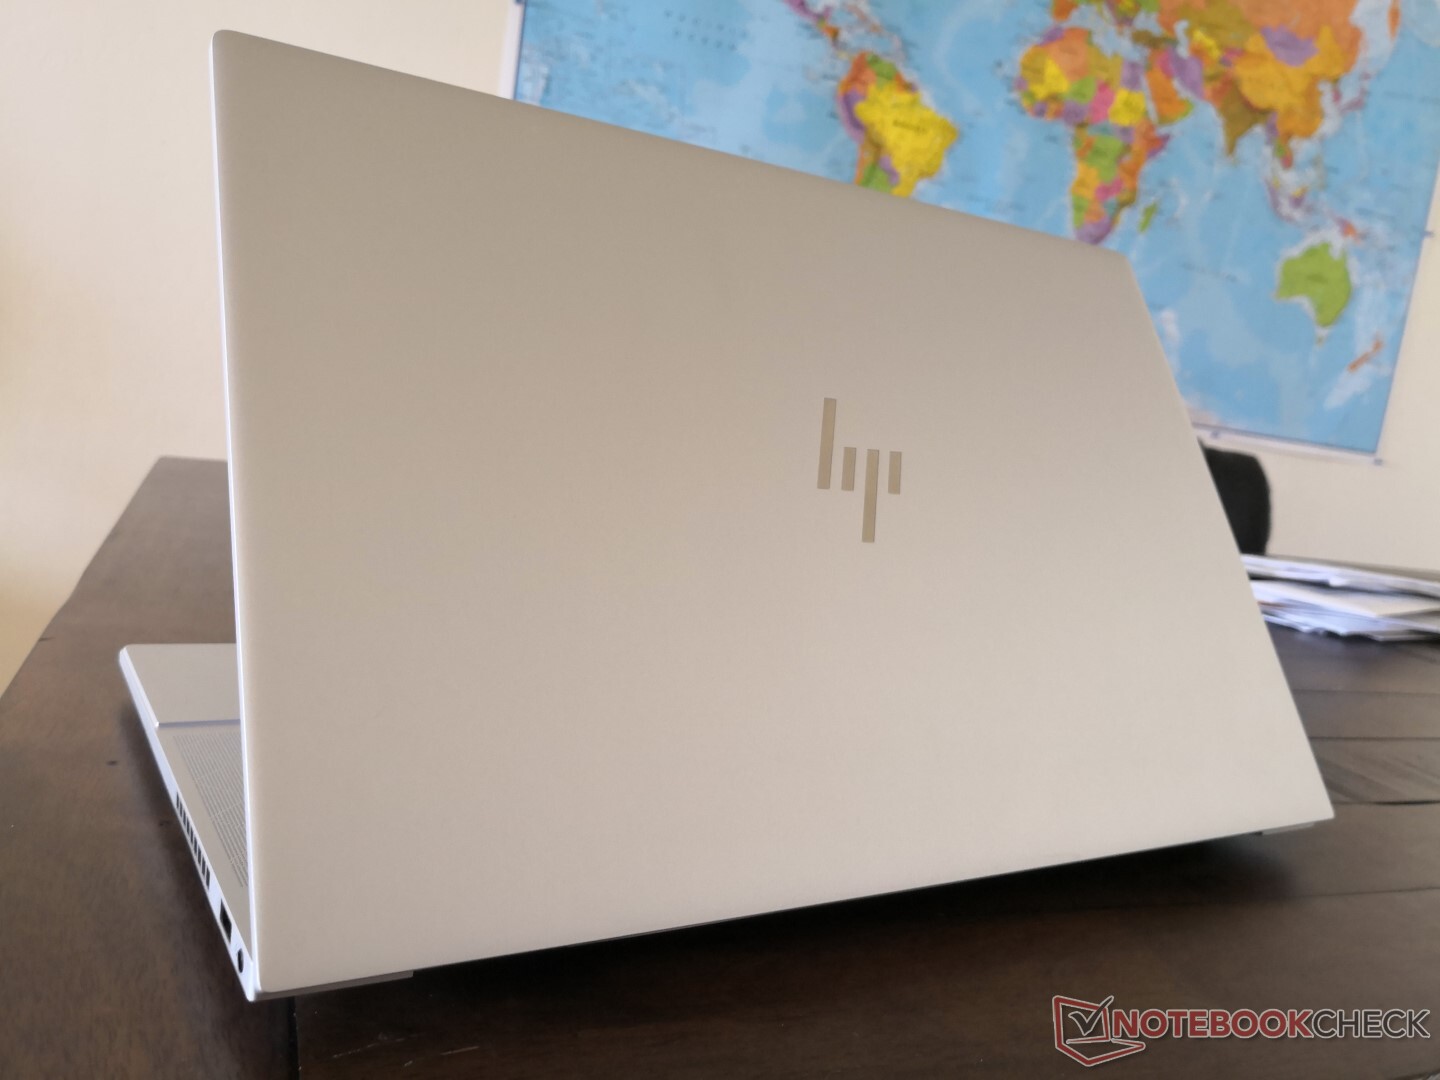
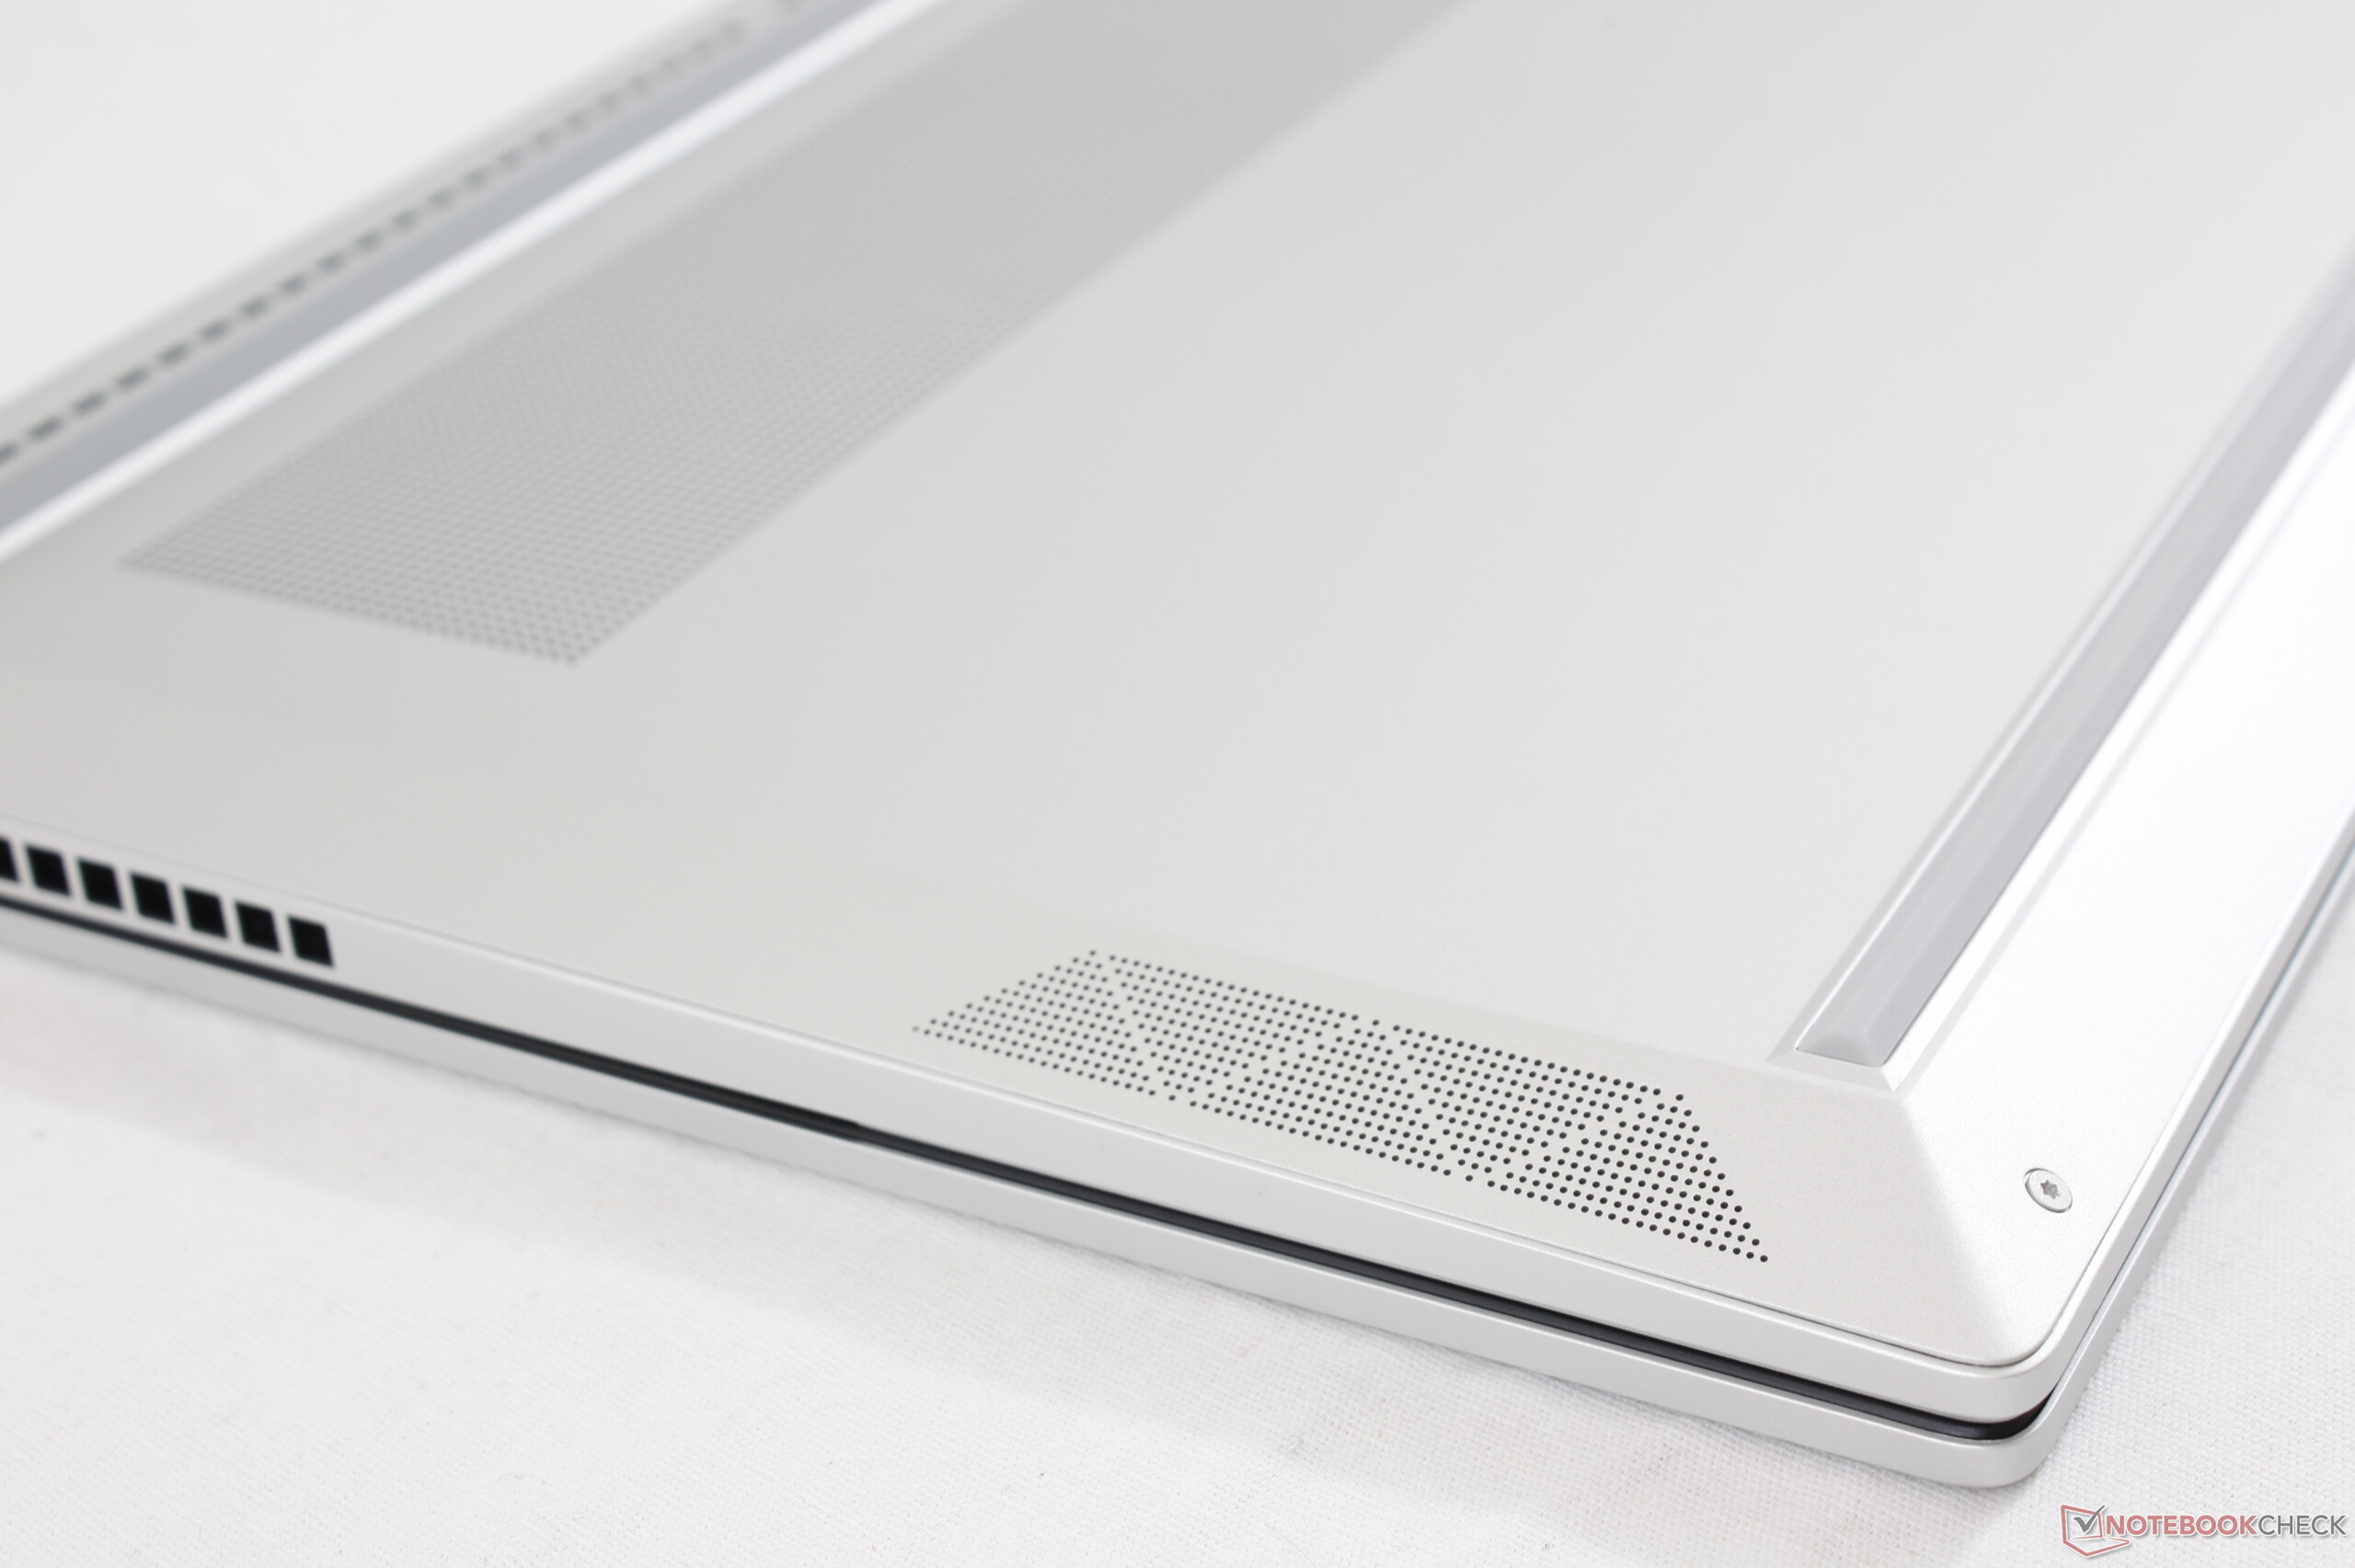
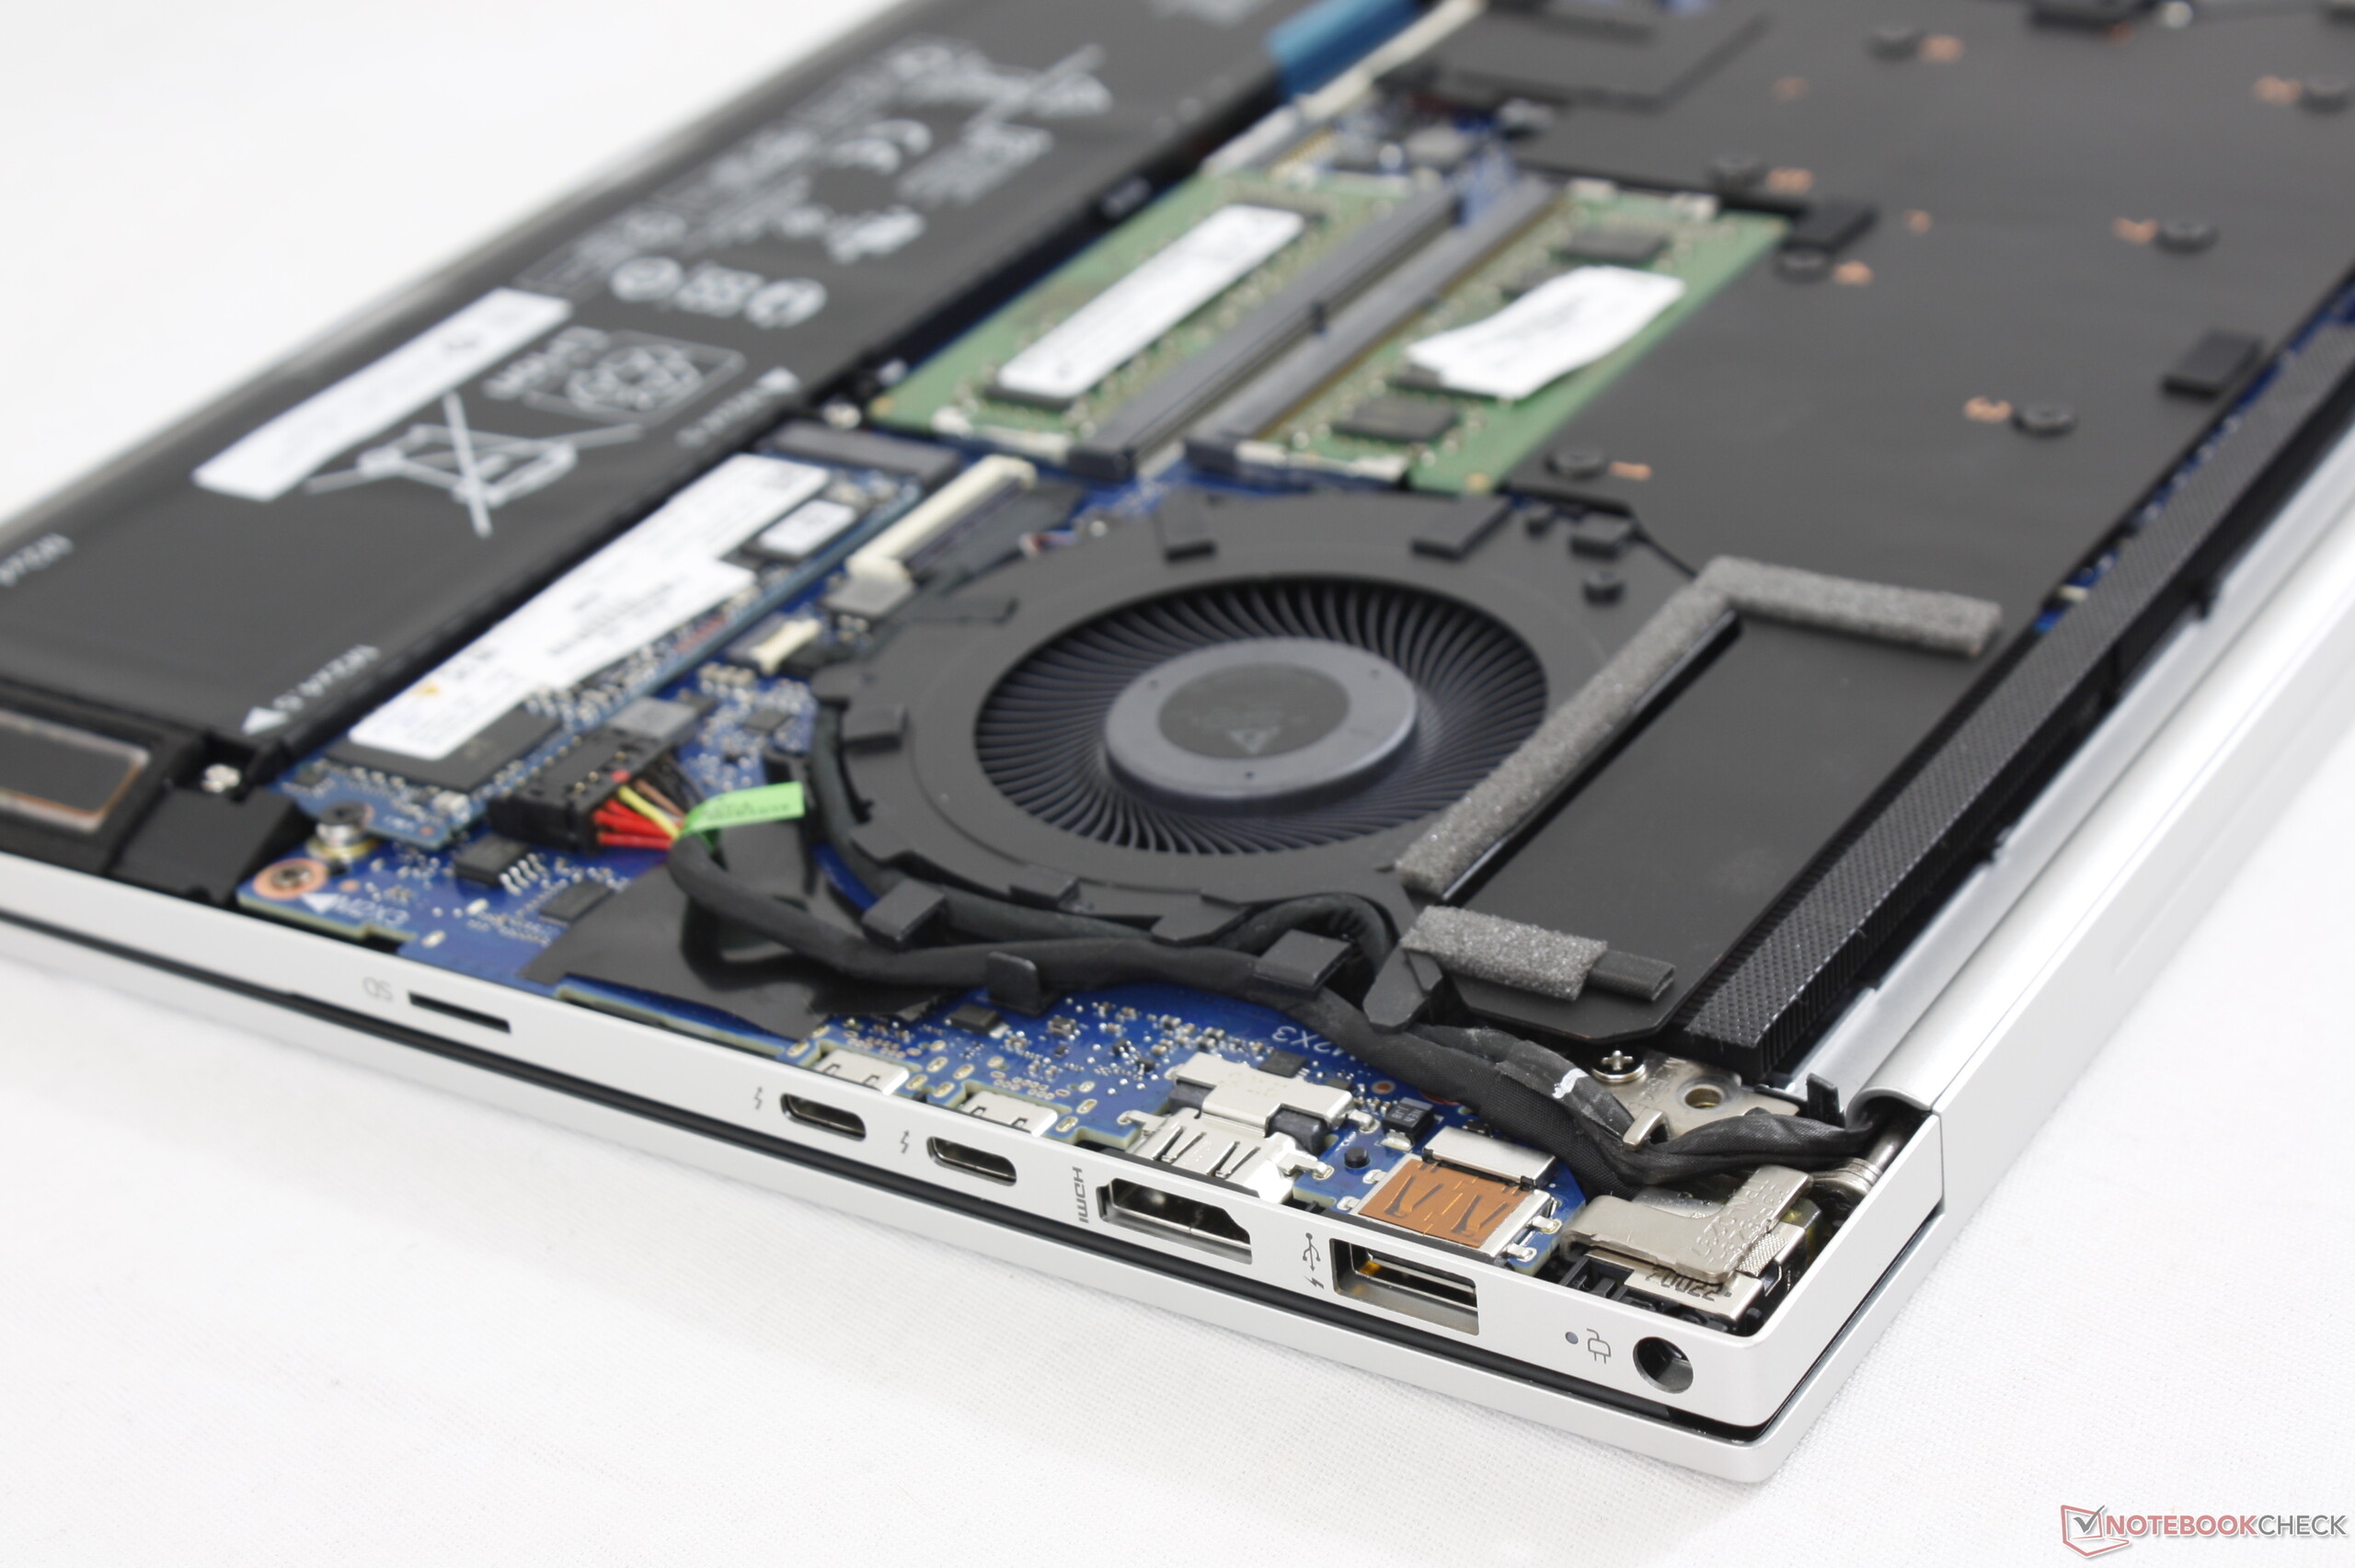
A HP gyakorlatilag újra feltalálta az Envy 15 sorozatát. Ez a legutóbbi modell teljesen különbözik az utolsó generációs változattól, és szinte minden változás pozitív. A professzionálisabb kinézet, könnyebb szervízelhetőség és új Core H-sorozatú opciók mellett az opcionális GeForce RTX 2060 Max-Q GPU sokkal gyorsabb, mint amit a MacBook Pro 15 vagy MacBook Pro 16 jelen pillanatban kínálni tud, miközben kevesebbe is kerül, és pontosan ez az, amit a HP akart.
Viszont a játszás-szintű hardver jelenléte azt jelenti, hogy az Envy 15 a vékony gamer notebookok számos hátrányával is rendelkezik. Ne tévesszen meg minket a karcsú, Ultrabook-szerű külső, mert ez a laptop nem fog annyi ideig futni, mint a tipikus Intel UHD vagy GeForce MX-hajtású Ultrabook, és nem is lesz annyira csendes vagy könnyű. Ez majdhogynem egy álcázott gamer notebook, annak ellenére, hogy a tartalomkészítőket célozza meg, nagyjából ugyanúgy, ahogy a Gigabyte Aero sorozat. A 200 wattos adapter például jóval nagyobb, és így nehezebben is hordozható, mint bármely Ultrabook esetében. Ha a felhasználók elfogadják ezeket az eredendő hátrányokat, akkor elégedettek lesznek az új Envy 15-tel és annak az árához és méretéhez képest magas szintű teljesítményével. Máskülönben jobban járnánk a Spectre-el, ha a feladataink nagyrészt böngészésből és szövegszerkesztésből állnak.
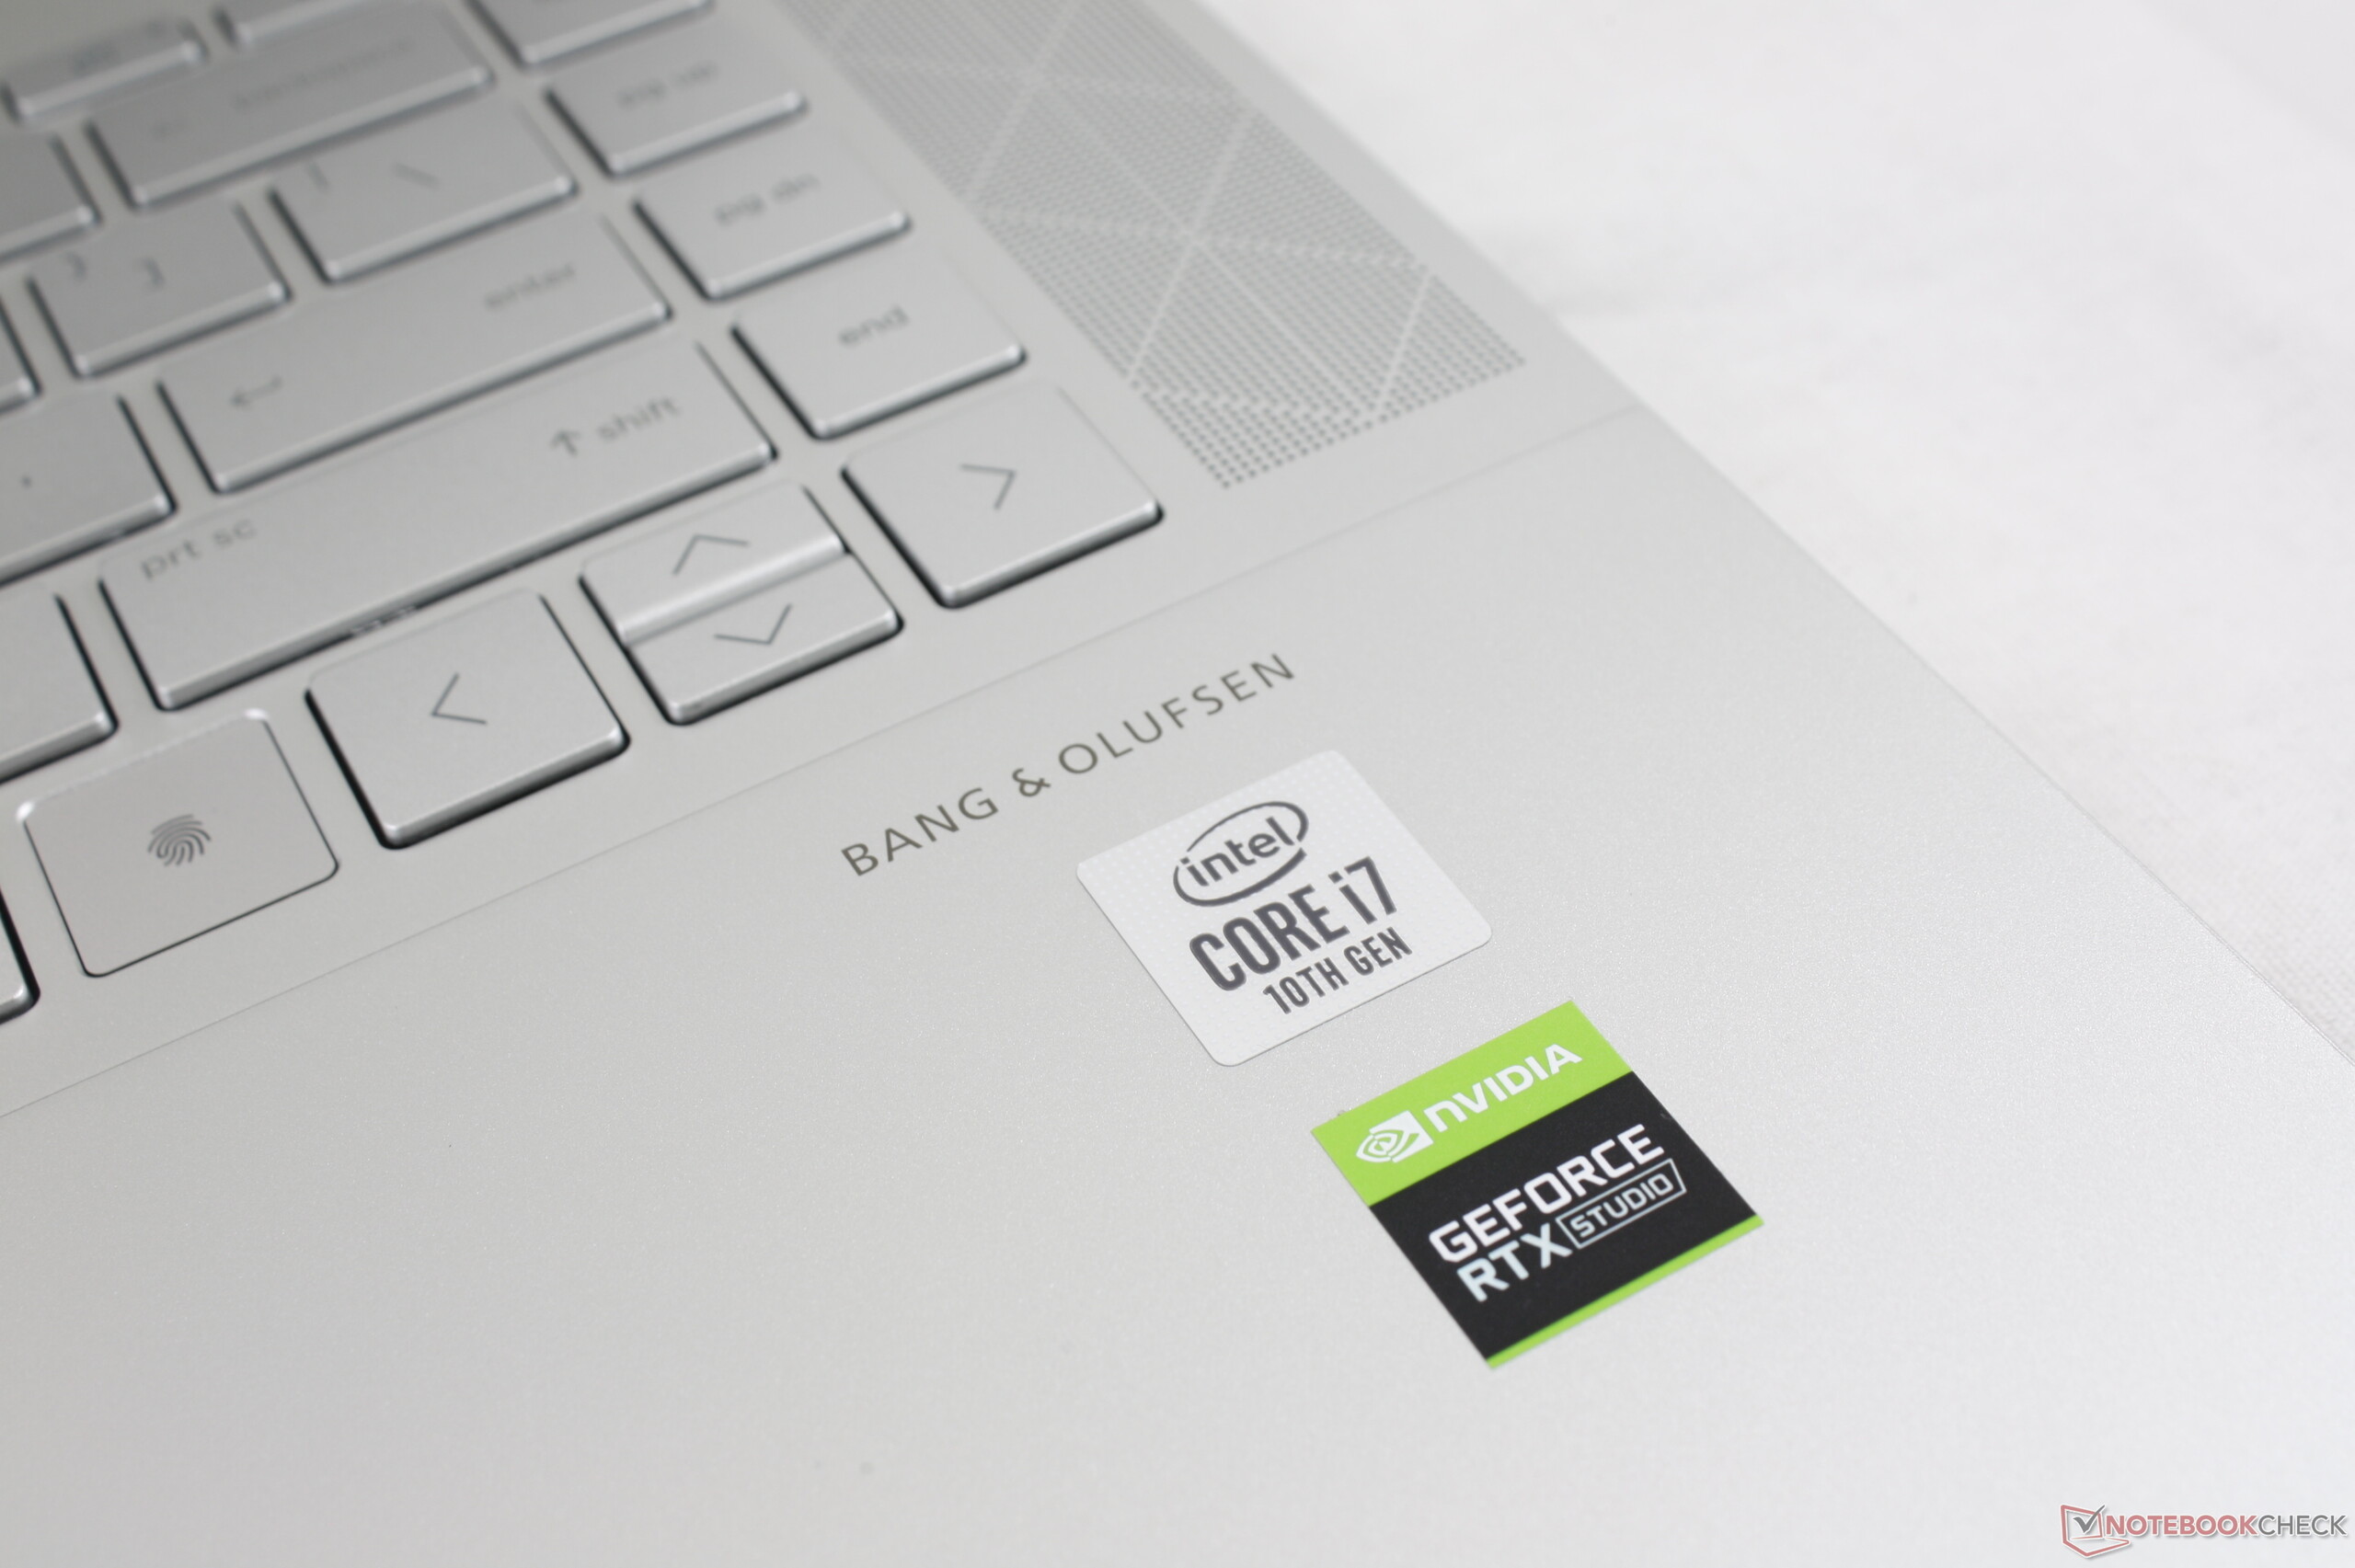
Lenne egy maroknyi igazítás, amit szeretnénk látni, hogy általuk az Envy 15 jobb legyen. Az USB-C töltés támogatása rendkívül hasznos lenne az utazóknak, és így a nagy 200 wattos adapter otthon maradhat, amikor nincs rá szükség. A clickpad és a zsanérok szilárdabbak is lehetnének, hogy tükrözzék az új modell magas árát. Az ujjlenyomat-olvasó kevésbé feltűnő elhelyezkedése kielégítené azokat a felhasználókat, akik használják az Fn gombot.
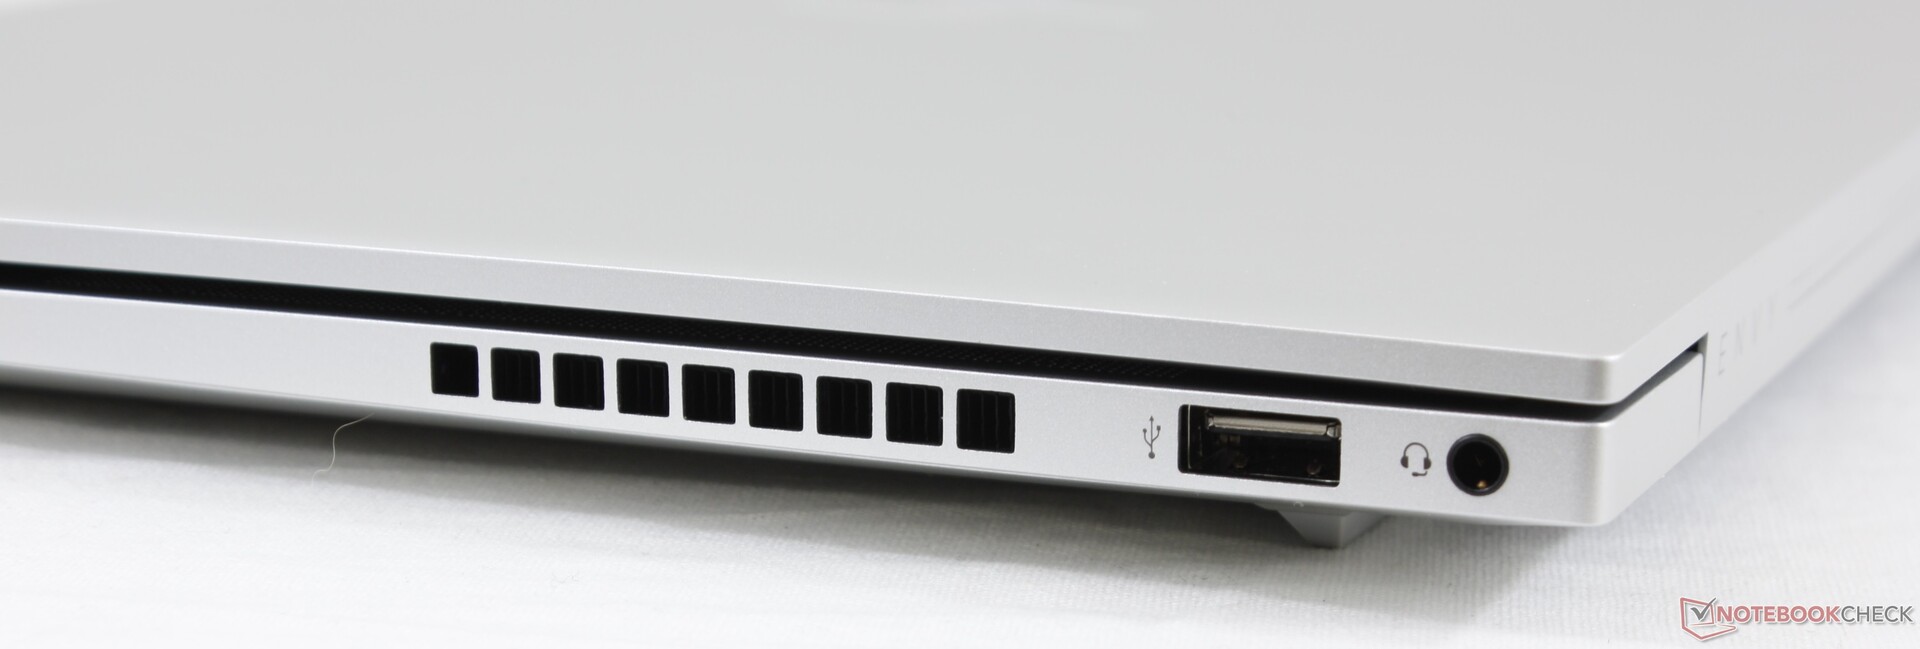
Egy MacBook Pro-t szeretne, de gyorsabb grafikával, OLED-del és nagyobb portválasztékkal? Akkor a 2020-as Envy 15 figyelmet érdemel. Már nem ULV processzorok által hajtva, az új Envy erős gamer-típusú hardver opciókat rejt egy Ultrabook-szerű házban, ami által egy remek középútnak számít.
HP Envy 15-ep0098nr
- 08/31/2022 v7 (old)
Allen Ngo
Price comparison

