Asus Transformer 3 Pro T303UA-GN050T Convertible rövid értékelés


| |||||||||||||||||||||||||
Fényerő megoszlás: 91 %
Centrumban: 316 cd/m²
Kontraszt: 1090:1 (Fekete: 0.29 cd/m²)
ΔE ColorChecker Calman: 3.91 | ∀{0.5-29.43 Ø4.71}
ΔE Greyscale Calman: 5.37 | ∀{0.09-98 Ø4.96}
98% sRGB (Argyll 1.6.3 3D)
72% AdobeRGB 1998 (Argyll 1.6.3 3D)
82.2% AdobeRGB 1998 (Argyll 3D)
98.3% sRGB (Argyll 3D)
81.8% Display P3 (Argyll 3D)
Gamma: 2.36
CCT: 7812 K
| Asus Transformer 3 Pro T303UA-GN050T BOE BOE06AC (NV126A1M-N51), , 2880x1920, 12.6" | Microsoft Surface Pro 4, Core m3 Samsung SDC3853, , 2736x1824, 12.3" | Lenovo ThinkPad X1 Yoga-20FRS1VS00 Samsung ATNA40JU01-0, , 2560x1440, 14" | HP Elite x2 1012 G1 LG Philips, , 1920x1280, 12.1" | Acer Aspire Switch Alpha 12 SA5-271-56HM Panasonic VVX12T041N00, , 2160x1440, 12" | |
|---|---|---|---|---|---|
| Display | -12% | -31% | -14% | ||
| Display P3 Coverage (%) | 81.8 | 67.5 -17% | 53.8 -34% | 65.5 -20% | |
| sRGB Coverage (%) | 98.3 | 96.6 -2% | 73.7 -25% | 96.1 -2% | |
| AdobeRGB 1998 Coverage (%) | 82.2 | 69 -16% | 53.8 -35% | 66.9 -19% | |
| Response Times | -30% | 97% | 5% | 8% | |
| Response Time Grey 50% / Grey 80% * (ms) | 30 ? | 46 ? -53% | 1 ? 97% | 33.2 ? -11% | 20 ? 33% |
| Response Time Black / White * (ms) | 29 ? | 31 ? -7% | 1 ? 97% | 22.8 ? 21% | 34 ? -17% |
| PWM Frequency (Hz) | 200 ? | 50 ? | 240 ? | 1000 ? | |
| Screen | 13% | -3% | -22% | -21% | |
| Brightness middle (cd/m²) | 316 | 389.2 23% | 279 -12% | 322 2% | 345 9% |
| Brightness (cd/m²) | 307 | 392 28% | 277 -10% | 319 4% | 328 7% |
| Brightness Distribution (%) | 91 | 92 1% | 91 0% | 97 7% | 91 0% |
| Black Level * (cd/m²) | 0.29 | 0.27 7% | 0.42 -45% | 0.38 -31% | |
| Contrast (:1) | 1090 | 1441 32% | 767 -30% | 908 -17% | |
| Colorchecker dE 2000 * | 3.91 | 3.61 8% | 5.15 -32% | 6.02 -54% | 8.4 -115% |
| Colorchecker dE 2000 max. * | 7.9 | 8.28 -5% | 10.06 -27% | 11.9 -51% | |
| Greyscale dE 2000 * | 5.37 | 3.8 29% | 5.44 -1% | 6.29 -17% | 4.3 20% |
| Gamma | 2.36 93% | 2.16 102% | 2.28 96% | 2.4 92% | 2.63 84% |
| CCT | 7812 83% | 5969 109% | 5686 114% | 7712 84% | 7368 88% |
| Color Space (Percent of AdobeRGB 1998) (%) | 72 | 63 -12% | 98 36% | 47.8 -34% | 62 -14% |
| Color Space (Percent of sRGB) (%) | 98 | 97 -1% | 100 2% | 73.2 -25% | |
| Teljes átlag (program / beállítások) | -10% /
1% | 47% /
17% | -16% /
-20% | -9% /
-16% |
* ... a kisebb jobb
Megjelenítési válaszidők
| ↔ Válaszidő Fekete-fehér | ||
|---|---|---|
| 29 ms ... emelkedés és süllyedés ↘ kombinálva | ↗ 8 ms emelkedés | 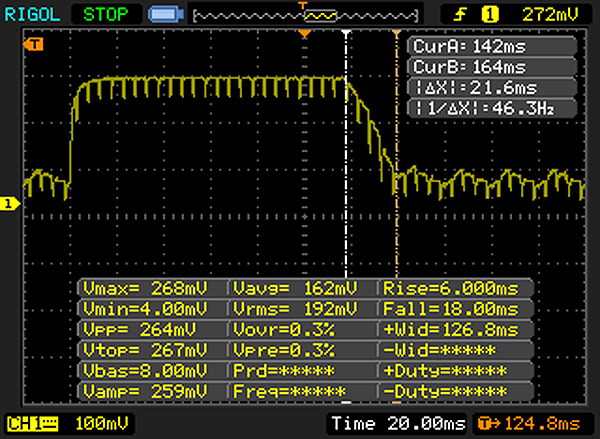 |
| ↘ 21 ms ősz | ||
| A képernyő viszonylag lassú reakciósebességet mutat tesztjeinkben, és túl lassú lehet a játékosok számára. Összehasonlításképpen, az összes tesztelt eszköz 0.1 (minimum) és 240 (maximum) ms között mozog. » 77 % of all devices are better. Ez azt jelenti, hogy a mért válaszidő rosszabb, mint az összes vizsgált eszköz átlaga (19.8 ms). | ||
| ↔ Válaszidő 50% szürke és 80% szürke között | ||
| 30 ms ... emelkedés és süllyedés ↘ kombinálva | ↗ 14 ms emelkedés | 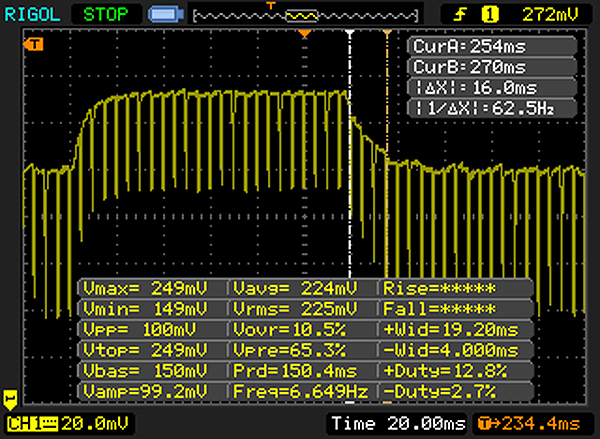 |
| ↘ 16 ms ősz | ||
| A képernyő lassú reakciósebességet mutat tesztjeinkben, és nem lesz kielégítő a játékosok számára. Összehasonlításképpen, az összes tesztelt eszköz 0.165 (minimum) és 636 (maximum) ms között mozog. » 40 % of all devices are better. Ez azt jelenti, hogy a mért válaszidő hasonló az összes vizsgált eszköz átlagához (30.9 ms). | ||
Képernyő villogása / PWM (impulzusszélesség-moduláció)
| Képernyő villogása / PWM észlelve | 200 Hz | ≤ 90 % fényerő beállítása | 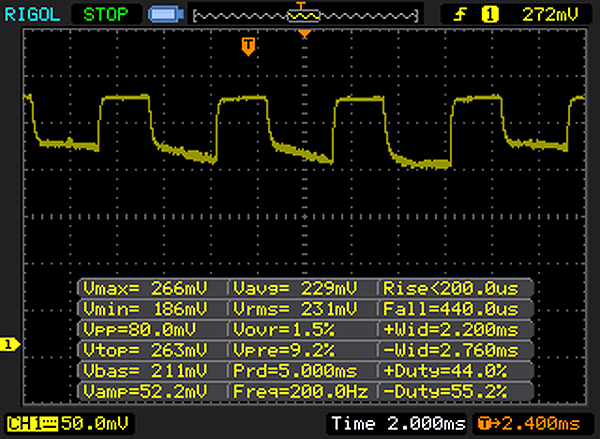 |
A kijelző háttérvilágítása 200 Hz-en villog (a legrosszabb esetben, pl. PWM használatával) Villódzás észlelve a 90 % vagy annál kisebb fényerő-beállításnál. E fényerő-beállítás felett nem lehet villogás vagy PWM. A 200 Hz frekvenciája viszonylag alacsony, így az érzékeny felhasználók valószínűleg villogást észlelnek, és megerőltetik a szemüket a megadott és az alatti fényerő-beállítás mellett. Összehasonlításképpen: az összes tesztelt eszköz 52 %-a nem használja a PWM-et a kijelző elsötétítésére. Ha PWM-et észleltek, akkor átlagosan 7748 (minimum: 5 - maximum: 343500) Hz-t mértek. | |||
| Cinebench R15 | |
| CPU Single 64Bit | |
| Lenovo ThinkPad X1 Yoga-20FRS1VS00 | |
| Asus Transformer 3 Pro T303UA-GN050T | |
| Acer Aspire Switch Alpha 12 SA5-271-56HM | |
| HP Elite x2 1012 G1 | |
| Microsoft Surface Pro 4, Core m3 | |
| CPU Multi 64Bit | |
| Lenovo ThinkPad X1 Yoga-20FRS1VS00 | |
| Acer Aspire Switch Alpha 12 SA5-271-56HM | |
| HP Elite x2 1012 G1 | |
| Asus Transformer 3 Pro T303UA-GN050T | |
| Microsoft Surface Pro 4, Core m3 | |
| Cinebench R11.5 | |
| CPU Single 64Bit | |
| Lenovo ThinkPad X1 Yoga-20FRS1VS00 | |
| Asus Transformer 3 Pro T303UA-GN050T | |
| HP Elite x2 1012 G1 | |
| Microsoft Surface Pro 4, Core m3 | |
| CPU Multi 64Bit | |
| Lenovo ThinkPad X1 Yoga-20FRS1VS00 | |
| HP Elite x2 1012 G1 | |
| Asus Transformer 3 Pro T303UA-GN050T | |
| Microsoft Surface Pro 4, Core m3 | |
| Cinebench R10 | |
| Rendering Single CPUs 64Bit | |
| Asus Transformer 3 Pro T303UA-GN050T | |
| Microsoft Surface Pro 4, Core m3 | |
| Rendering Multiple CPUs 64Bit | |
| Asus Transformer 3 Pro T303UA-GN050T | |
| Microsoft Surface Pro 4, Core m3 | |
| JetStream 1.1 - 1.1 Total | |
| Asus Transformer 3 Pro T303UA-GN050T | |
| Lenovo ThinkPad X1 Yoga-20FRS1VS00 | |
| HP Elite x2 1012 G1 | |
| Acer Aspire Switch Alpha 12 SA5-271-56HM | |
| Octane V2 - Total Score | |
| Lenovo ThinkPad X1 Yoga-20FRS1VS00 | |
| Asus Transformer 3 Pro T303UA-GN050T | |
| HP Elite x2 1012 G1 | |
| Acer Aspire Switch Alpha 12 SA5-271-56HM | |
| Mozilla Kraken 1.1 - Total | |
| Microsoft Surface Pro 4, Core m3 | |
| Acer Aspire Switch Alpha 12 SA5-271-56HM | |
| HP Elite x2 1012 G1 | |
| Asus Transformer 3 Pro T303UA-GN050T | |
| Lenovo ThinkPad X1 Yoga-20FRS1VS00 | |
* ... a kisebb jobb
| PCMark 8 | |
| Home Score Accelerated v2 | |
| Lenovo ThinkPad X1 Yoga-20FRS1VS00 | |
| Acer Aspire Switch Alpha 12 SA5-271-56HM | |
| Asus Transformer 3 Pro T303UA-GN050T | |
| HP Elite x2 1012 G1 | |
| Microsoft Surface Pro 4, Core m3 | |
| Work Score Accelerated v2 | |
| Lenovo ThinkPad X1 Yoga-20FRS1VS00 | |
| Acer Aspire Switch Alpha 12 SA5-271-56HM | |
| HP Elite x2 1012 G1 | |
| Asus Transformer 3 Pro T303UA-GN050T | |
| Microsoft Surface Pro 4, Core m3 | |
| Creative Score Accelerated v2 | |
| Asus Transformer 3 Pro T303UA-GN050T | |
| HP Elite x2 1012 G1 | |
| Microsoft Surface Pro 4, Core m3 | |
| PCMark 7 | |
| Score | |
| Asus Transformer 3 Pro T303UA-GN050T | |
| HP Elite x2 1012 G1 | |
| Microsoft Surface Pro 4, Core m3 | |
| Productivity | |
| HP Elite x2 1012 G1 | |
| Asus Transformer 3 Pro T303UA-GN050T | |
| PCMark Vantage Result | 13886 pontok | |
| PCMark 7 Score | 5152 pontok | |
| PCMark 8 Home Score Accelerated v2 | 2985 pontok | |
| PCMark 8 Creative Score Accelerated v2 | 4043 pontok | |
| PCMark 8 Work Score Accelerated v2 | 3830 pontok | |
Segítség | ||
| Asus Transformer 3 Pro T303UA-GN050T SK Hynix Canvas SC300 512GB M.2 (HFS512G39MND) | Microsoft Surface Pro 4, Core m3 Samsung MZFLV128 NVMe | Lenovo ThinkPad X1 Yoga-20FRS1VS00 Samsung SSD PM961 1TB M.2 PCIe 3.0 x4 NVMe (MZSLW1T0) | HP Elite x2 1012 G1 Liteon L8H-256V2G | Acer Aspire Switch Alpha 12 SA5-271-56HM Kingston RBU-SNS8152S3256GG2 | |
|---|---|---|---|---|---|
| CrystalDiskMark 3.0 | -7% | 121% | 12% | 0% | |
| Read Seq (MB/s) | 398.9 | 663 66% | 1510 279% | 501 26% | 518 30% |
| Write Seq (MB/s) | 402 | 158.2 -61% | 1193 197% | 297.2 -26% | 199.9 -50% |
| Read 512 (MB/s) | 303.1 | 313.1 3% | 351.7 16% | 374.9 24% | |
| Write 512 (MB/s) | 320.3 | 158.2 -51% | 295.7 -8% | 201 -37% | |
| Read 4k (MB/s) | 26.11 | 30.14 15% | 37 42% | 28.31 8% | 29.3 12% |
| Write 4k (MB/s) | 57.7 | 68 18% | 126 118% | 90.3 56% | 76.8 33% |
| Read 4k QD32 (MB/s) | 245.8 | 243.7 -1% | 404 64% | 285 16% | 272 11% |
| Write 4k QD32 (MB/s) | 253.8 | 149.2 -41% | 319 26% | 268.4 6% | 197.1 -22% |

| 3DMark | |
| 1280x720 Cloud Gate Standard Graphics | |
| Lenovo ThinkPad X1 Yoga-20FRS1VS00 | |
| Acer Aspire Switch Alpha 12 SA5-271-56HM | |
| Microsoft Surface Pro 4, Core m3 | |
| HP Elite x2 1012 G1 | |
| Asus Transformer 3 Pro T303UA-GN050T | |
| 1920x1080 Fire Strike Graphics | |
| Lenovo ThinkPad X1 Yoga-20FRS1VS00 | |
| Microsoft Surface Pro 4, Core m3 | |
| HP Elite x2 1012 G1 | |
| Asus Transformer 3 Pro T303UA-GN050T | |
| 1280x720 Ice Storm Standard Score | |
| HP Elite x2 1012 G1 | |
| Microsoft Surface Pro 4, Core m3 | |
| Asus Transformer 3 Pro T303UA-GN050T | |
| 3DMark 11 | |
| 1280x720 Performance GPU | |
| Lenovo ThinkPad X1 Yoga-20FRS1VS00 | |
| Acer Aspire Switch Alpha 12 SA5-271-56HM | |
| Asus Transformer 3 Pro T303UA-GN050T | |
| Microsoft Surface Pro 4, Core m3 | |
| HP Elite x2 1012 G1 | |
| 1280x720 Performance | |
| Lenovo ThinkPad X1 Yoga-20FRS1VS00 | |
| Acer Aspire Switch Alpha 12 SA5-271-56HM | |
| Asus Transformer 3 Pro T303UA-GN050T | |
| Microsoft Surface Pro 4, Core m3 | |
| HP Elite x2 1012 G1 | |
| 3DMark 06 - 1280x1024 Standard Score AA:0x AF:0x | |
| HP Elite x2 1012 G1 | |
| Microsoft Surface Pro 4, Core m3 | |
| Asus Transformer 3 Pro T303UA-GN050T | |
| 3DMark 03 Standard | 20325 pontok | |
| 3DMark 05 Standard | 9082 pontok | |
| 3DMark 06 Standard Score | 7464 pontok | |
| 3DMark Vantage P Result | 4650 pontok | |
| 3DMark 11 Performance | 1381 pontok | |
| 3DMark Ice Storm Standard Score | 35293 pontok | |
| 3DMark Cloud Gate Standard Score | 4401 pontok | |
| 3DMark Fire Strike Score | 676 pontok | |
| 3DMark Fire Strike Extreme Score | 309 pontok | |
| 3DMark Time Spy Score | 297 pontok | |
Segítség | ||
| alacsony | közepes | magas | ultra | |
|---|---|---|---|---|
| BioShock Infinite (2013) | 45.2 | 26.9 | 22.5 | 6.6 |
| Battlefield 4 (2013) | 31.3 | 23.2 | 15.9 | |
| Rise of the Tomb Raider (2016) | 20 | 11 | 9 |
| Asus Transformer 3 Pro T303UA-GN050T HD Graphics 520, 6500U, SK Hynix Canvas SC300 512GB M.2 (HFS512G39MND) | Microsoft Surface Pro 4 Core i7 Iris Graphics 540, 6650U, Samsung MZFLV256 NVMe | Lenovo ThinkPad X1 Yoga-20FRS1VS00 HD Graphics 520, 6600U, Samsung SSD PM961 1TB M.2 PCIe 3.0 x4 NVMe (MZSLW1T0) | Apple MacBook Pro 13 2016 (2.9 GHz) Iris Graphics 550, 6267U, Apple SSD AP0256 | Dell XPS 13 9360 QHD+ i5 HD Graphics 620, i5-7200U, Toshiba NVMe THNSN5256GPUK | |
|---|---|---|---|---|---|
| Noise | -0% | 4% | 4% | 1% | |
| off / környezet * (dB) | 30.7 | 28.9 6% | 30.2 2% | 30.3 1% | |
| Idle Minimum * (dB) | 30.7 | 28.4 7% | 28.9 6% | 30.2 2% | 30.6 -0% |
| Idle Average * (dB) | 30.7 | 28.6 7% | 28.9 6% | 30.2 2% | 30.6 -0% |
| Idle Maximum * (dB) | 30.7 | 28.7 7% | 28.9 6% | 30.2 2% | 32.2 -5% |
| Load Average * (dB) | 37 | 40.8 -10% | 35.3 5% | 33 11% | 32.2 13% |
| Load Maximum * (dB) | 37.1 | 41.4 -12% | 38.9 -5% | 36.2 2% | 38.5 -4% |
* ... a kisebb jobb
Zajszint
| Üresjárat |
| 30.7 / 30.7 / 30.7 dB(A) |
| Terhelés |
| 37 / 37.1 dB(A) |
 | ||
30 dB csendes 40 dB(A) hallható 50 dB(A) hangos |
||
min: | ||
| Asus Transformer 3 Pro T303UA-GN050T HD Graphics 520, 6500U, SK Hynix Canvas SC300 512GB M.2 (HFS512G39MND) | Microsoft Surface Pro 4, Core m3 HD Graphics 515, 6Y30, Samsung MZFLV128 NVMe | Lenovo ThinkPad X1 Yoga-20FRS1VS00 HD Graphics 520, 6600U, Samsung SSD PM961 1TB M.2 PCIe 3.0 x4 NVMe (MZSLW1T0) | HP Elite x2 1012 G1 HD Graphics 515, 6Y54, Liteon L8H-256V2G | Acer Aspire Switch Alpha 12 SA5-271-56HM HD Graphics 520, 6200U, Kingston RBU-SNS8152S3256GG2 | |
|---|---|---|---|---|---|
| Heat | -8% | -12% | 1% | -11% | |
| Maximum Upper Side * (°C) | 34.9 | 43.6 -25% | 45.5 -30% | 39 -12% | 46.7 -34% |
| Maximum Bottom * (°C) | 36.7 | 45.2 -23% | 47.1 -28% | 41.2 -12% | 51 -39% |
| Idle Upper Side * (°C) | 35.8 | 32.4 9% | 31.1 13% | 29.5 18% | 29.5 18% |
| Idle Bottom * (°C) | 32.4 | 29.6 9% | 33.1 -2% | 29.8 8% | 28.6 12% |
* ... a kisebb jobb
(+) A felső oldalon a maximális hőmérséklet 34.9 °C / 95 F, összehasonlítva a 35.4 °C / 96 F átlagával , 19.6 és 60 °C között a Convertible osztálynál.
(+) Az alsó maximum 36.7 °C / 98 F-ig melegszik fel, összehasonlítva a 36.9 °C / 98 F átlagával
(±) Üresjáratban a felső oldal átlagos hőmérséklete 32 °C / 90 F, összehasonlítva a 30.3 °C / ### eszközátlaggal class_avg_f### F.
(+) A csuklótámasz és az érintőpad eléri a bőr maximális hőmérsékletét (35.8 °C / 96.4 F), ezért nem forrók.
(-) A hasonló eszközök csuklótámasz területének átlagos hőmérséklete 28 °C / 82.4 F volt (-7.8 °C / -14 F).
Asus Transformer 3 Pro T303UA-GN050T hangelemzés
(±) | a hangszóró hangereje átlagos, de jó (73 dB)
Basszus 100 - 315 Hz
(±) | csökkentett basszus – átlagosan 11.2%-kal alacsonyabb, mint a medián
(±) | a basszus linearitása átlagos (8.2% delta az előző frekvenciához)
Közepes 400-2000 Hz
(+) | kiegyensúlyozott középpontok – csak 1.8% választja el a mediántól
(+) | a középpontok lineárisak (6.7% delta az előző frekvenciához)
Maximum 2-16 kHz
(±) | magasabb csúcsok – átlagosan 9%-kal magasabb, mint a medián
(+) | a csúcsok lineárisak (5.7% delta az előző frekvenciához képest)
Összességében 100 - 16.000 Hz
(±) | az általános hang linearitása átlagos (19% eltérés a mediánhoz képest)
Ugyanazon osztályhoz képest
» 45%Ebben az osztályban az összes tesztelt eszköz %-a jobb volt, 7% hasonló, 48%-kal rosszabb
» A legjobb delta értéke 6%, az átlag 20%, a legrosszabb 57% volt
Az összes tesztelt eszközzel összehasonlítva
» 45% az összes tesztelt eszköz jobb volt, 7% hasonló, 47%-kal rosszabb
» A legjobb delta értéke 4%, az átlag 23%, a legrosszabb 134% volt
Apple MacBook 12 (Early 2016) 1.1 GHz hangelemzés
(+) | a hangszórók viszonylag hangosan tudnak játszani (83.6 dB)
Basszus 100 - 315 Hz
(±) | csökkentett basszus – átlagosan 11.3%-kal alacsonyabb, mint a medián
(±) | a basszus linearitása átlagos (14.2% delta az előző frekvenciához)
Közepes 400-2000 Hz
(+) | kiegyensúlyozott középpontok – csak 2.4% választja el a mediántól
(+) | a középpontok lineárisak (5.5% delta az előző frekvenciához)
Maximum 2-16 kHz
(+) | kiegyensúlyozott csúcsok – csak 2% választja el a mediántól
(+) | a csúcsok lineárisak (4.5% delta az előző frekvenciához képest)
Összességében 100 - 16.000 Hz
(+) | általános hangzás lineáris (10.2% eltérés a mediánhoz képest)
Ugyanazon osztályhoz képest
» 7%Ebben az osztályban az összes tesztelt eszköz %-a jobb volt, 2% hasonló, 90%-kal rosszabb
» A legjobb delta értéke 5%, az átlag 18%, a legrosszabb 53% volt
Az összes tesztelt eszközzel összehasonlítva
» 5% az összes tesztelt eszköz jobb volt, 1% hasonló, 94%-kal rosszabb
» A legjobb delta értéke 4%, az átlag 23%, a legrosszabb 134% volt
| Kikapcsolt állapot / Készenlét | |
| Üresjárat | |
| Terhelés |
|
Kulcs:
min: | |
| Asus Transformer 3 Pro T303UA-GN050T 6500U, HD Graphics 520, SK Hynix Canvas SC300 512GB M.2 (HFS512G39MND), IPS, 2880x1920, 12.6" | Lenovo ThinkPad X1 Yoga-20FRS1VS00 6600U, HD Graphics 520, Samsung SSD PM961 1TB M.2 PCIe 3.0 x4 NVMe (MZSLW1T0), OLED, 2560x1440, 14" | HP Elite x2 1012 G1 6Y54, HD Graphics 515, Liteon L8H-256V2G, IPS, 1920x1280, 12.1" | Acer Aspire Switch Alpha 12 SA5-271-56HM 6200U, HD Graphics 520, Kingston RBU-SNS8152S3256GG2, IPS, 2160x1440, 12" | Apple MacBook Pro 13 2016 (2.9 GHz) 6267U, Iris Graphics 550, Apple SSD AP0256, , 2560x1600, 13.3" | Dell XPS 13 9360 QHD+ i5 i5-7200U, HD Graphics 620, Toshiba NVMe THNSN5256GPUK, , 3200x1800, 13.3" | |
|---|---|---|---|---|---|---|
| Power Consumption | -6% | 23% | 4% | -18% | 22% | |
| Idle Minimum * (Watt) | 6.7 | 4.7 30% | 3.7 45% | 7.3 -9% | 2.1 69% | 3.7 45% |
| Idle Average * (Watt) | 10.3 | 8.6 17% | 6.8 34% | 10 3% | 7.6 26% | 6.1 41% |
| Idle Maximum * (Watt) | 13.5 | 12.2 10% | 7.6 44% | 10.15 25% | 8.2 39% | 6.5 52% |
| Load Average * (Watt) | 26 | 29.7 -14% | 22.5 13% | 25.2 3% | 56.4 -117% | 29.5 -13% |
| Load Maximum * (Watt) | 28.8 | 50.5 -75% | 34.5 -20% | 29.3 -2% | 59.8 -108% | 33 -15% |
* ... a kisebb jobb
| Asus Transformer 3 Pro T303UA-GN050T 6500U, HD Graphics 520, 39 Wh | Microsoft Surface Pro 4, Core m3 6Y30, HD Graphics 515, 38 Wh | Lenovo ThinkPad X1 Yoga-20FRS1VS00 6600U, HD Graphics 520, 56 Wh | HP Elite x2 1012 G1 6Y54, HD Graphics 515, 37 Wh | Acer Aspire Switch Alpha 12 SA5-271-56HM 6200U, HD Graphics 520, 37 Wh | |
|---|---|---|---|---|---|
| Akkumulátor üzemidő | 80% | 80% | 78% | 60% | |
| Reader / Idle (h) | 7.1 | 13.2 86% | 13.7 93% | 12.2 72% | 10.7 51% |
| H.264 (h) | 3.4 | 8.7 156% | 7.2 112% | 7.8 129% | |
| WiFi v1.3 (h) | 3.7 | 8.1 119% | 5.3 43% | 7.4 100% | 5.4 46% |
| Load (h) | 1.7 | 2.3 35% | 2.2 29% | 2.2 29% | 1.9 12% |
Pro
Kontra
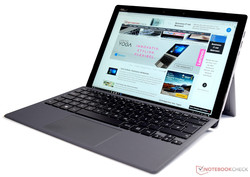
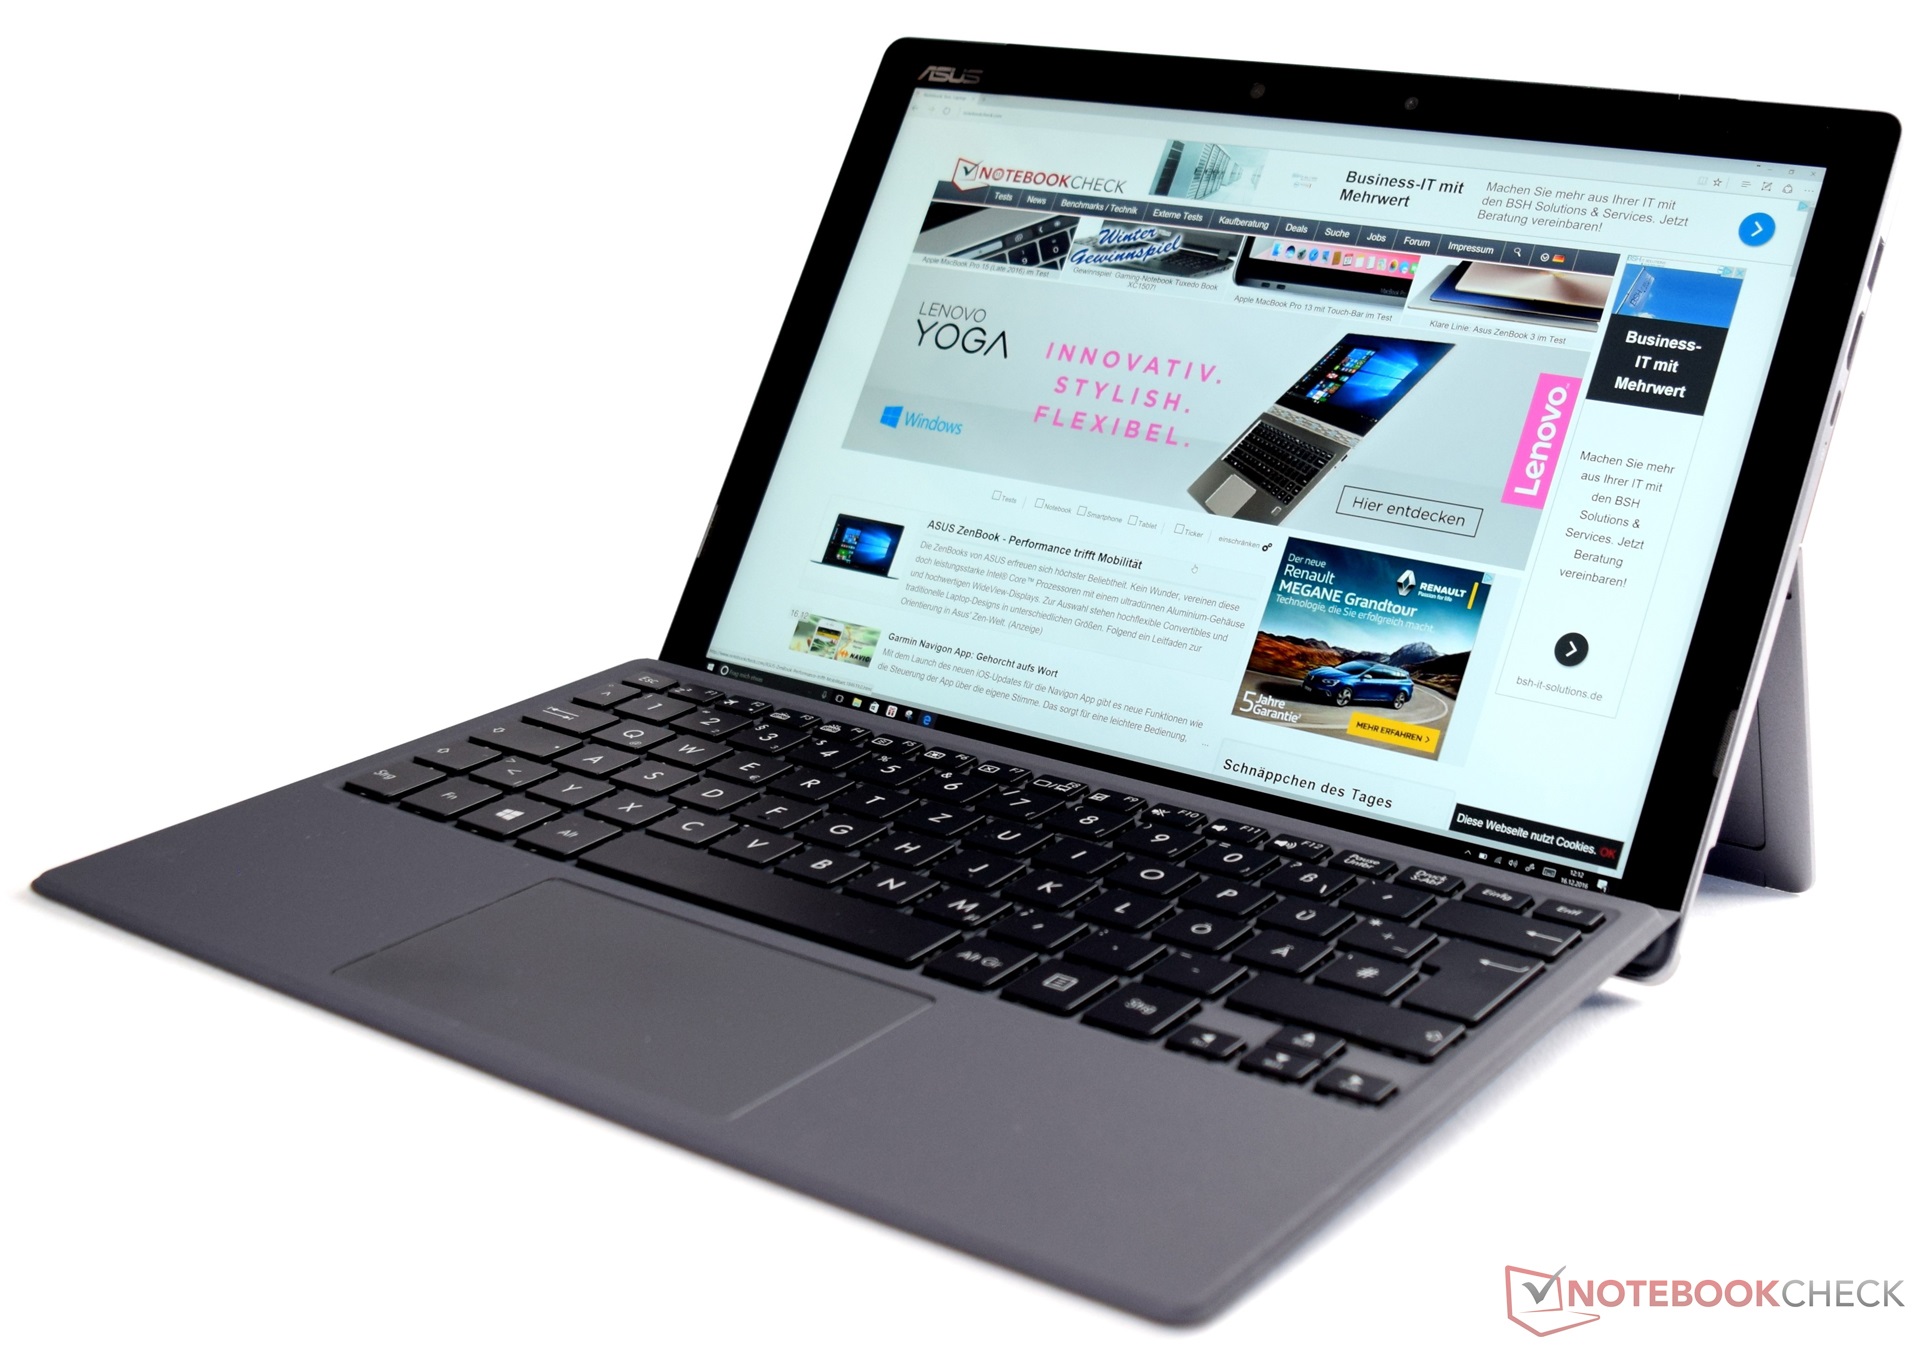
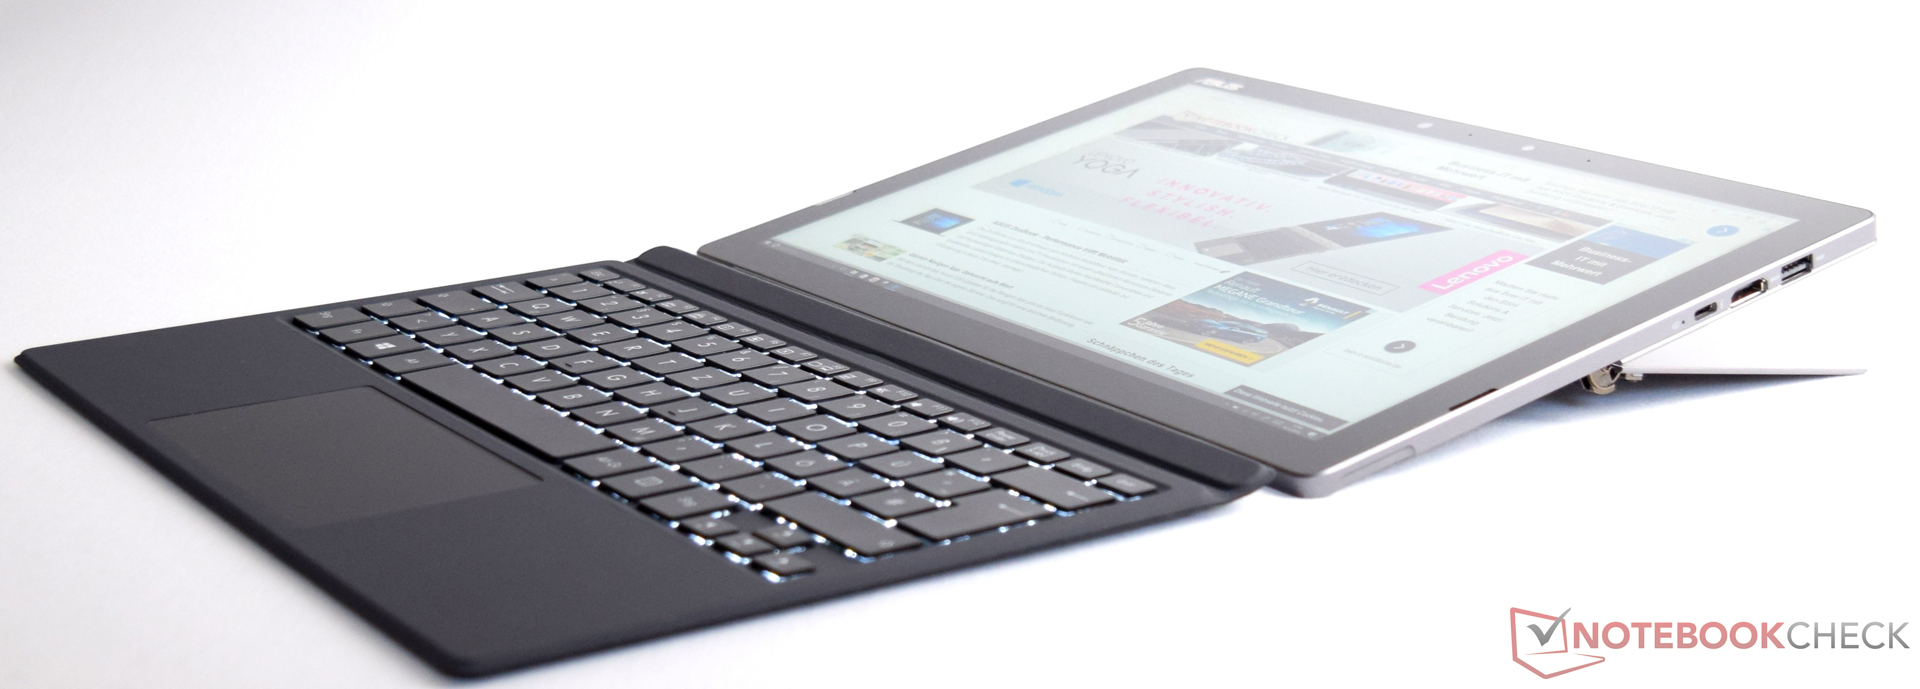
Az Asus sokat tett azért, hogy versenyre kelhessen a Microsoft Surface-szel. Az Asus Transformer 3 Pro egy nagy lépés előre: gyorsabb processzort, bőséges RAM-ot, és nagy SSD-t pakoltak egy átalakítható eszközbe. A billentyűzet dokkoló pedig képes teljes értékű laptoppá alakítani a gépet. A tesztelés idején az eszköz 1599 euróba került. A vevők ezért egy megbízható készüléket kapnak, amelynek teljesítménye elegendő a mindennapi feladatokhoz. Sajnos a teszt modell soha nem volt képes teljes teljesítményét leadni. Emiatt nem tekinthetjük a Microsoft Surface Pro 4 komoly vetélytársának.
Az elméleti és valós teljesítmény közötti szakadék sok lehetséges vevőt elriaszthat. Ennek ellenére az Asus Transformer 3 Pro egy stílusos, remekül összerakott gép. A kiváló kijelző széles színskálát kínál, és megfelelő lehet profi felhasználóknak is.
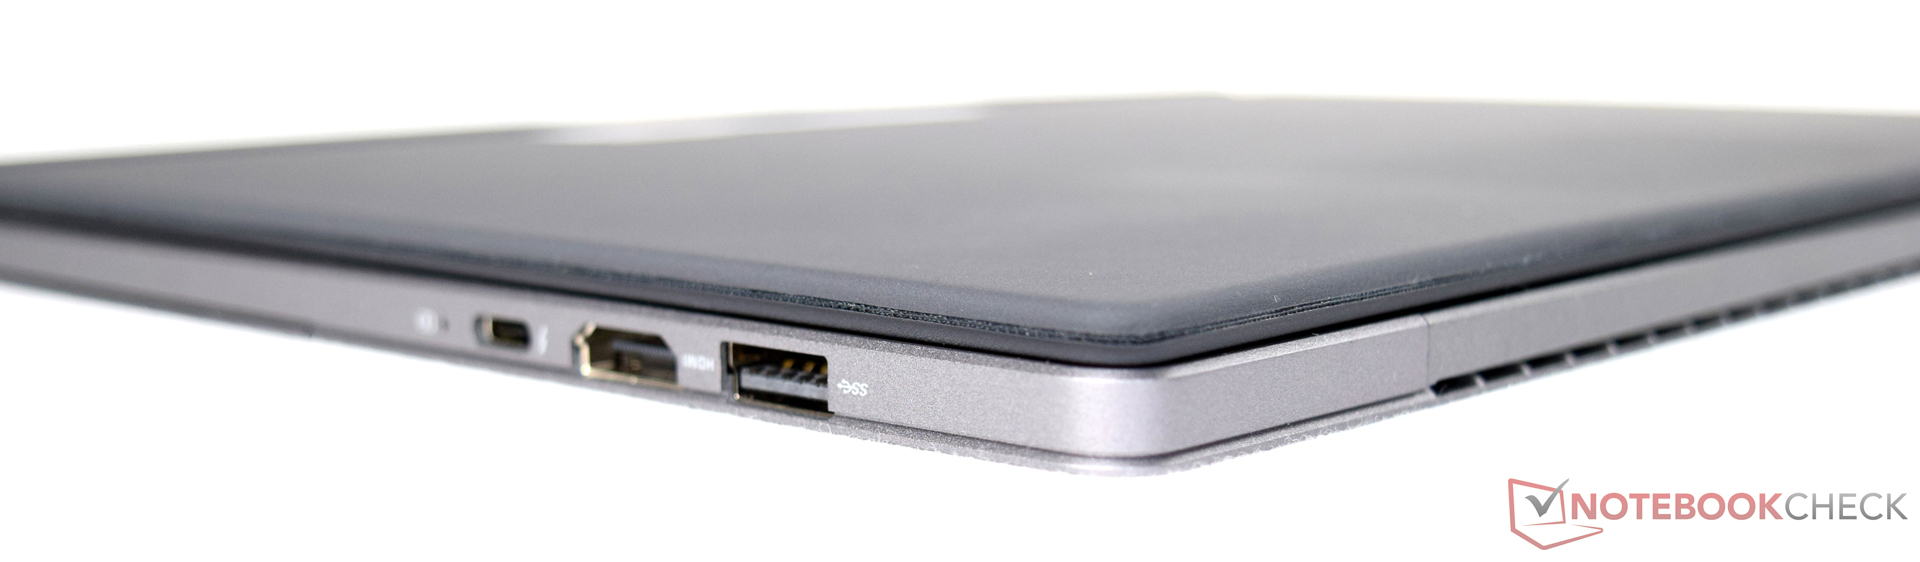
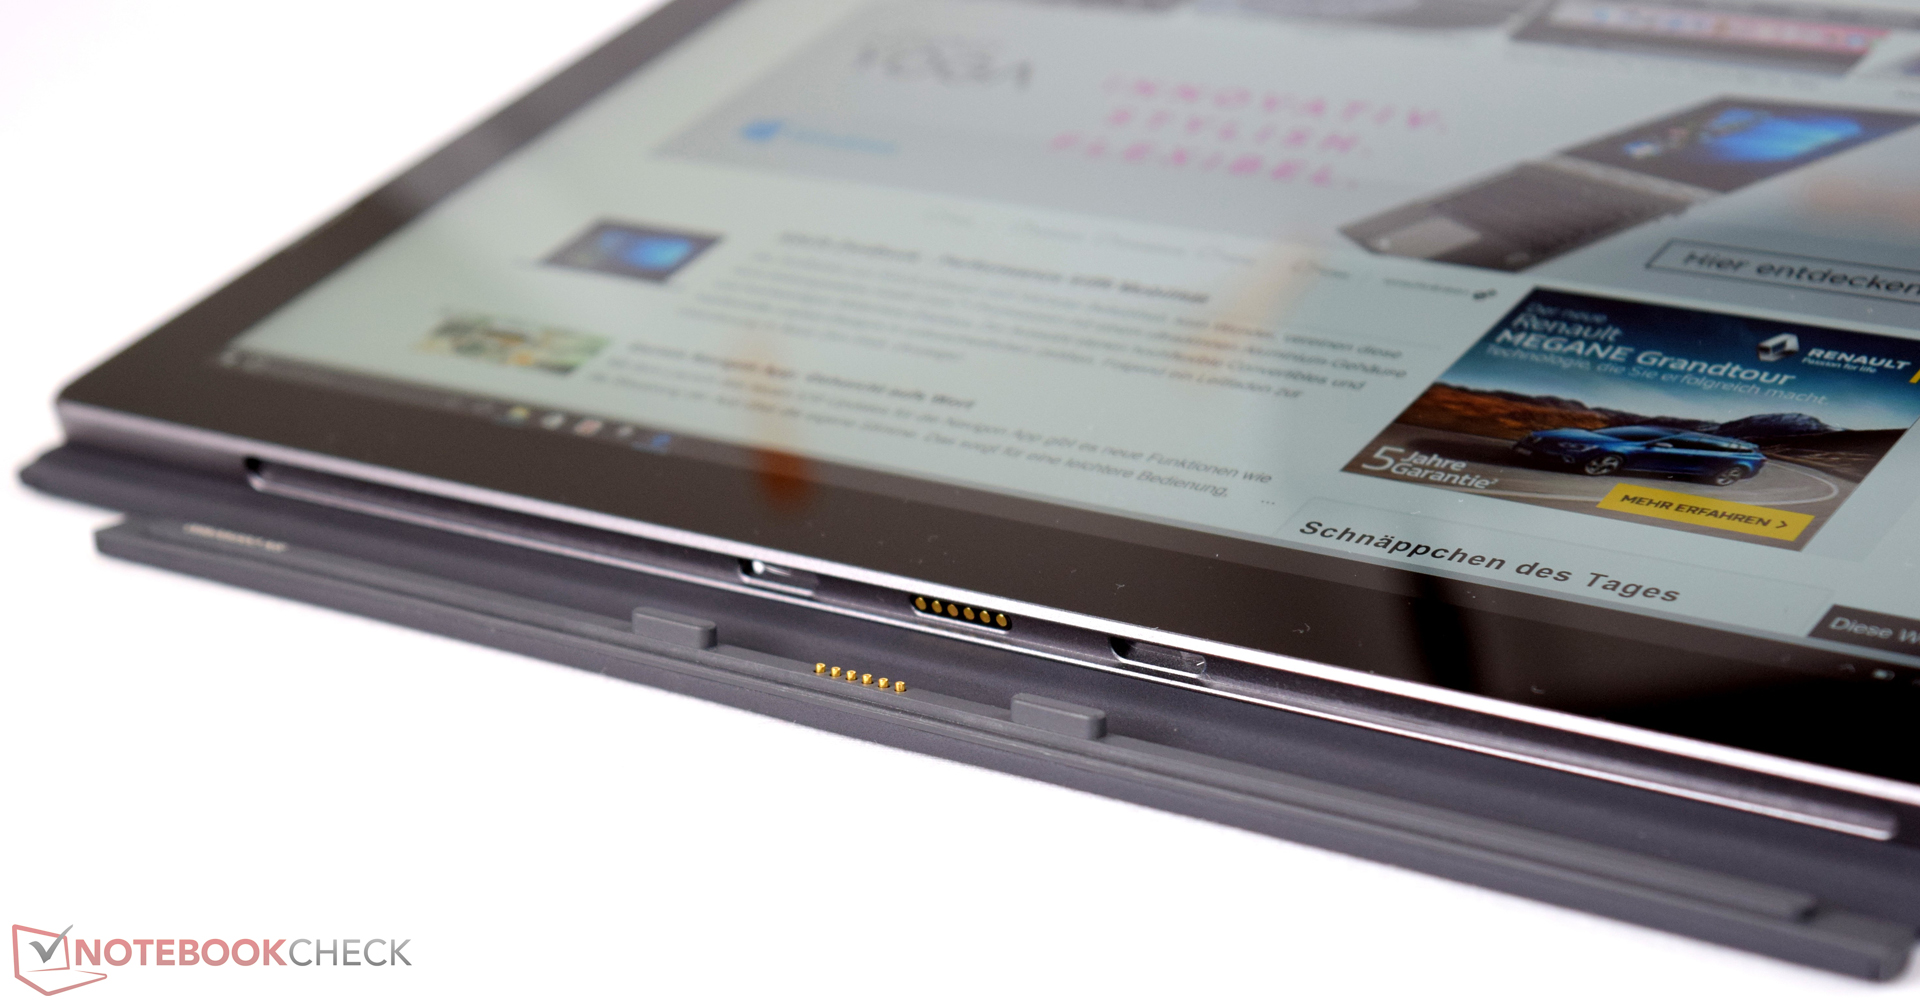
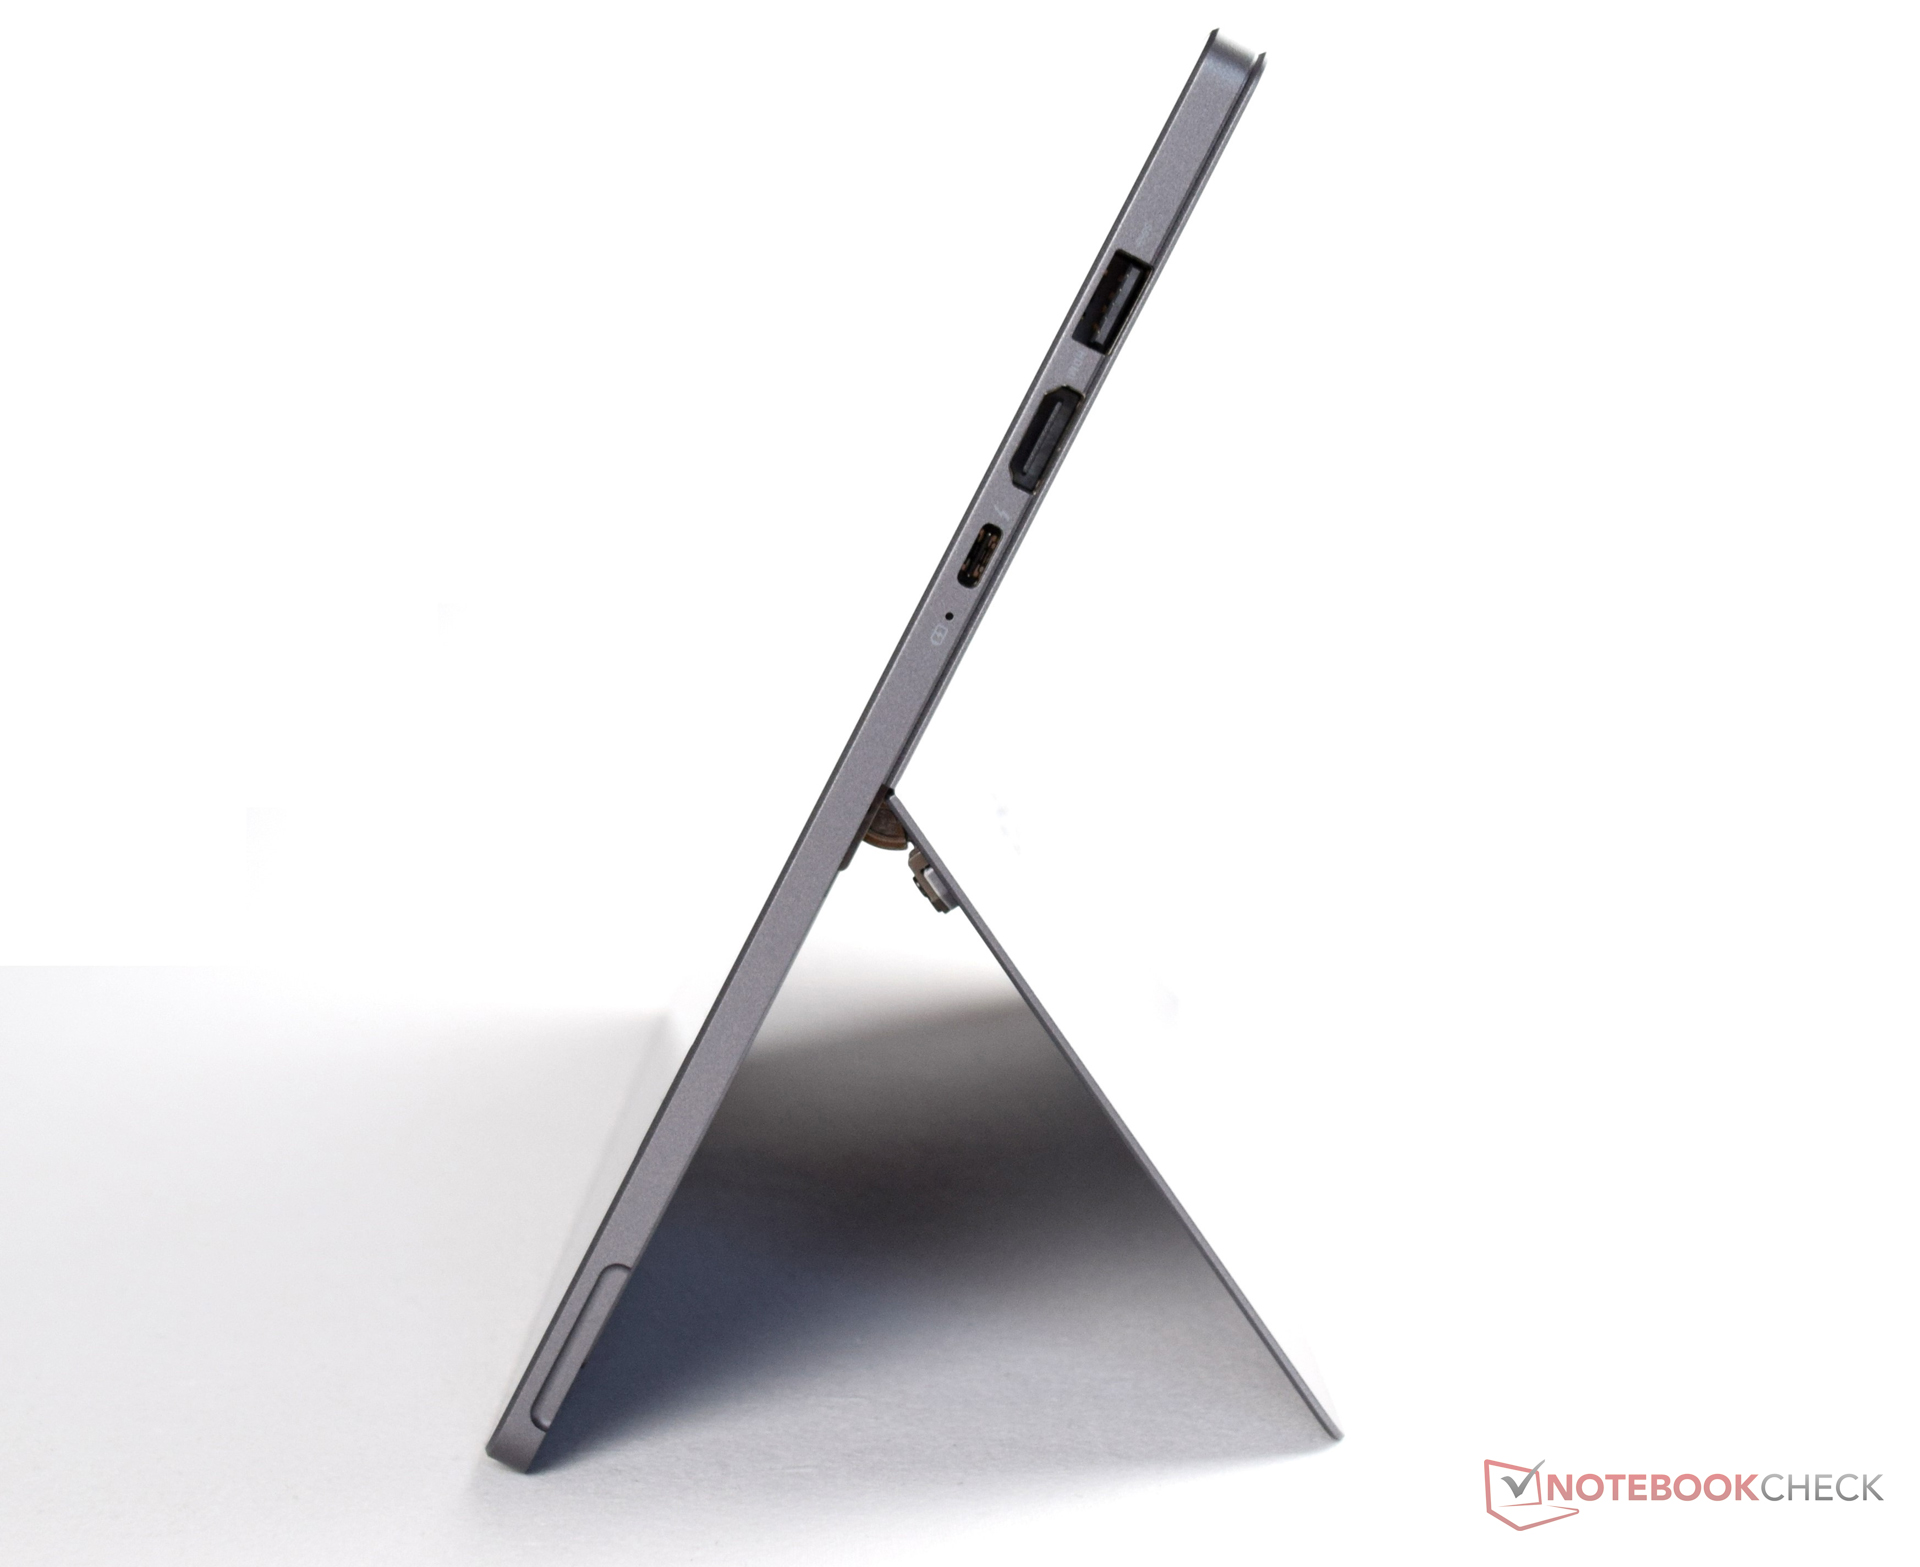
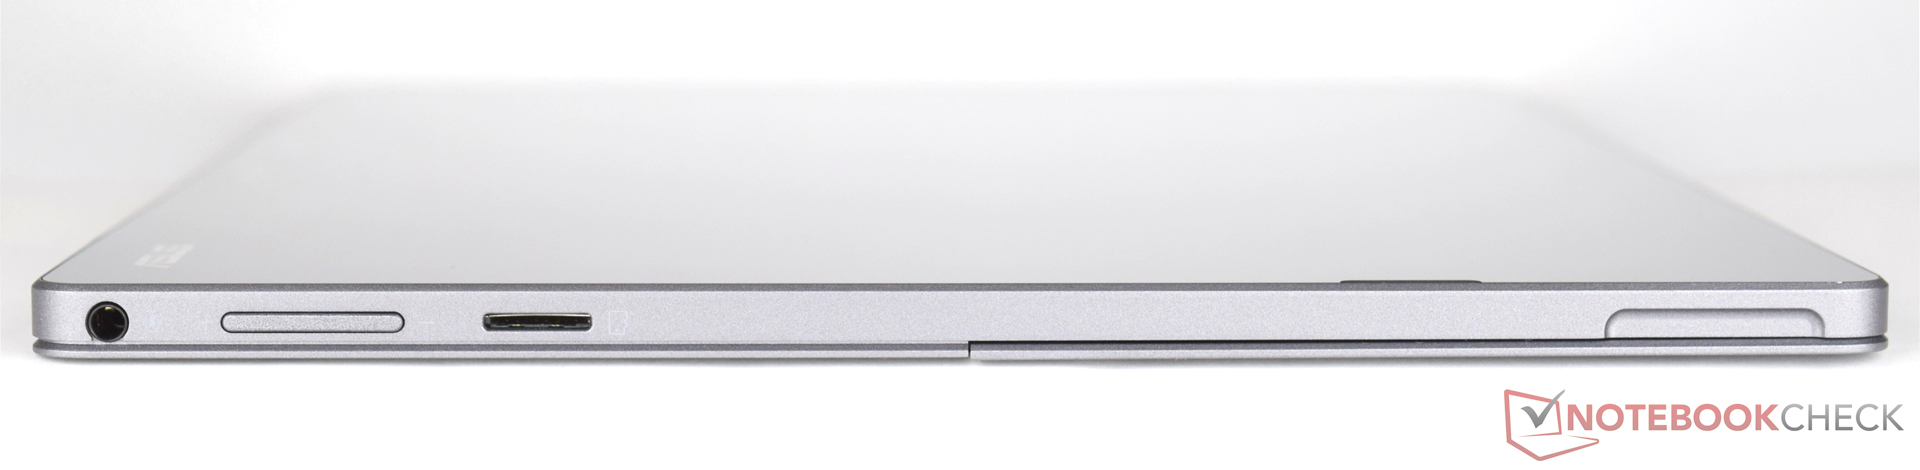
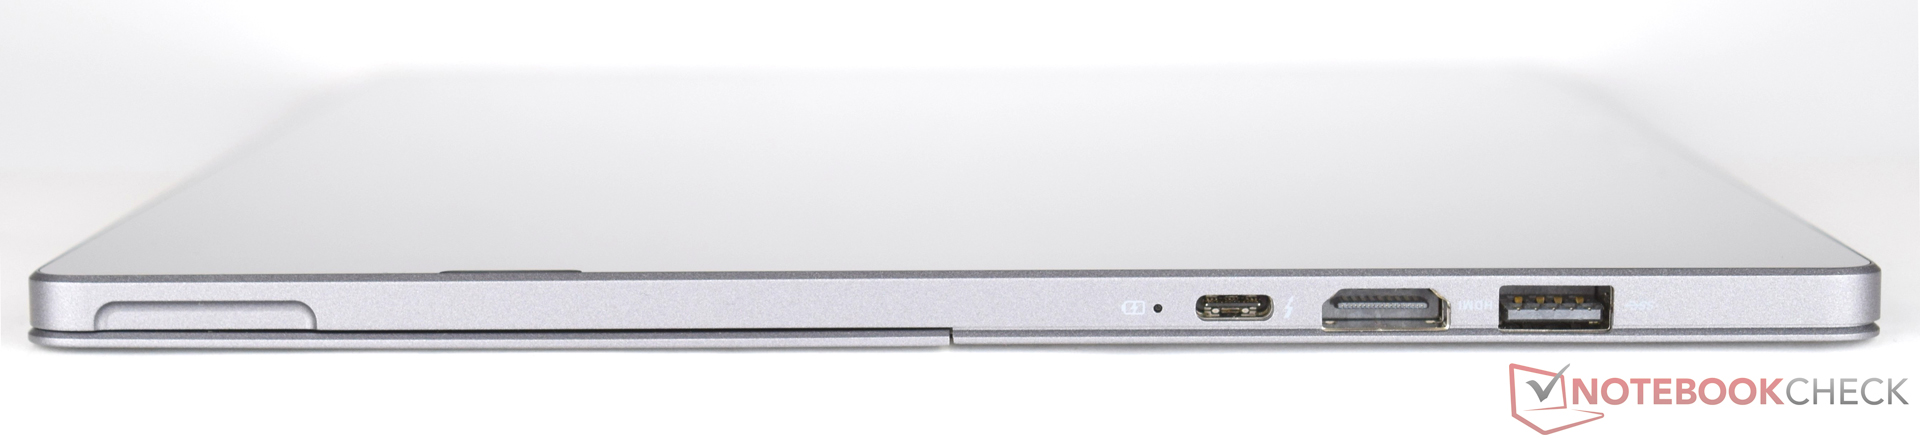
Egy gyorsabb processzor mindig jól jön. Viszont mi értelme van, ha a gyártó teljesen lefojtja? Az Intel Core i5 7Y54 passzív hűtéssel is jól működik, mégis hasonló teljesítményt nyújt, mint a teszt modellünkbe szerelt Intel Core i7-6500U. Az Asus átalakítható notebookjának csatlakozói hozzák az elvárhatót, de jobb volna, ha a jövőben két USB 3.1 portot (mindkettőt Thunderbolt 3 támogatással) szerelnének bele, hogy a felhasználók az egyiket töltésre, a másikat eszközök csatlakoztatására tudják használni.
Ez az eredeti értékelés rövidített változata. A teljes, angol nyelvű cikk itt olvasható.
Asus Transformer 3 Pro T303UA-GN050T
- 12/21/2016 v6 (old)
Sebastian Bade