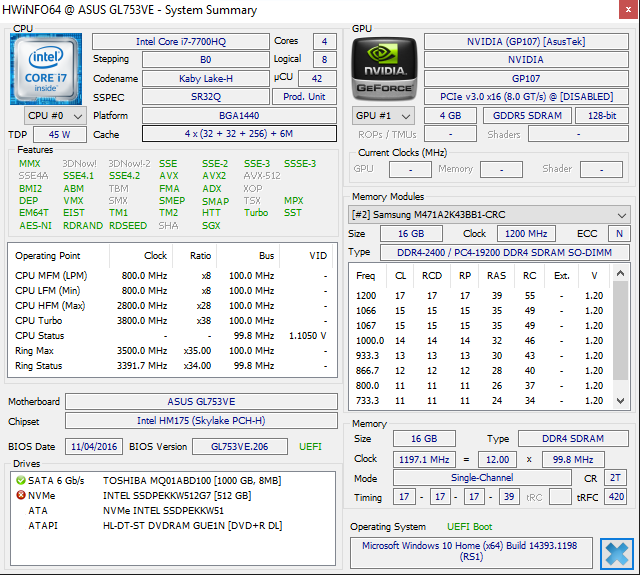
Asus ROG GL753VE (7700HQ, 1050 Ti) Laptop rövid értékelés
| SD Card Reader | |
| average JPG Copy Test (av. of 3 runs) | |
| Nexoc G739 | |
| Asus Strix GL753VD-GC045T | |
| Lenovo Legion Y520-15IKBN-80WK001KUS | |
| Asus GL753VE-DS74 | |
| MSI GE72 7RE-046 | |
| Acer Aspire Nitro BE VN7-793G-5811 | |
| Dell Inspiron 15 7000 7567 | |
| maximum AS SSD Seq Read Test (1GB) | |
| Asus GL753VE-DS74 | |
| Lenovo Legion Y520-15IKBN-80WK001KUS | |
| Nexoc G739 | |
| Asus Strix GL753VD-GC045T | |
| MSI GE72 7RE-046 | |
| Dell Inspiron 15 7000 7567 | |
| Acer Aspire Nitro BE VN7-793G-5811 | |
| |||||||||||||||||||||||||
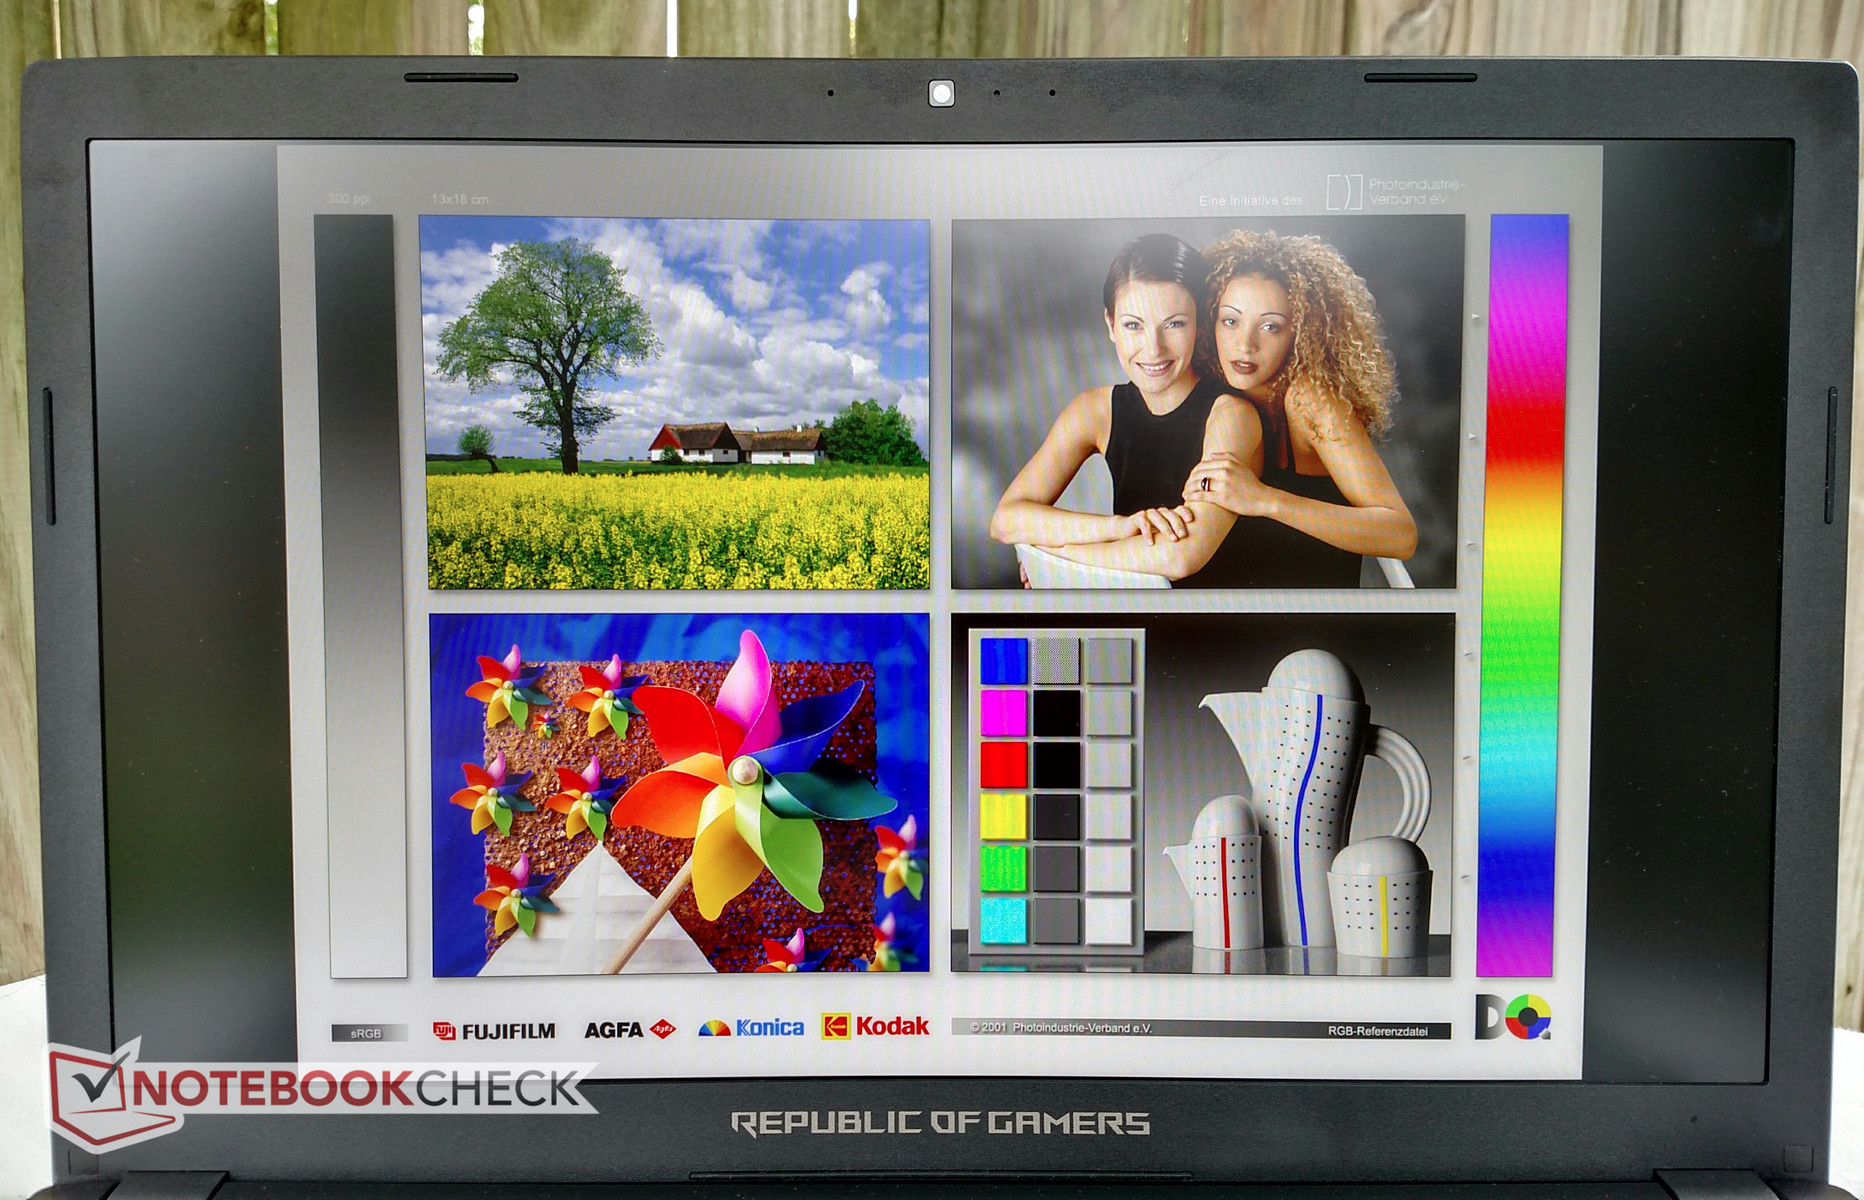
Fényerő megoszlás: 90 %
Centrumban: 366 cd/m²
Kontraszt: 1046:1 (Fekete: 0.35 cd/m²)
ΔE ColorChecker Calman: 4.4 | ∀{0.5-29.43 Ø4.73}
ΔE Greyscale Calman: 3 | ∀{0.09-98 Ø4.97}
86% sRGB (Argyll 1.6.3 3D)
56% AdobeRGB 1998 (Argyll 1.6.3 3D)
Gamma: 2.1
CCT: 6362 K
| Asus GL753VE-DS74 LG Philips LP173WF4-SPF3, IPS, 17.3", 1920x1080 | Asus Strix GL753VD-GC045T LP173WF4-SPF3, LED IPS, 17.3", 1920x1080 | Acer Aspire Nitro BE VN7-793G-5811 AU Optronics, IPS, 17.3", 1920x1080 | Nexoc G739 CMN1738, IPS, 17.3", 1920x1080 | MSI GE72 7RE-046 N173HHE-G32 (CMN1747), TN LED, 17.3", 1920x1080 | Dell Inspiron 15 7000 7567 AU Optronics AUO38ED B156HTN 28H80, TN, 15.6", 1920x1080 | Lenovo Legion Y520-15IKBN-80WK001KUS LP156WF6-SPK3, IPS, 15.6", 1920x1080 | |
|---|---|---|---|---|---|---|---|
| Display | |||||||
| Display P3 Coverage (%) | 67.1 | 63.1 | 66.7 | 90.7 | 36.42 | ||
| sRGB Coverage (%) | 84.8 | 86.5 | 91 | 99.9 | 54.9 | ||
| AdobeRGB 1998 Coverage (%) | 62 | 63.3 | 66.4 | 85.2 | 37.62 | ||
| Response Times | -12% | -15% | -26% | 42% | -32% | -64% | |
| Response Time Grey 50% / Grey 80% * (ms) | 36 ? | 33.2 ? 8% | 38 ? -6% | 45 ? -25% | 27 ? 25% | 36 ? -0% | 58.8 ? -63% |
| Response Time Black / White * (ms) | 22 ? | 28.8 ? -31% | 27 ? -23% | 28 ? -27% | 9 ? 59% | 36 ? -64% | 36 ? -64% |
| PWM Frequency (Hz) | 450 ? | 21550 ? | |||||
| Screen | -15% | -0% | 3% | -15% | -88% | -46% | |
| Brightness middle (cd/m²) | 366 | 349 -5% | 301 -18% | 312 -15% | 253 -31% | 246 -33% | 239 -35% |
| Brightness (cd/m²) | 348 | 337 -3% | 270 -22% | 304 -13% | 230 -34% | 235 -32% | 244 -30% |
| Brightness Distribution (%) | 90 | 91 1% | 79 -12% | 85 -6% | 86 -4% | 75 -17% | 88 -2% |
| Black Level * (cd/m²) | 0.35 | 0.58 -66% | 0.38 -9% | 0.23 34% | 0.24 31% | 0.55 -57% | 0.35 -0% |
| Contrast (:1) | 1046 | 602 -42% | 792 -24% | 1357 30% | 1054 1% | 447 -57% | 683 -35% |
| Colorchecker dE 2000 * | 4.4 | 4.5 -2% | 3.49 21% | 4.19 5% | 5.01 -14% | 10.97 -149% | 7.3 -66% |
| Colorchecker dE 2000 max. * | 9.7 | 10.2 -5% | 7.49 23% | 8.7 10% | 10.4 -7% | 24.7 -155% | |
| Greyscale dE 2000 * | 3 | 3.3 -10% | 1.88 37% | 3.72 -24% | 7.26 -142% | 14.25 -375% | 4.9 -63% |
| Gamma | 2.1 105% | 2.15 102% | 2.35 94% | 2.29 96% | 2.09 105% | 1.83 120% | 2.19 100% |
| CCT | 6362 102% | 6103 107% | 6587 99% | 7104 91% | 6329 103% | 11200 58% | 7332 89% |
| Color Space (Percent of AdobeRGB 1998) (%) | 56 | 55.7 -1% | 56 0% | 59 5% | 76 36% | 35 -37% | 35 -37% |
| Color Space (Percent of sRGB) (%) | 86 | 75.7 -12% | 86 0% | 91 6% | 100 16% | 55 -36% | 55 -36% |
| Teljes átlag (program / beállítások) | -14% /
-14% | -8% /
-3% | -12% /
-2% | 14% /
-5% | -60% /
-78% | -55% /
-49% |
* ... a kisebb jobb
Megjelenítési válaszidők
| ↔ Válaszidő Fekete-fehér | ||
|---|---|---|
| 22 ms ... emelkedés és süllyedés ↘ kombinálva | ↗ 12.4 ms emelkedés | 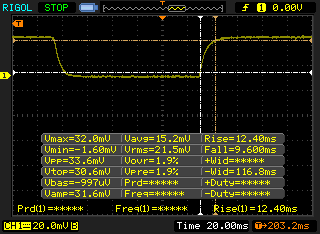 |
| ↘ 9.6 ms ősz | ||
| A képernyő jó reakciósebességet mutat tesztjeinkben, de túl lassú lehet a versenyképes játékosok számára. Összehasonlításképpen, az összes tesztelt eszköz 0.1 (minimum) és 240 (maximum) ms között mozog. » 48 % of all devices are better. Ez azt jelenti, hogy a mért válaszidő rosszabb, mint az összes vizsgált eszköz átlaga (19.9 ms). | ||
| ↔ Válaszidő 50% szürke és 80% szürke között | ||
| 36 ms ... emelkedés és süllyedés ↘ kombinálva | ↗ 18.4 ms emelkedés | 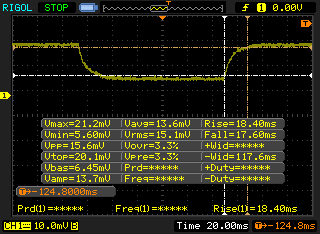 |
| ↘ 17.6 ms ősz | ||
| A képernyő lassú reakciósebességet mutat tesztjeinkben, és nem lesz kielégítő a játékosok számára. Összehasonlításképpen, az összes tesztelt eszköz 0.165 (minimum) és 636 (maximum) ms között mozog. » 50 % of all devices are better. Ez azt jelenti, hogy a mért válaszidő rosszabb, mint az összes vizsgált eszköz átlaga (31.1 ms). | ||
Képernyő villogása / PWM (impulzusszélesség-moduláció)
| Képernyő villogása / PWM nem érzékelhető | 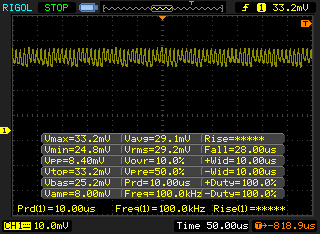 | ||
Összehasonlításképpen: az összes tesztelt eszköz 52 %-a nem használja a PWM-et a kijelző elsötétítésére. Ha PWM-et észleltek, akkor átlagosan 7798 (minimum: 5 - maximum: 343500) Hz-t mértek. | |||
| Cinebench R15 | |
| CPU Single 64Bit | |
| Aorus x3 Plus v7 | |
| Aorus X7 v6 AO-S107Q716-PL-005 | |
| Dell Inspiron 15 7000 7567 | |
| Asus GL753VE-DS74 | |
| Asus Strix GL753VD-GC045T | |
| MSI GT80 Titan SLI | |
| Acer Predator 17 G9-793-77LG | |
| Acer Aspire Nitro BE VN7-793G-5811 | |
| CPU Multi 64Bit | |
| Aorus x3 Plus v7 | |
| Aorus X7 v6 AO-S107Q716-PL-005 | |
| Asus Strix GL753VD-GC045T | |
| Asus GL753VE-DS74 | |
| MSI GT80 Titan SLI | |
| Dell Inspiron 15 7000 7567 | |
| Acer Predator 17 G9-793-77LG | |
| Acer Aspire Nitro BE VN7-793G-5811 | |
| Cinebench R11.5 | |
| CPU Single 64Bit | |
| Aorus x3 Plus v7 | |
| Asus Strix GL753VD-GC045T | |
| MSI GT80 Titan SLI | |
| Asus GL753VE-DS74 | |
| CPU Multi 64Bit | |
| Aorus x3 Plus v7 | |
| Asus Strix GL753VD-GC045T | |
| Asus GL753VE-DS74 | |
| MSI GT80 Titan SLI | |
| Cinebench R10 | |
| Rendering Multiple CPUs 32Bit | |
| Aorus x3 Plus v7 | |
| Asus GL753VE-DS74 | |
| MSI GT80 Titan SLI | |
| Acer Aspire Nitro BE VN7-793G-5811 | |
| Rendering Single 32Bit | |
| Aorus x3 Plus v7 | |
| Asus GL753VE-DS74 | |
| MSI GT80 Titan SLI | |
| Acer Aspire Nitro BE VN7-793G-5811 | |
| wPrime 2.10 - 1024m | |
| Aorus x3 Plus v7 | |
| Asus GL753VE-DS74 | |
| Aorus X7 v6 AO-S107Q716-PL-005 | |
* ... a kisebb jobb
| PCMark 8 | |
| Home Score Accelerated v2 | |
| Nexoc G739 | |
| Asus Strix GL753VD-GC045T | |
| Dell Inspiron 15 7000 7567 | |
| Acer Aspire Nitro BE VN7-793G-5811 | |
| Asus GL753VE-DS74 | |
| Work Score Accelerated v2 | |
| Nexoc G739 | |
| Asus GL753VE-DS74 | |
| Dell Inspiron 15 7000 7567 | |
| Acer Aspire Nitro BE VN7-793G-5811 | |
| Creative Score Accelerated v2 | |
| Nexoc G739 | |
| Asus GL753VE-DS74 | |
| Acer Aspire Nitro BE VN7-793G-5811 | |
| PCMark 8 Home Score Accelerated v2 | 3570 pontok | |
| PCMark 8 Creative Score Accelerated v2 | 4243 pontok | |
| PCMark 8 Work Score Accelerated v2 | 5171 pontok | |
Segítség | ||
| Asus GL753VE-DS74 Intel SSD 600p SSDPEKKW512G7 | Asus Strix GL753VD-GC045T Micron SSD 1100 (MTFDDAV256TBN) | Acer Aspire Nitro BE VN7-793G-5811 Seagate Mobile HDD 1TB ST1000LM035 | Nexoc G739 Samsung PM961 MZVLW256HEHP | MSI GE72 7RE-046 Toshiba HG6 THNSNJ256G8NY | Dell Inspiron 15 7000 7567 Intel SSDSCKKF256H6 | Lenovo Legion Y520-15IKBN-80WK001KUS Samsung PM961 MZVLW256HEHP | |
|---|---|---|---|---|---|---|---|
| CrystalDiskMark 3.0 | 27% | -91% | 221% | 64% | 37% | 178% | |
| Read Seq (MB/s) | 1049 | 475.7 -55% | 117.6 -89% | 1666 59% | 540 -49% | 485.8 -54% | 2170 107% |
| Write Seq (MB/s) | 584 | 419.1 -28% | 109.1 -81% | 1192 104% | 495.7 -15% | 422.8 -28% | 1202 106% |
| Read 512 (MB/s) | 583 | 336.1 -42% | 39.93 -93% | 857 47% | 455.1 -22% | 338.9 -42% | 786 35% |
| Write 512 (MB/s) | 458 | 346.6 -24% | 98.6 -78% | 827 81% | 481.4 5% | 304 -34% | 822 79% |
| Read 4k (MB/s) | 14.1 | 24.7 75% | 0.435 -97% | 60.7 330% | 22.7 61% | 27.11 92% | 58.9 318% |
| Write 4k (MB/s) | 108 | 76.8 -29% | 3.152 -97% | 154.5 43% | 112.9 5% | 85.4 -21% | 146.4 36% |
| Read 4k QD32 (MB/s) | 57.8 | 247.6 328% | 1.008 -98% | 636 1000% | 372.5 544% | 279.6 384% | 457.7 692% |
| Write 4k QD32 (MB/s) | 264 | 234.9 -11% | 4.705 -98% | 544 106% | 212.9 -19% | 255.1 -3% | 392.9 49% |

| 3DMark | |
| 1280x720 Cloud Gate Standard Graphics | |
| Acer Predator 17 G9-791-75PV | |
| Lenovo Legion Y520-15IKBN-80WK001KUS | |
| Dell Inspiron 15 7000 7567 | |
| Asus GL753VE-DS74 | |
| Asus Strix GL753VD-GC045T | |
| HP Omen 17-w010ng | |
| HP Pavilion 17 FHD V3A33AV | |
| Acer Aspire V17 Nitro BE VN7-793G-706L | |
| 1920x1080 Fire Strike Graphics | |
| Acer Aspire V17 Nitro BE VN7-793G-706L | |
| Lenovo Legion Y520-15IKBN-80WK001KUS | |
| Dell Inspiron 15 7000 7567 | |
| Acer Predator 17 G9-791-75PV | |
| Asus GL753VE-DS74 | |
| HP Omen 17-w010ng | |
| Asus Strix GL753VD-GC045T | |
| Asus Strix GL753VD-GC045T | |
| HP Pavilion 17 FHD V3A33AV | |
| 1920x1080 Ice Storm Extreme Graphics | |
| HP Pavilion 17 FHD V3A33AV | |
| Lenovo Legion Y520-15IKBN-80WK001KUS | |
| Asus GL753VE-DS74 | |
| 3DMark Ice Storm Standard Score | 62164 pontok | |
| 3DMark Cloud Gate Standard Score | 20619 pontok | |
| 3DMark Fire Strike Score | 6584 pontok | |
| 3DMark Fire Strike Extreme Score | 3495 pontok | |
Segítség | ||
| BioShock Infinite - 1920x1080 Ultra Preset, DX11 (DDOF) (érték szerinti rendezés) | |
| Asus GL753VE-DS74 | |
| Dell Inspiron 15 7000 7567 | |
| Lenovo Legion Y520-15IKBN-80WK001KUS | |
| HP Pavilion 17 FHD V3A33AV | |
| Metro: Last Light - 1920x1080 Very High (DX11) AF:16x (érték szerinti rendezés) | |
| Asus GL753VE-DS74 | |
| Asus Strix GL753VD-GC045T | |
| HP Pavilion 17 FHD V3A33AV | |
| Thief - 1920x1080 Very High Preset AA:FXAA & High SS AF:8x (érték szerinti rendezés) | |
| Asus GL753VE-DS74 | |
| HP Pavilion 17 FHD V3A33AV | |
| The Witcher 3 - 1920x1080 Ultra Graphics & Postprocessing (HBAO+) (érték szerinti rendezés) | |
| Asus GL753VE-DS74 | |
| Asus Strix GL753VD-GC045T | |
| Lenovo Legion Y520-15IKBN-80WK001KUS | |
| Acer Aspire V17 Nitro BE VN7-793G-706L | |
| Fallout 4 - 1920x1080 Ultra Preset AA:T AF:16x (érték szerinti rendezés) | |
| Asus GL753VE-DS74 | |
| Asus Strix GL753VD-GC045T | |
| Acer Aspire V17 Nitro BE VN7-793G-706L | |
| HP Pavilion 17 FHD V3A33AV | |
| Rise of the Tomb Raider - 1920x1080 Very High Preset AA:FX AF:16x (érték szerinti rendezés) | |
| Asus GL753VE-DS74 | |
| Asus Strix GL753VD-GC045T | |
| Dell Inspiron 15 7000 7567 | |
| Lenovo Legion Y520-15IKBN-80WK001KUS | |
| Acer Aspire V17 Nitro BE VN7-793G-706L | |
| HP Pavilion 17 FHD V3A33AV | |
| Ashes of the Singularity - 1920x1080 high (érték szerinti rendezés) | |
| Asus GL753VE-DS74 | |
| Asus Strix GL753VD-GC045T | |
| Doom - 1920x1080 Ultra Preset AA:SM (érték szerinti rendezés) | |
| Asus GL753VE-DS74 | |
| Asus Strix GL753VD-GC045T | |
| Dell Inspiron 15 7000 7567 | |
| HP Omen 17-w010ng | |
| Mafia 3 - 1920x1080 High Preset (érték szerinti rendezés) | |
| Asus GL753VE-DS74 | |
| Asus Strix GL753VD-GC045T | |
| Dell Inspiron 15 7000 7567 | |
| alacsony | közepes | magas | ultra | |
|---|---|---|---|---|
| BioShock Infinite (2013) | 97 | |||
| Metro: Last Light (2013) | 59 | |||
| Thief (2014) | 50 | |||
| The Witcher 3 (2015) | 32 | |||
| Fallout 4 (2015) | 44 | |||
| Rise of the Tomb Raider (2016) | 37 | |||
| Ashes of the Singularity (2016) | 36 | |||
| Doom (2016) | 62 | |||
| Mafia 3 (2016) | 31 |
(+) A felső oldalon a maximális hőmérséklet 35.8 °C / 96 F, összehasonlítva a 40.4 °C / 105 F átlagával , 21.2 és 68.8 °C között a Gaming osztálynál.
(+) Az alsó maximum 36.4 °C / 98 F-ig melegszik fel, összehasonlítva a 43.2 °C / 110 F átlagával
(+) Üresjáratban a felső oldal átlagos hőmérséklete 21.5 °C / 71 F, összehasonlítva a 33.9 °C / ### eszközátlaggal class_avg_f### F.
(+) A The Witcher 3 játék során a felső oldal átlaghőmérséklete 28 °C / 82 F, összehasonlítva a 33.9 °C / ## eszközátlaggal #class_avg_f### F.
(+) A csuklótámasz és az érintőpad hűvösebb, mint a bőr hőmérséklete, maximum 27.2 °C / 81 F, ezért hűvös tapintású.
(±) A hasonló eszközök csuklótámasz területének átlagos hőmérséklete 28.8 °C / 83.8 F volt (+1.6 °C / 2.8 F).
Zajszint
| Üresjárat |
| 33.3 / 33.3 / 33.4 dB(A) |
| Terhelés |
| 42.6 / 46.8 dB(A) |
 | ||
30 dB csendes 40 dB(A) hallható 50 dB(A) hangos |
||
min: | ||
| Asus GL753VE-DS74 GeForce GTX 1050 Ti Mobile, i7-7700HQ, Intel SSD 600p SSDPEKKW512G7 | Asus Strix GL753VD-GC045T GeForce GTX 1050 Mobile, i7-7700HQ, Micron SSD 1100 (MTFDDAV256TBN) | Acer Aspire Nitro BE VN7-793G-5811 GeForce GTX 1050 Ti Mobile, i5-7300HQ, Seagate Mobile HDD 1TB ST1000LM035 | Nexoc G739 GeForce GTX 1050 Ti Mobile, i7-7700HQ, Samsung PM961 MZVLW256HEHP | MSI GE72 7RE-046 GeForce GTX 1050 Ti Mobile, i7-7700HQ, Toshiba HG6 THNSNJ256G8NY | Dell Inspiron 15 7000 7567 GeForce GTX 1050 Ti Mobile, i7-7700HQ, Intel SSDSCKKF256H6 | Lenovo Legion Y520-15IKBN-80WK001KUS GeForce GTX 1050 Ti Mobile, i7-7700HQ, Samsung PM961 MZVLW256HEHP | |
|---|---|---|---|---|---|---|---|
| Noise | -3% | 10% | -3% | -3% | 1% | 8% | |
| off / környezet * (dB) | 29.1 | 28.8 1% | 29.7 -2% | 30 -3% | 30 -3% | 30.3 -4% | 27.7 5% |
| Idle Minimum * (dB) | 33.3 | 33.9 -2% | 30.2 9% | 31 7% | 34 -2% | 30.9 7% | 30.5 8% |
| Idle Average * (dB) | 33.3 | 33.9 -2% | 30.2 9% | 32 4% | 35 -5% | 30.9 7% | 30.5 8% |
| Idle Maximum * (dB) | 33.4 | 37.8 -13% | 30.6 8% | 38 -14% | 36 -8% | 31 7% | 30.6 8% |
| Load Average * (dB) | 42.6 | 42.7 -0% | 33.8 21% | 44 -3% | 41 4% | 46.5 -9% | 40 6% |
| Witcher 3 ultra * (dB) | 46.8 | 39.5 16% | 40 15% | ||||
| Load Maximum * (dB) | 46.8 | 47.4 -1% | 42.6 9% | 50 -7% | 49 -5% | 46.8 -0% | 42.6 9% |
* ... a kisebb jobb
Acer Aspire Nitro BE VN7-793G-5811 hangelemzés
(±) | a hangszóró hangereje átlagos, de jó (72 dB)
Basszus 100 - 315 Hz
(±) | csökkentett basszus – átlagosan 6.9%-kal alacsonyabb, mint a medián
(+) | a basszus lineáris (5.5% delta az előző frekvenciához)
Közepes 400-2000 Hz
(+) | kiegyensúlyozott középpontok – csak 4.5% választja el a mediántól
(+) | a középpontok lineárisak (6.3% delta az előző frekvenciához)
Maximum 2-16 kHz
(+) | kiegyensúlyozott csúcsok – csak 1.1% választja el a mediántól
(+) | a csúcsok lineárisak (3.5% delta az előző frekvenciához képest)
Összességében 100 - 16.000 Hz
(+) | általános hangzás lineáris (11.5% eltérés a mediánhoz képest)
Ugyanazon osztályhoz képest
» 18%Ebben az osztályban az összes tesztelt eszköz %-a jobb volt, 4% hasonló, 78%-kal rosszabb
» A legjobb delta értéke 5%, az átlag 17%, a legrosszabb 45% volt
Az összes tesztelt eszközzel összehasonlítva
» 8% az összes tesztelt eszköz jobb volt, 2% hasonló, 90%-kal rosszabb
» A legjobb delta értéke 4%, az átlag 24%, a legrosszabb 134% volt
MSI GE72 7RE-046 hangelemzés
(+) | a hangszórók viszonylag hangosan tudnak játszani (91 dB)
Basszus 100 - 315 Hz
(-) | szinte nincs basszus – átlagosan 17.2%-kal alacsonyabb a mediánnál
(±) | a basszus linearitása átlagos (9.2% delta az előző frekvenciához)
Közepes 400-2000 Hz
(+) | kiegyensúlyozott középpontok – csak 3.3% választja el a mediántól
(+) | a középpontok lineárisak (4.7% delta az előző frekvenciához)
Maximum 2-16 kHz
(+) | kiegyensúlyozott csúcsok – csak 3.3% választja el a mediántól
(+) | a csúcsok lineárisak (4% delta az előző frekvenciához képest)
Összességében 100 - 16.000 Hz
(+) | általános hangzás lineáris (13.7% eltérés a mediánhoz képest)
Ugyanazon osztályhoz képest
» 21%Ebben az osztályban az összes tesztelt eszköz %-a jobb volt, 7% hasonló, 72%-kal rosszabb
» A legjobb delta értéke 6%, az átlag 18%, a legrosszabb 132% volt
Az összes tesztelt eszközzel összehasonlítva
» 15% az összes tesztelt eszköz jobb volt, 4% hasonló, 81%-kal rosszabb
» A legjobb delta értéke 4%, az átlag 24%, a legrosszabb 134% volt
| Kikapcsolt állapot / Készenlét | |
| Üresjárat | |
| Terhelés |
|
Kulcs:
min: | |
| Asus GL753VE-DS74 i7-7700HQ, GeForce GTX 1050 Ti Mobile, Intel SSD 600p SSDPEKKW512G7, IPS, 1920x1080, 17.3" | Asus Strix GL753VD-GC045T i7-7700HQ, GeForce GTX 1050 Mobile, Micron SSD 1100 (MTFDDAV256TBN), LED IPS, 1920x1080, 17.3" | Acer Aspire Nitro BE VN7-793G-5811 i5-7300HQ, GeForce GTX 1050 Ti Mobile, Seagate Mobile HDD 1TB ST1000LM035, IPS, 1920x1080, 17.3" | Nexoc G739 i7-7700HQ, GeForce GTX 1050 Ti Mobile, Samsung PM961 MZVLW256HEHP, IPS, 1920x1080, 17.3" | MSI GE72 7RE-046 i7-7700HQ, GeForce GTX 1050 Ti Mobile, Toshiba HG6 THNSNJ256G8NY, TN LED, 1920x1080, 17.3" | Dell Inspiron 15 7000 7567 i7-7700HQ, GeForce GTX 1050 Ti Mobile, Intel SSDSCKKF256H6, TN, 1920x1080, 15.6" | Lenovo Legion Y520-15IKBN-80WK001KUS i7-7700HQ, GeForce GTX 1050 Ti Mobile, Samsung PM961 MZVLW256HEHP, IPS, 1920x1080, 15.6" | |
|---|---|---|---|---|---|---|---|
| Power Consumption | -5% | -10% | -30% | -58% | 21% | 4% | |
| Idle Minimum * (Watt) | 7.5 | 6.2 17% | 8.7 -16% | 7 7% | 14 -87% | 4.4 41% | 8.5 -13% |
| Idle Average * (Watt) | 11.3 | 12.2 -8% | 12.4 -10% | 14 -24% | 20 -77% | 6.8 40% | 9.1 19% |
| Idle Maximum * (Watt) | 11.8 | 14.8 -25% | 15.4 -31% | 23 -95% | 25 -112% | 8.3 30% | 9.7 18% |
| Load Average * (Watt) | 82.1 | 84.9 -3% | 73 11% | 82 -0% | 82 -0% | 81 1% | 79.9 3% |
| Witcher 3 ultra * (Watt) | 96.3 | 98 -2% | 97.7 -1% | ||||
| Load Maximum * (Watt) | 116.6 | 120.7 -4% | 130 -11% | 163 -40% | 135 -16% | 127 -9% | 121.5 -4% |
* ... a kisebb jobb
| Asus GL753VE-DS74 i7-7700HQ, GeForce GTX 1050 Ti Mobile, 48 Wh | Asus Strix GL753VD-GC045T i7-7700HQ, GeForce GTX 1050 Mobile, 48 Wh | Acer Aspire Nitro BE VN7-793G-5811 i5-7300HQ, GeForce GTX 1050 Ti Mobile, 52.5 Wh | Nexoc G739 i7-7700HQ, GeForce GTX 1050 Ti Mobile, 62 Wh | MSI GE72 7RE-046 i7-7700HQ, GeForce GTX 1050 Ti Mobile, 51.4 Wh | Dell Inspiron 15 7000 7567 i7-7700HQ, GeForce GTX 1050 Ti Mobile, 74 Wh | Lenovo Legion Y520-15IKBN-80WK001KUS i7-7700HQ, GeForce GTX 1050 Ti Mobile, 45 Wh | |
|---|---|---|---|---|---|---|---|
| Akkumulátor üzemidő | 4% | 18% | 68% | -21% | 122% | 0% | |
| Reader / Idle (h) | 8.7 | 8.6 -1% | 10.2 17% | 19.6 125% | 8.5 -2% | ||
| WiFi v1.3 (h) | 3.9 | 4.4 13% | 4.6 18% | 4.8 23% | 3.1 -21% | 10.4 167% | 4 3% |
| Load (h) | 0.8 | 0.8 0% | 2.1 163% | 1.4 75% | 0.8 0% |
Pro
Kontra
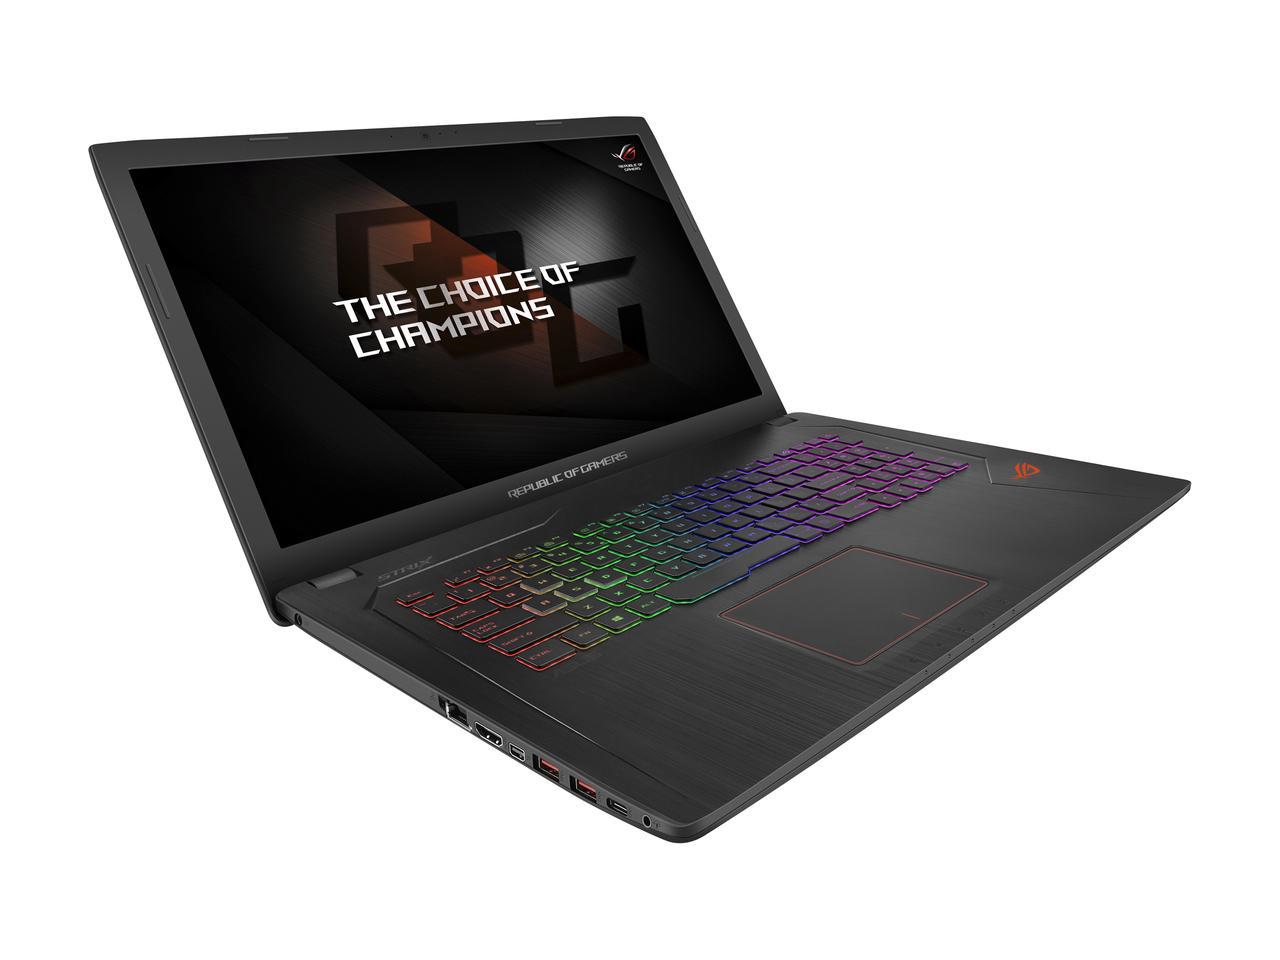

Végül is mit tudunk elmondani a GL753VE-ről? Az Asus nagyon kiegyensúlyozott notebookot alkotott, csúcsra járatva az "ezermester" stílust. A többi ROG közül is kiemeli pár dolog: a GTX 1050 Ti simán kezeli a játékokat 1080p felbontásban, miközben nem fogyaszt túl sokat, és nem is melegszik túl, a hő- és zajmenedzsment remek, és a kijelző képe gyönyörű.
Azért vannak hibái is. A CPU nem képes teljes potenciálját nyújtani terhelés alatt, ami egyeseket elriaszthat. Ugyan tudjuk, hogy a hő- és zajszint érdekében volt szükség erre, mégis visszafogja a gépet. A GL753VD pocsék csatlakozóelhelyezése erre a gépre is átjutott. A legnagyobb hibája viszont alighanem az ára. 1400 dollár a tesztelt, és 1300 az alap modellért elég nehezen nyelhető le. Hasonló teljesítményű gépeket lehet ennél jóval olcsóbban is kapni.
A Dell Inspiron 7000 és a Lenovo Legion Y520 erős versenytársai. Míg kisebb, és egyszerűbb gépek, ár/érték arányukat nehezen lehet megverni. Az áruk leesett, ráadásul rendszeresen kerülnek további akciókba.
Magasabb áráért az Asus GL753VE néhány nagyon remek dolgot kínál. A kijelző világos és gyönyörű, a billentyűzet kiváló (és RGB-megvilágított!), és a gép összességében is jól kiegyensúlyozott. Azok, akiknek viszont kisebb a költségvetésük, találhatnak sokkal olcsóbban ilyen (vagy jobb) játékteljesítményű notebookot.
Azok, akik néhány apróságot nem sajnálnak feláldozni, nem az Asus GL753VE-t ajánljuk, de azok, akik valamivel többet is kiadnak egy kerekebb egészért, jól járnak ezzel a notebookkal.
Ez az eredeti értékelés rövidített változata. A teljes, angol nyelvű cikk itt olvasható.
Asus GL753VE-DS74
- 05/29/2017 v6 (old)
Sam Medley
Price comparison
