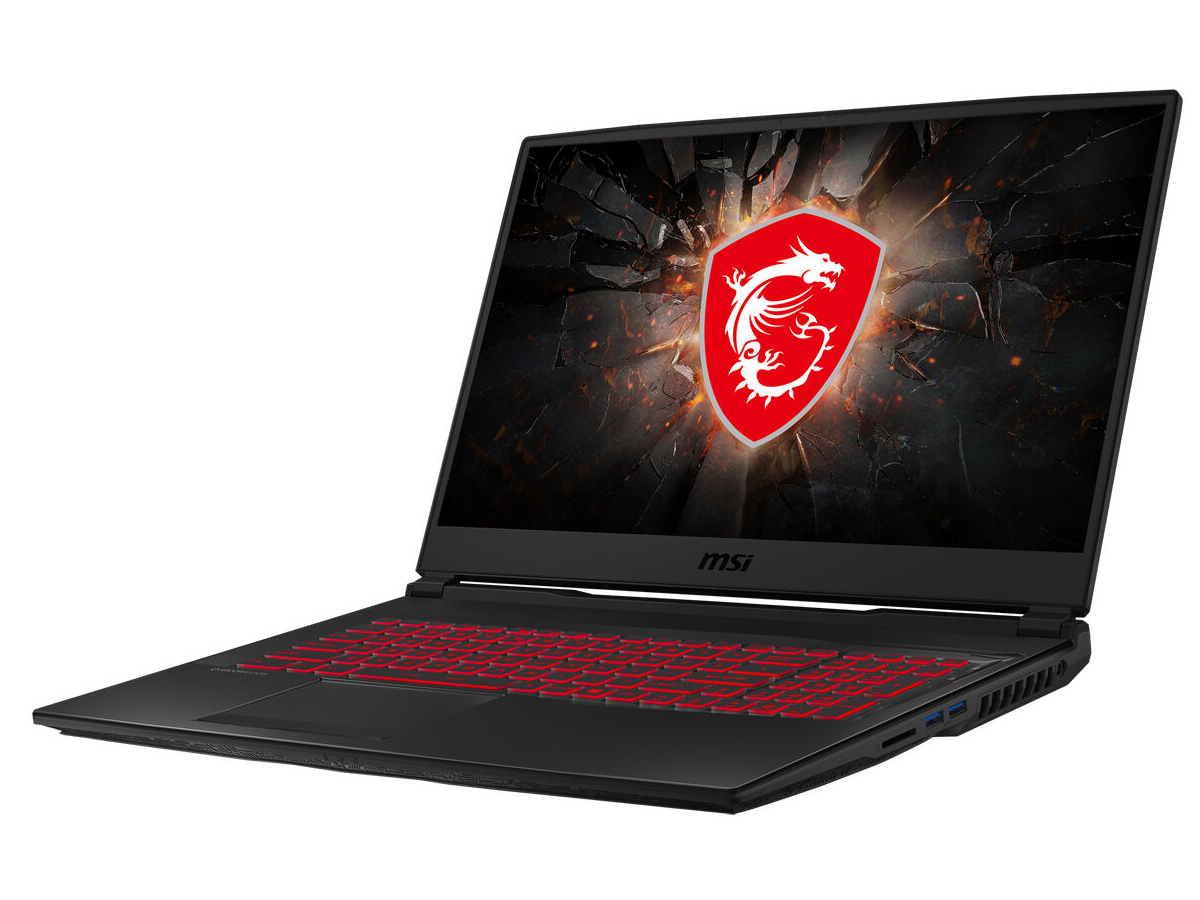
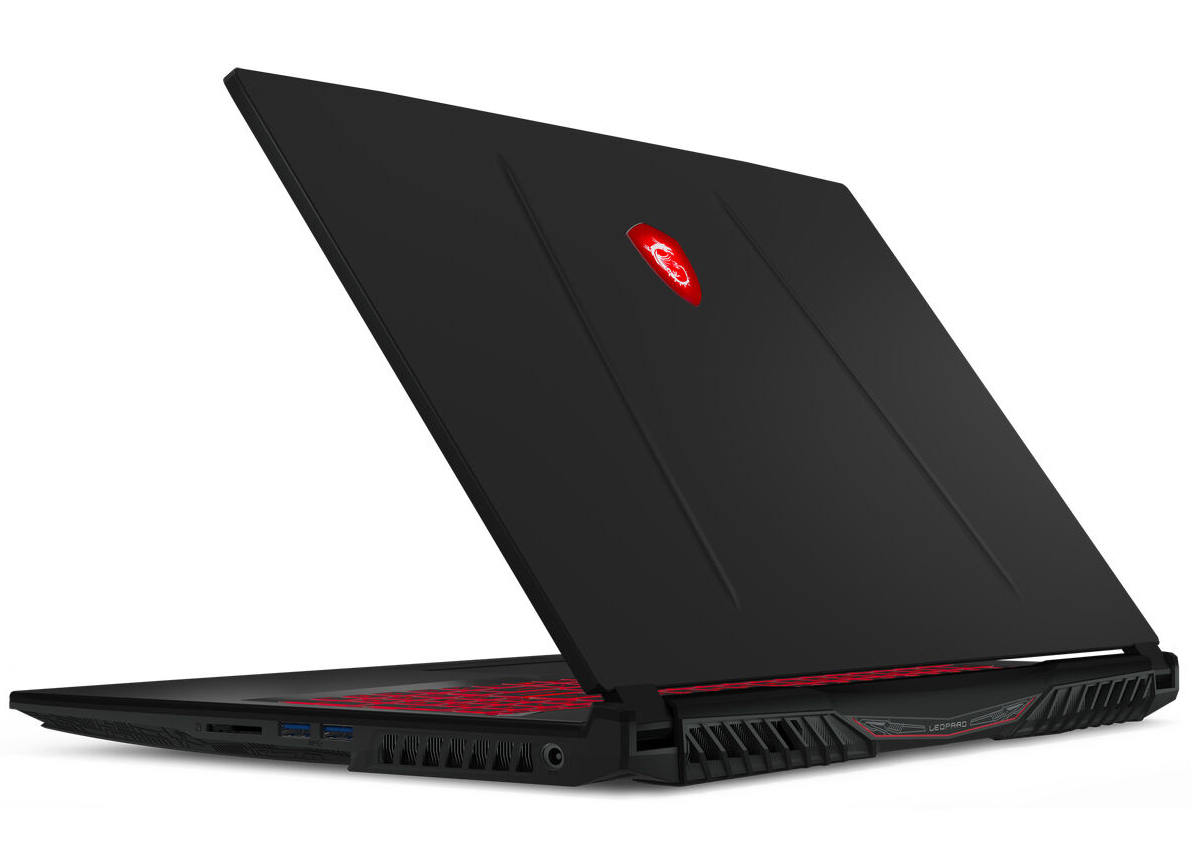
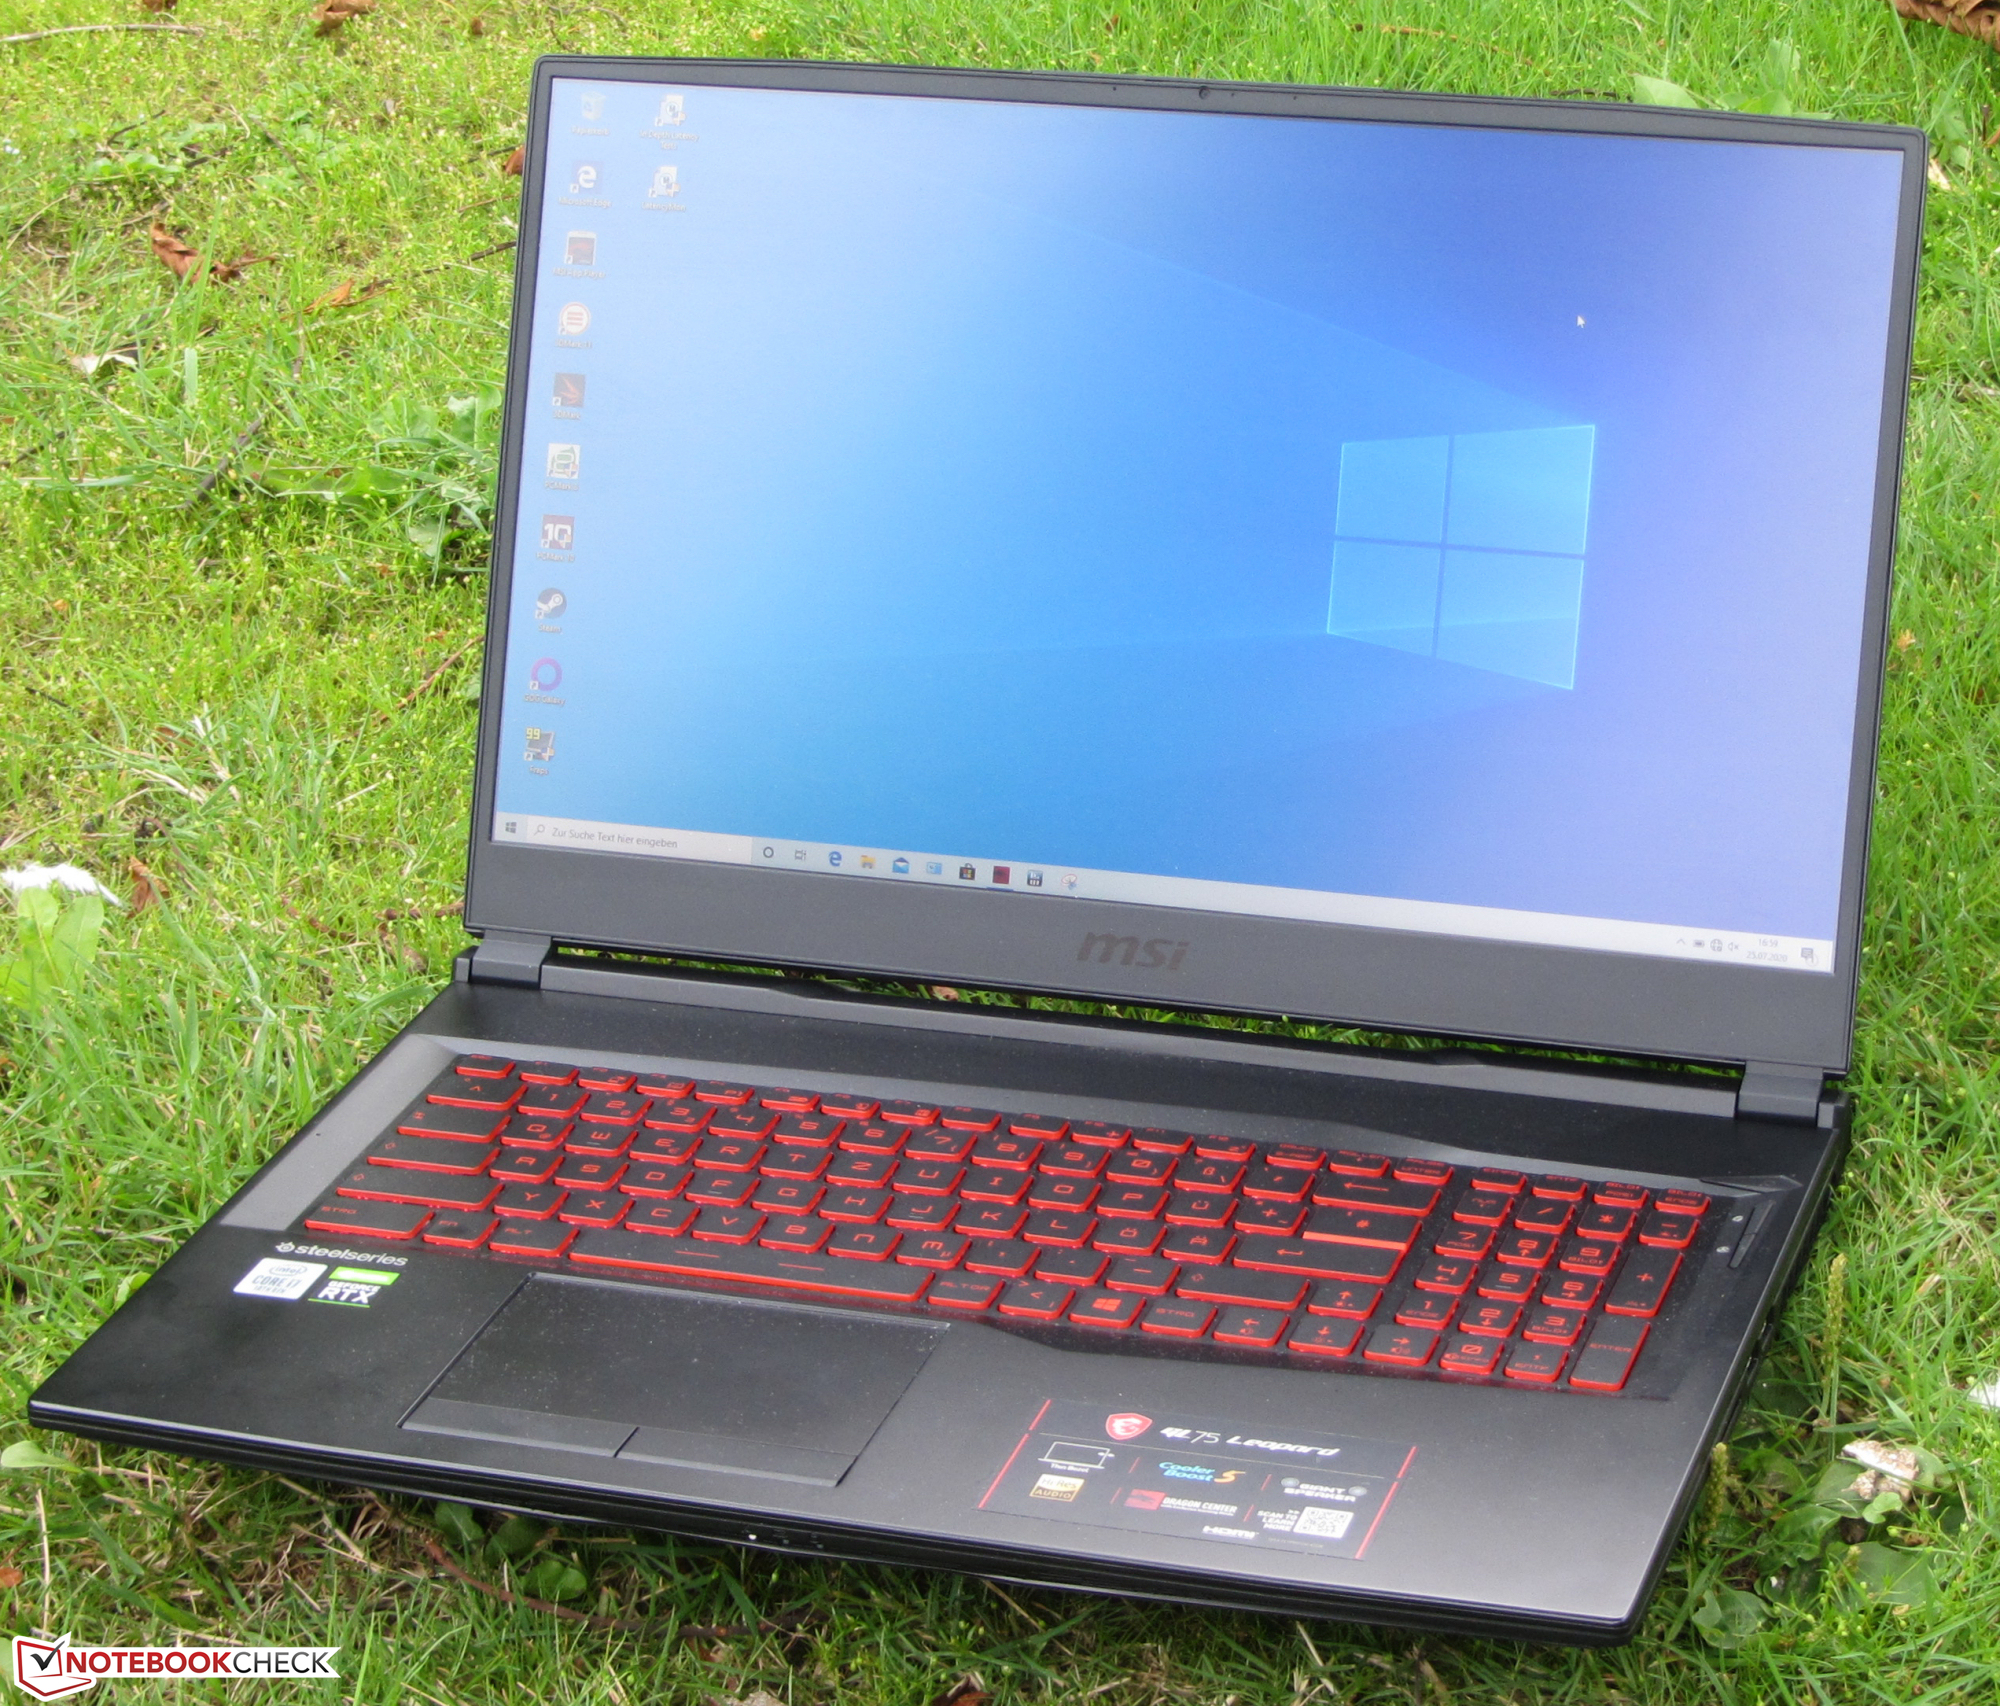
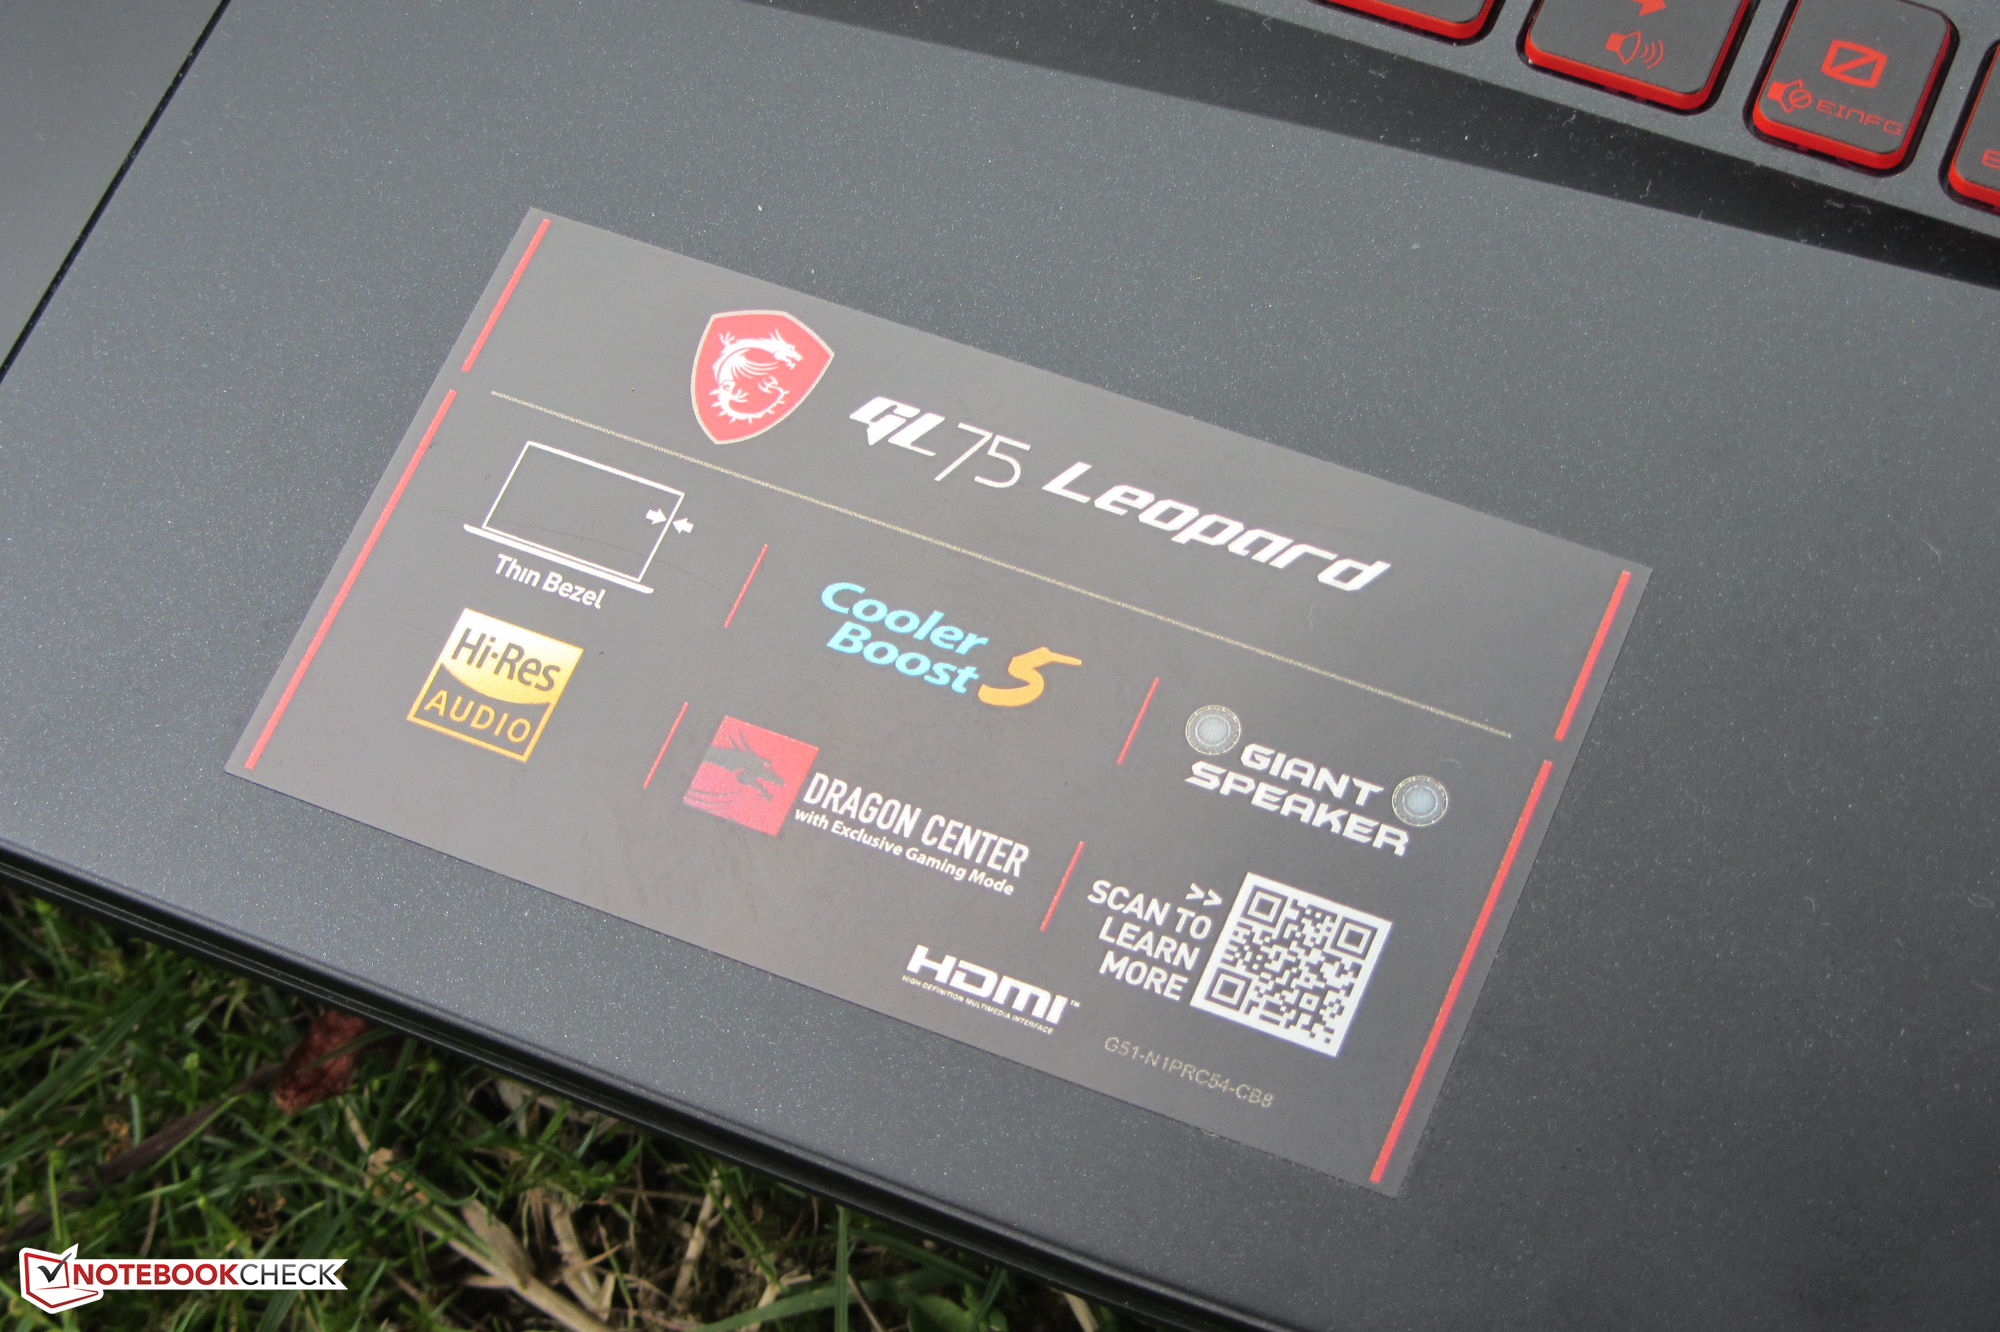
MSI GL75 Leopard rövid értékelés: Sikeres gamer notebook 144 Hz-es kijelzővel
Értékelés | Dátum | Modell | Súly | Magasság | Méret | Felbontás | Legjobb ár |
|---|---|---|---|---|---|---|---|
| 83.5 % v7 (old) | 09/2020 | MSI GL75 10SFR i7-10750H, GeForce RTX 2070 Mobile | 2.6 kg | 28 mm | 17.30" | 1920x1080 | |
| 80.6 % v7 (old) | 09/2020 | Acer Nitro 5 AN517-52-77DS i7-10750H, GeForce RTX 2060 Mobile | 2.2 kg | 24.9 mm | 17.30" | 1920x1080 | |
| 83.2 % v7 (old) | Schenker XMG Neo 17 XNE17M19 i7-9750H, GeForce RTX 2060 Mobile | 2.5 kg | 27 mm | 17.30" | 1920x1080 | ||
| 84 % v7 (old) | 05/2020 | Lenovo Legion Y740-17IRHg-81UJ001VGE i7-9750H, GeForce RTX 2080 Max-Q | 3 kg | 25.5 mm | 17.30" | 1920x1080 |
| SD Card Reader | |
| average JPG Copy Test (av. of 3 runs) | |
| Az osztály átlaga Gaming (20.9 - 210, n=54, az elmúlt 2 évben) | |
| Schenker XMG Neo 17 (Toshiba Exceria Pro SDXC 64 GB UHS-II) | |
| Schenker XMG Neo 17 XNE17M19 (Toshiba Exceria Pro SDXC 64 GB UHS-II) | |
| MSI GP75 Leopard 9SD (Toshiba Exceria Pro SDXC 64 GB UHS-II) | |
| MSI GL75 9SEK-056US | |
| MSI GL75 10SFR (Toshiba Exceria Pro SDXC 64 GB UHS-II) | |
| maximum AS SSD Seq Read Test (1GB) | |
| Az osztály átlaga Gaming (25.5 - 261, n=51, az elmúlt 2 évben) | |
| Schenker XMG Neo 17 (Toshiba Exceria Pro SDXC 64 GB UHS-II) | |
| Schenker XMG Neo 17 XNE17M19 (Toshiba Exceria Pro SDXC 64 GB UHS-II) | |
| MSI GL75 9SEK-056US | |
| MSI GP75 Leopard 9SD (Toshiba Exceria Pro SDXC 64 GB UHS-II) | |
| MSI GL75 10SFR (Toshiba Exceria Pro SDXC 64 GB UHS-II) | |
| Networking | |
| iperf3 transmit AX12 | |
| MSI GL75 10SFR | |
| Átlagos Intel Wi-Fi 6 AX201 (49.8 - 1775, n=324) | |
| Schenker XMG Neo 17 XNE17M19 | |
| Lenovo Legion Y740-17IRHg-81UJ001VGE | |
| MSI GP75 Leopard 9SD | |
| Schenker XMG Neo 17 | |
| Acer Nitro 5 AN517-52-77DS | |
| MSI GL75 9SEK-056US | |
| iperf3 receive AX12 | |
| Schenker XMG Neo 17 XNE17M19 | |
| Átlagos Intel Wi-Fi 6 AX201 (136 - 1743, n=324) | |
| MSI GL75 10SFR | |
| Acer Nitro 5 AN517-52-77DS | |
| MSI GL75 9SEK-056US | |
| MSI GP75 Leopard 9SD | |
| Lenovo Legion Y740-17IRHg-81UJ001VGE | |
| Schenker XMG Neo 17 | |


| |||||||||||||||||||||||||
Fényerő megoszlás: 86 %
Centrumban: 337 cd/m²
Kontraszt: 1549:1 (Fekete: 0.215 cd/m²)
ΔE ColorChecker Calman: 1.98 | ∀{0.5-29.43 Ø4.72}
calibrated: 2.01
ΔE Greyscale Calman: 2.97 | ∀{0.09-98 Ø4.97}
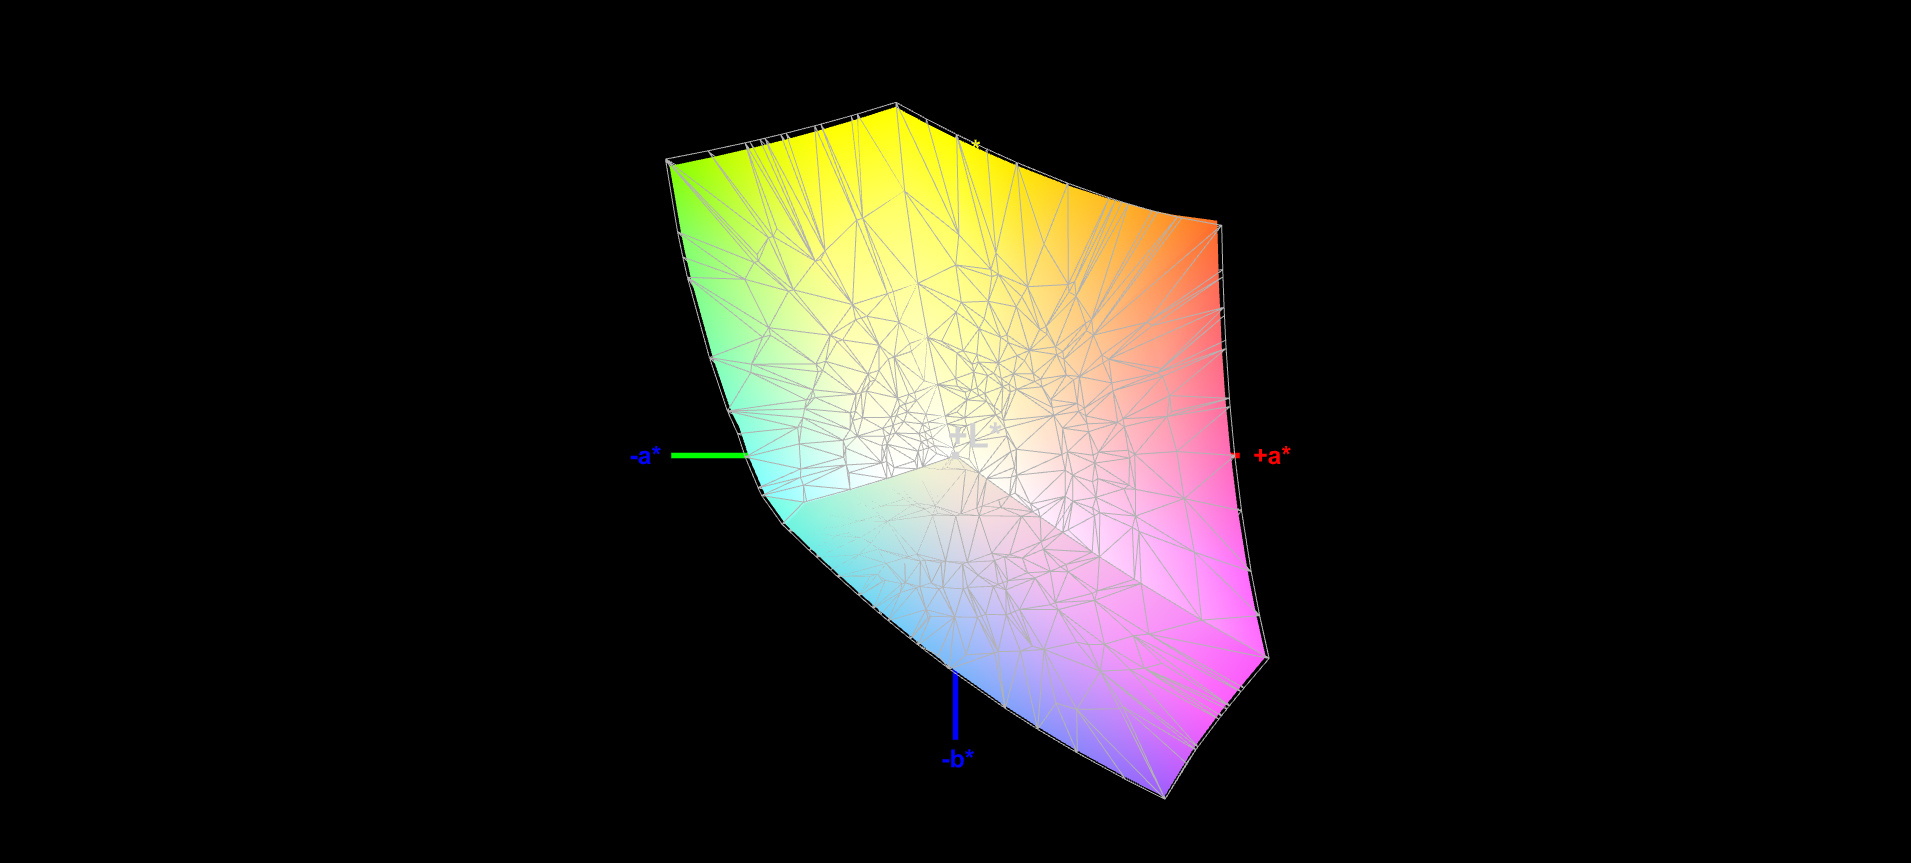
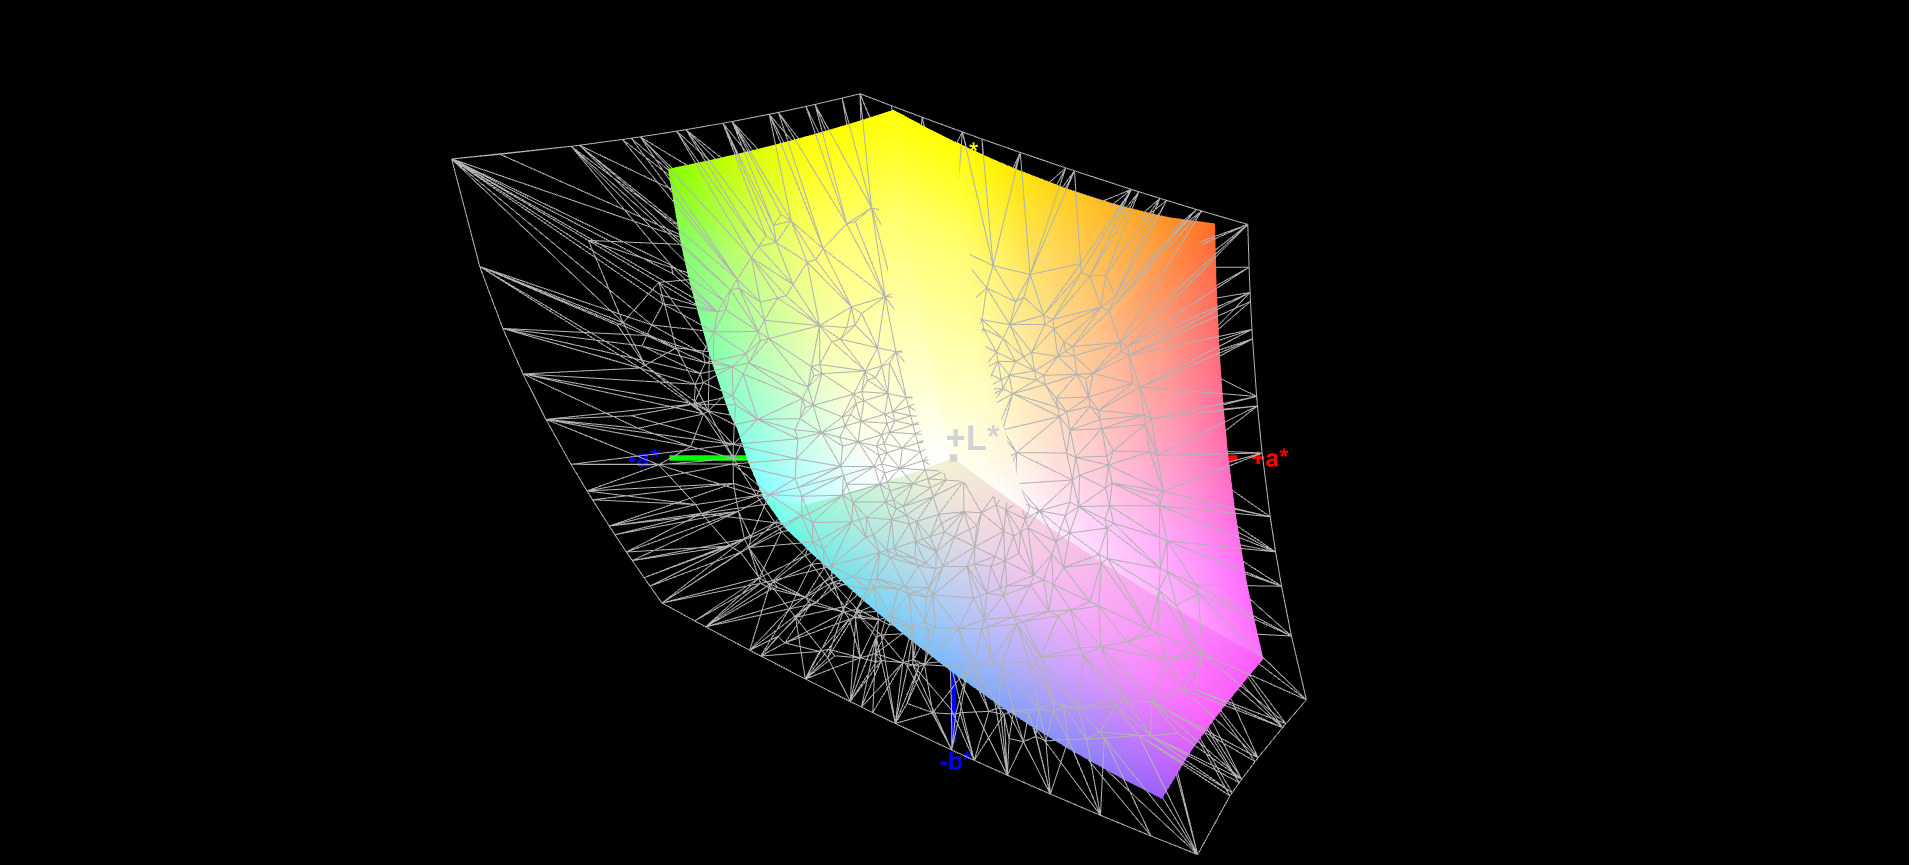
96% sRGB (Argyll 1.6.3 3D)
61% AdobeRGB 1998 (Argyll 1.6.3 3D)
66% AdobeRGB 1998 (Argyll 3D)
96.2% sRGB (Argyll 3D)
63.9% Display P3 (Argyll 3D)
Gamma: 2.41
CCT: 6750 K
| MSI GL75 10SFR Chi Mei N173HCE-G33, IPS, 1920x1080, 17.3" | Acer Nitro 5 AN517-52-77DS AU Optronics B173HAN04.7, IPS, 1920x1080, 17.3" | Schenker XMG Neo 17 XNE17M19 LG LP173WFG-SPB1 (LGD0615), IPS, 1920x1080, 17.3" | Lenovo Legion Y740-17IRHg-81UJ001VGE AUO_B173HAN03, IPS, 1920x1080, 17.3" | MSI GL75 9SEK-056US AU Optronics AUO479D (B173HAN04.7), IPS, 1920x1080, 17.3" | MSI GP75 Leopard 9SD Chi Mei N173HCE-G33 (CMN175C), IPS, 1920x1080, 17.3" | |
|---|---|---|---|---|---|---|
| Display | -38% | -0% | -2% | -36% | -1% | |
| Display P3 Coverage (%) | 63.9 | 39.47 -38% | 64.6 1% | 63.8 0% | 41.12 -36% | 63.4 -1% |
| sRGB Coverage (%) | 96.2 | 58.9 -39% | 95.6 -1% | 92.7 -4% | 61.1 -36% | 94.9 -1% |
| AdobeRGB 1998 Coverage (%) | 66 | 40.77 -38% | 65.6 -1% | 65.3 -1% | 42.49 -36% | 65.1 -1% |
| Response Times | -191% | -30% | -28% | -144% | 18% | |
| Response Time Grey 50% / Grey 80% * (ms) | 12 ? | 35 ? -192% | 15.6 ? -30% | 16 ? -33% | 26 ? -117% | 8 ? 33% |
| Response Time Black / White * (ms) | 9 ? | 26 ? -189% | 11.6 ? -29% | 11 ? -22% | 24.4 ? -171% | 8.8 ? 2% |
| PWM Frequency (Hz) | 208 ? | 25510 ? | ||||
| Screen | -87% | -27% | -33% | -67% | -9% | |
| Brightness middle (cd/m²) | 333 | 263 -21% | 318 -5% | 310 -7% | 259.1 -22% | 420 26% |
| Brightness (cd/m²) | 309 | 246 -20% | 286 -7% | 281 -9% | 261 -16% | 393 27% |
| Brightness Distribution (%) | 86 | 85 -1% | 86 0% | 85 -1% | 93 8% | 91 6% |
| Black Level * (cd/m²) | 0.215 | 0.47 -119% | 0.23 -7% | 0.31 -44% | 0.25 -16% | 0.32 -49% |
| Contrast (:1) | 1549 | 560 -64% | 1383 -11% | 1000 -35% | 1036 -33% | 1313 -15% |
| Colorchecker dE 2000 * | 1.98 | 5.07 -156% | 3.89 -96% | 3.86 -95% | 4.23 -114% | 3.04 -54% |
| Colorchecker dE 2000 max. * | 4.34 | 20.5 -372% | 10.56 -143% | 7.8 -80% | 23.39 -439% | 7.22 -66% |
| Colorchecker dE 2000 calibrated * | 2.01 | 4.9 -144% | 1.03 49% | 3.9 -94% | 0.89 56% | |
| Greyscale dE 2000 * | 2.97 | 2.55 14% | 5.3 -78% | 4.48 -51% | 1.3 56% | 3.91 -32% |
| Gamma | 2.41 91% | 2.37 93% | 2.46 89% | 2.5 88% | 2.076 106% | 2.26 97% |
| CCT | 6750 96% | 6446 101% | 7462 87% | 7542 86% | 6542 99% | 7138 91% |
| Color Space (Percent of AdobeRGB 1998) (%) | 61 | 37 -39% | 60 -2% | 60 -2% | 39 -36% | 60 -2% |
| Color Space (Percent of sRGB) (%) | 96 | 59 -39% | 96 0% | 93 -3% | 61 -36% | 95 -1% |
| Teljes átlag (program / beállítások) | -105% /
-91% | -19% /
-23% | -21% /
-26% | -82% /
-71% | 3% /
-5% |
* ... a kisebb jobb
Megjelenítési válaszidők
| ↔ Válaszidő Fekete-fehér | ||
|---|---|---|
| 9 ms ... emelkedés és süllyedés ↘ kombinálva | ↗ 5 ms emelkedés | 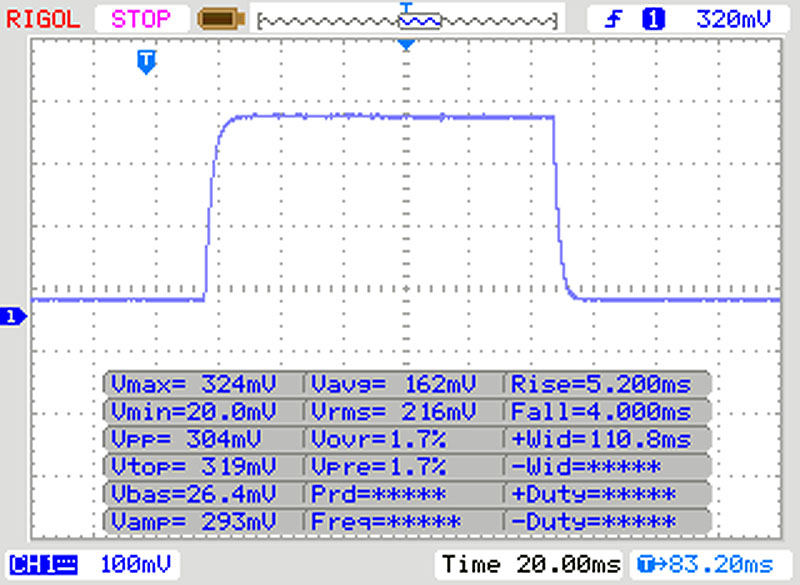 |
| ↘ 4 ms ősz | ||
| A képernyő gyors reakciósebességet mutat tesztjeinkben, és játékra is alkalmasnak kell lennie. Összehasonlításképpen, az összes tesztelt eszköz 0.1 (minimum) és 240 (maximum) ms között mozog. » 25 % of all devices are better. Ez azt jelenti, hogy a mért válaszidő jobb, mint az összes vizsgált eszköz átlaga (19.8 ms). | ||
| ↔ Válaszidő 50% szürke és 80% szürke között | ||
| 12 ms ... emelkedés és süllyedés ↘ kombinálva | ↗ 6 ms emelkedés | 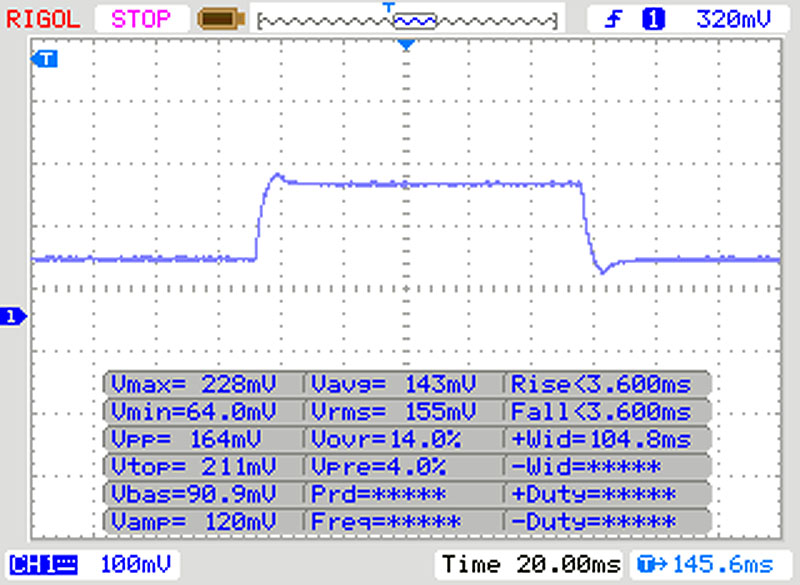 |
| ↘ 6 ms ősz | ||
| A képernyő jó reakciósebességet mutat tesztjeinkben, de túl lassú lehet a versenyképes játékosok számára. Összehasonlításképpen, az összes tesztelt eszköz 0.165 (minimum) és 636 (maximum) ms között mozog. » 25 % of all devices are better. Ez azt jelenti, hogy a mért válaszidő jobb, mint az összes vizsgált eszköz átlaga (31 ms). | ||
Képernyő villogása / PWM (impulzusszélesség-moduláció)
| Képernyő villogása / PWM észlelve | 208 Hz | ≤ 30 % fényerő beállítása | 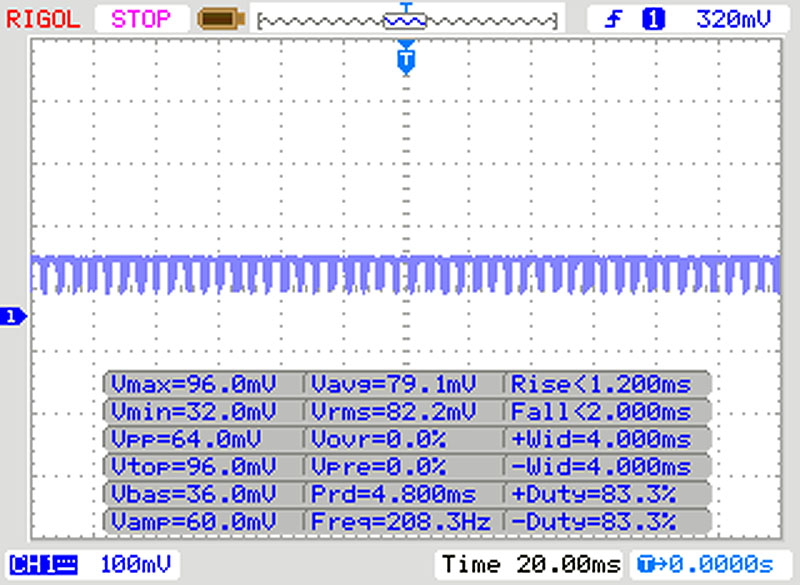 |
A kijelző háttérvilágítása 208 Hz-en villog (a legrosszabb esetben, pl. PWM használatával) Villódzás észlelve a 30 % vagy annál kisebb fényerő-beállításnál. E fényerő-beállítás felett nem lehet villogás vagy PWM. A 208 Hz frekvenciája viszonylag alacsony, így az érzékeny felhasználók valószínűleg villogást észlelnek, és megerőltetik a szemüket a megadott és az alatti fényerő-beállítás mellett. Összehasonlításképpen: az összes tesztelt eszköz 52 %-a nem használja a PWM-et a kijelző elsötétítésére. Ha PWM-et észleltek, akkor átlagosan 7778 (minimum: 5 - maximum: 343500) Hz-t mértek. | |||

| Cinebench R15 | |
| CPU Single 64Bit | |
| Az osztály átlaga Gaming (188.8 - 343, n=111, az elmúlt 2 évben) | |
| Átlagos Intel Core i7-10750H (184 - 213, n=45) | |
| Acer Nitro 5 AN517-52-77DS | |
| MSI GL75 10SFR (Extreme Performance) | |
| Schenker XMG Neo 17 XNE17M19 | |
| MSI GP75 Leopard 9SD | |
| MSI GL75 10SFR | |
| Asus TUF A17 FA706IU-AS76 | |
| MSI Bravo 17 A4DDR | |
| MSI GL75 9SEK-056US | |
| Lenovo Legion Y740-17IRHg-81UJ001VGE | |
| Schenker XMG Neo 17 | |
| CPU Multi 64Bit | |
| Az osztály átlaga Gaming (1578 - 6271, n=111, az elmúlt 2 évben) | |
| MSI Bravo 17 A4DDR | |
| Asus TUF A17 FA706IU-AS76 | |
| MSI GL75 10SFR (Extreme Performance) | |
| Acer Nitro 5 AN517-52-77DS | |
| MSI GL75 9SEK-056US | |
| Átlagos Intel Core i7-10750H (804 - 1418, n=50) | |
| Lenovo Legion Y740-17IRHg-81UJ001VGE | |
| MSI GP75 Leopard 9SD | |
| MSI GL75 10SFR | |
| Schenker XMG Neo 17 XNE17M19 | |
| Schenker XMG Neo 17 | |
| Cinebench R20 | |
| CPU (Single Core) | |
| Az osztály átlaga Gaming (442 - 895, n=111, az elmúlt 2 évben) | |
| MSI Bravo 17 A4DDR | |
| MSI GL75 10SFR | |
| Acer Nitro 5 AN517-52-77DS | |
| Asus TUF A17 FA706IU-AS76 | |
| Átlagos Intel Core i7-10750H (431 - 504, n=43) | |
| Schenker XMG Neo 17 XNE17M19 | |
| Lenovo Legion Y740-17IRHg-81UJ001VGE | |
| CPU (Multi Core) | |
| Az osztály átlaga Gaming (4029 - 16108, n=111, az elmúlt 2 évben) | |
| MSI Bravo 17 A4DDR | |
| Asus TUF A17 FA706IU-AS76 | |
| MSI GL75 10SFR | |
| Acer Nitro 5 AN517-52-77DS | |
| Átlagos Intel Core i7-10750H (1749 - 3325, n=43) | |
| Lenovo Legion Y740-17IRHg-81UJ001VGE | |
| Schenker XMG Neo 17 XNE17M19 | |
* ... a kisebb jobb
| PCMark 8 Home Score Accelerated v2 | 3372 pontok | |
| PCMark 8 Creative Score Accelerated v2 | 3874 pontok | |
| PCMark 8 Work Score Accelerated v2 | 5678 pontok | |
| PCMark 10 Score | 5179 pontok | |
Segítség | ||
| DPC Latencies / LatencyMon - interrupt to process latency (max), Web, Youtube, Prime95 | |
| Asus TUF A17 FA706IU-AS76 | |
| MSI GL75 10SFR | |
| MSI Bravo 17 A4DDR | |
| Acer Nitro 5 AN517-52-77DS | |
* ... a kisebb jobb

| MSI GL75 10SFR Lite-On CL1-8D512 | Acer Nitro 5 AN517-52-77DS WDC PC SN530 SDBPNPZ-1T00 | Schenker XMG Neo 17 XNE17M19 Samsung SSD 970 EVO Plus 500GB | Lenovo Legion Y740-17IRHg-81UJ001VGE Samsung SSD PM981 MZVLB1T0HALR | Schenker XMG Neo 17 Samsung SSD 970 EVO Plus 1TB | MSI GL75 9SEK-056US WDC PC SN520 SDAPNUW-512G | MSI GP75 Leopard 9SD Kingston RBUSNS8154P3256GJ1 | MSI Bravo 17 A4DDR Toshiba KBG30ZMV512G | Asus TUF A17 FA706IU-AS76 Intel SSD 660p 1TB SSDPEKNW010T8 | Átlagos Lite-On CL1-8D512 | |
|---|---|---|---|---|---|---|---|---|---|---|
| CrystalDiskMark 5.2 / 6 | 5% | 11% | 21% | 7% | 7% | -45% | -24% | 15% | -16% | |
| Write 4K (MB/s) | 132.2 | 140 6% | 103.2 -22% | 101.2 -23% | 92.7 -30% | 149.1 13% | 105.8 -20% | 94.6 -28% | 189.7 43% | 119 ? -10% |
| Read 4K (MB/s) | 45.62 | 49.04 7% | 42.11 -8% | 44.61 -2% | 41.4 -9% | 48.58 6% | 27.89 -39% | 47.12 3% | 62.3 37% | 35.6 ? -22% |
| Write Seq (MB/s) | 1511 | 1963 30% | 1087 -28% | 2295 52% | 1363 -10% | 270.8 -82% | 850 -44% | 1681 11% | 1099 ? -27% | |
| Read Seq (MB/s) | 1890 | 1455 -23% | 974 -48% | 2174 15% | 1259 -33% | 879 -53% | 1157 -39% | 1608 -15% | 1806 ? -4% | |
| Write 4K Q32T1 (MB/s) | 375.9 | 398.2 6% | 404.7 8% | 401.2 7% | 289.7 -23% | 462 23% | 273.3 -27% | 277.7 -26% | 468.6 25% | 390 ? 4% |
| Read 4K Q32T1 (MB/s) | 525 | 461.9 -12% | 469.8 -11% | 475.5 -9% | 337.5 -36% | 606 15% | 361.2 -31% | 546 4% | 541 3% | 371 ? -29% |
| Write Seq Q32T1 (MB/s) | 1505 | 1969 31% | 3279 118% | 2397 59% | 3332 121% | 1454 -3% | 253 -83% | 908 -40% | 1770 18% | 965 ? -36% |
| Read Seq Q32T1 (MB/s) | 2008 | 1927 -4% | 3513 75% | 3337 66% | 3477 73% | 1724 -14% | 1505 -25% | 1632 -19% | 1898 -5% | 1998 ? 0% |
| Write 4K Q8T8 (MB/s) | 1562 | 1211 | ||||||||
| Read 4K Q8T8 (MB/s) | 1373 | 1104 | ||||||||
| AS SSD | 51% | 119% | 89% | 130% | 49% | -53% | 6% | 30% | -13% | |
| Seq Read (MB/s) | 1923 | 1804 -6% | 2274 18% | 2800 46% | 2359 23% | 1296 -33% | 748 -61% | 1420 -26% | 1320 -31% | 1795 ? -7% |
| Seq Write (MB/s) | 1065 | 1922 80% | 2522 137% | 2424 128% | 2469 132% | 1391 31% | 219 -79% | 922 -13% | 1539 45% | 706 ? -34% |
| 4K Read (MB/s) | 25.43 | 38.21 50% | 49.72 96% | 42.77 68% | 53.5 110% | 29.67 17% | 25.7 1% | 48.51 91% | 56.3 121% | 24.8 ? -2% |
| 4K Write (MB/s) | 101.9 | 105 3% | 118.2 16% | 94.8 -7% | 117.6 15% | 82.4 -19% | 116.8 15% | 158.5 56% | 92.6 ? -9% | |
| 4K-64 Read (MB/s) | 477.9 | 976 104% | 1209 153% | 1406 194% | 1579 230% | 1042 118% | 259.3 -46% | 928 94% | 586 23% | 379 ? -21% |
| 4K-64 Write (MB/s) | 563 | 1150 104% | 2218 294% | 1697 201% | 2048 264% | 1284 128% | 190.2 -66% | 345.4 -39% | 820 46% | 472 ? -16% |
| Access Time Read * (ms) | 0.053 | 0.055 -4% | 0.05 6% | 0.048 9% | 0.108 -104% | 0.159 -200% | 0.089 -68% | 0.043 19% | 0.069 ? -30% | |
| Access Time Write * (ms) | 0.126 | 0.045 64% | 0.031 75% | 0.039 69% | 0.03 76% | 0.031 75% | 0.058 54% | 0.189 -50% | 0.113 10% | 0.134 ? -6% |
| Score Read (Points) | 696 | 1194 72% | 1486 114% | 1729 148% | 1869 169% | 1201 73% | 360 -48% | 1119 61% | 775 11% | 584 ? -16% |
| Score Write (Points) | 771 | 1747 127% | 2588 236% | 2034 164% | 2413 213% | 1542 100% | 294 -62% | 554 -28% | 1132 47% | 635 ? -18% |
| Score Total (Points) | 1785 | 3563 100% | 4855 172% | 4630 159% | 5248 194% | 3363 88% | 821 -54% | 2232 25% | 2333 31% | 1469 ? -18% |
| Copy ISO MB/s (MB/s) | 1710 | 1305 -24% | 2148 26% | 1736 2% | 1710 ? 0% | |||||
| Copy Program MB/s (MB/s) | 465.3 | 467.5 0% | 582 25% | 553 19% | 465 ? 0% | |||||
| Copy Game MB/s (MB/s) | 1042 | 872 -16% | 1278 23% | 1264 21% | 1042 ? 0% | |||||
| Teljes átlag (program / beállítások) | 28% /
33% | 65% /
73% | 55% /
64% | 69% /
78% | 28% /
33% | -49% /
-49% | -9% /
-7% | 23% /
24% | -15% /
-14% |
* ... a kisebb jobb
Continuous load read: DiskSpd Read Loop, Queue Depth 8
| 3DMark 11 Performance | 21006 pontok | |
| 3DMark Cloud Gate Standard Score | 36210 pontok | |
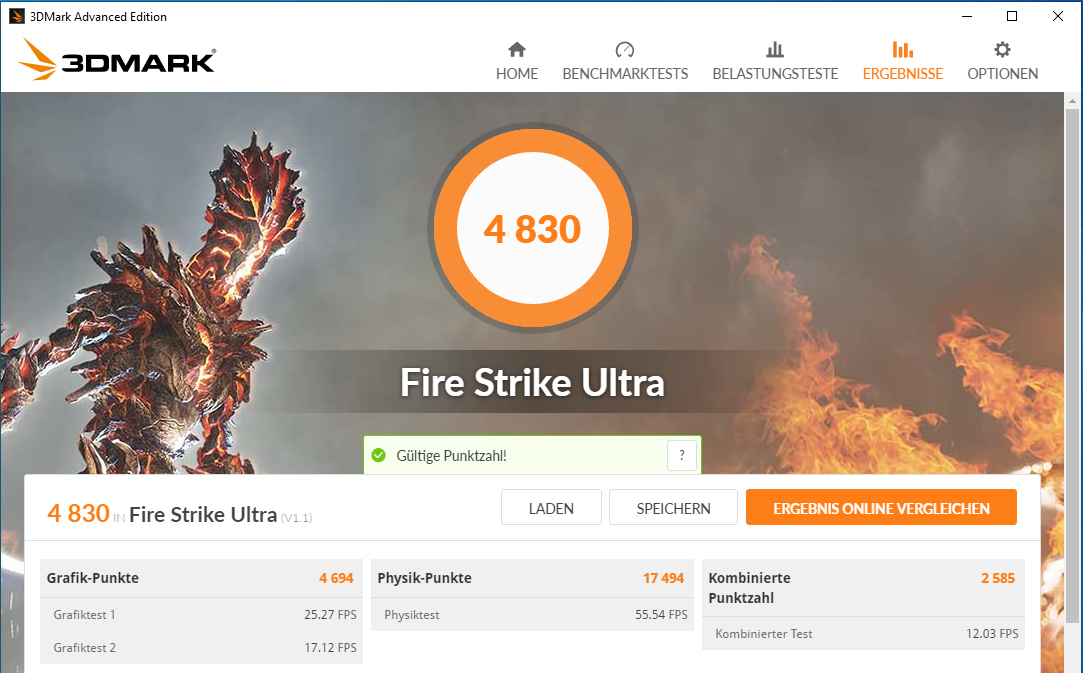
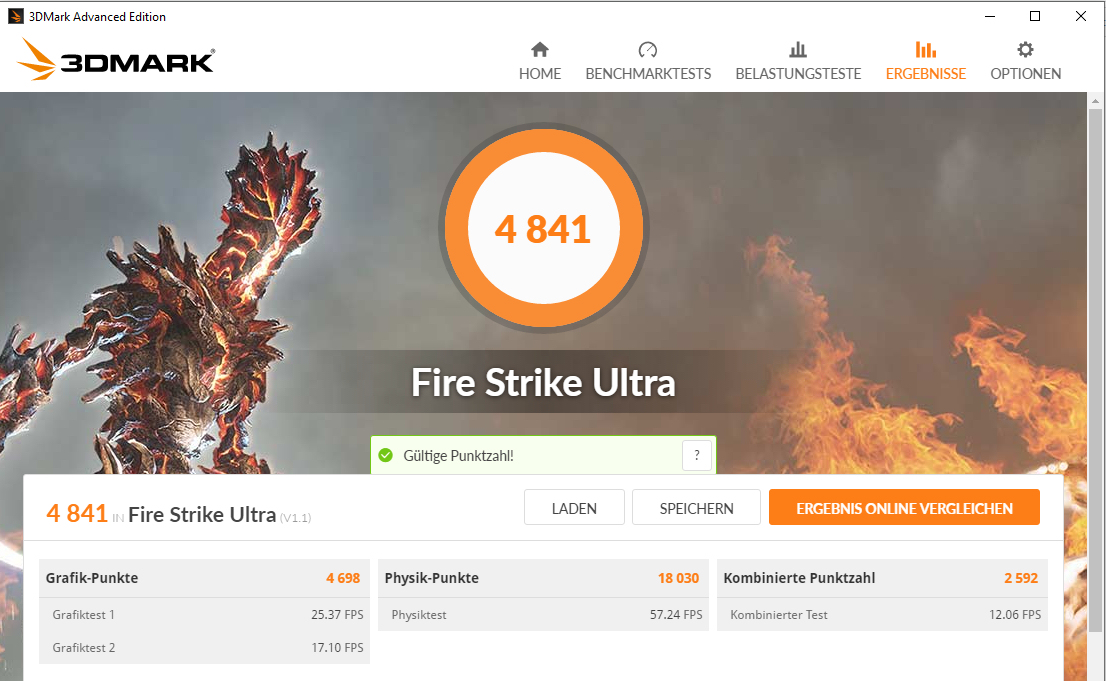
| 3DMark Fire Strike Score | 17529 pontok | |
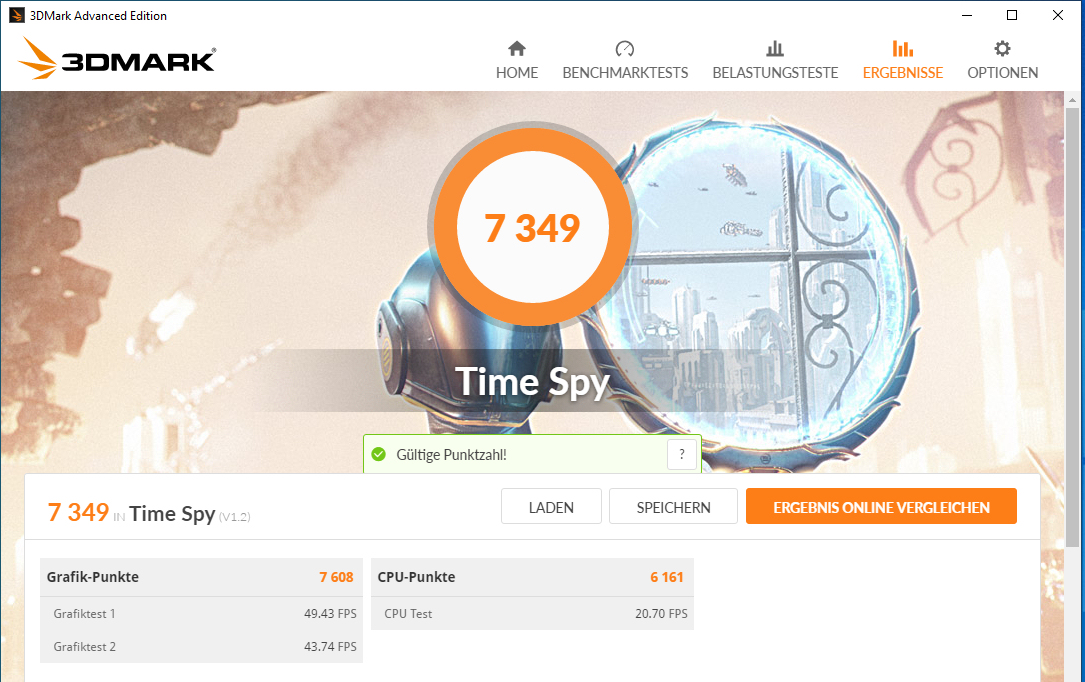
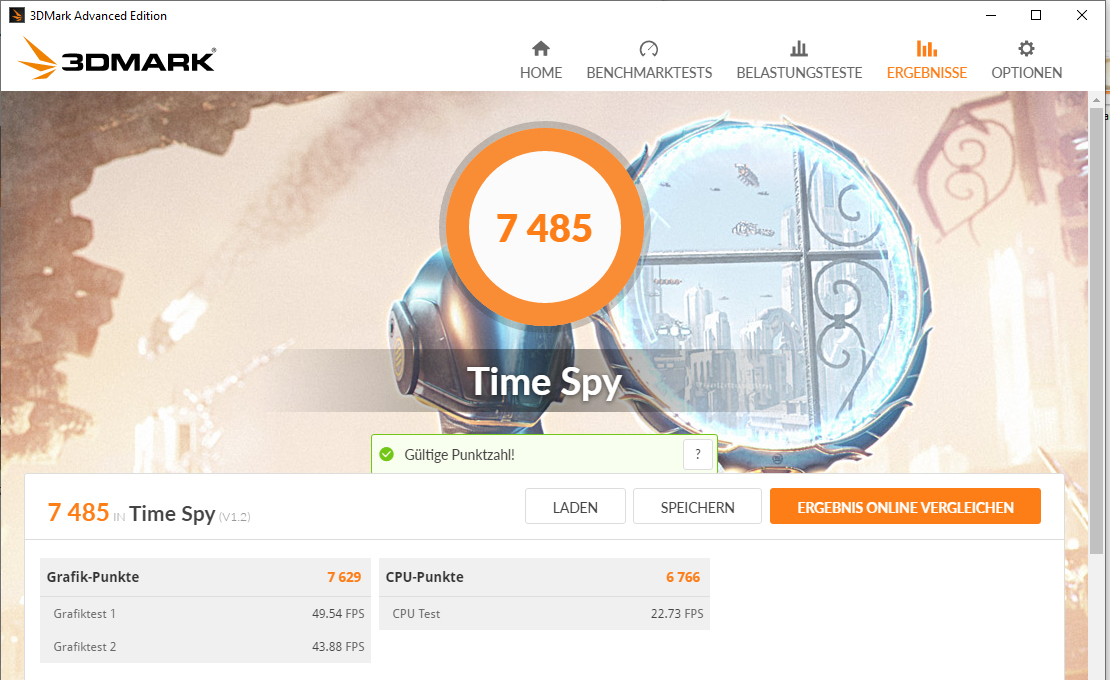
| 3DMark Time Spy Score | 7349 pontok | |
Segítség | ||
| 3DMark 11 - 1280x720 Performance GPU | |
| Az osztály átlaga Gaming (21841 - 80022, n=108, az elmúlt 2 évben) | |
| Lenovo Legion Y740-17IRHg-81UJ001VGE | |
| MSI GL75 10SFR | |
| Átlagos NVIDIA GeForce RTX 2070 Mobile (23335 - 27298, n=21) | |
| Schenker XMG Neo 17 | |
| MSI GL75 9SEK-056US | |
| Asus TUF A17 FA706IU-AS76 | |
| Acer Nitro 5 AN517-52-77DS | |
| MSI GP75 Leopard 9SD | |
| Schenker XMG Neo 17 XNE17M19 | |
| MSI Bravo 17 A4DDR | |
| The Witcher 3 - 1920x1080 Ultra Graphics & Postprocessing (HBAO+) | |
| Az osztály átlaga Gaming (95 - 240, n=8, az elmúlt 2 évben) | |
| Lenovo Legion Y740-17IRHg-81UJ001VGE | |
| MSI GL75 10SFR | |
| Átlagos NVIDIA GeForce RTX 2070 Mobile (64 - 82.1, n=21) | |
| Schenker XMG Neo 17 | |
| Acer Nitro 5 AN517-52-77DS | |
| MSI GL75 9SEK-056US | |
| MSI GP75 Leopard 9SD | |
| Schenker XMG Neo 17 XNE17M19 | |
| Asus TUF A17 FA706IU-AS76 | |
| MSI Bravo 17 A4DDR | |
| BioShock Infinite - 1920x1080 Ultra Preset, DX11 (DDOF) | |
| Átlagos NVIDIA GeForce RTX 2070 Mobile (136.9 - 187.8, n=9) | |
| Lenovo Legion Y740-17IRHg-81UJ001VGE | |
| MSI GL75 10SFR | |
| MSI GP75 Leopard 9SD | |
| Acer Nitro 5 AN517-52-77DS | |
| Shadow of the Tomb Raider - 1920x1080 Highest Preset AA:T | |
| Az osztály átlaga Gaming (96 - 116, n=2, az elmúlt 2 évben) | |
| MSI GL75 10SFR | |
| Átlagos NVIDIA GeForce RTX 2070 Mobile (74.2 - 97, n=11) | |
| MSI GL75 9SEK-056US | |
| Asus TUF A17 FA706IU-AS76 | |
| Acer Nitro 5 AN517-52-77DS | |
| MSI Bravo 17 A4DDR | |
| Total War: Three Kingdoms - 1920x1080 Ultra (incl textures) | |
| MSI GL75 10SFR | |
| Átlagos NVIDIA GeForce RTX 2070 Mobile (n=1) | |
| Acer Nitro 5 AN517-52-77DS | |
| Red Dead Redemption 2 - 1920x1080 Maximum Settings | |
| MSI GL75 10SFR | |
| Átlagos NVIDIA GeForce RTX 2070 Mobile (42.4 - 43, n=3) | |
| Acer Nitro 5 AN517-52-77DS | |
| Doom Eternal - 1920x1080 Ultra Preset | |
| Átlagos NVIDIA GeForce RTX 2070 Mobile (145.1 - 157, n=3) | |
| MSI GL75 10SFR | |
| Acer Nitro 5 AN517-52-77DS | |
| MSI Bravo 17 A4DDR | |
| alacsony | közepes | magas | ultra | |
|---|---|---|---|---|
| BioShock Infinite (2013) | 332.8 | 294.5 | 276.3 | 163.7 |
| The Witcher 3 (2015) | 286.3 | 226.7 | 147.1 | 79.9 |
| Dota 2 Reborn (2015) | 147.2 | 129.4 | 121.8 | 115 |
| X-Plane 11.11 (2018) | 107 | 92.3 | 79.6 | |
| Shadow of the Tomb Raider (2018) | 118 | 104 | 100 | 93 |
| Total War: Three Kingdoms (2019) | 232.7 | 129.9 | 88.5 | 63.1 |
| Red Dead Redemption 2 (2019) | 127.9 | 97.5 | 66.4 | 43 |
| Hunt Showdown (2020) | 184.2 | 124 | 101.7 | |
| Doom Eternal (2020) | 217.6 | 162 | 148.9 | 145.1 |
| Gears Tactics (2020) | 226.5 | 169.9 | 115.2 | 90.9 |
| F1 2020 (2020) | 230 | 177 | 148 | 115 |
| Death Stranding (2020) | 149.3 | 126 | 114.6 | 112 |
Zajszint
| Üresjárat |
| 32.2 / 32.2 / 32.2 dB(A) |
| Terhelés |
| 52.8 / 53.2 dB(A) |
 | ||
30 dB csendes 40 dB(A) hallható 50 dB(A) hangos |
||
min: | ||
| MSI GL75 10SFR i7-10750H, GeForce RTX 2070 Mobile | Acer Nitro 5 AN517-52-77DS i7-10750H, GeForce RTX 2060 Mobile | Schenker XMG Neo 17 XNE17M19 i7-9750H, GeForce RTX 2060 Mobile | Lenovo Legion Y740-17IRHg-81UJ001VGE i7-9750H, GeForce RTX 2080 Max-Q | MSI GL75 9SEK-056US i7-9750H, GeForce RTX 2060 Mobile | MSI GP75 Leopard 9SD i7-9750H, GeForce GTX 1660 Ti Mobile | Átlagos NVIDIA GeForce RTX 2070 Mobile | Az osztály átlaga Gaming | |
|---|---|---|---|---|---|---|---|---|
| Noise | 10% | 5% | 12% | 6% | -1% | 2% | 13% | |
| off / környezet * (dB) | 30.1 | 30.2 -0% | 31 -3% | 30.3 -1% | 28.1 7% | 29 4% | 28.8 ? 4% | 24.1 ? 20% |
| Idle Minimum * (dB) | 32.2 | 30.2 6% | 31 4% | 30.3 6% | 30.9 4% | 29 10% | 30.4 ? 6% | 25.8 ? 20% |
| Idle Average * (dB) | 32.2 | 30.2 6% | 33 -2% | 30.3 6% | 30.9 4% | 34 -6% | 31.7 ? 2% | 27.4 ? 15% |
| Idle Maximum * (dB) | 32.2 | 30.2 6% | 35 -9% | 30.5 5% | 31 4% | 37 -15% | 34.9 ? -8% | 30 ? 7% |
| Load Average * (dB) | 52.8 | 41.5 21% | 43 19% | 40.8 23% | 39 26% | 53 -0% | 46.8 ? 11% | 43 ? 19% |
| Witcher 3 ultra * (dB) | 53.8 | 44.5 17% | 45 16% | 40.5 25% | 53.5 1% | 51 5% | ||
| Load Maximum * (dB) | 53.2 | 44.6 16% | 47 12% | 40.8 23% | 53.5 -1% | 55 -3% | 55.8 ? -5% | 54 ? -2% |
* ... a kisebb jobb
(±) A felső oldalon a maximális hőmérséklet 44 °C / 111 F, összehasonlítva a 40.4 °C / 105 F átlagával , 21.2 és 68.8 °C között a Gaming osztálynál.
(±) Az alsó maximum 42.5 °C / 109 F-ig melegszik fel, összehasonlítva a 43.2 °C / 110 F átlagával
(+) Üresjáratban a felső oldal átlagos hőmérséklete 27.4 °C / 81 F, összehasonlítva a 33.9 °C / ### eszközátlaggal class_avg_f### F.
(±) A The Witcher 3 játék során a felső oldal átlaghőmérséklete 36.4 °C / 98 F, összehasonlítva a 33.9 °C / ## eszközátlaggal #class_avg_f### F.
(+) A csuklótámasz és az érintőpad eléri a bőr maximális hőmérsékletét (33.3 °C / 91.9 F), ezért nem forrók.
(-) A hasonló eszközök csuklótámasz területének átlagos hőmérséklete 28.8 °C / 83.8 F volt (-4.5 °C / -8.1 F).
| MSI GL75 10SFR i7-10750H, GeForce RTX 2070 Mobile | Acer Nitro 5 AN517-52-77DS i7-10750H, GeForce RTX 2060 Mobile | Schenker XMG Neo 17 XNE17M19 i7-9750H, GeForce RTX 2060 Mobile | Lenovo Legion Y740-17IRHg-81UJ001VGE i7-9750H, GeForce RTX 2080 Max-Q | MSI GL75 9SEK-056US i7-9750H, GeForce RTX 2060 Mobile | MSI GP75 Leopard 9SD i7-9750H, GeForce GTX 1660 Ti Mobile | Átlagos NVIDIA GeForce RTX 2070 Mobile | Az osztály átlaga Gaming | |
|---|---|---|---|---|---|---|---|---|
| Heat | -7% | -4% | -4% | -27% | -3% | -14% | -10% | |
| Maximum Upper Side * (°C) | 44 | 50.6 -15% | 48 -9% | 40.7 7% | 49.4 -12% | 45 -2% | 47.1 ? -7% | 45.2 ? -3% |
| Maximum Bottom * (°C) | 42.5 | 53.8 -27% | 54 -27% | 42.2 1% | 50.6 -19% | 42 1% | 51 ? -20% | 48 ? -13% |
| Idle Upper Side * (°C) | 29.1 | 26.6 9% | 26 11% | 31.9 -10% | 39 -34% | 30 -3% | 31.8 ? -9% | 31.1 ? -7% |
| Idle Bottom * (°C) | 29.5 | 27.8 6% | 27 8% | 33.9 -15% | 42 -42% | 32 -8% | 34.8 ? -18% | 34.2 ? -16% |
* ... a kisebb jobb
MSI GL75 10SFR hangelemzés
(±) | a hangszóró hangereje átlagos, de jó (75.6 dB)
Basszus 100 - 315 Hz
(-) | szinte nincs basszus – átlagosan 20.3%-kal alacsonyabb a mediánnál
(±) | a basszus linearitása átlagos (13.1% delta az előző frekvenciához)
Közepes 400-2000 Hz
(+) | kiegyensúlyozott középpontok – csak 1.9% választja el a mediántól
(±) | a középpontok linearitása átlagos (7% delta az előző gyakorisághoz)
Maximum 2-16 kHz
(+) | kiegyensúlyozott csúcsok – csak 2.3% választja el a mediántól
(+) | a csúcsok lineárisak (3.7% delta az előző frekvenciához képest)
Összességében 100 - 16.000 Hz
(+) | általános hangzás lineáris (13.9% eltérés a mediánhoz képest)
Ugyanazon osztályhoz képest
» 22%Ebben az osztályban az összes tesztelt eszköz %-a jobb volt, 7% hasonló, 71%-kal rosszabb
» A legjobb delta értéke 6%, az átlag 18%, a legrosszabb 132% volt
Az összes tesztelt eszközzel összehasonlítva
» 16% az összes tesztelt eszköz jobb volt, 4% hasonló, 80%-kal rosszabb
» A legjobb delta értéke 4%, az átlag 24%, a legrosszabb 134% volt
| Kikapcsolt állapot / Készenlét | |
| Üresjárat | |
| Terhelés |
|
Kulcs:
min: | |
| MSI GL75 10SFR i7-10750H, GeForce RTX 2070 Mobile | Acer Nitro 5 AN517-52-77DS i7-10750H, GeForce RTX 2060 Mobile | Schenker XMG Neo 17 XNE17M19 i7-9750H, GeForce RTX 2060 Mobile | Lenovo Legion Y740-17IRHg-81UJ001VGE i7-9750H, GeForce RTX 2080 Max-Q | MSI GL75 9SEK-056US i7-9750H, GeForce RTX 2060 Mobile | MSI GP75 Leopard 9SD i7-9750H, GeForce GTX 1660 Ti Mobile | Átlagos NVIDIA GeForce RTX 2070 Mobile | Az osztály átlaga Gaming | |
|---|---|---|---|---|---|---|---|---|
| Power Consumption | 34% | 14% | -18% | 15% | 11% | -42% | -11% | |
| Idle Minimum * (Watt) | 12 | 5.4 55% | 11 8% | 15.7 -31% | 10.7 11% | 10 17% | 21.4 ? -78% | 13.1 ? -9% |
| Idle Average * (Watt) | 16.6 | 9.8 41% | 14 16% | 26.3 -58% | 15.2 8% | 15 10% | 26.3 ? -58% | 18.7 ? -13% |
| Idle Maximum * (Watt) | 18 | 10.9 39% | 20 -11% | 28 -56% | 17.8 1% | 22 -22% | 32.2 ? -79% | 24.4 ? -36% |
| Load Average * (Watt) | 130 | 104 20% | 100 23% | 136 -5% | 88.2 32% | 92 29% | 114.8 ? 12% | 108.1 ? 17% |
| Witcher 3 ultra * (Watt) | 203 | 134.3 34% | 151 26% | 160 21% | 147.8 27% | 153 25% | ||
| Load Maximum * (Watt) | 224 | 193 14% | 174 22% | 177 21% | 206.5 8% | 216 4% | 238 ? -6% | 254 ? -13% |
* ... a kisebb jobb
| MSI GL75 10SFR i7-10750H, GeForce RTX 2070 Mobile, 51 Wh | Acer Nitro 5 AN517-52-77DS i7-10750H, GeForce RTX 2060 Mobile, 57.48 Wh | Schenker XMG Neo 17 XNE17M19 i7-9750H, GeForce RTX 2060 Mobile, 46 Wh | Lenovo Legion Y740-17IRHg-81UJ001VGE i7-9750H, GeForce RTX 2080 Max-Q, 76 Wh | MSI GL75 9SEK-056US i7-9750H, GeForce RTX 2060 Mobile, 51 Wh | MSI GP75 Leopard 9SD i7-9750H, GeForce GTX 1660 Ti Mobile, 51 Wh | Az osztály átlaga Gaming | |
|---|---|---|---|---|---|---|---|
| Akkumulátor üzemidő | 83% | 17% | -15% | 19% | -23% | 65% | |
| Reader / Idle (h) | 6.4 | 11 72% | 6.7 5% | 3.8 -41% | 7.9 23% | 4.8 -25% | 8.71 ? 36% |
| H.264 (h) | 5.2 | 7.3 40% | 2.8 -46% | 8.26 ? 59% | |||
| WiFi v1.3 (h) | 3.9 | 6.6 69% | 4.7 21% | 3 -23% | 4.2 8% | 3.2 -18% | 7.04 ? 81% |
| Load (h) | 0.8 | 2 150% | 1 25% | 1.2 50% | 1 25% | 0.6 -25% | 1.47 ? 84% |
Pro
Kontra
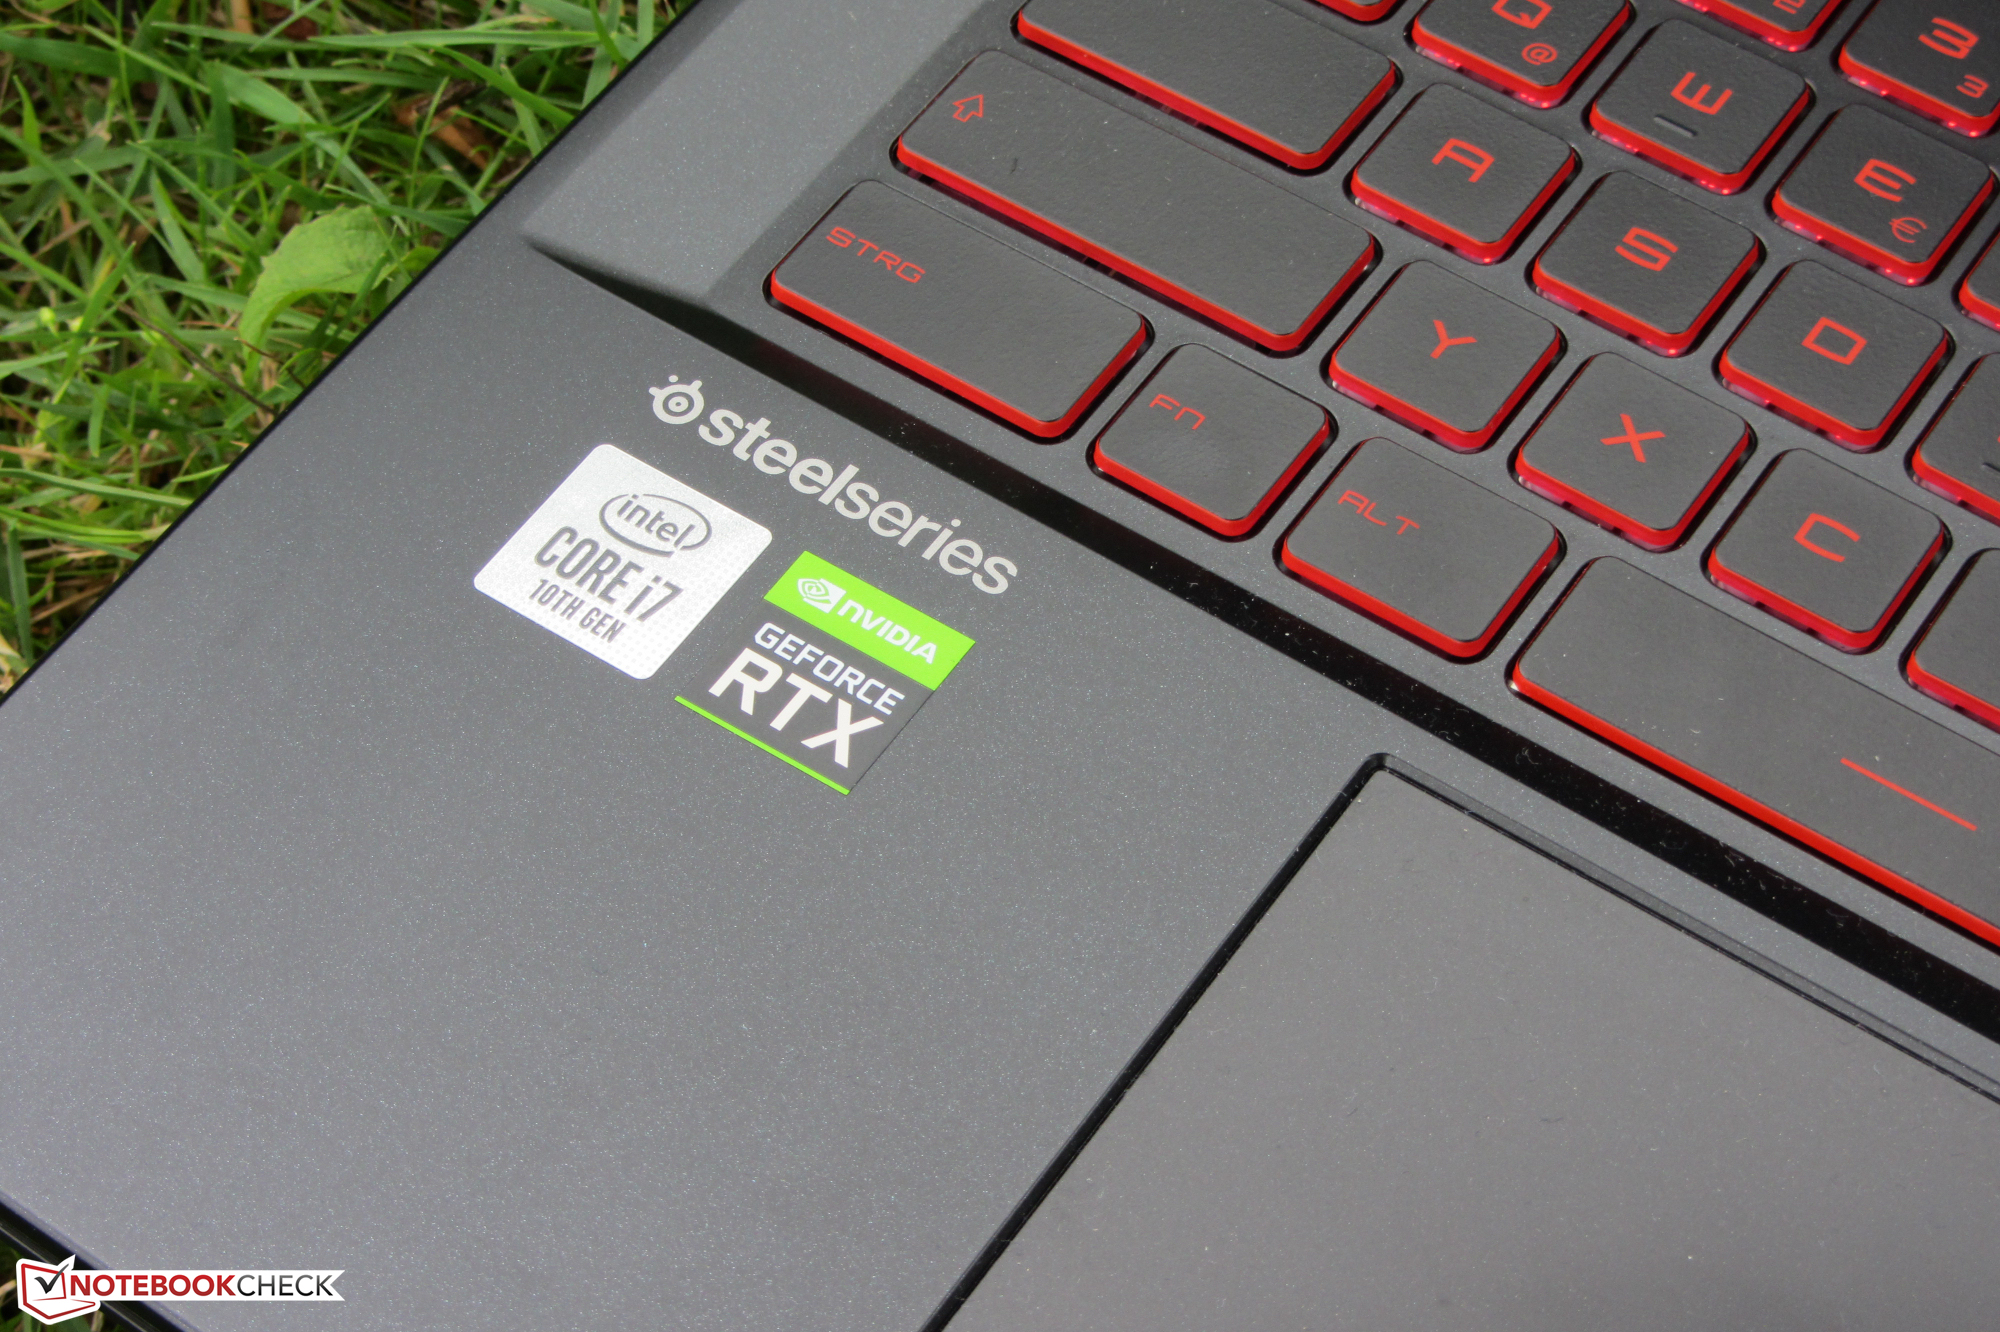
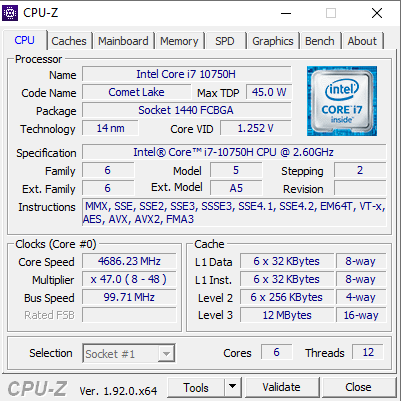
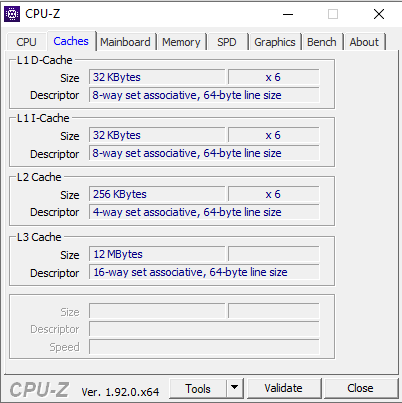
Az MSI GL75 azt teszi, amit elvárnak tőle. Minden modern játékot simán a képernyőre visz. A felbontás és a minőségi szint terén nincsenek kompromisszumok. A Core i7-10750H hatmagos processzor és a GeForce RTX 2070 GPU ezt lehetővé teszi.
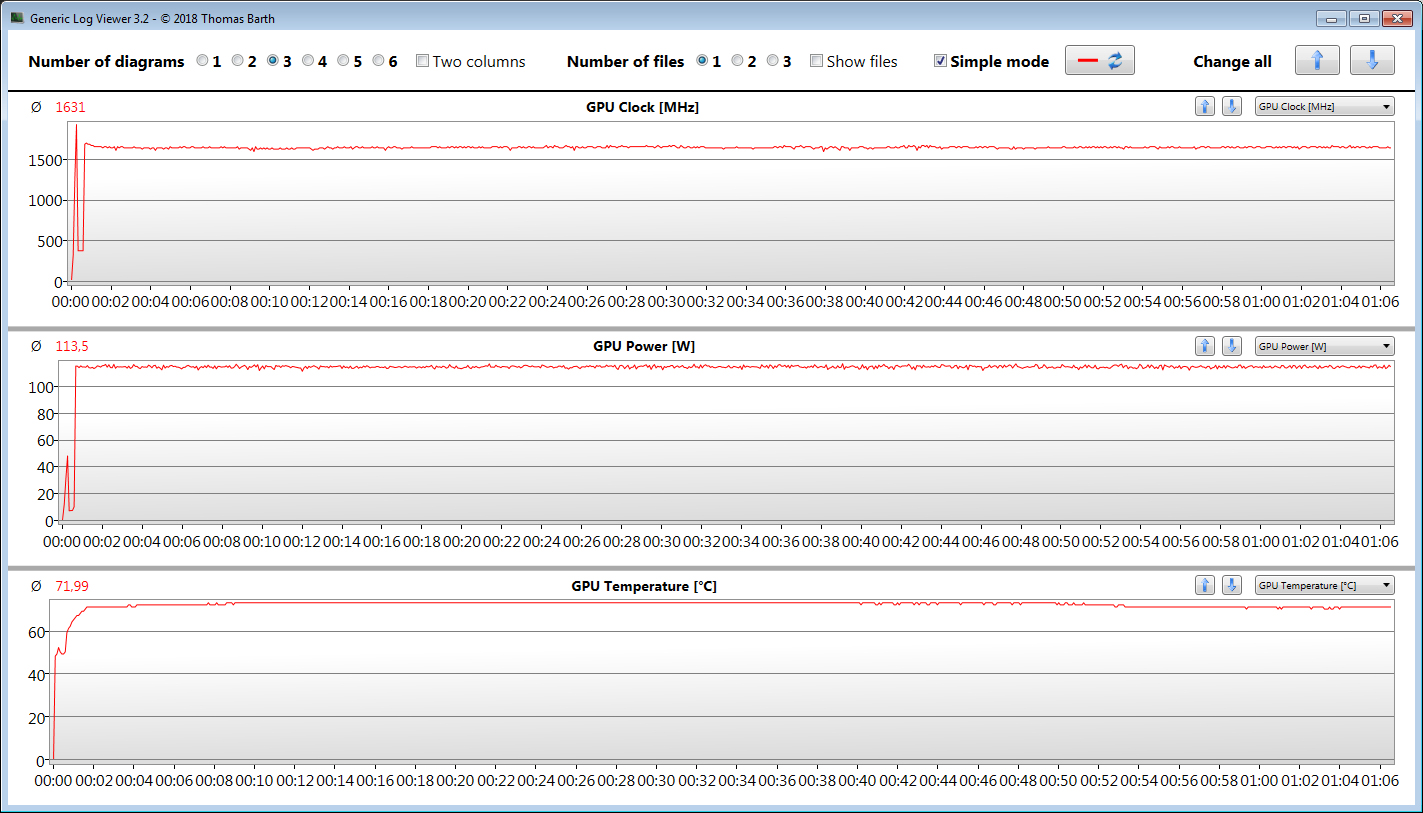
Az erős hardvernek hűtésre van szüksége. Ezért a laptop két ventilátora terhelés alatt erősen felpörög, és sok zajt generál. Pozitív következmény: A ház csak mérsékelten melegszik fel.
Az MSI egy átfogóan jó gamer notebookot kínál elfogadható áron a GL75 Leopard 10SFR-221-ben.
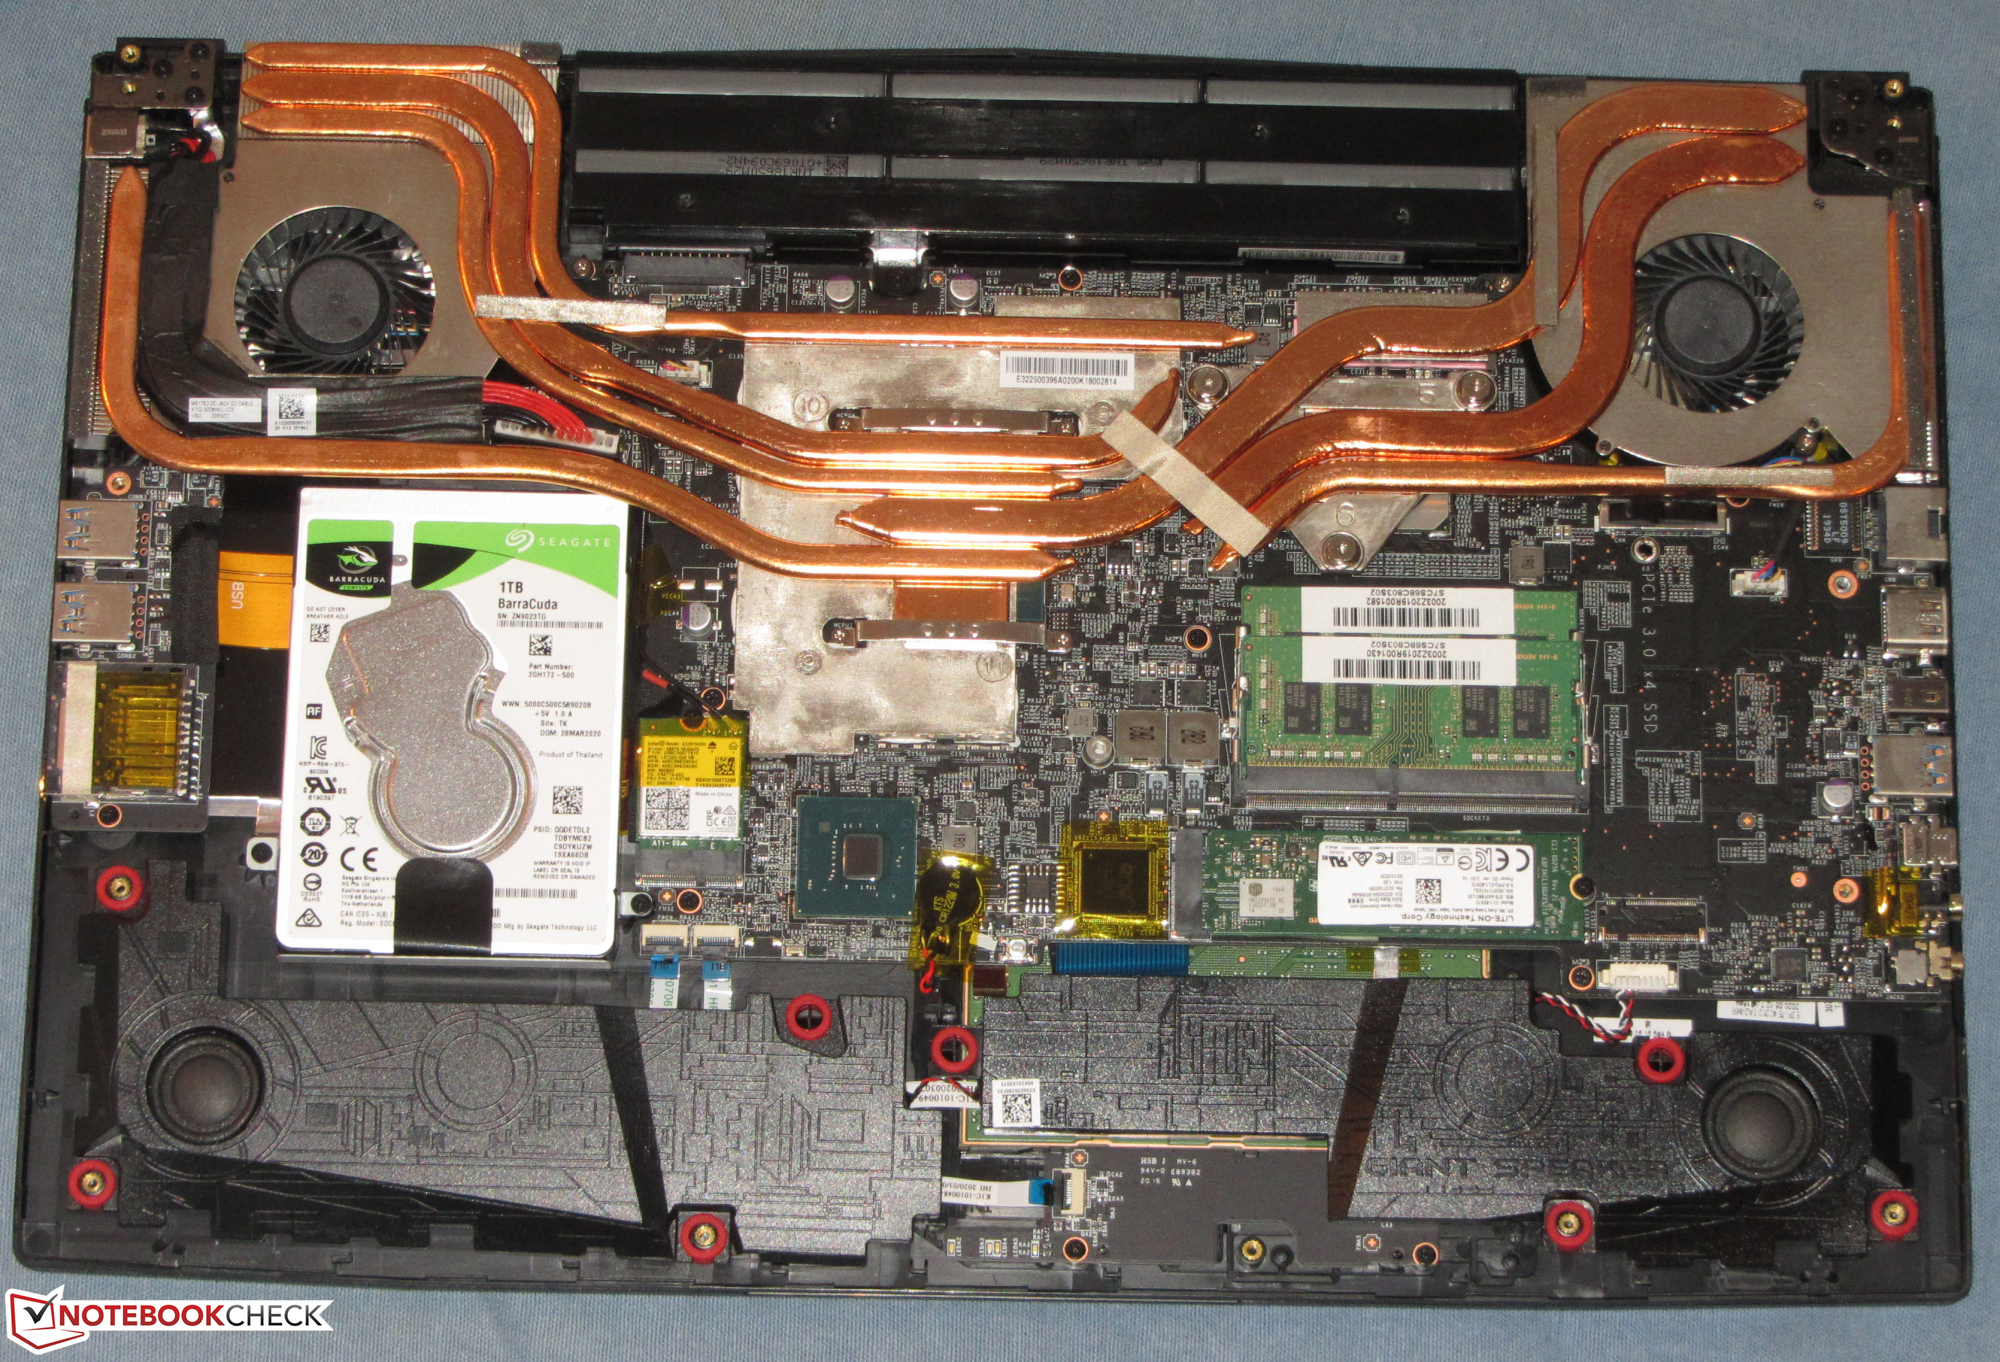
A laptop egy gyors NVMe SSD-vel jön, összesen 512 GB tárhellyel. Mivel egy gamer notebook soha nem rendelkezik túl sok tárhellyel, ezért az MSI egy 1 TB-s merevlemezt (7,200 rpm) is beépített. Mindkét adattároló cserélhető. Ehhez a ház alsó részét el kell távolítani.
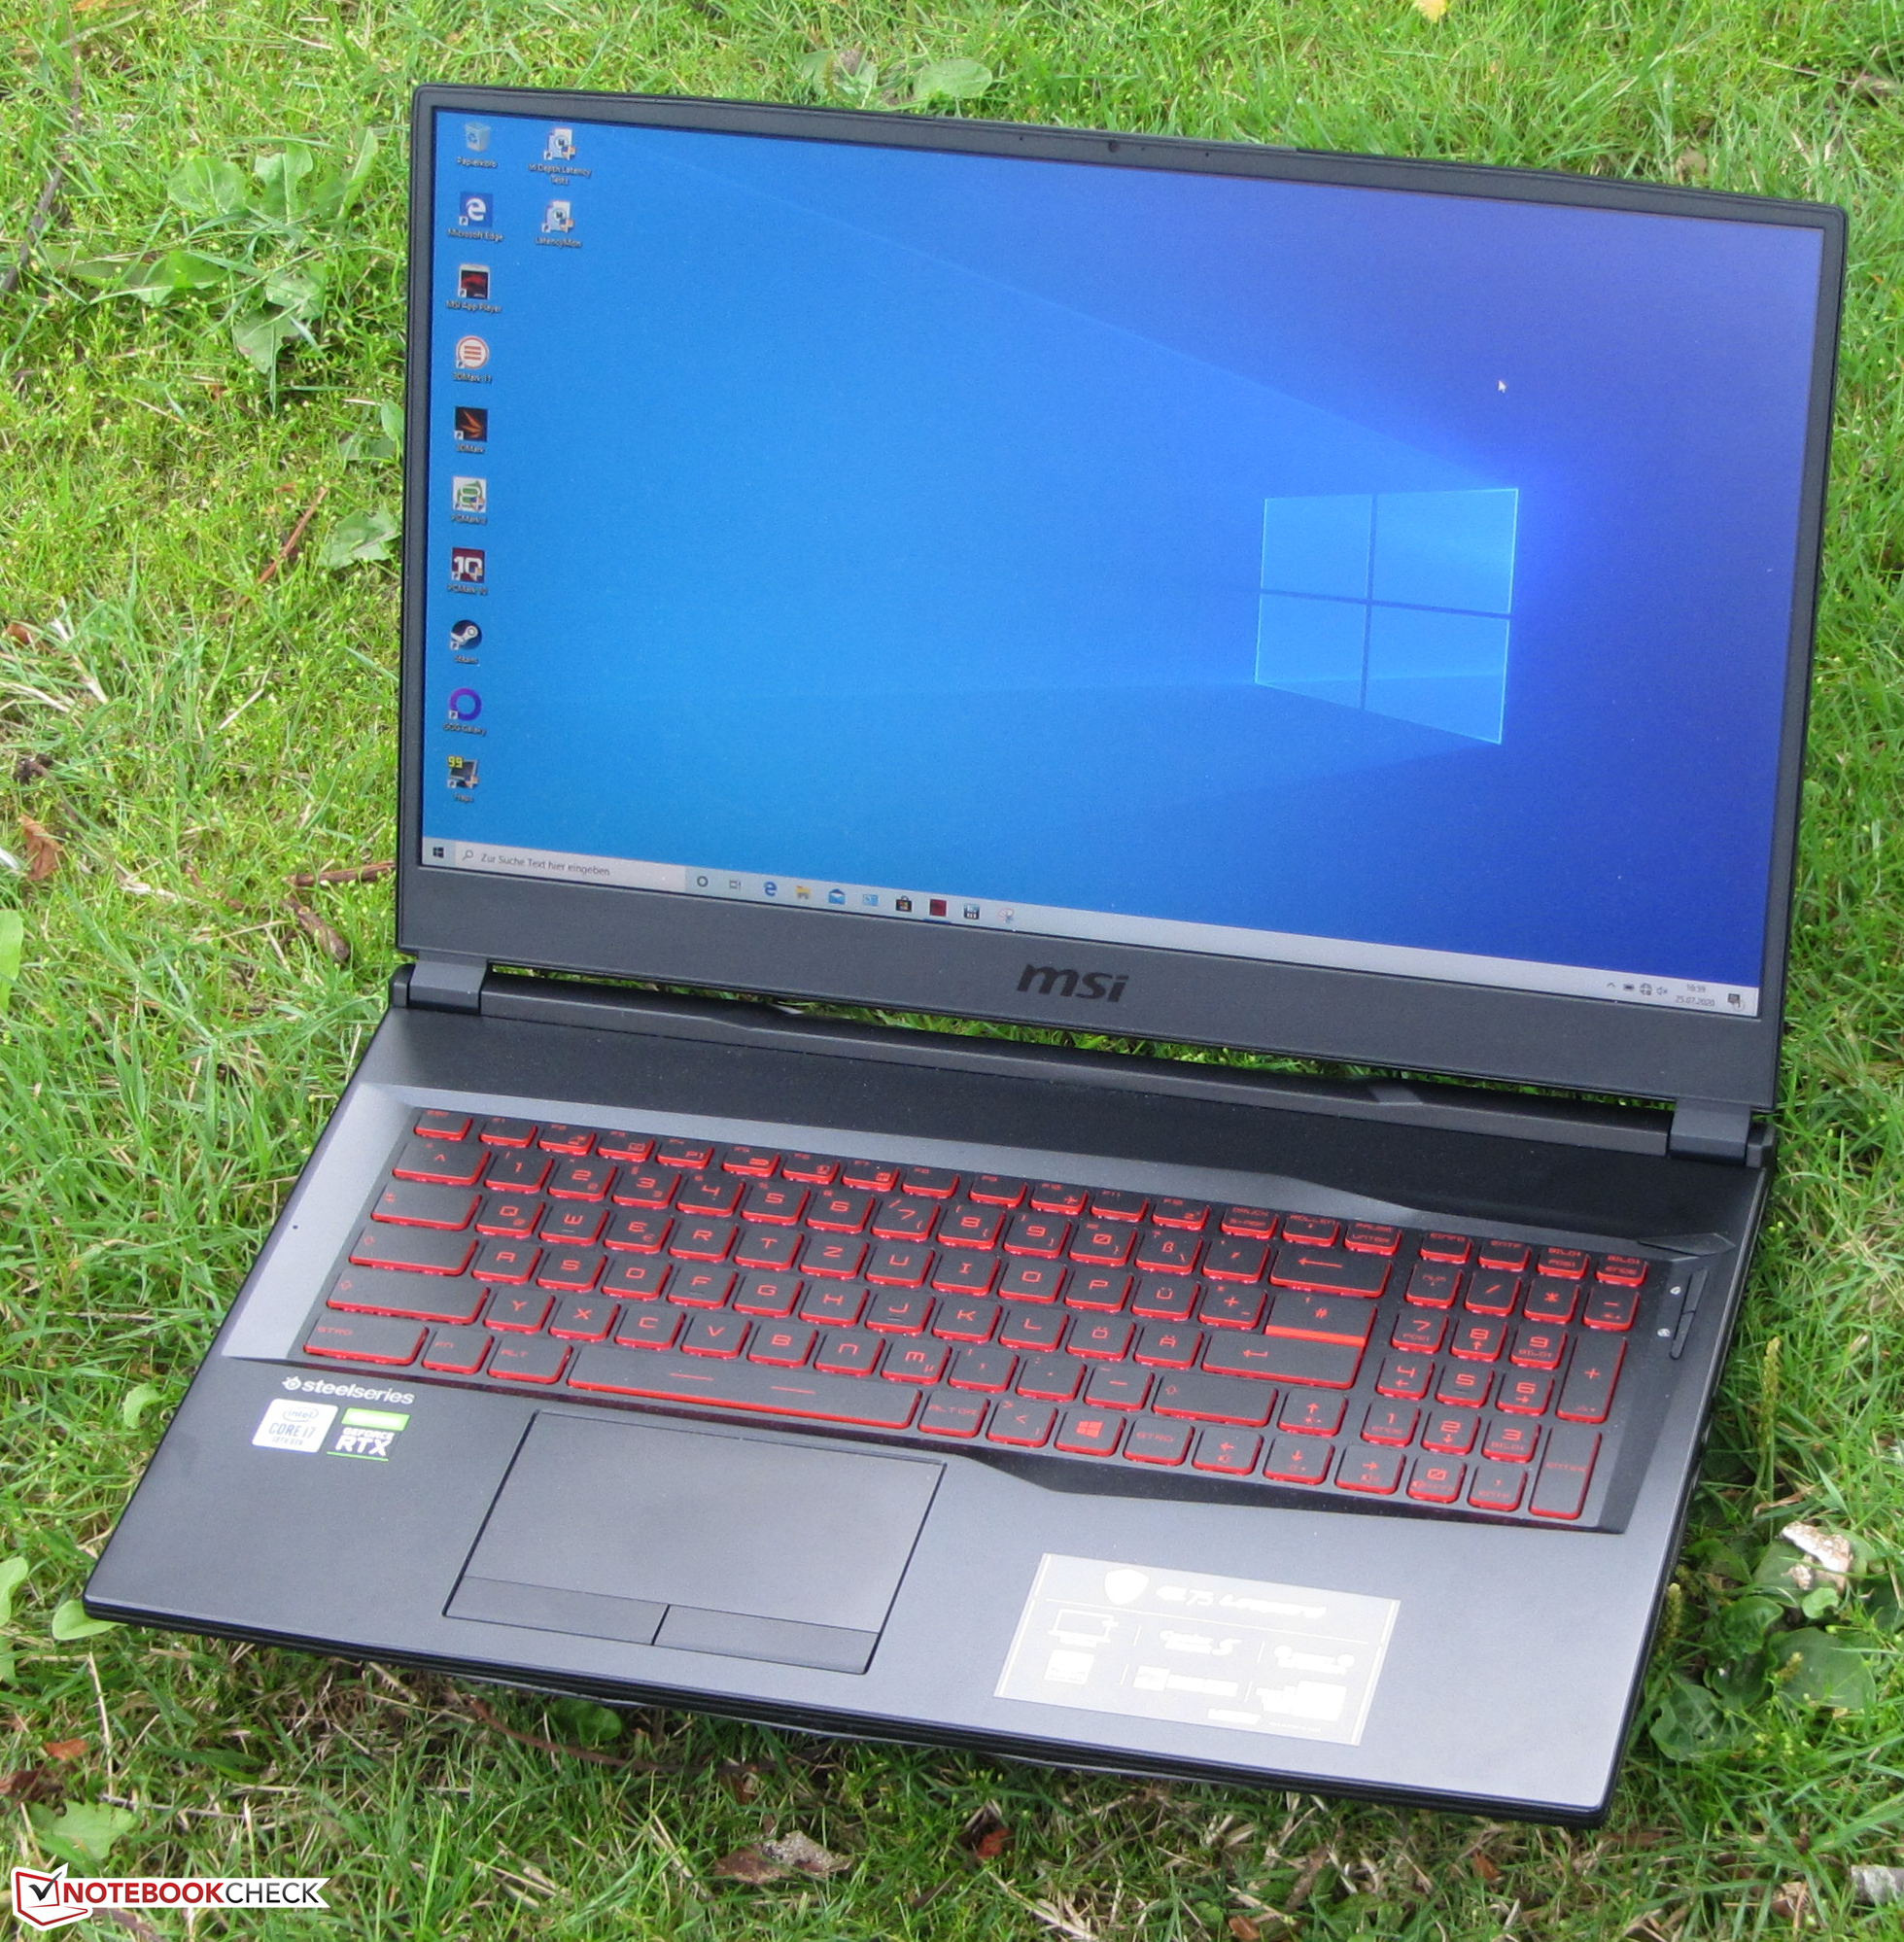
A matt 144 Hz-es Full HD IPS kijelző szintén pontokat szerez stabil látószögekkel, elegendő fényerővel, jó kontraszttal, rövid válaszidőkkel és nagyszerű színreprodukcióval. A színtér lefedettség szintén megnyerő.
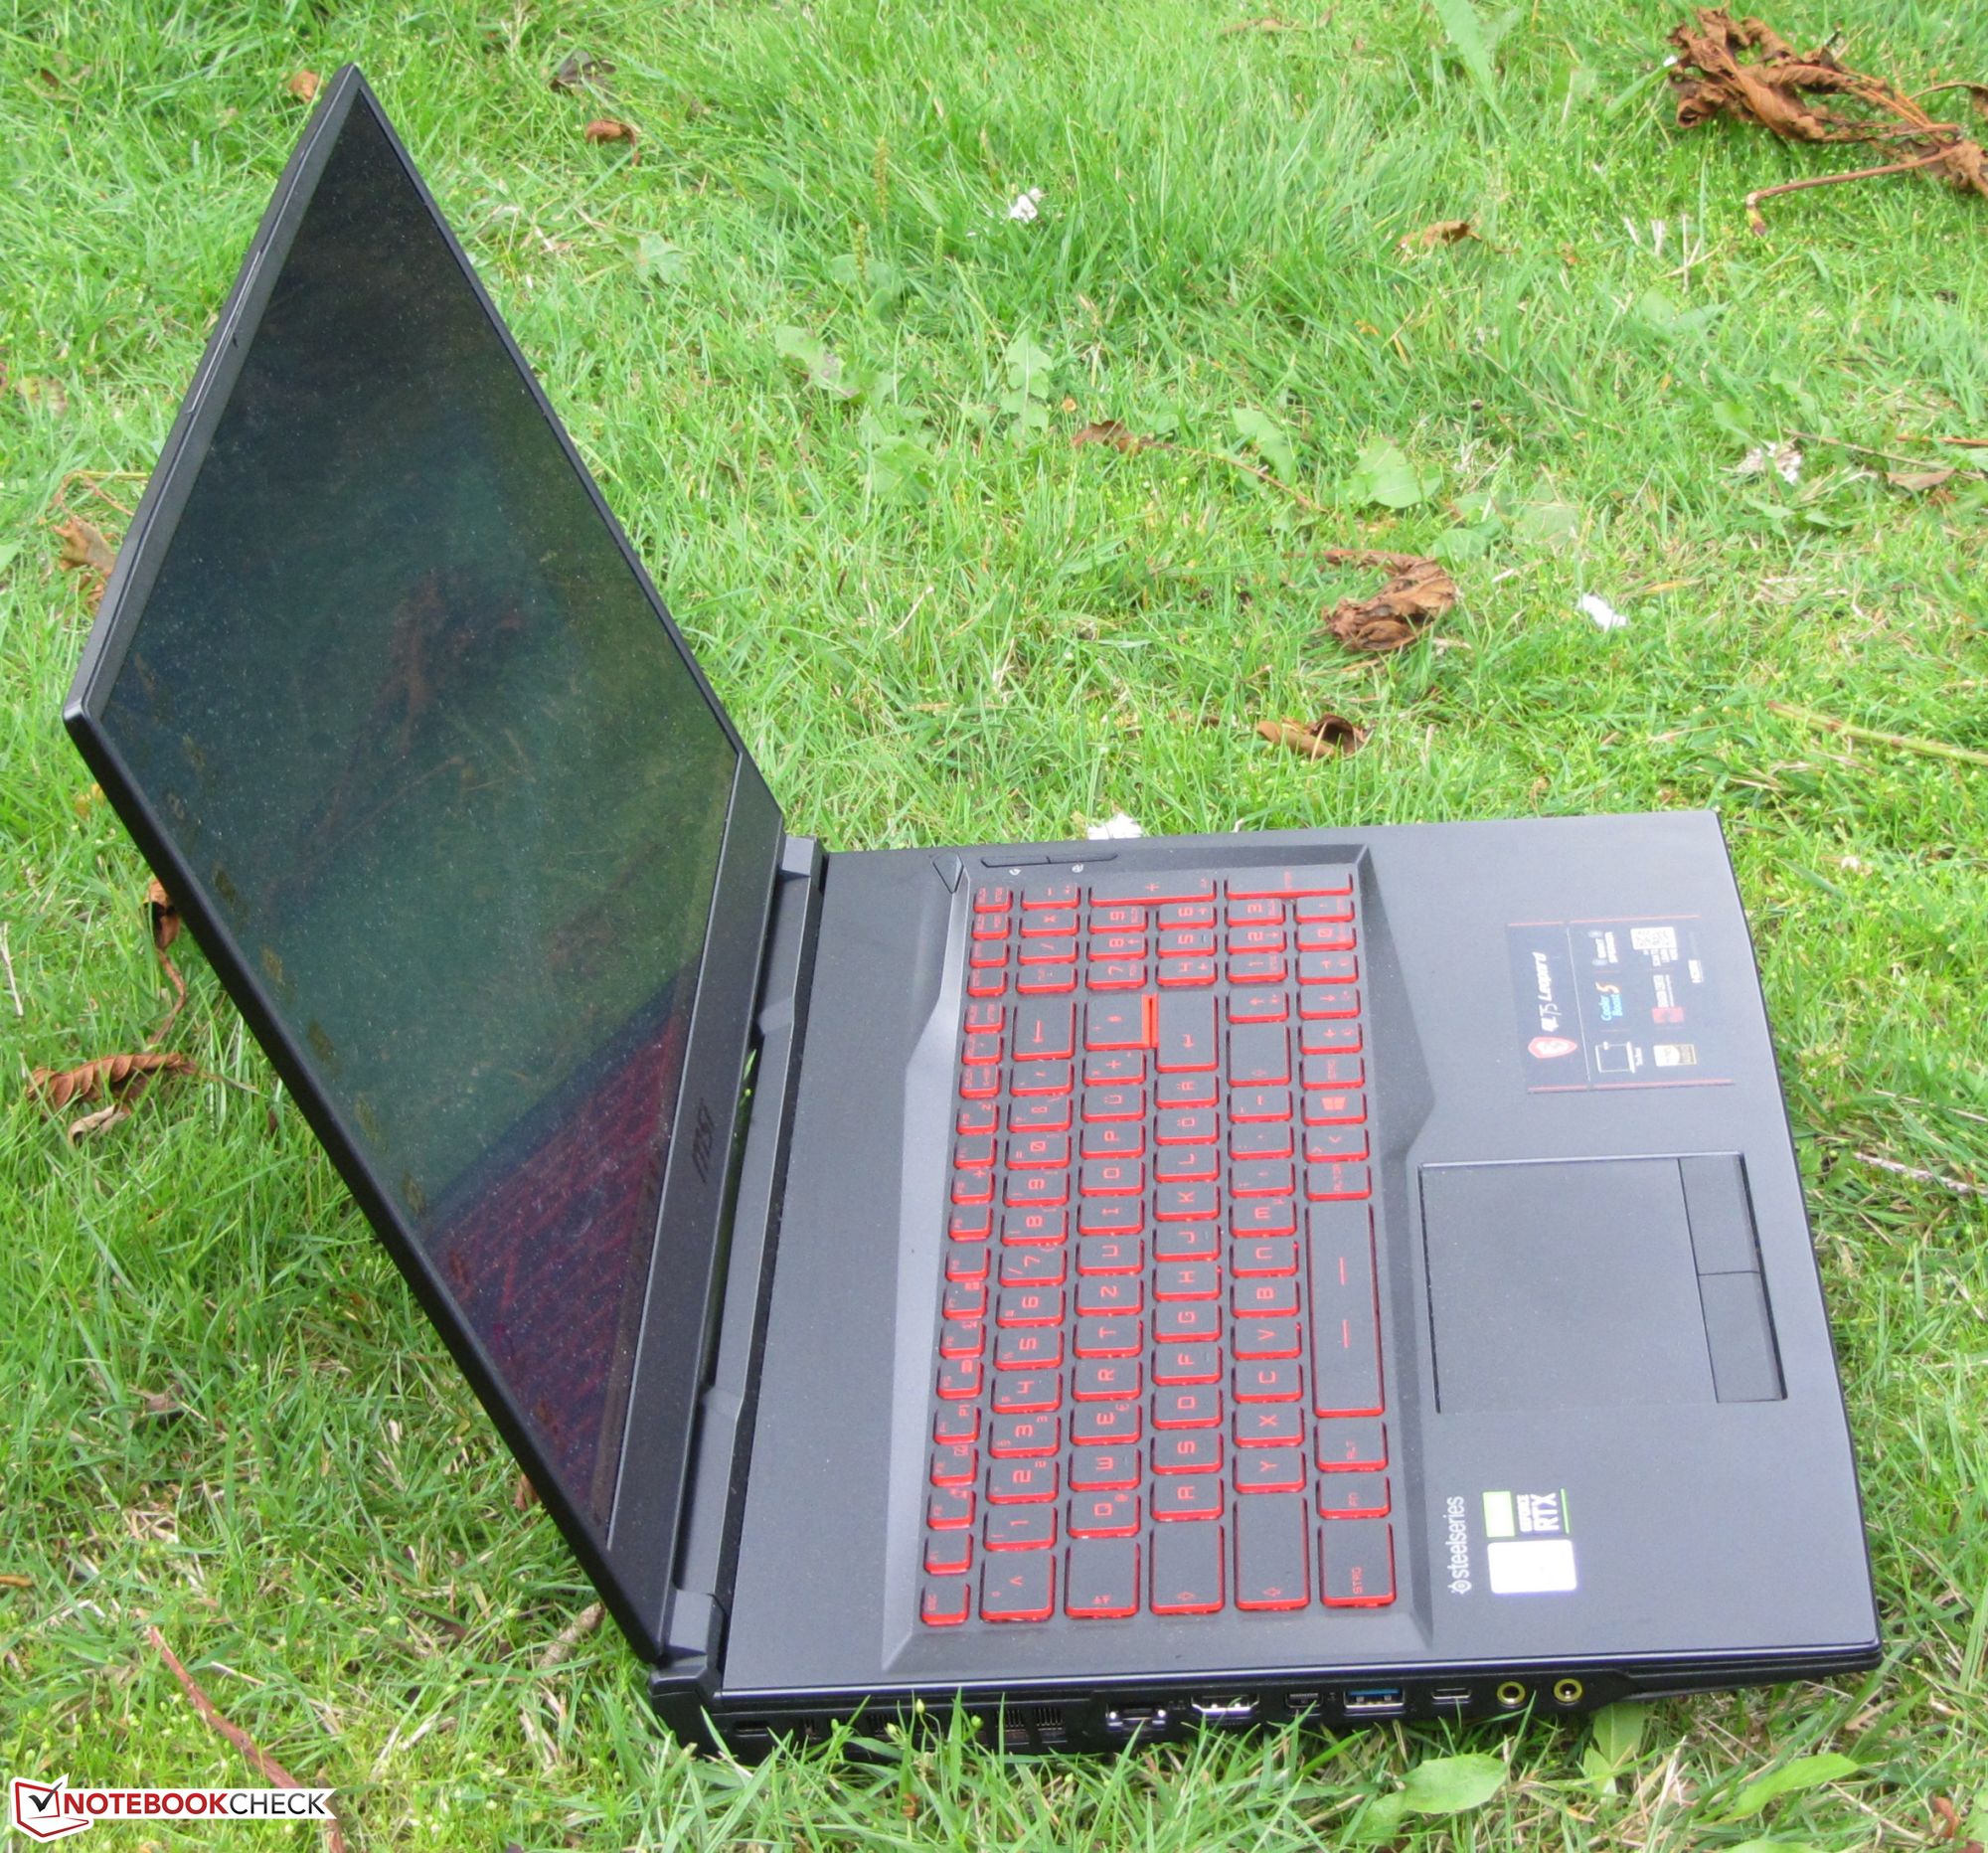
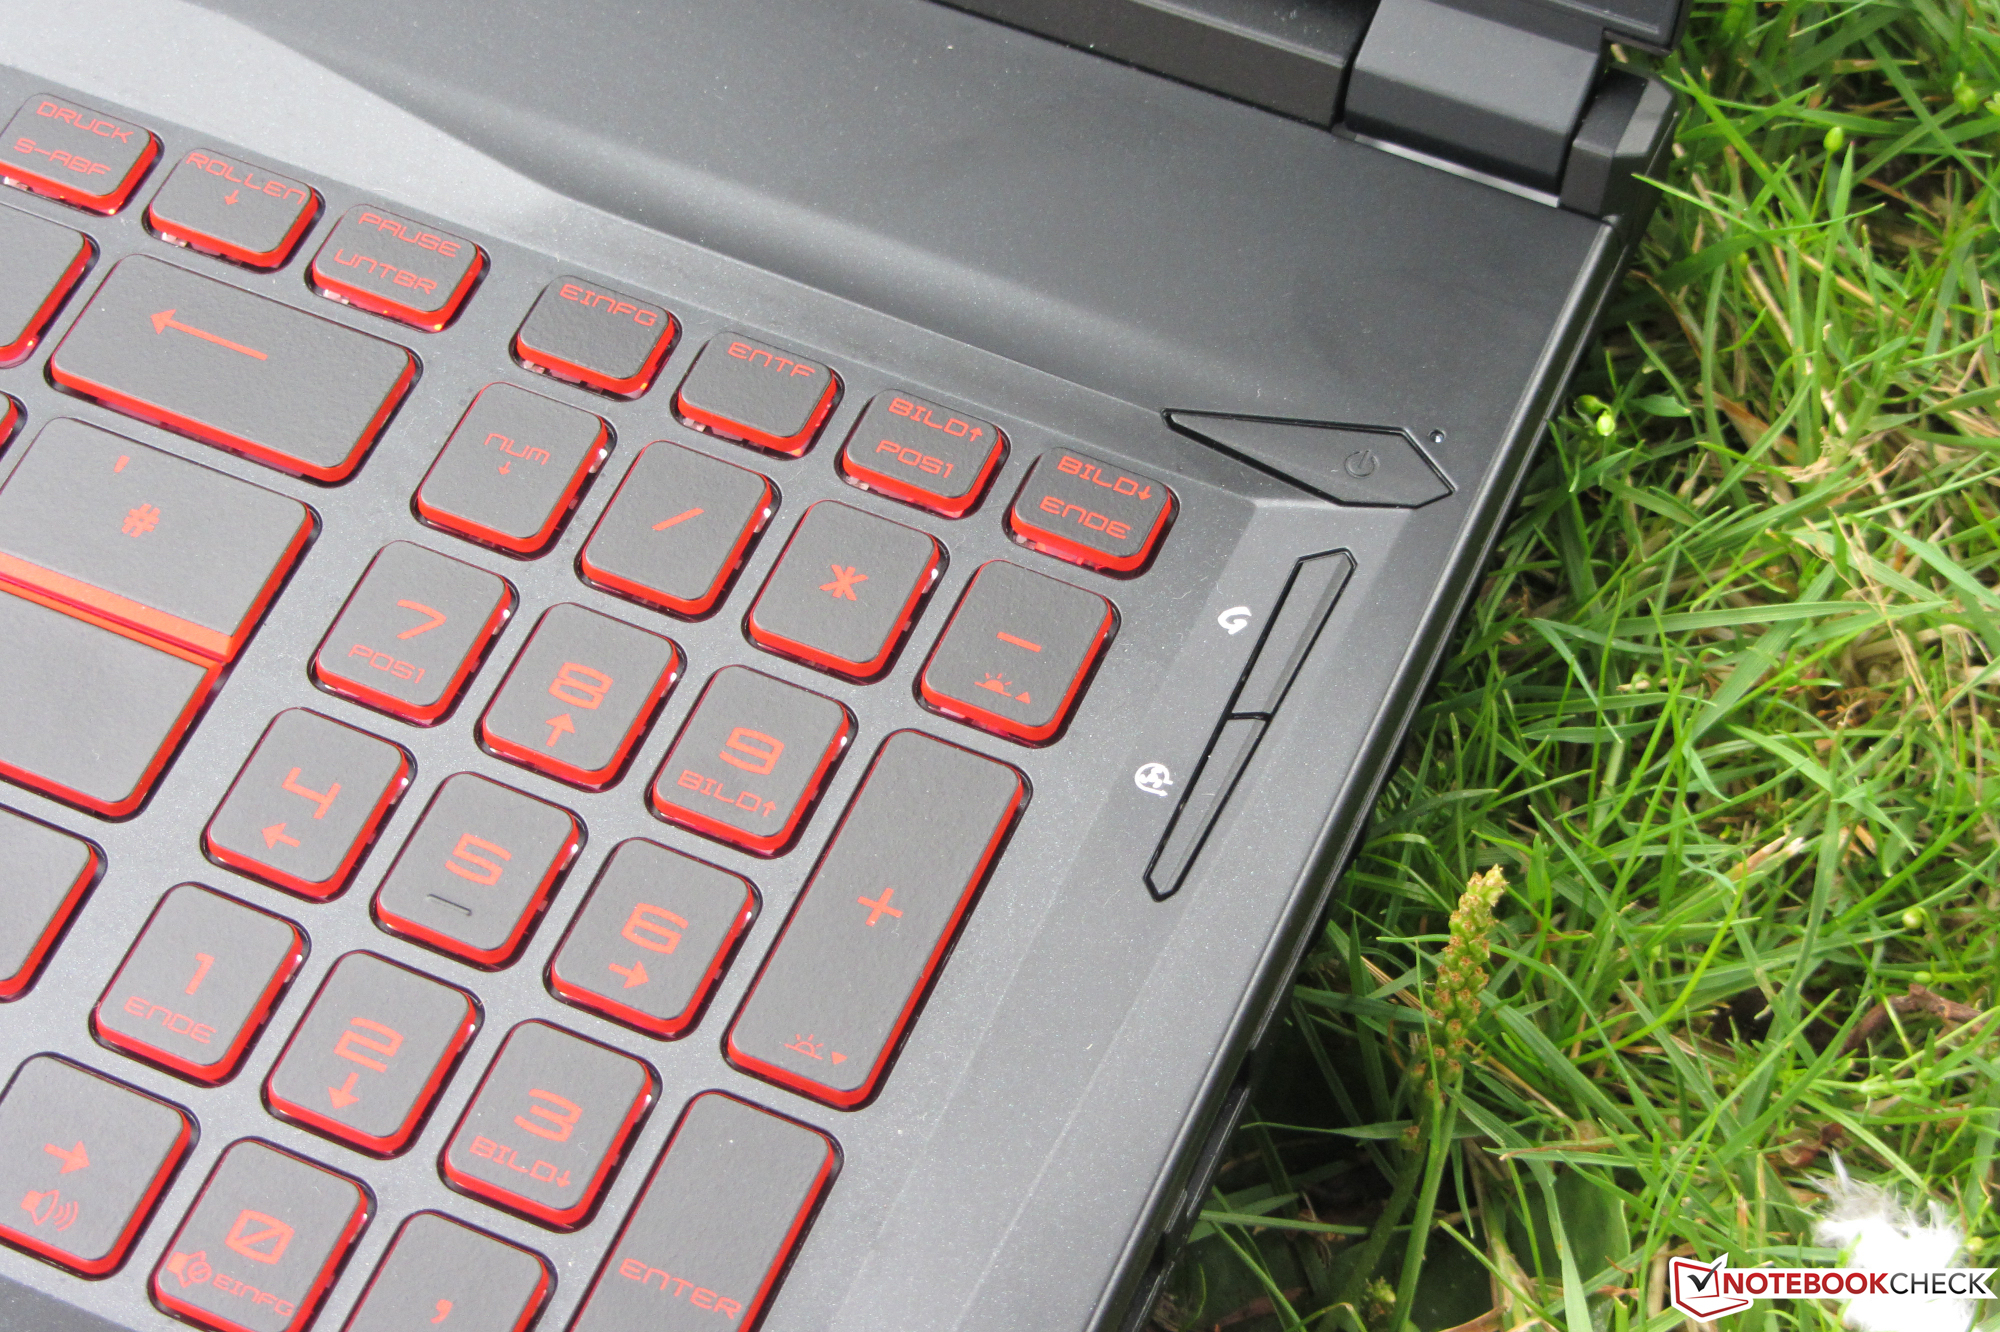
Az üzemidő nem a legjobb, de egy gamer notebookhoz képest rendben van. A hátérvilágítású billentyűzet bizonyította a mindennapi használhatóságát. Viszont nem kínál RGB világítást, mint az elődje és a testvérmodellje, és csak monokróm piros világítása van. Emellett a laptopról hiányzik a Thunderbolt 3 port. Az MSI csak egyetlen USB-C 3.2 Gen 2 portot telepített, és ez nem rendelkezik DisplayPort támogatással az USB-C-n vagy a Power Delivery-n keresztül.
MSI GL75 10SFR
- 07/31/2020 v7 (old)
Sascha Mölck
Price comparison

