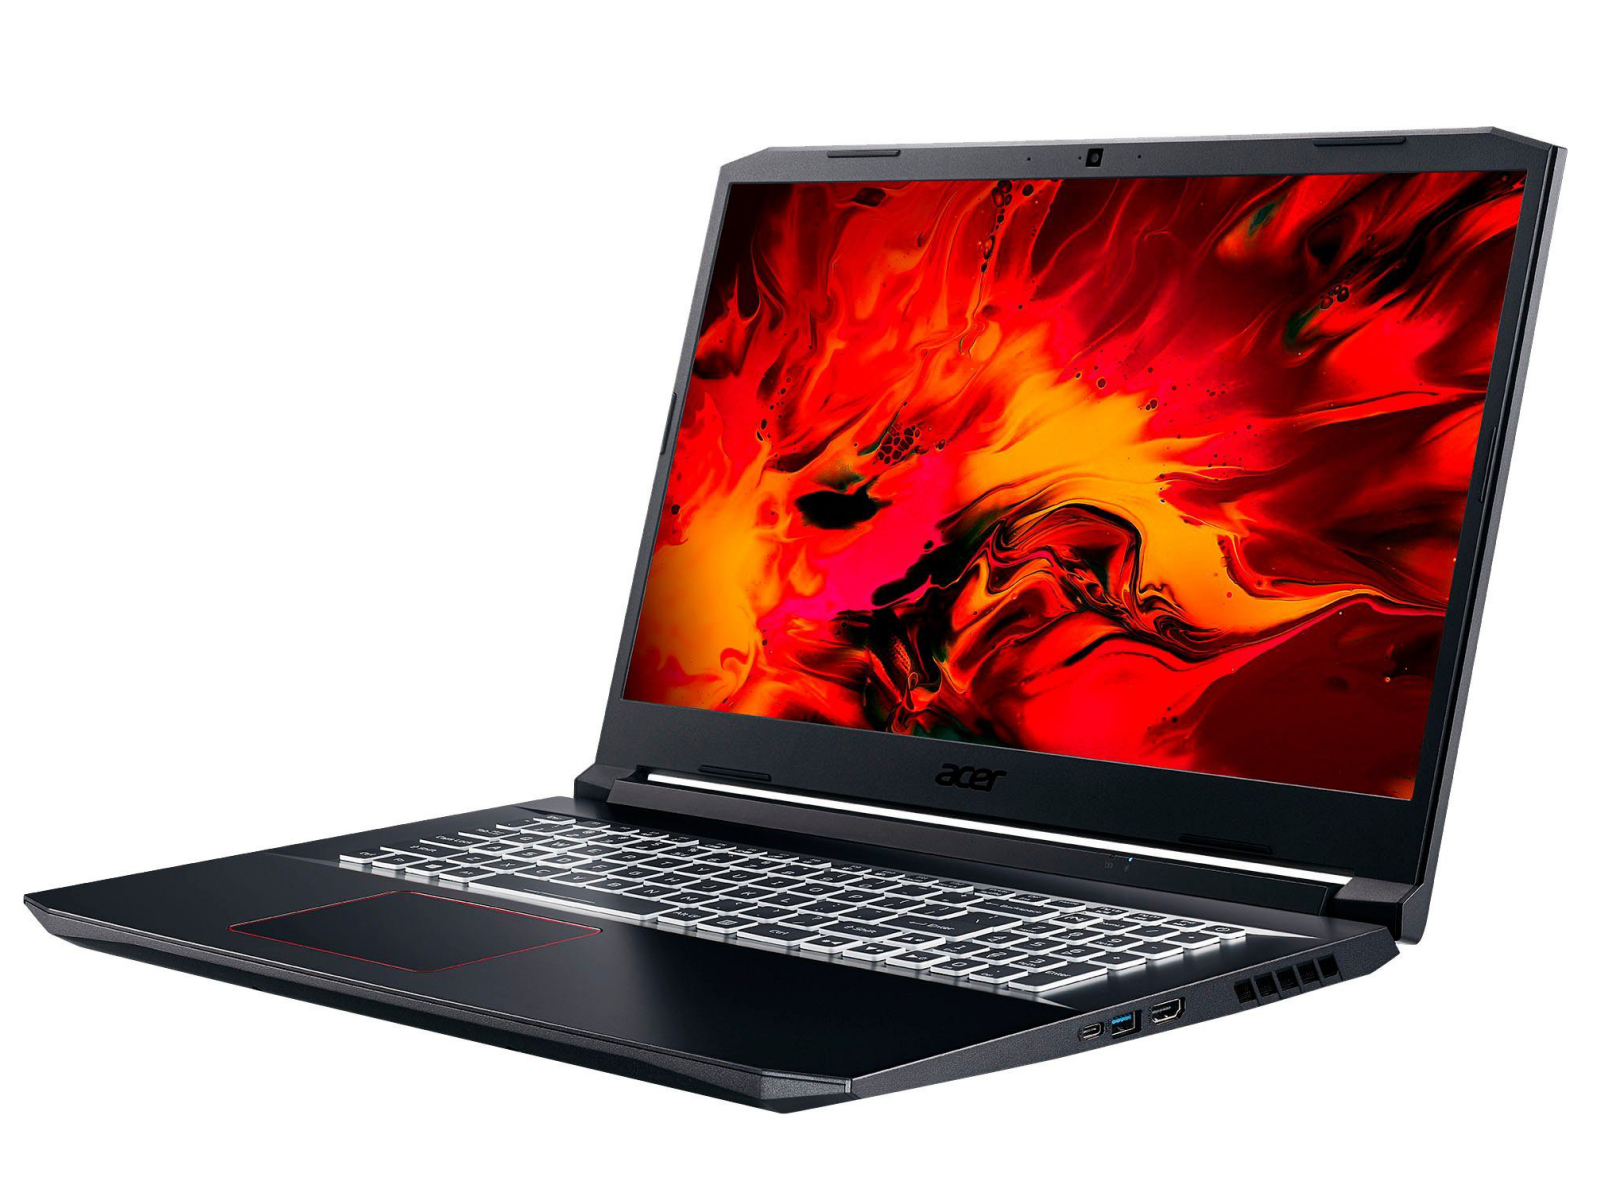
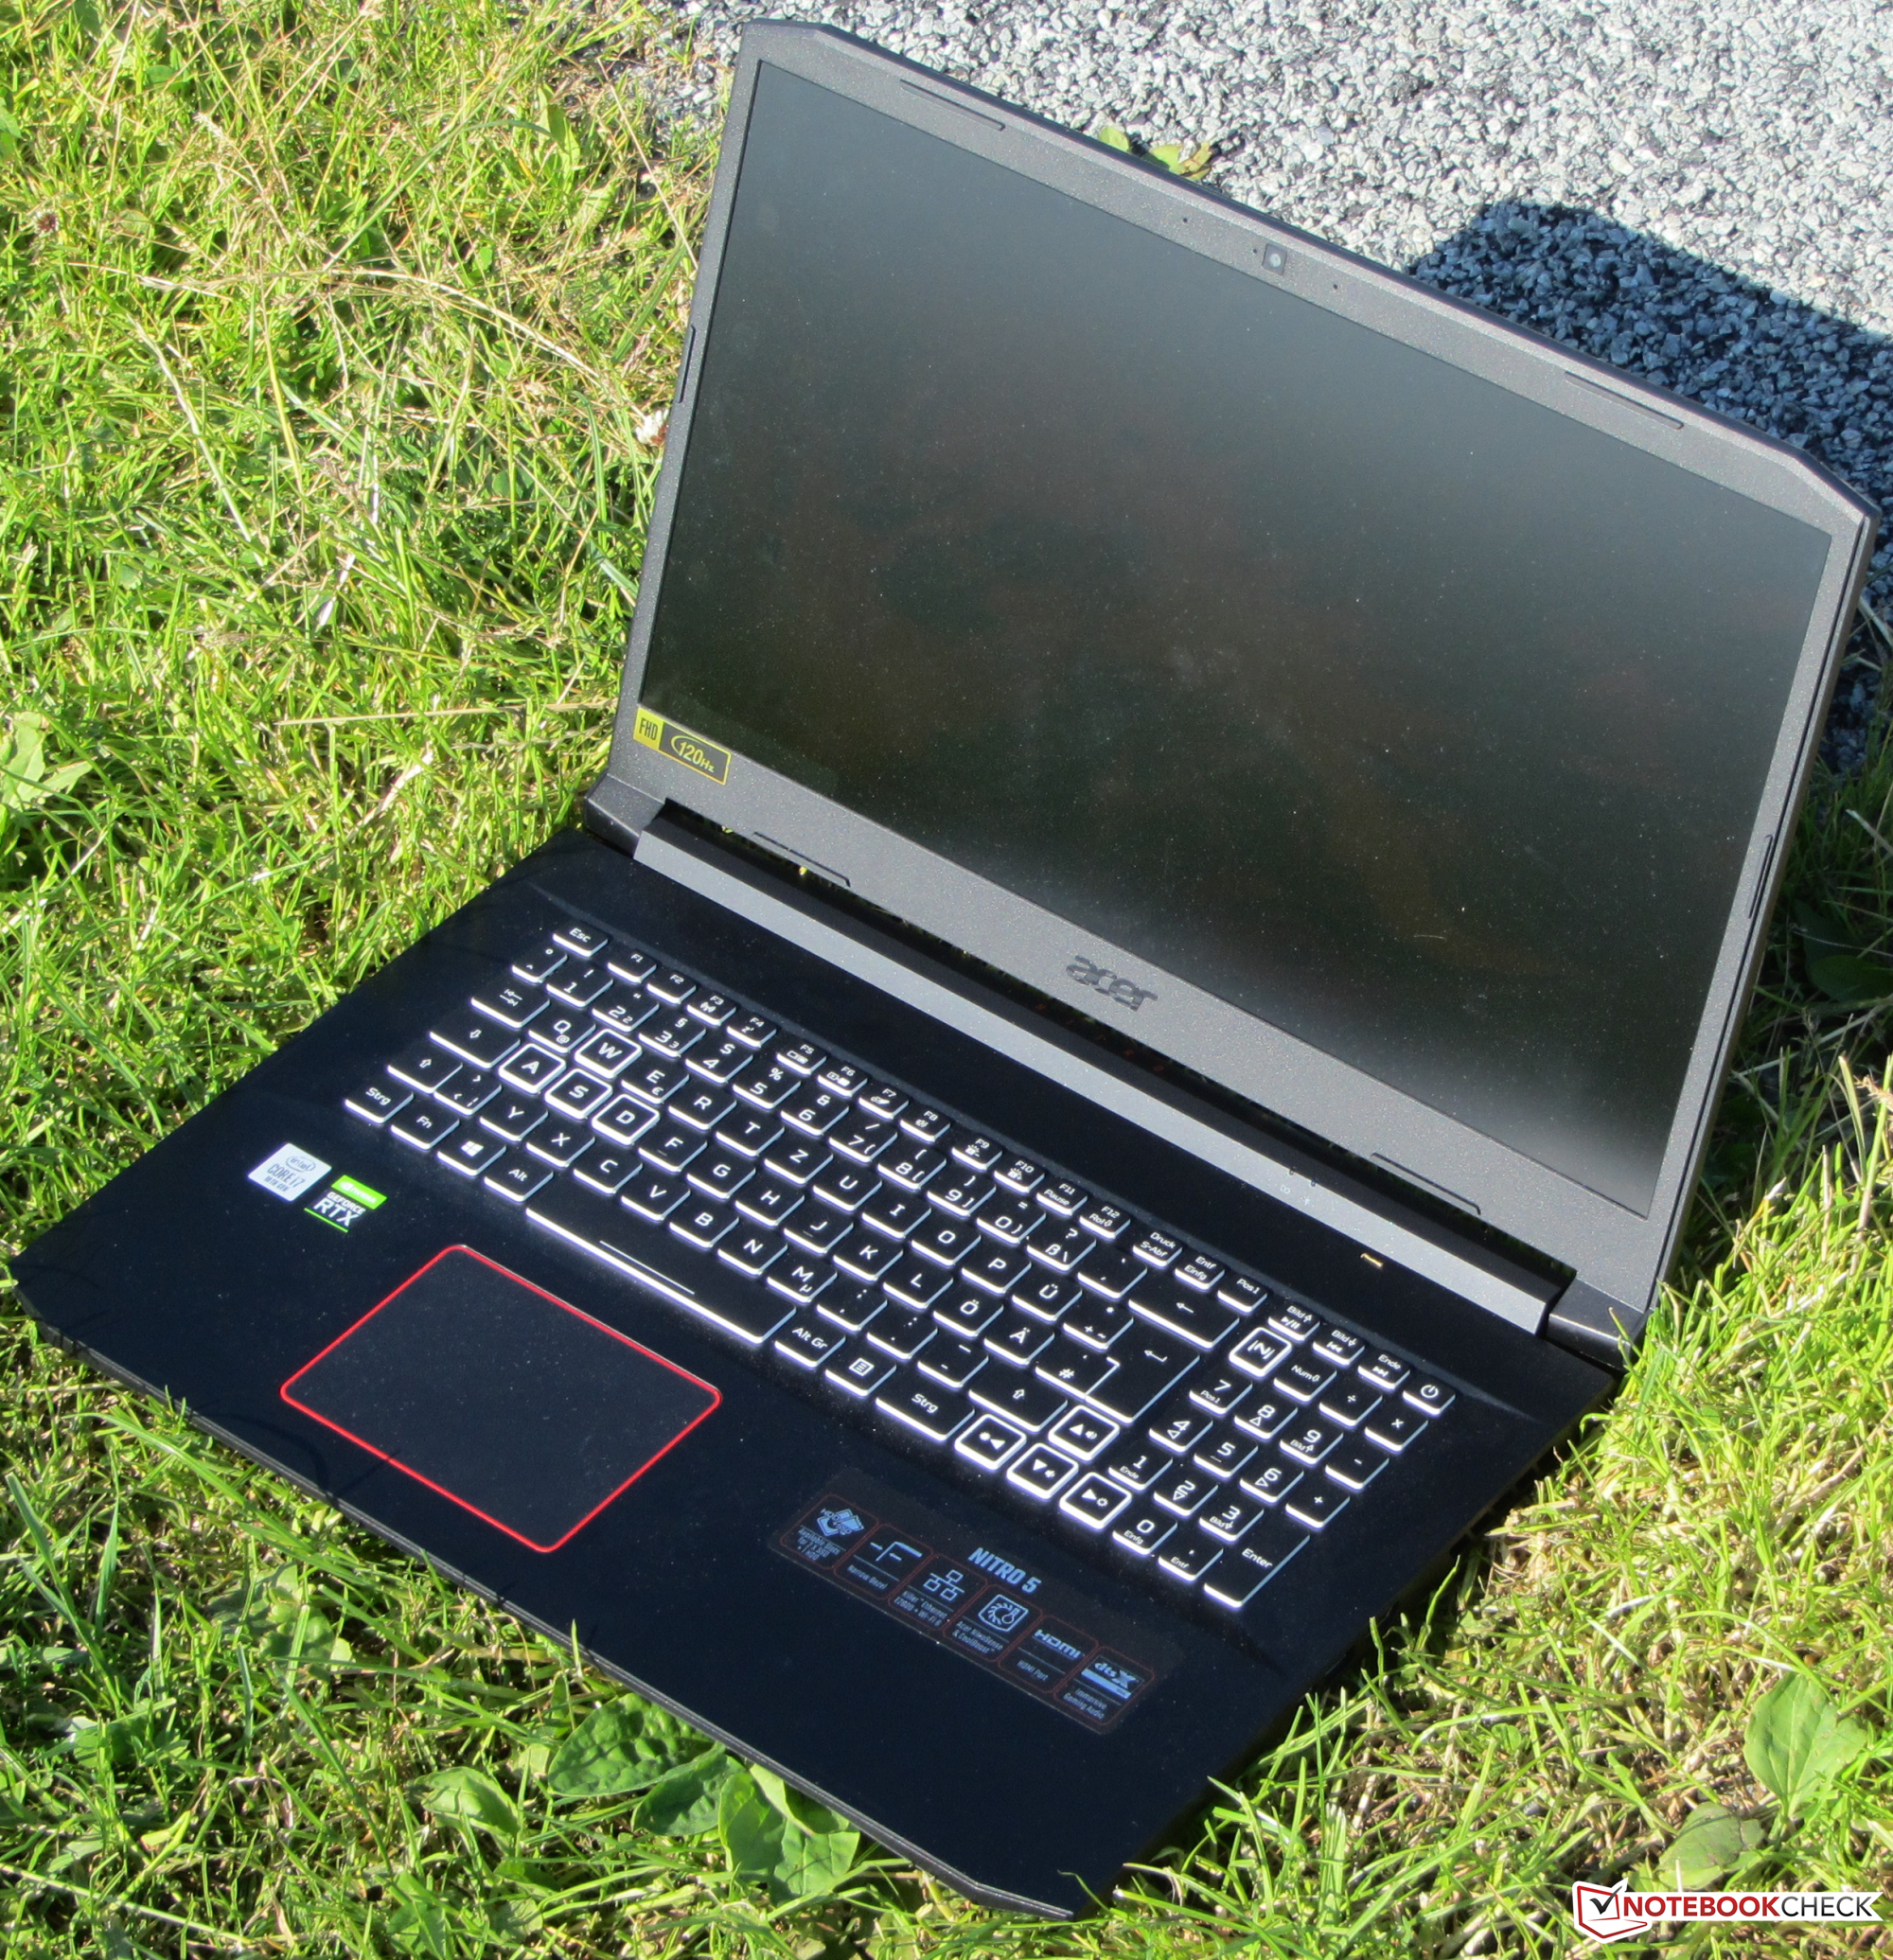
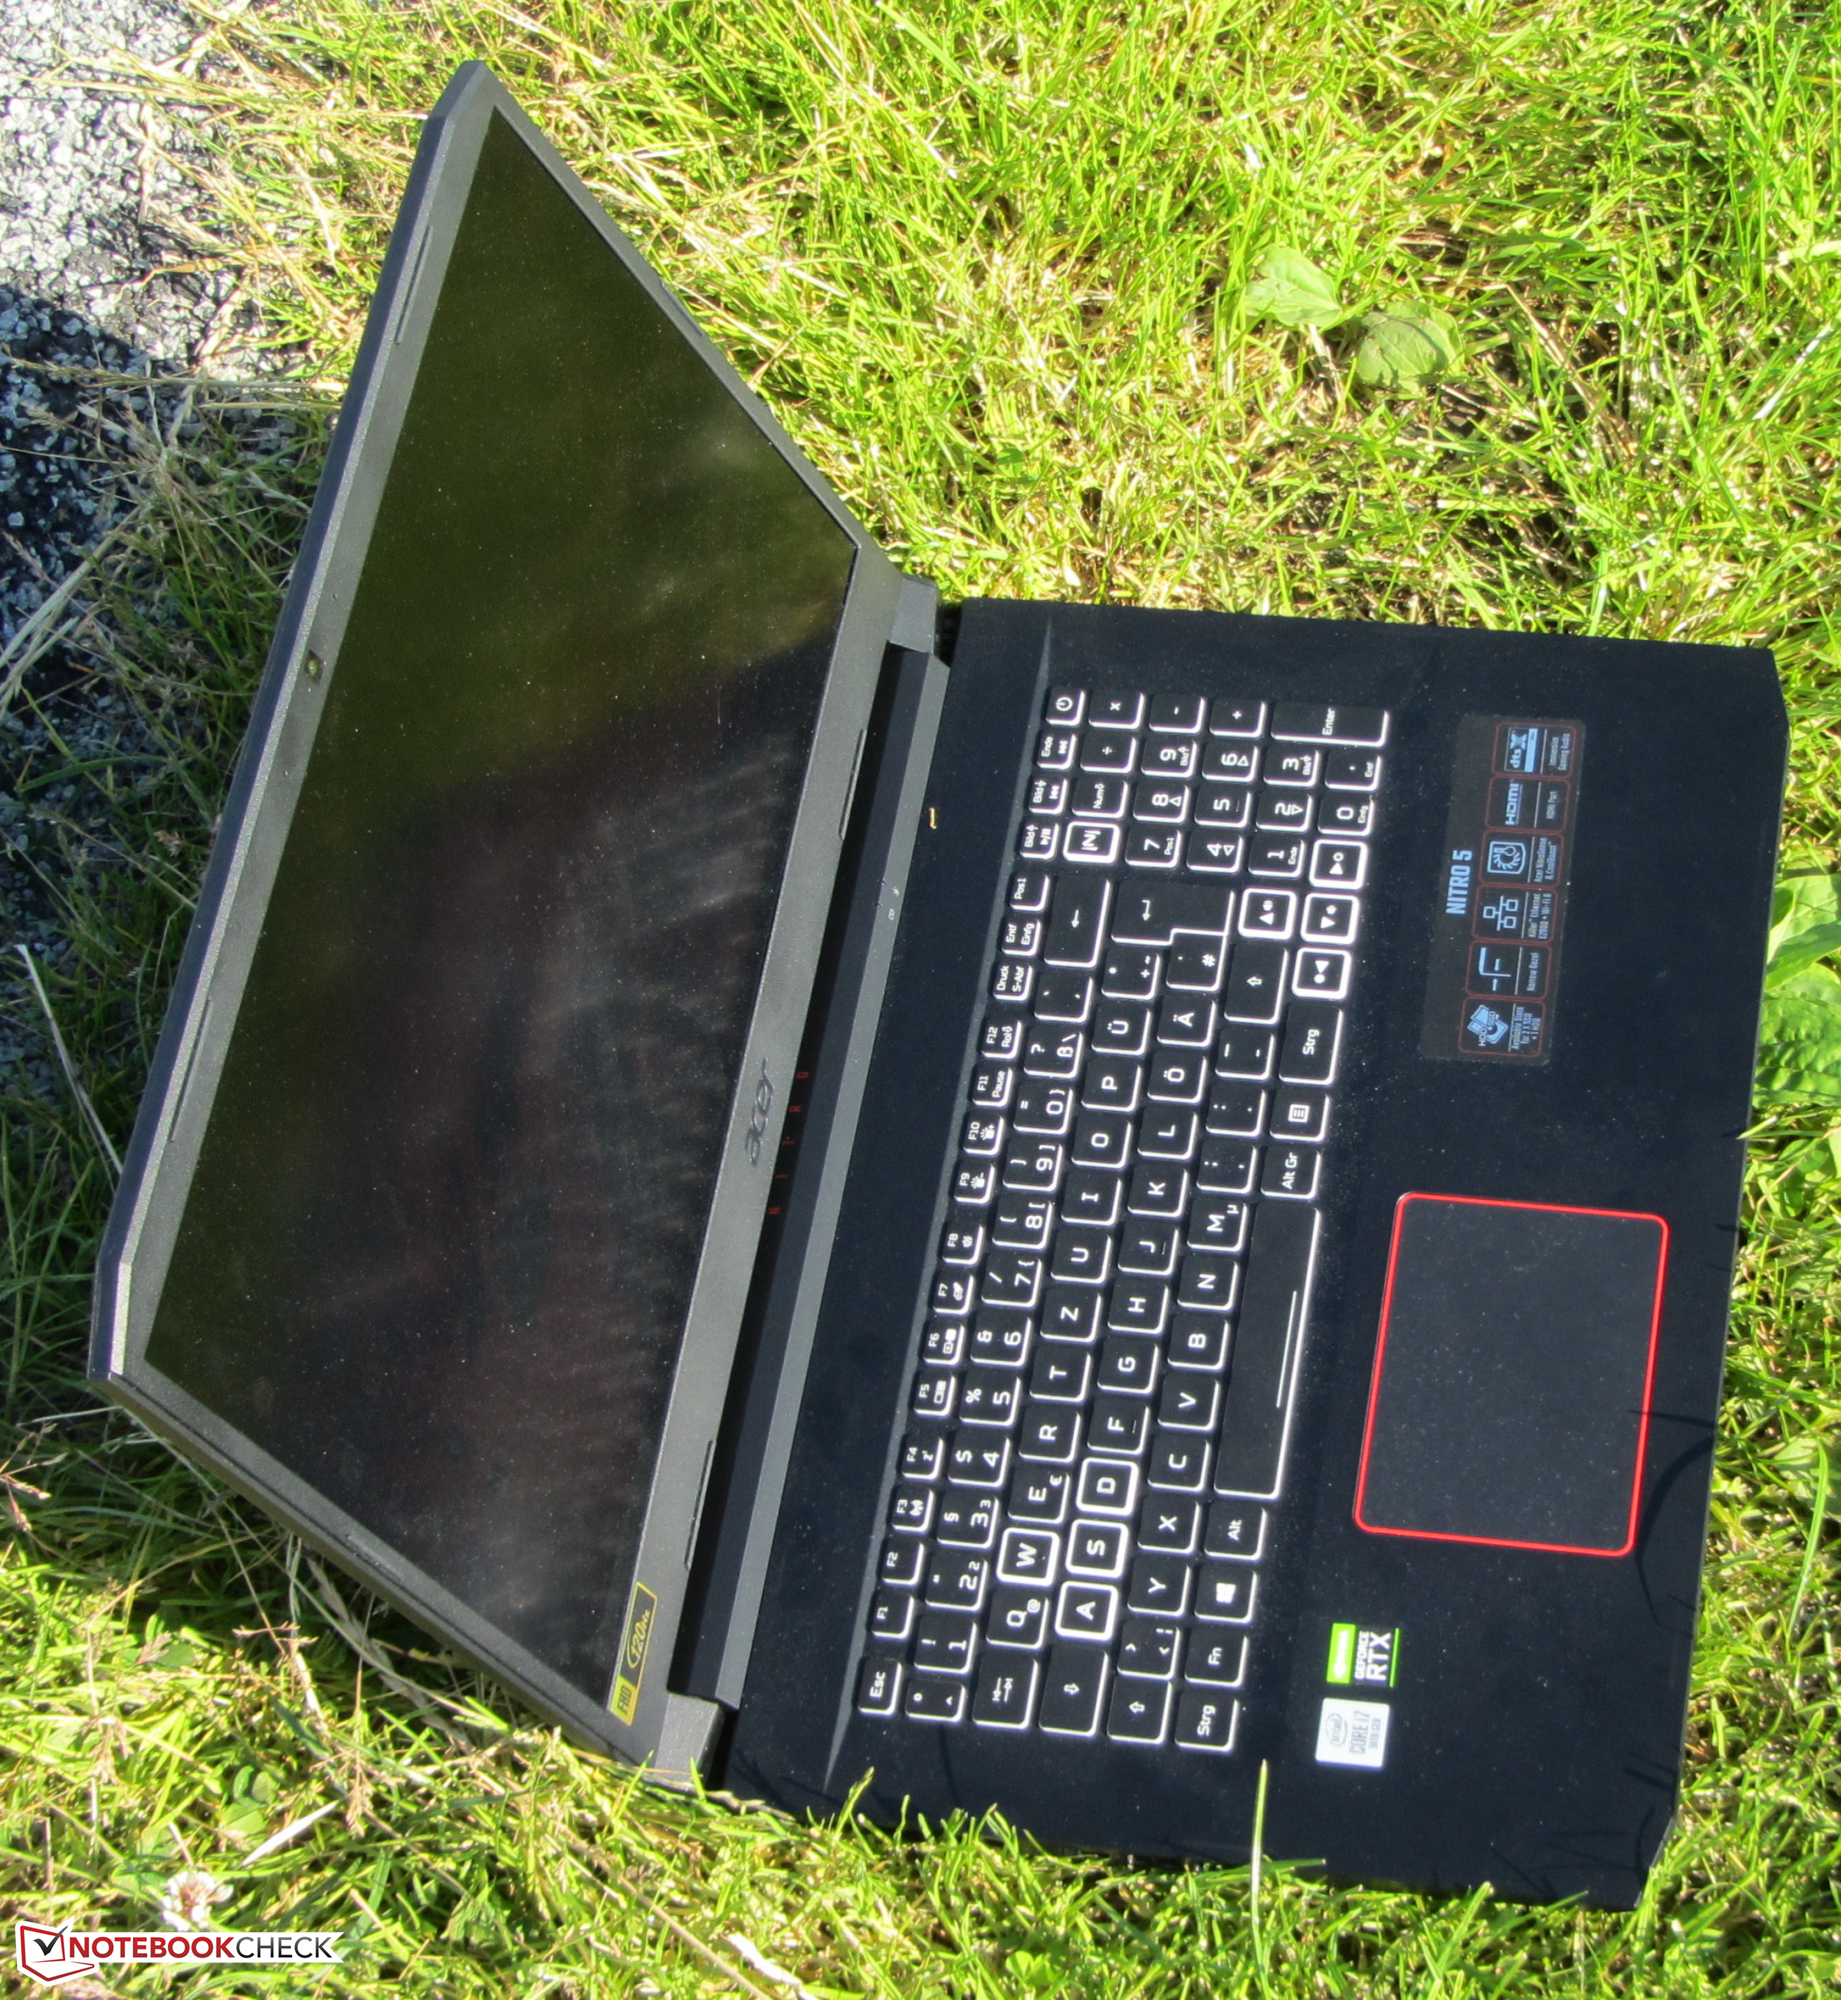
Acer Nitro 5 AN517-52 rövid értékelés: Sokoldalú gamer notebook jó üzemidővel
Értékelés | Dátum | Modell | Súly | Magasság | Méret | Felbontás | Legjobb ár |
|---|---|---|---|---|---|---|---|
| 80.6 % v7 (old) | 09/2020 | Acer Nitro 5 AN517-52-77DS i7-10750H, GeForce RTX 2060 Mobile | 2.2 kg | 24.9 mm | 17.30" | 1920x1080 | |
| 82.9 % v7 (old) | 07/2020 | Asus TUF A17 FA706IU-AS76 R7 4800H, GeForce GTX 1660 Ti Mobile | 2.6 kg | 26 mm | 17.30" | 1920x1080 | |
| 83.2 % v7 (old) | Schenker XMG Pro 17 PB71RD-G i7-9750H, GeForce RTX 2060 Mobile | 2.8 kg | 30 mm | 17.30" | 1920x1080 | ||
| 81.6 % v7 (old) | 09/2019 | HP Pavilion Gaming 17-cd0085cl i7-9750H, GeForce GTX 1660 Ti Max-Q | 2.8 kg | 25 mm | 17.30" | 1920x1080 | |
| 82.3 % v7 (old) | Lenovo Legion Y540-17IRH i5-9300H, GeForce GTX 1660 Ti Mobile | 2.8 kg | 26.3 mm | 17.30" | 1920x1080 |
| Networking | |
| iperf3 transmit AX12 | |
| Schenker XMG Pro 17 PB71RD-G | |
| Átlagos Intel Wi-Fi 6 AX201 (49.8 - 1775, n=324) | |
| Lenovo Legion Y540-17IRH | |
| Acer Nitro 5 AN517-52-77DS | |
| HP Pavilion Gaming 17-cd0085cl | |
| Acer Aspire Nitro 5 AN517-51-7887 | |
| Asus TUF A17 FA706IU-AS76 | |
| iperf3 receive AX12 | |
| Schenker XMG Pro 17 PB71RD-G | |
| Átlagos Intel Wi-Fi 6 AX201 (136 - 1743, n=324) | |
| Acer Nitro 5 AN517-52-77DS | |
| Lenovo Legion Y540-17IRH | |
| Acer Aspire Nitro 5 AN517-51-7887 | |
| HP Pavilion Gaming 17-cd0085cl | |
| Asus TUF A17 FA706IU-AS76 | |


| |||||||||||||||||||||||||
Fényerő megoszlás: 85 %
Centrumban: 263 cd/m²
Kontraszt: 560:1 (Fekete: 0.47 cd/m²)
ΔE ColorChecker Calman: 5.07 | ∀{0.5-29.43 Ø4.73}
calibrated: 4.9
ΔE Greyscale Calman: 2.55 | ∀{0.09-98 Ø4.97}
59% sRGB (Argyll 1.6.3 3D)
37% AdobeRGB 1998 (Argyll 1.6.3 3D)
40.77% AdobeRGB 1998 (Argyll 3D)
58.9% sRGB (Argyll 3D)
39.47% Display P3 (Argyll 3D)
Gamma: 2.37
CCT: 6446 K
| Acer Nitro 5 AN517-52-77DS IPS, 1920x1080, 17.3" | Asus TUF A17 FA706IU-AS76 IPS, 1920x1080, 17.3" | Lenovo Legion Y540-17IRH IPS, 1920x1080, 17.3" | Schenker XMG Pro 17 PB71RD-G IPS, 1920x1080, 17.3" | HP Pavilion Gaming 17-cd0085cl IPS, 1920x1080, 17.3" | Acer Aspire Nitro 5 AN517-51-7887 IPS, 1920x1080, 17.3" | |
|---|---|---|---|---|---|---|
| Display | 2% | 72% | 56% | 57% | 57% | |
| Display P3 Coverage (%) | 39.47 | 40.55 3% | 69 75% | 62.8 59% | 63.3 60% | 62.7 59% |
| sRGB Coverage (%) | 58.9 | 59.7 1% | 98.3 67% | 89.8 52% | 90.2 53% | 92.5 57% |
| AdobeRGB 1998 Coverage (%) | 40.77 | 41.89 3% | 70.7 73% | 64.2 57% | 64.3 58% | 63.5 56% |
| Response Times | 31% | 50% | 53% | 18% | -3% | |
| Response Time Grey 50% / Grey 80% * (ms) | 35 ? | 22.4 ? 36% | 18 ? 49% | 16.8 ? 52% | 31.6 ? 10% | 37 ? -6% |
| Response Time Black / White * (ms) | 26 ? | 19.2 ? 26% | 12.8 ? 51% | 12 ? 54% | 19.6 ? 25% | 26 ? -0% |
| PWM Frequency (Hz) | ||||||
| Screen | 15% | 44% | 27% | 28% | 25% | |
| Brightness middle (cd/m²) | 263 | 264.8 1% | 286 9% | 274 4% | 299.6 14% | 407 55% |
| Brightness (cd/m²) | 246 | 253 3% | 282 15% | 273 11% | 285 16% | 364 48% |
| Brightness Distribution (%) | 85 | 90 6% | 87 2% | 95 12% | 86 1% | 84 -1% |
| Black Level * (cd/m²) | 0.47 | 0.31 34% | 0.19 60% | 0.26 45% | 0.33 30% | 0.3 36% |
| Contrast (:1) | 560 | 854 53% | 1505 169% | 1054 88% | 908 62% | 1357 142% |
| Colorchecker dE 2000 * | 5.07 | 4.73 7% | 3.57 30% | 4.62 9% | 3.68 27% | 4.55 10% |
| Colorchecker dE 2000 max. * | 20.5 | 18.89 8% | 7.5 63% | 7.66 63% | 8.05 61% | 12.44 39% |
| Colorchecker dE 2000 calibrated * | 4.9 | 4.64 5% | 1.31 73% | 1.93 61% | 3.15 36% | |
| Greyscale dE 2000 * | 2.55 | 1.4 45% | 4.51 -77% | 5.3 -108% | 3.8 -49% | 7.61 -198% |
| Gamma | 2.37 93% | 2.16 102% | 2.36 93% | 2.34 94% | 2.12 104% | 2.51 88% |
| CCT | 6446 101% | 6641 98% | 7411 88% | 7619 85% | 7240 90% | 7212 90% |
| Color Space (Percent of AdobeRGB 1998) (%) | 37 | 38.4 4% | 64 73% | 58 57% | 58.1 57% | 59 59% |
| Color Space (Percent of sRGB) (%) | 59 | 59.3 1% | 98 66% | 90 53% | 89.8 52% | 92 56% |
| Teljes átlag (program / beállítások) | 16% /
15% | 55% /
50% | 45% /
36% | 34% /
32% | 26% /
27% |
* ... a kisebb jobb
Megjelenítési válaszidők
| ↔ Válaszidő Fekete-fehér | ||
|---|---|---|
| 26 ms ... emelkedés és süllyedés ↘ kombinálva | ↗ 14 ms emelkedés | 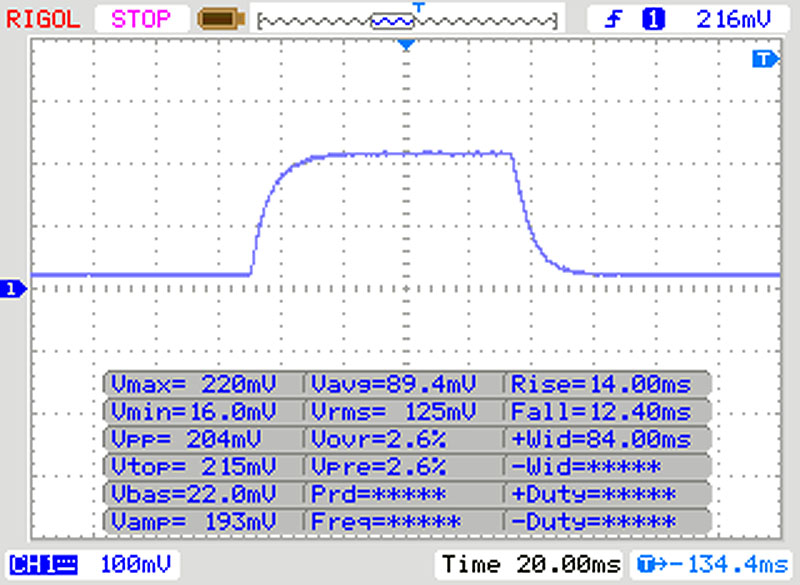 |
| ↘ 12 ms ősz | ||
| A képernyő viszonylag lassú reakciósebességet mutat tesztjeinkben, és túl lassú lehet a játékosok számára. Összehasonlításképpen, az összes tesztelt eszköz 0.1 (minimum) és 240 (maximum) ms között mozog. » 62 % of all devices are better. Ez azt jelenti, hogy a mért válaszidő rosszabb, mint az összes vizsgált eszköz átlaga (19.9 ms). | ||
| ↔ Válaszidő 50% szürke és 80% szürke között | ||
| 35 ms ... emelkedés és süllyedés ↘ kombinálva | ↗ 17 ms emelkedés | 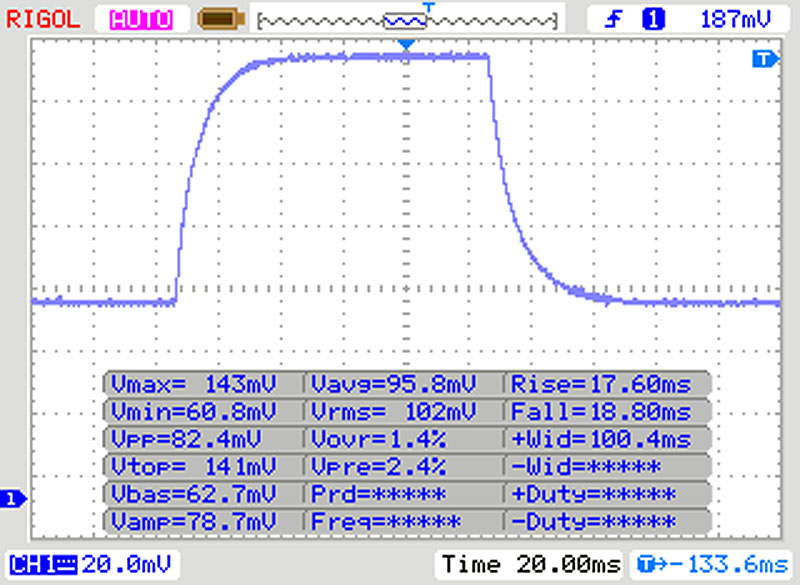 |
| ↘ 18 ms ősz | ||
| A képernyő lassú reakciósebességet mutat tesztjeinkben, és nem lesz kielégítő a játékosok számára. Összehasonlításképpen, az összes tesztelt eszköz 0.165 (minimum) és 636 (maximum) ms között mozog. » 49 % of all devices are better. Ez azt jelenti, hogy a mért válaszidő rosszabb, mint az összes vizsgált eszköz átlaga (31.1 ms). | ||
Képernyő villogása / PWM (impulzusszélesség-moduláció)
| Képernyő villogása / PWM nem érzékelhető | 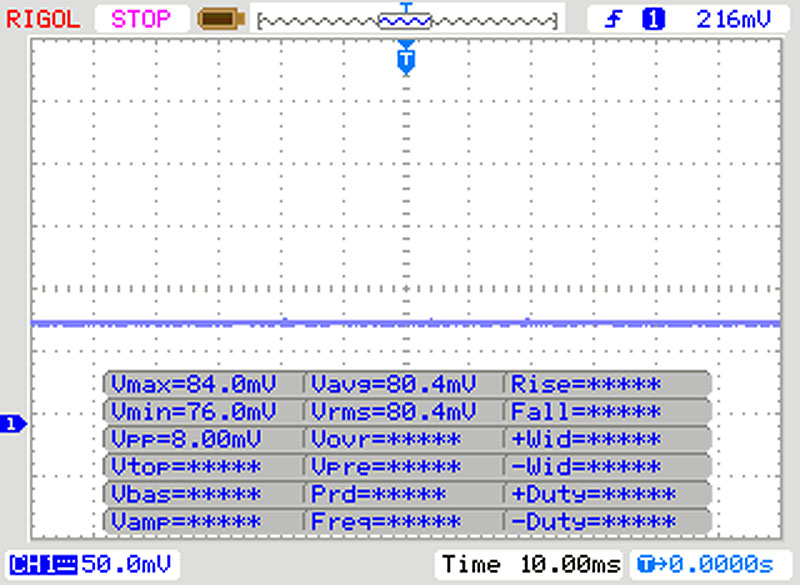 | ||
Összehasonlításképpen: az összes tesztelt eszköz 52 %-a nem használja a PWM-et a kijelző elsötétítésére. Ha PWM-et észleltek, akkor átlagosan 7794 (minimum: 5 - maximum: 343500) Hz-t mértek. | |||
| Cinebench R15 | |
| CPU Single 64Bit | |
| Az osztály átlaga Gaming (188.8 - 343, n=111, az elmúlt 2 évben) | |
| Átlagos Intel Core i7-10750H (184 - 213, n=45) | |
| Acer Nitro 5 AN517-52-77DS | |
| HP Pavilion Gaming 17-cd0085cl | |
| Asus TUF A17 FA706IU-AS76 | |
| Acer Aspire Nitro 5 AN517-51-7887 | |
| Schenker XMG Pro 17 PB71RD-G | |
| Lenovo Legion Y540-17IRH | |
| CPU Multi 64Bit | |
| Az osztály átlaga Gaming (1578 - 6271, n=111, az elmúlt 2 évben) | |
| Asus TUF A17 FA706IU-AS76 | |
| Acer Nitro 5 AN517-52-77DS | |
| Átlagos Intel Core i7-10750H (804 - 1418, n=50) | |
| HP Pavilion Gaming 17-cd0085cl | |
| Schenker XMG Pro 17 PB71RD-G | |
| Acer Aspire Nitro 5 AN517-51-7887 | |
| Lenovo Legion Y540-17IRH | |
| Blender - v2.79 BMW27 CPU | |
| Acer Aspire Nitro 5 AN517-51-7887 | |
| Schenker XMG Pro 17 PB71RD-G | |
| Átlagos Intel Core i7-10750H (322 - 587, n=43) | |
| Acer Nitro 5 AN517-52-77DS | |
| Asus TUF A17 FA706IU-AS76 | |
| Az osztály átlaga Gaming (80 - 330, n=109, az elmúlt 2 évben) | |
| 7-Zip 18.03 | |
| 7z b 4 -mmt1 | |
| Az osztály átlaga Gaming (4199 - 7436, n=110, az elmúlt 2 évben) | |
| Átlagos Intel Core i7-10750H (4504 - 5470, n=43) | |
| Acer Nitro 5 AN517-52-77DS | |
| Acer Aspire Nitro 5 AN517-51-7887 | |
| Asus TUF A17 FA706IU-AS76 | |
| Schenker XMG Pro 17 PB71RD-G | |
| 7z b 4 | |
| Az osztály átlaga Gaming (33491 - 148086, n=110, az elmúlt 2 évben) | |
| Asus TUF A17 FA706IU-AS76 | |
| Átlagos Intel Core i7-10750H (26040 - 37345, n=43) | |
| Acer Nitro 5 AN517-52-77DS | |
| Acer Aspire Nitro 5 AN517-51-7887 | |
| Schenker XMG Pro 17 PB71RD-G | |
| Cinebench R20 | |
| CPU (Single Core) | |
| Az osztály átlaga Gaming (442 - 895, n=111, az elmúlt 2 évben) | |
| Acer Nitro 5 AN517-52-77DS | |
| Asus TUF A17 FA706IU-AS76 | |
| Átlagos Intel Core i7-10750H (431 - 504, n=43) | |
| Acer Aspire Nitro 5 AN517-51-7887 | |
| Lenovo Legion Y540-17IRH | |
| Schenker XMG Pro 17 PB71RD-G | |
| CPU (Multi Core) | |
| Az osztály átlaga Gaming (4029 - 16108, n=111, az elmúlt 2 évben) | |
| Asus TUF A17 FA706IU-AS76 | |
| Acer Nitro 5 AN517-52-77DS | |
| Átlagos Intel Core i7-10750H (1749 - 3325, n=43) | |
| Schenker XMG Pro 17 PB71RD-G | |
| Acer Aspire Nitro 5 AN517-51-7887 | |
| Lenovo Legion Y540-17IRH | |
| Geekbench 5.5 | |
| Single-Core | |
| Az osztály átlaga Gaming (986 - 2474, n=110, az elmúlt 2 évben) | |
| Átlagos Intel Core i7-10750H (1114 - 1333, n=43) | |
| Acer Nitro 5 AN517-52-77DS | |
| Asus TUF A17 FA706IU-AS76 | |
| Schenker XMG Pro 17 PB71RD-G | |
| Multi-Core | |
| Az osztály átlaga Gaming (6460 - 27010, n=110, az elmúlt 2 évben) | |
| Asus TUF A17 FA706IU-AS76 | |
| Acer Nitro 5 AN517-52-77DS | |
| Átlagos Intel Core i7-10750H (4443 - 6674, n=43) | |
| Schenker XMG Pro 17 PB71RD-G | |
| HWBOT x265 Benchmark v2.2 - 4k Preset | |
| Az osztály átlaga Gaming (11.5 - 44.3, n=110, az elmúlt 2 évben) | |
| Asus TUF A17 FA706IU-AS76 | |
| Átlagos Intel Core i7-10750H (5.54 - 11.6, n=43) | |
| Acer Nitro 5 AN517-52-77DS | |
| Acer Aspire Nitro 5 AN517-51-7887 | |
| Schenker XMG Pro 17 PB71RD-G | |
| LibreOffice - 20 Documents To PDF | |
| Asus TUF A17 FA706IU-AS76 | |
| Átlagos Intel Core i7-10750H (43.1 - 99.2, n=43) | |
| Acer Nitro 5 AN517-52-77DS | |
| Az osztály átlaga Gaming (19 - 88.8, n=110, az elmúlt 2 évben) | |
| R Benchmark 2.5 - Overall mean | |
| Schenker XMG Pro 17 PB71RD-G | |
| Acer Nitro 5 AN517-52-77DS | |
| Átlagos Intel Core i7-10750H (0.578 - 0.708, n=42) | |
| Asus TUF A17 FA706IU-AS76 | |
| Az osztály átlaga Gaming (0.3439 - 0.759, n=111, az elmúlt 2 évben) | |
* ... a kisebb jobb
| PCMark 8 Home Score Accelerated v2 | 3836 pontok | |
| PCMark 8 Creative Score Accelerated v2 | 4075 pontok | |
| PCMark 8 Work Score Accelerated v2 | 5552 pontok | |
| PCMark 10 Score | 5201 pontok | |
Segítség | ||
| PCMark 8 | |
| Home Score Accelerated v2 | |
| Az osztály átlaga Gaming (n=1az elmúlt 2 évben) | |
| Lenovo Legion Y540-17IRH | |
| Acer Aspire Nitro 5 AN517-51-7887 | |
| Asus TUF A17 FA706IU-AS76 | |
| Átlagos Intel Core i7-10750H, NVIDIA GeForce RTX 2060 Mobile (3836 - 4539, n=6) | |
| HP Pavilion Gaming 17-cd0085cl | |
| Acer Nitro 5 AN517-52-77DS | |
| Work Score Accelerated v2 | |
| Asus TUF A17 FA706IU-AS76 | |
| Átlagos Intel Core i7-10750H, NVIDIA GeForce RTX 2060 Mobile (5405 - 5928, n=6) | |
| Acer Nitro 5 AN517-52-77DS | |
| Acer Aspire Nitro 5 AN517-51-7887 | |
| HP Pavilion Gaming 17-cd0085cl | |
| Lenovo Legion Y540-17IRH | |
| Az osztály átlaga Gaming (n=1az elmúlt 2 évben) | |
| DPC Latencies / LatencyMon - interrupt to process latency (max), Web, Youtube, Prime95 | |
| Asus TUF A17 FA706IU-AS76 | |
| Acer Nitro 5 AN517-52-77DS | |
* ... a kisebb jobb

| Acer Nitro 5 AN517-52-77DS WDC PC SN530 SDBPNPZ-1T00 | Asus TUF A17 FA706IU-AS76 Intel SSD 660p 1TB SSDPEKNW010T8 | Lenovo Legion Y540-17IRH WDC PC SN520 SDAPNUW-512G | Schenker XMG Pro 17 PB71RD-G Samsung SSD 970 EVO Plus 500GB | HP Pavilion Gaming 17-cd0085cl Samsung SSD PM981 MZVLB256HAHQ | Acer Aspire Nitro 5 AN517-51-7887 WDC PC SN520 SDAPNUW-512G | Átlagos WDC PC SN530 SDBPNPZ-1T00 | |
|---|---|---|---|---|---|---|---|
| CrystalDiskMark 5.2 / 6 | 10% | -27% | 22% | 16% | -21% | 16% | |
| Write 4K (MB/s) | 140 | 189.7 36% | 105.1 -25% | 117.5 -16% | 135.3 -3% | 104.6 -25% | 182.7 ? 31% |
| Read 4K (MB/s) | 49.04 | 62.3 27% | 34.41 -30% | 46.47 -5% | 63.7 30% | 39.76 -19% | 48.6 ? -1% |
| Write Seq (MB/s) | 1963 | 1681 -14% | 1298 -34% | 1345 -31% | 1337 -32% | 1268 -35% | 1979 ? 1% |
| Read Seq (MB/s) | 1455 | 1608 11% | 1099 -24% | 2804 93% | 1617 11% | 1414 -3% | 1828 ? 26% |
| Write 4K Q32T1 (MB/s) | 398.2 | 468.6 18% | 335.7 -16% | 368.2 -8% | 568 43% | 287.9 -28% | 498 ? 25% |
| Read 4K Q32T1 (MB/s) | 461.9 | 541 17% | 231.4 -50% | 412.9 -11% | 645 40% | 381.1 -17% | 573 ? 24% |
| Write Seq Q32T1 (MB/s) | 1969 | 1770 -10% | 1454 -26% | 3248 65% | 1428 -27% | 1319 -33% | 1980 ? 1% |
| Read Seq Q32T1 (MB/s) | 1927 | 1898 -2% | 1740 -10% | 3559 85% | 3184 65% | 1735 -10% | 2336 ? 21% |
Continuous load read: DiskSpd Read Loop, Queue Depth 8
| 3DMark 06 Standard Score | 38509 pontok | |
| 3DMark 11 Performance | 18057 pontok | |
| 3DMark Ice Storm Standard Score | 117009 pontok | |
| 3DMark Cloud Gate Standard Score | 31601 pontok | |
| 3DMark Fire Strike Score | 14191 pontok | |
| 3DMark Time Spy Score | 5759 pontok | |
Segítség | ||
| 3DMark 11 - 1280x720 Performance GPU | |
| Az osztály átlaga Gaming (21841 - 80022, n=108, az elmúlt 2 évben) | |
| Átlagos NVIDIA GeForce RTX 2060 Mobile (19143 - 24662, n=40) | |
| Schenker XMG Pro 17 PB71RD-G | |
| Asus TUF A17 FA706IU-AS76 | |
| Acer Nitro 5 AN517-52-77DS | |
| Acer Aspire Nitro 5 AN517-51-7887 | |
| Lenovo Legion Y740-17IRH | |
| Lenovo Legion Y540-17IRH | |
| HP Pavilion Gaming 17-cd0085cl | |
| The Witcher 3 - 1920x1080 Ultra Graphics & Postprocessing (HBAO+) | |
| Az osztály átlaga Gaming (95 - 240, n=8, az elmúlt 2 évben) | |
| Acer Nitro 5 AN517-52-77DS | |
| Átlagos NVIDIA GeForce RTX 2060 Mobile (50.6 - 74, n=40) | |
| Schenker XMG Pro 17 PB71RD-G | |
| Lenovo Legion Y740-17IRH | |
| Asus TUF A17 FA706IU-AS76 | |
| Acer Aspire Nitro 5 AN517-51-7887 | |
| Lenovo Legion Y540-17IRH | |
| HP Pavilion Gaming 17-cd0085cl | |
| BioShock Infinite - 1920x1080 Ultra Preset, DX11 (DDOF) | |
| Lenovo Legion Y740-17IRH | |
| Átlagos NVIDIA GeForce RTX 2060 Mobile (119 - 156, n=17) | |
| Acer Nitro 5 AN517-52-77DS | |
| Lenovo Legion Y540-17IRH | |
| Acer Aspire Nitro 5 AN517-51-7887 | |
| HP Pavilion Gaming 17-cd0085cl | |
| Shadow of the Tomb Raider - 1920x1080 Highest Preset AA:T | |
| Az osztály átlaga Gaming (96 - 116, n=2, az elmúlt 2 évben) | |
| Lenovo Legion Y740-17IRH | |
| Átlagos NVIDIA GeForce RTX 2060 Mobile (54 - 86, n=22) | |
| Asus TUF A17 FA706IU-AS76 | |
| Acer Nitro 5 AN517-52-77DS | |
| HP Pavilion Gaming 17-cd0085cl | |
| alacsony | közepes | magas | ultra | |
|---|---|---|---|---|
| BioShock Infinite (2013) | 327.4 | 285.5 | 263.5 | 138.4 |
| The Witcher 3 (2015) | 277 | 188.3 | 108.9 | 63 |
| Dota 2 Reborn (2015) | 146.1 | 133.9 | 123.8 | 116.8 |
| X-Plane 11.11 (2018) | 98.3 | 84.1 | 75.8 | |
| Shadow of the Tomb Raider (2018) | 114 | 89 | 82 | 73 |
| Metro Exodus (2019) | 142.4 | 75.9 | 56.6 | 44.5 |
| Total War: Three Kingdoms (2019) | 229.6 | 107.4 | 66.9 | 46.3 |
| Control (2019) | 201.9 | 74.9 | 54.6 | |
| Borderlands 3 (2019) | 133 | 86.9 | 62.2 | 47.7 |
| Call of Duty Modern Warfare 2019 (2019) | 133.5 | 90.2 | 74.3 | 65.5 |
| Red Dead Redemption 2 (2019) | 116.9 | 76.1 | 50.7 | 32.5 |
| Escape from Tarkov (2020) | 121 | 121 | 117.5 | 103.3 |
| Hunt Showdown (2020) | 170.6 | 94.2 | 75 | |
| Doom Eternal (2020) | 195.6 | 125.4 | 112.4 | 108.9 |
| Gears Tactics (2020) | 236.1 | 145.6 | 93.3 | 60.7 |
Zajszint
| Üresjárat |
| 30.2 / 30.2 / 30.2 dB(A) |
| Terhelés |
| 41.5 / 44.6 dB(A) |
 | ||
30 dB csendes 40 dB(A) hallható 50 dB(A) hangos |
||
min: | ||
| Acer Nitro 5 AN517-52-77DS i7-10750H, GeForce RTX 2060 Mobile | Asus TUF A17 FA706IU-AS76 R7 4800H, GeForce GTX 1660 Ti Mobile | Schenker XMG Pro 17 PB71RD-G i7-9750H, GeForce RTX 2060 Mobile | Lenovo Legion Y540-17IRH i5-9300H, GeForce GTX 1660 Ti Mobile | HP Pavilion Gaming 17-cd0085cl i7-9750H, GeForce GTX 1660 Ti Max-Q | Acer Aspire Nitro 5 AN517-51-7887 i7-9750H, GeForce GTX 1660 Ti Mobile | Átlagos NVIDIA GeForce RTX 2060 Mobile | Az osztály átlaga Gaming | |
|---|---|---|---|---|---|---|---|---|
| Noise | -5% | -14% | -7% | 7% | -3% | -3% | 3% | |
| off / környezet * (dB) | 30.2 | 28.7 5% | 30 1% | 30 1% | 28.2 7% | 30 1% | 27.9 ? 8% | 24.1 ? 20% |
| Idle Minimum * (dB) | 30.2 | 28.7 5% | 30 1% | 30 1% | 30.1 -0% | 30.2 -0% | 29 ? 4% | 25.8 ? 15% |
| Idle Average * (dB) | 30.2 | 30.5 -1% | 32 -6% | 32 -6% | 30.1 -0% | 30.2 -0% | 30 ? 1% | 27.4 ? 9% |
| Idle Maximum * (dB) | 30.2 | 32.5 -8% | 39 -29% | 34 -13% | 30.1 -0% | 31 -3% | 33 ? -9% | 30 ? 1% |
| Load Average * (dB) | 41.5 | 42.5 -2% | 51 -23% | 44 -6% | 34.2 18% | 43.4 -5% | 44 ? -6% | 43 ? -4% |
| Witcher 3 ultra * (dB) | 44.5 | 50.1 -13% | 54 -21% | 50 -12% | 34.2 23% | 48.5 -9% | ||
| Load Maximum * (dB) | 44.6 | 53.4 -20% | 54 -21% | 52 -17% | 43.8 2% | 45.5 -2% | 51.6 ? -16% | 54 ? -21% |
* ... a kisebb jobb
(-) A felső oldalon a maximális hőmérséklet 50.6 °C / 123 F, összehasonlítva a 40.4 °C / 105 F átlagával , 21.2 és 68.8 °C között a Gaming osztálynál.
(-) Az alsó maximum 53.8 °C / 129 F-ig melegszik fel, összehasonlítva a 43.2 °C / 110 F átlagával
(+) Üresjáratban a felső oldal átlagos hőmérséklete 25 °C / 77 F, összehasonlítva a 33.9 °C / ### eszközátlaggal class_avg_f### F.
(±) A The Witcher 3 játék során a felső oldal átlaghőmérséklete 37.3 °C / 99 F, összehasonlítva a 33.9 °C / ## eszközátlaggal #class_avg_f### F.
(+) A csuklótámasz és az érintőpad hűvösebb, mint a bőr hőmérséklete, maximum 26.1 °C / 79 F, ezért hűvös tapintású.
(+) A hasonló eszközök csuklótámasz területének átlagos hőmérséklete 28.8 °C / 83.8 F volt (+2.7 °C / 4.8 F).
| Acer Nitro 5 AN517-52-77DS i7-10750H, GeForce RTX 2060 Mobile | Asus TUF A17 FA706IU-AS76 R7 4800H, GeForce GTX 1660 Ti Mobile | Schenker XMG Pro 17 PB71RD-G i7-9750H, GeForce RTX 2060 Mobile | Lenovo Legion Y740-17IRH i7-9750H, GeForce RTX 2060 Mobile | HP Pavilion Gaming 17-cd0085cl i7-9750H, GeForce GTX 1660 Ti Max-Q | Acer Aspire Nitro 5 AN517-51-7887 i7-9750H, GeForce GTX 1660 Ti Mobile | Átlagos NVIDIA GeForce RTX 2060 Mobile | Az osztály átlaga Gaming | |
|---|---|---|---|---|---|---|---|---|
| Heat | -4% | -4% | -3% | -11% | -5% | -7% | -5% | |
| Maximum Upper Side * (°C) | 50.6 | 47.6 6% | 47 7% | 43 15% | 42.6 16% | 51.7 -2% | 47.2 ? 7% | 45.2 ? 11% |
| Maximum Bottom * (°C) | 53.8 | 50.8 6% | 48 11% | 46 14% | 49 9% | 55.4 -3% | 52.7 ? 2% | 48 ? 11% |
| Idle Upper Side * (°C) | 26.6 | 33 -24% | 30 -13% | 31 -17% | 34 -28% | 29.1 -9% | 31 ? -17% | 31.1 ? -17% |
| Idle Bottom * (°C) | 27.8 | 29 -4% | 34 -22% | 34 -22% | 39.4 -42% | 29 -4% | 32.9 ? -18% | 34.2 ? -23% |
* ... a kisebb jobb
Acer Nitro 5 AN517-52-77DS hangelemzés
(-) | nem túl hangos hangszórók (67.8 dB)
Basszus 100 - 315 Hz
(-) | szinte nincs basszus – átlagosan 22.3%-kal alacsonyabb a mediánnál
(±) | a basszus linearitása átlagos (12% delta az előző frekvenciához)
Közepes 400-2000 Hz
(+) | kiegyensúlyozott középpontok – csak 4.1% választja el a mediántól
(±) | a középpontok linearitása átlagos (9.2% delta az előző gyakorisághoz)
Maximum 2-16 kHz
(+) | kiegyensúlyozott csúcsok – csak 2.6% választja el a mediántól
(+) | a csúcsok lineárisak (6.3% delta az előző frekvenciához képest)
Összességében 100 - 16.000 Hz
(±) | az általános hang linearitása átlagos (22.4% eltérés a mediánhoz képest)
Ugyanazon osztályhoz képest
» 80%Ebben az osztályban az összes tesztelt eszköz %-a jobb volt, 6% hasonló, 14%-kal rosszabb
» A legjobb delta értéke 6%, az átlag 18%, a legrosszabb 132% volt
Az összes tesztelt eszközzel összehasonlítva
» 65% az összes tesztelt eszköz jobb volt, 6% hasonló, 29%-kal rosszabb
» A legjobb delta értéke 4%, az átlag 24%, a legrosszabb 134% volt
Asus TUF A17 FA706IU-AS76 hangelemzés
(±) | a hangszóró hangereje átlagos, de jó (74 dB)
Basszus 100 - 315 Hz
(±) | csökkentett basszus – átlagosan 12.7%-kal alacsonyabb, mint a medián
(±) | a basszus linearitása átlagos (11.5% delta az előző frekvenciához)
Közepes 400-2000 Hz
(+) | kiegyensúlyozott középpontok – csak 4.8% választja el a mediántól
(±) | a középpontok linearitása átlagos (9.1% delta az előző gyakorisághoz)
Maximum 2-16 kHz
(+) | kiegyensúlyozott csúcsok – csak 3.1% választja el a mediántól
(±) | a csúcsok linearitása átlagos (8.7% delta az előző gyakorisághoz)
Összességében 100 - 16.000 Hz
(±) | az általános hang linearitása átlagos (23.5% eltérés a mediánhoz képest)
Ugyanazon osztályhoz képest
» 85%Ebben az osztályban az összes tesztelt eszköz %-a jobb volt, 5% hasonló, 10%-kal rosszabb
» A legjobb delta értéke 6%, az átlag 18%, a legrosszabb 132% volt
Az összes tesztelt eszközzel összehasonlítva
» 70% az összes tesztelt eszköz jobb volt, 6% hasonló, 24%-kal rosszabb
» A legjobb delta értéke 4%, az átlag 24%, a legrosszabb 134% volt
| Kikapcsolt állapot / Készenlét | |
| Üresjárat | |
| Terhelés |
|
Kulcs:
min: | |
| Acer Nitro 5 AN517-52-77DS i7-10750H, GeForce RTX 2060 Mobile | Asus TUF A17 FA706IU-AS76 R7 4800H, GeForce GTX 1660 Ti Mobile | Schenker XMG Pro 17 PB71RD-G i7-9750H, GeForce RTX 2060 Mobile | Lenovo Legion Y540-17IRH i5-9300H, GeForce GTX 1660 Ti Mobile | HP Pavilion Gaming 17-cd0085cl i7-9750H, GeForce GTX 1660 Ti Max-Q | Acer Aspire Nitro 5 AN517-51-7887 i7-9750H, GeForce GTX 1660 Ti Mobile | Átlagos NVIDIA GeForce RTX 2060 Mobile | Az osztály átlaga Gaming | |
|---|---|---|---|---|---|---|---|---|
| Power Consumption | -15% | -60% | -89% | 5% | 10% | -61% | -79% | |
| Idle Minimum * (Watt) | 5.4 | 7.4 -37% | 11 -104% | 19 -252% | 5.4 -0% | 3.9 28% | 11.5 ? -113% | 13.2 ? -144% |
| Idle Average * (Watt) | 9.8 | 10.5 -7% | 18 -84% | 22 -124% | 9.2 6% | 8.9 9% | 16.5 ? -68% | 18.9 ? -93% |
| Idle Maximum * (Watt) | 10.9 | 17 -56% | 28 -157% | 30 -175% | 13 -19% | 12.2 -12% | 23.7 ? -117% | 24.3 ? -123% |
| Load Average * (Watt) | 104 | 103.7 -0% | 99 5% | 79 24% | 85.9 17% | 83 20% | 107.5 ? -3% | 108 ? -4% |
| Witcher 3 ultra * (Watt) | 134.3 | 128.1 5% | 146 -9% | 134 -0% | 107.9 20% | 130 3% | ||
| Load Maximum * (Watt) | 193 | 183.2 5% | 210 -9% | 201 -4% | 182.2 6% | 168 13% | 199.7 ? -3% | 254 ? -32% |
* ... a kisebb jobb
| Acer Nitro 5 AN517-52-77DS i7-10750H, GeForce RTX 2060 Mobile, 57.48 Wh | Asus TUF A17 FA706IU-AS76 R7 4800H, GeForce GTX 1660 Ti Mobile, 90 Wh | Lenovo Legion Y540-17IRH i5-9300H, GeForce GTX 1660 Ti Mobile, 57 Wh | Schenker XMG Pro 17 PB71RD-G i7-9750H, GeForce RTX 2060 Mobile, 62 Wh | HP Pavilion Gaming 17-cd0085cl i7-9750H, GeForce GTX 1660 Ti Max-Q, 52.5 Wh | Acer Aspire Nitro 5 AN517-51-7887 i7-9750H, GeForce GTX 1660 Ti Mobile, 57 Wh | Az osztály átlaga Gaming | |
|---|---|---|---|---|---|---|---|
| Akkumulátor üzemidő | 26% | -49% | -42% | -20% | -3% | -7% | |
| Reader / Idle (h) | 11 | 9.1 -17% | 5.2 -53% | 5.2 -53% | 11.6 5% | 13.4 22% | 8.71 ? -21% |
| H.264 (h) | 7.3 | 3.4 -53% | 6.3 -14% | 8.26 ? 13% | |||
| WiFi v1.3 (h) | 6.6 | 8.5 29% | 3.7 -44% | 4.1 -38% | 5.7 -14% | 6.2 -6% | 7.02 ? 6% |
| Load (h) | 2 | 3.3 65% | 1.1 -45% | 1.3 -35% | 1 -50% | 1.7 -15% | 1.47 ? -26% |
Pro
Kontra
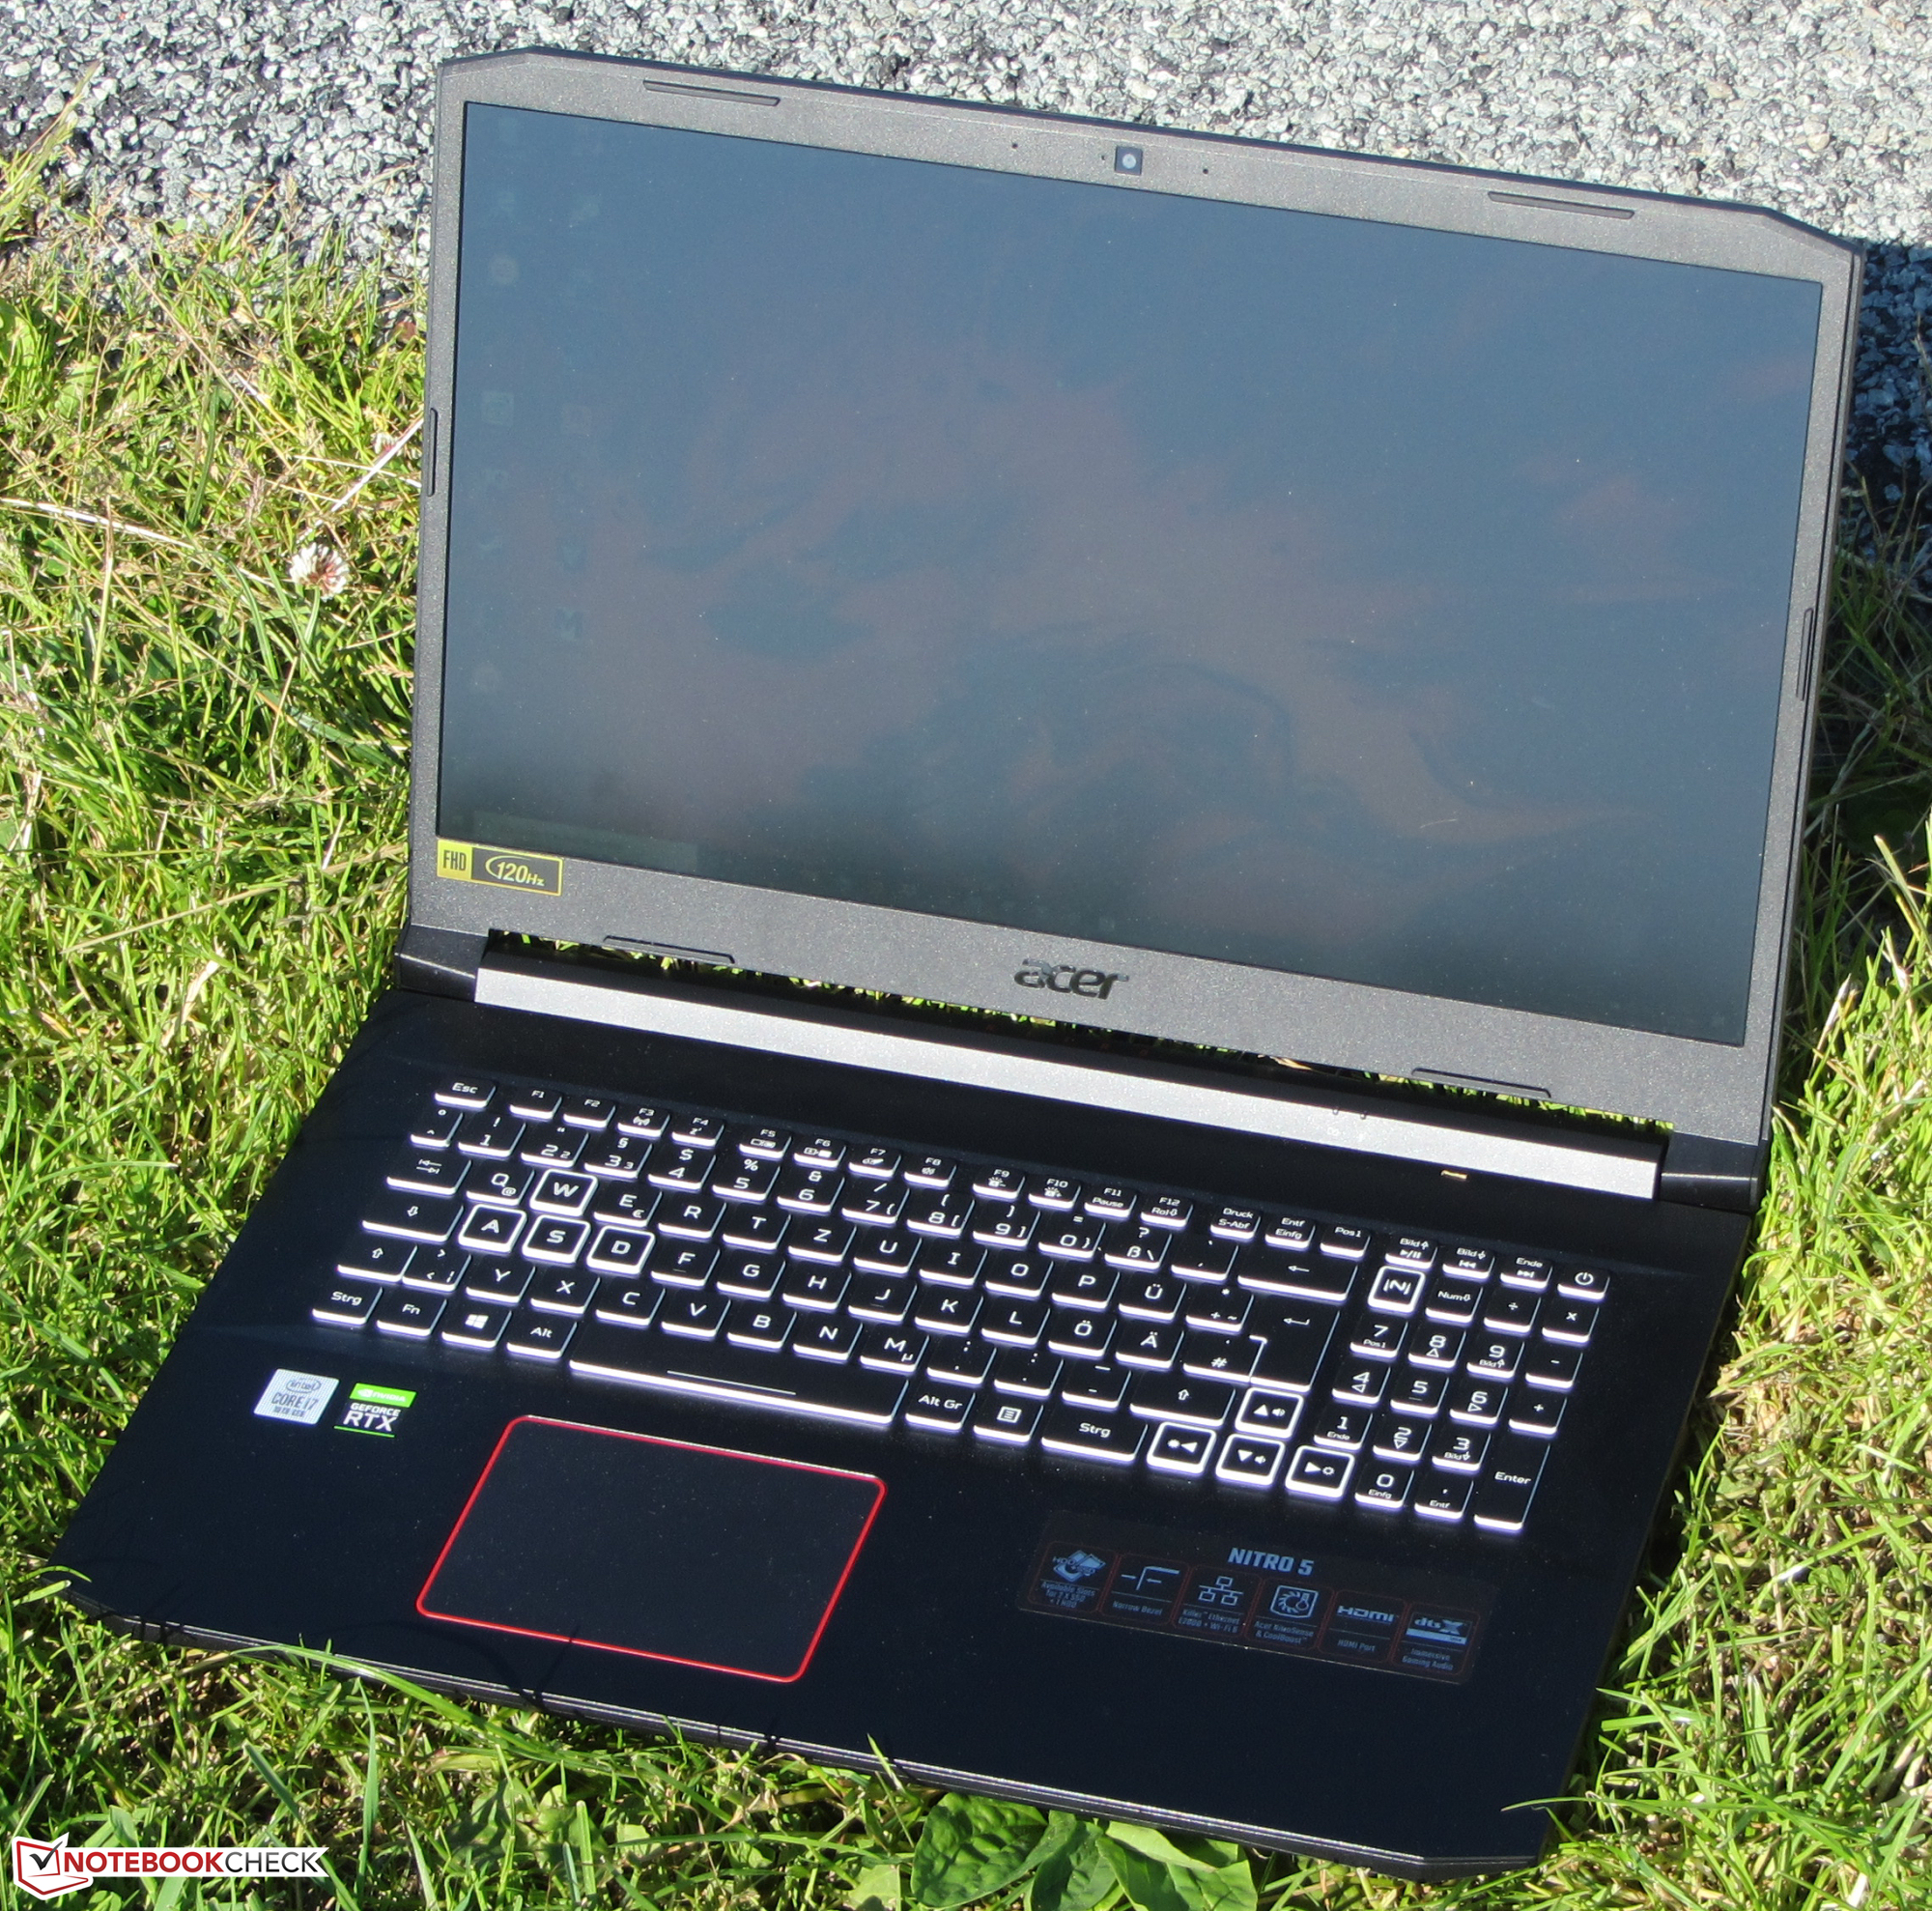
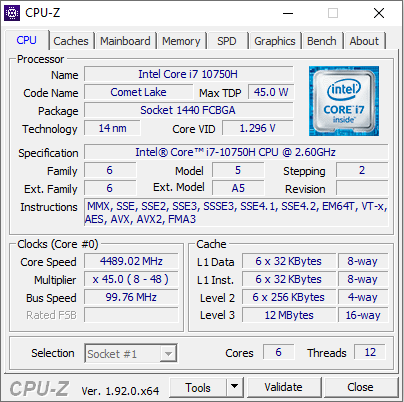
Az Acer 17.3 hüvelykes gamer notebookja minden új játékot simán futtat a matt Full HD kijelzőjén, a Core i7-10750H processzornak és a GeForce RTX 2060 GPU-nak köszönhetően. Általában Full HD felbontáson és magas-maximális minőségi beállításokon lehet játszani.
Az Acer Nitro 5 AN517-52 egy átfogóan jó gamer notebook, viszont jobb kijelzőt érdemelne.
Az 1 TB-s NVMe SSD bőséges helyet kínál a játékoknak és egyéb alkalmazásoknak. Ha netán valaha is elfogy a tárhely, akkor lehetőség van a bővítésére. A notebookban van hely egy második M.2 2280 NVMe SSD-nek és egy 2.5 hüvelykes adattárolónak is. Mivel a számítógép nem rendelkezik külön karbantartásra szolgáló nyílással, ezért a házat ebben az esetben fel kell nyitni.
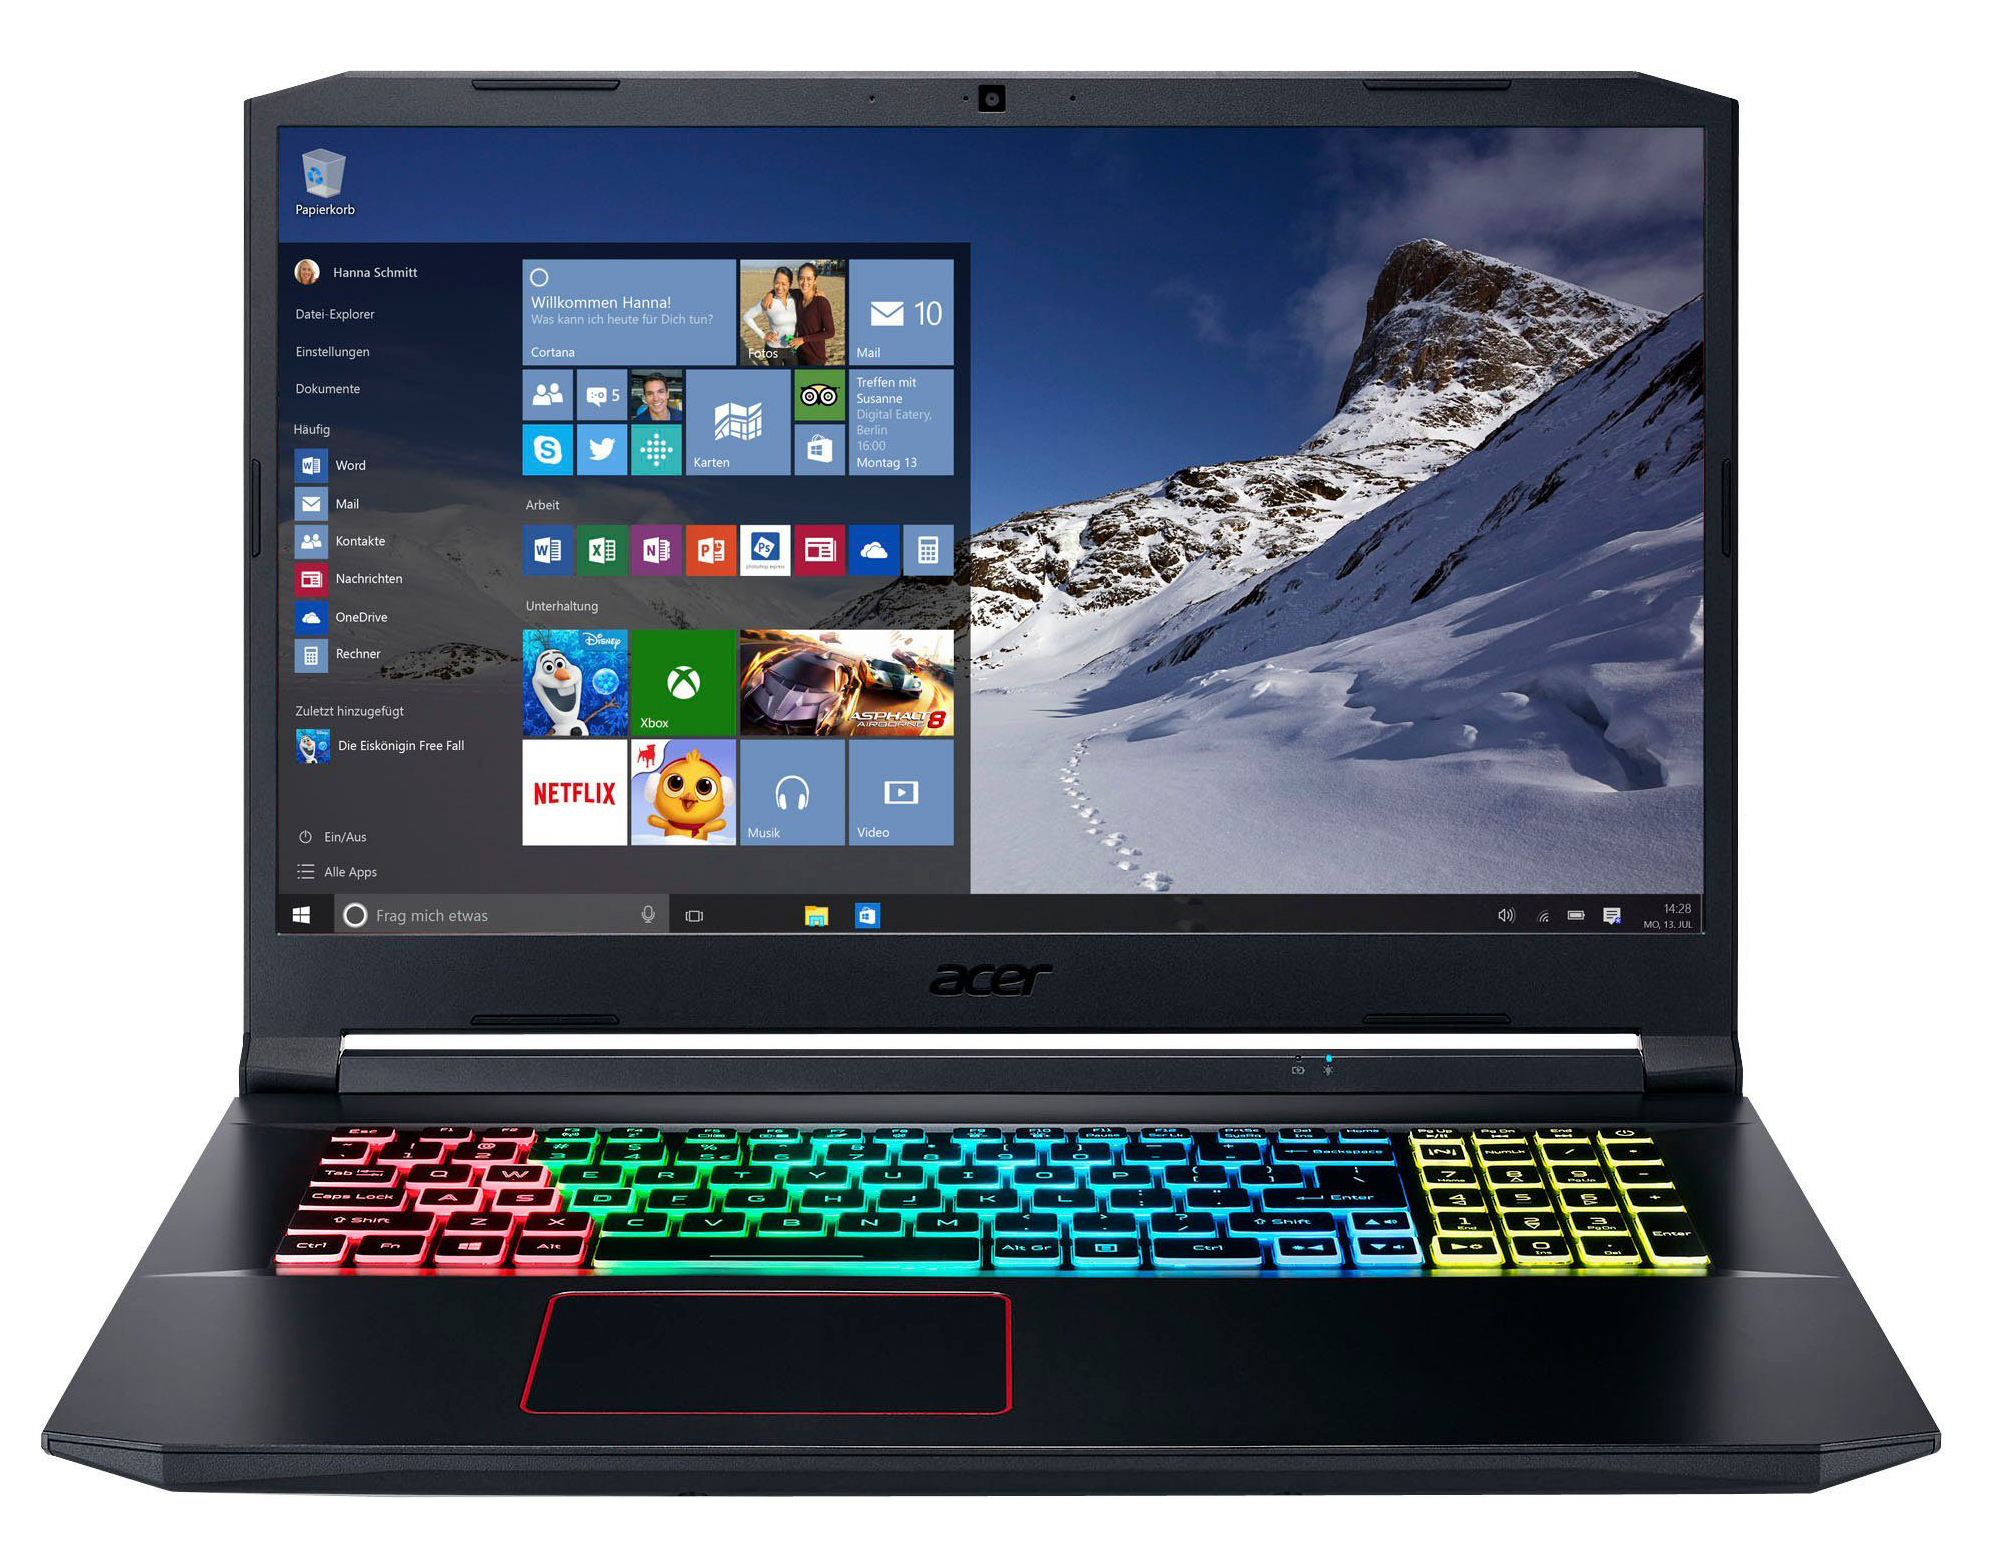
Mindent összevetve, a 120 Hz-es IPS kijelző nem túl meggyőző. A fényerő, a kontraszt és a színtér lefedettség mind túl alacsony. A válaszidők egyszerűen átlagosak. Egy 1500 eurós notebook többet kell itt nyújtson. Stabil látószögek, matt felület és jó színreprodukció szól a kijelző mellett.
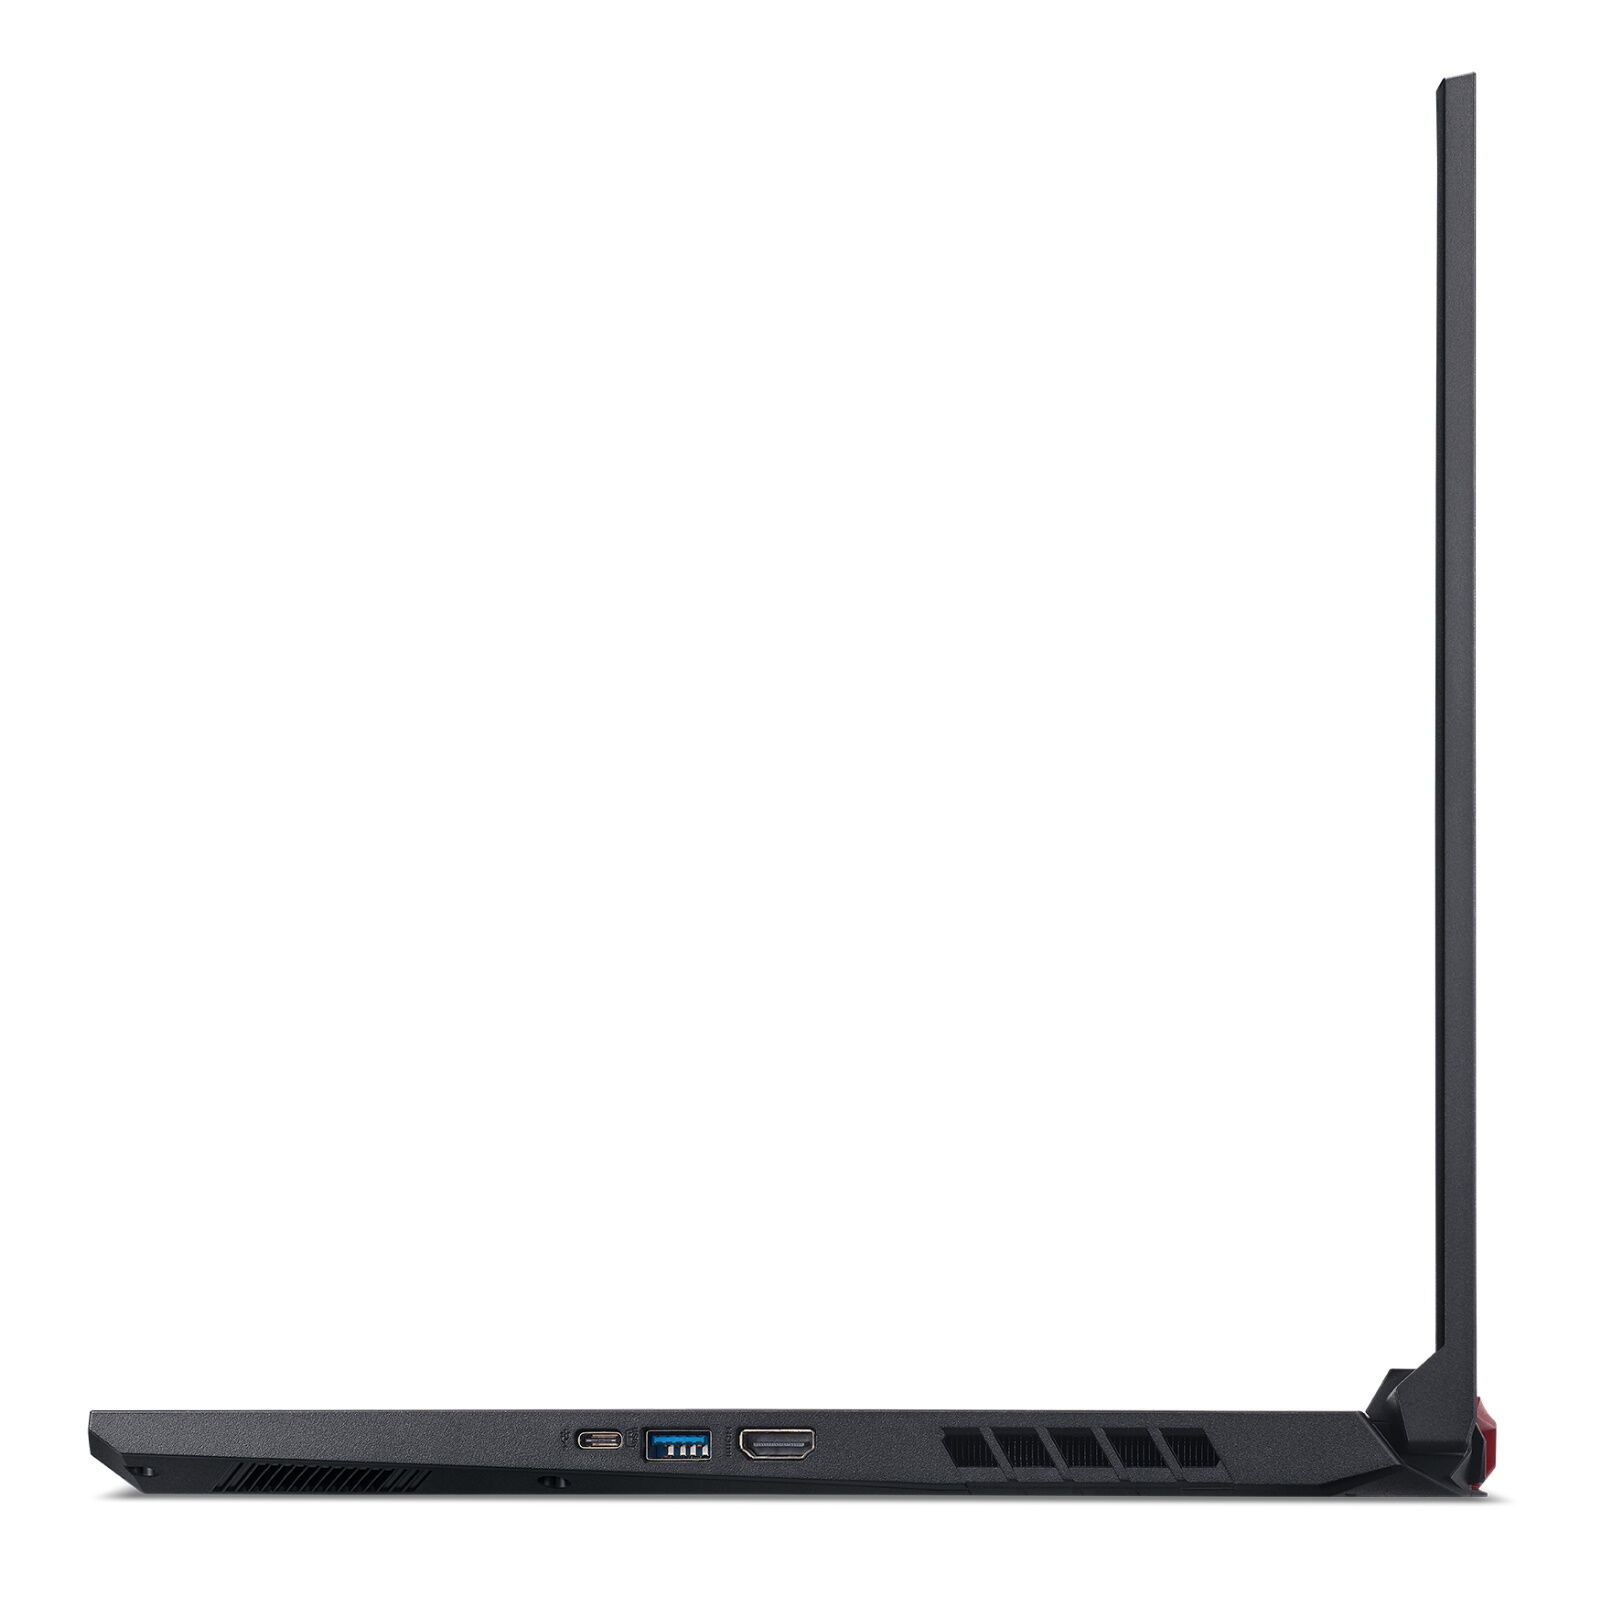
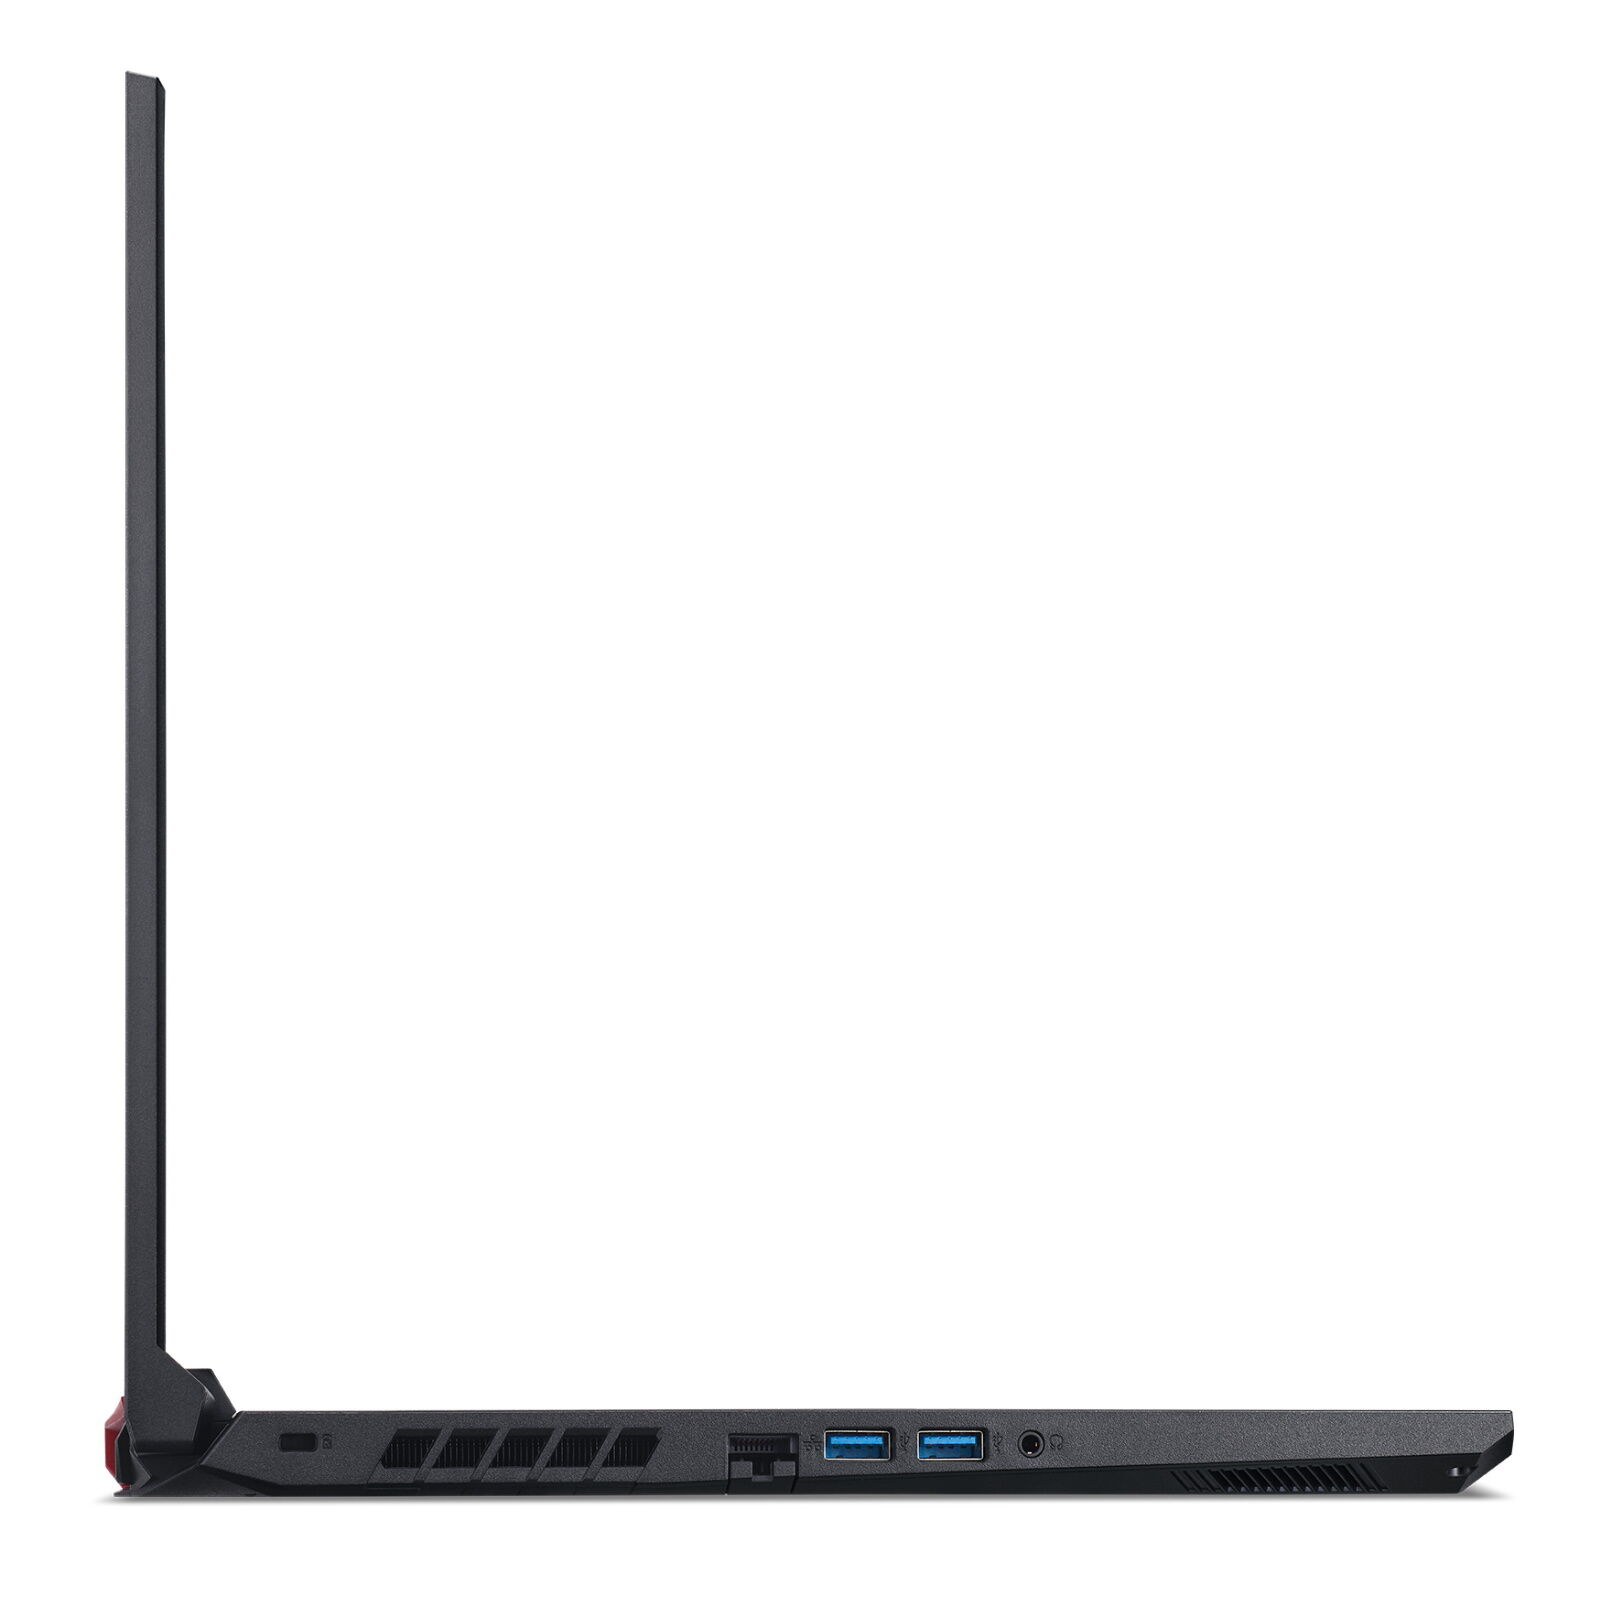
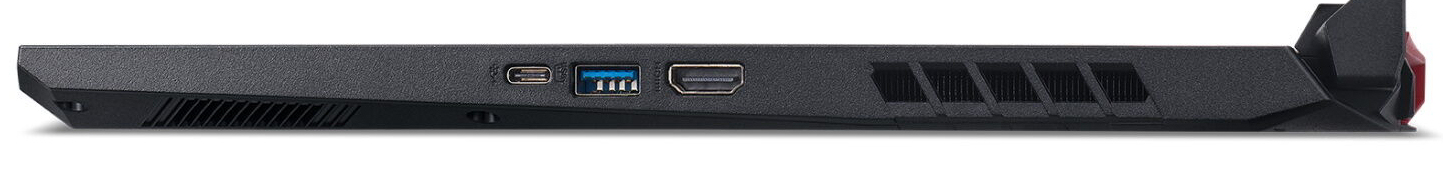
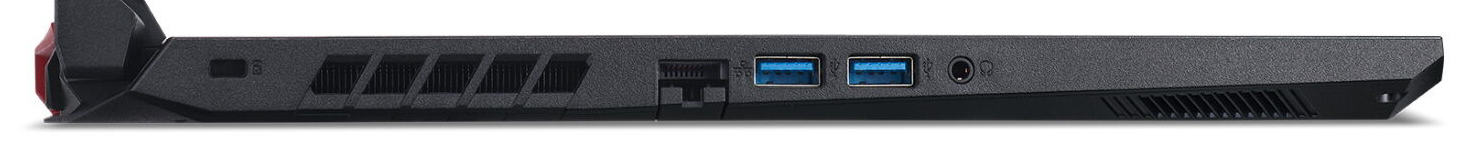
A notebook rendelkezik a legszükségesebb portokkal. A Thunderbolt 3 portot viszont hiába keressük. Csak egyetlen USB-C 3.2 Gen 2 port van, és ez nem rendelkezik DisplayPort támogatással az USB-C funkción keresztül. A beépített billentyűzet (RGB világítással) megfelelőnek bizonyult a mindennapi használatban. Továbbá, az üzemidő egészen elfogadható egy 17.3 hüvelykes gamer notebookhoz képest.
A notebook ára jelenleg valamivel kevesebb, mint 1500 euró, ami nem kifejezetten olcsó. Ennek eredményeként egyáltalán nem számít kedvező árú vételnek. Ettől függetlenül jó ár-teljesítmény aránnyal rendelkezik.
Acer Nitro 5 AN517-52-77DS
- 06/18/2020 v7 (old)
Sascha Mölck
Price comparison

