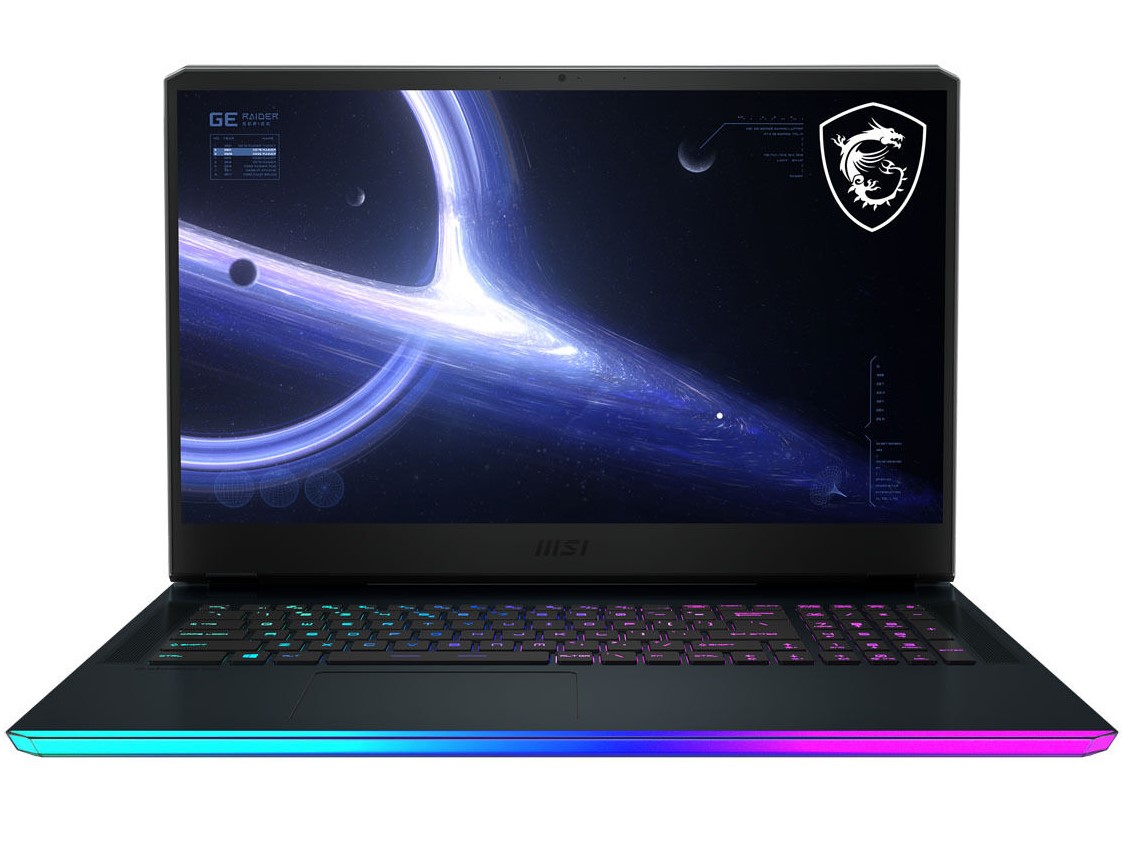
MSI GE76 Raider 11UH rövid értékelés: Csúcskategóriás gamer laptop gyors 360 Hz-es kijelzővel
Possible contenders in comparison
Értékelés | Dátum | Modell | Súly | Magasság | Méret | Felbontás | Legjobb ár |
|---|---|---|---|---|---|---|---|
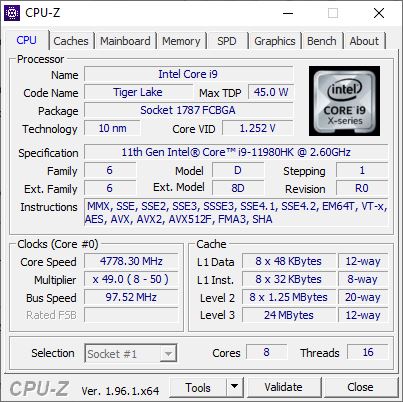
| 86.2 % v7 (old) | 12/2021 | MSI GE76 Raider 11UH-472US i9-11980HK, GeForce RTX 3080 Laptop GPU | 3 kg | 27.4 mm | 17.30" | 1920x1080 | |
| 87.1 % v7 (old) | 02/2021 | MSI GE76 Raider 10UH i7-10870H, GeForce RTX 3080 Laptop GPU | 3 kg | 27.4 mm | 17.30" | 1920x1080 | |
| 88 % v7 (old) | 09/2021 | Gigabyte Aero 17 HDR YD i9-11980HK, GeForce RTX 3080 Laptop GPU | 2.8 kg | 22 mm | 17.30" | 3840x2160 | |
| 85.3 % v7 (old) | 04/2021 | Alienware m17 R4 i9-10980HK, GeForce RTX 3080 Laptop GPU | 3 kg | 22 mm | 17.30" | 1920x1080 |
| SD Card Reader | |
| average JPG Copy Test (av. of 3 runs) | |
| MSI GE76 Raider 10UH (Toshiba Exceria Pro SDXC 64 GB UHS-II) | |
| Alienware m17 R4 (AV PRO microSD 128 GB V60) | |
| Gigabyte Aero 17 HDR YD (AV PRO microSD 128 GB V60) | |
| Az osztály átlaga Gaming (20.9 - 210, n=54, az elmúlt 2 évben) | |
| MSI GE76 Raider 11UH-472US (AV PRO microSD 128 GB V60) | |
| maximum AS SSD Seq Read Test (1GB) | |
| Alienware m17 R4 (AV PRO microSD 128 GB V60) | |
| MSI GE76 Raider 10UH (Toshiba Exceria Pro SDXC 64 GB UHS-II) | |
| Gigabyte Aero 17 HDR YD (AV PRO microSD 128 GB V60) | |
| Az osztály átlaga Gaming (25.5 - 261, n=51, az elmúlt 2 évben) | |
| MSI GE76 Raider 11UH-472US (AV PRO microSD 128 GB V60) | |


| |||||||||||||||||||||||||
Fényerő megoszlás: 96 %
Centrumban: 301 cd/m²
Kontraszt: 1204:1 (Fekete: 0.25 cd/m²)
ΔE ColorChecker Calman: 5.66 | ∀{0.5-29.43 Ø4.72}
calibrated: 2.7
ΔE Greyscale Calman: 5.2 | ∀{0.09-98 Ø4.97}
51.2% AdobeRGB 1998 (Argyll 3D)
74.4% sRGB (Argyll 3D)
49.6% Display P3 (Argyll 3D)
Gamma: 2.225
CCT: 6566 K
| MSI GE76 Raider 11UH-472US AU Optronics AUOE295, IPS, 1920x1080, 17.3" | MSI GE76 Raider 10UH AU Optronics B173HAN05.1, IPS, 1920x1080, 17.3" | Gigabyte Aero 17 HDR YD AU Optronics AUO329B, IPS, 3840x2160, 17.3" | Alienware m17 R4 AU Optronics AUOEC91, IPS, 1920x1080, 17.3" | |
|---|---|---|---|---|
| Display | 40% | 68% | 38% | |
| Display P3 Coverage (%) | 49.6 | 71.8 45% | 86.9 75% | 69.8 41% |
| sRGB Coverage (%) | 74.4 | 98.1 32% | 100 34% | 99.7 34% |
| AdobeRGB 1998 Coverage (%) | 51.2 | 73.9 44% | 99.6 95% | 71.6 40% |
| Response Times | -108% | -432% | -47% | |
| Response Time Grey 50% / Grey 80% * (ms) | 6.4 ? | 20.4 ? -219% | 52 ? -713% | 13.2 ? -106% |
| Response Time Black / White * (ms) | 10.4 ? | 10 ? 4% | 26 ? -150% | 9.2 ? 12% |
| PWM Frequency (Hz) | 151500 | |||
| Screen | 5% | 43% | 37% | |
| Brightness middle (cd/m²) | 301 | 324.6 8% | 488 62% | 305 1% |
| Brightness (cd/m²) | 295 | 312 6% | 467 58% | 301 2% |
| Brightness Distribution (%) | 96 | 87 -9% | 86 -10% | 93 -3% |
| Black Level * (cd/m²) | 0.25 | 0.28 -12% | 0.33 -32% | 0.19 24% |
| Contrast (:1) | 1204 | 1159 -4% | 1479 23% | 1605 33% |
| Colorchecker dE 2000 * | 5.66 | 3.87 32% | 1.23 78% | 1.31 77% |
| Colorchecker dE 2000 max. * | 9.75 | 9.35 4% | 2.94 70% | 2.32 76% |
| Colorchecker dE 2000 calibrated * | 2.7 | 1.42 47% | 0.77 71% | 0.91 66% |
| Greyscale dE 2000 * | 5.2 | 6.5 -25% | 1.5 71% | 2.3 56% |
| Gamma | 2.225 99% | 2.23 99% | 2.169 101% | 2.281 96% |
| CCT | 6566 99% | 5702 114% | 6614 98% | 6449 101% |
| Color Space (Percent of AdobeRGB 1998) (%) | 66.3 | 99 | 72 | |
| Color Space (Percent of sRGB) (%) | 98 | 99 | 94 | |
| Teljes átlag (program / beállítások) | -21% /
-3% | -107% /
-19% | 9% /
25% |
* ... a kisebb jobb
Megjelenítési válaszidők
| ↔ Válaszidő Fekete-fehér | ||
|---|---|---|
| 10.4 ms ... emelkedés és süllyedés ↘ kombinálva | ↗ 6 ms emelkedés | 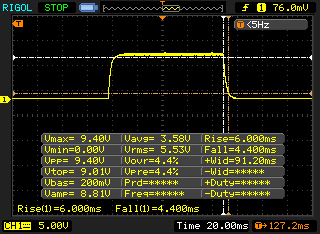 |
| ↘ 4.4 ms ősz | ||
| A képernyő jó reakciósebességet mutat tesztjeinkben, de túl lassú lehet a versenyképes játékosok számára. Összehasonlításképpen, az összes tesztelt eszköz 0.1 (minimum) és 240 (maximum) ms között mozog. » 28 % of all devices are better. Ez azt jelenti, hogy a mért válaszidő jobb, mint az összes vizsgált eszköz átlaga (19.8 ms). | ||
| ↔ Válaszidő 50% szürke és 80% szürke között | ||
| 6.4 ms ... emelkedés és süllyedés ↘ kombinálva | ↗ 2.8 ms emelkedés | 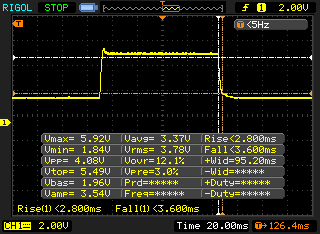 |
| ↘ 3.6 ms ősz | ||
| A képernyő tesztjeinkben nagyon gyors reakciósebességet mutatott, és nagyon jól használható gyors tempójú játékokhoz. Összehasonlításképpen, az összes tesztelt eszköz 0.165 (minimum) és 636 (maximum) ms között mozog. » 19 % of all devices are better. Ez azt jelenti, hogy a mért válaszidő jobb, mint az összes vizsgált eszköz átlaga (31 ms). | ||
Képernyő villogása / PWM (impulzusszélesség-moduláció)
| Képernyő villogása / PWM nem érzékelhető | 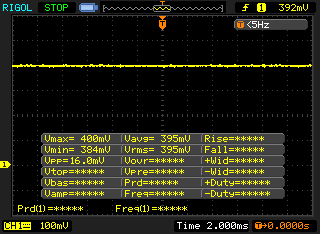 | ||
Összehasonlításképpen: az összes tesztelt eszköz 52 %-a nem használja a PWM-et a kijelző elsötétítésére. Ha PWM-et észleltek, akkor átlagosan 7772 (minimum: 5 - maximum: 343500) Hz-t mértek. | |||
| Cinebench R20 | |
| CPU (Single Core) | |
| Az osztály átlaga Gaming (442 - 895, n=110, az elmúlt 2 évben) | |
| MSI GE76 Raider 11UH-472US (Vorserie) | |
| MSI GE76 Raider 11UH-472US (Serienmodell) | |
| Átlagos Intel Core i9-11980HK (572 - 622, n=7) | |
| Gigabyte Aero 17 HDR YD | |
| Alienware m17 R4 | |
| MSI GE76 Raider 10UH | |
| CPU (Multi Core) | |
| Az osztály átlaga Gaming (4029 - 16108, n=110, az elmúlt 2 évben) | |
| Gigabyte Aero 17 HDR YD | |
| MSI GE76 Raider 11UH-472US (Serienmodell) | |
| MSI GE76 Raider 11UH-472US (Vorserie) | |
| Átlagos Intel Core i9-11980HK (3779 - 5256, n=8) | |
| Alienware m17 R4 | |
| MSI GE76 Raider 10UH | |
| Cinebench R15 | |
| CPU Single 64Bit | |
| Az osztály átlaga Gaming (188.8 - 343, n=110, az elmúlt 2 évben) | |
| Átlagos Intel Core i9-11980HK (224 - 244, n=6) | |
| Gigabyte Aero 17 HDR YD | |
| MSI GE76 Raider 11UH-472US (Vorserie) | |
| MSI GE76 Raider 11UH-472US (Serienmodell) | |
| Alienware m17 R4 | |
| MSI GE76 Raider 10UH | |
| CPU Multi 64Bit | |
| Az osztály átlaga Gaming (1578 - 6271, n=109, az elmúlt 2 évben) | |
| MSI GE76 Raider 11UH-472US (Serienmodell) | |
| MSI GE76 Raider 11UH-472US (Vorserie) | |
| Gigabyte Aero 17 HDR YD | |
| Átlagos Intel Core i9-11980HK (1696 - 2287, n=7) | |
| Alienware m17 R4 | |
| MSI GE76 Raider 10UH | |
| Blender - v2.79 BMW27 CPU | |
| MSI GE76 Raider 11UH-472US (Vorserie) | |
| MSI GE76 Raider 11UH-472US (Serienmodell) | |
| MSI GE76 Raider 10UH | |
| Átlagos Intel Core i9-11980HK (231 - 284, n=4) | |
| Alienware m17 R4 | |
| Gigabyte Aero 17 HDR YD | |
| Az osztály átlaga Gaming (80 - 330, n=108, az elmúlt 2 évben) | |
| HWBOT x265 Benchmark v2.2 - 4k Preset | |
| Az osztály átlaga Gaming (11.5 - 44.3, n=109, az elmúlt 2 évben) | |
| MSI GE76 Raider 11UH-472US (Serienmodell) | |
| MSI GE76 Raider 11UH-472US (Vorserie) | |
| Gigabyte Aero 17 HDR YD | |
| Átlagos Intel Core i9-11980HK (13.1 - 16.3, n=5) | |
| Alienware m17 R4 | |
| MSI GE76 Raider 10UH | |
| LibreOffice - 20 Documents To PDF | |
| Alienware m17 R4 | |
| Az osztály átlaga Gaming (19 - 88.8, n=109, az elmúlt 2 évben) | |
| MSI GE76 Raider 10UH | |
| Átlagos Intel Core i9-11980HK (40.6 - 47.7, n=5) | |
| Gigabyte Aero 17 HDR YD | |
| MSI GE76 Raider 11UH-472US (Serienmodell) | |
| MSI GE76 Raider 11UH-472US (Vorserie) | |
| R Benchmark 2.5 - Overall mean | |
| MSI GE76 Raider 10UH | |
| Alienware m17 R4 | |
| MSI GE76 Raider 11UH-472US (Serienmodell) | |
| MSI GE76 Raider 11UH-472US (Vorserie) | |
| Gigabyte Aero 17 HDR YD | |
| Átlagos Intel Core i9-11980HK (0.545 - 0.565, n=5) | |
| Az osztály átlaga Gaming (0.3439 - 0.759, n=110, az elmúlt 2 évben) | |
* ... a kisebb jobb
| PCMark 10 / Score | |
| Az osztály átlaga Gaming (5828 - 11574, n=96, az elmúlt 2 évben) | |
| Gigabyte Aero 17 HDR YD | |
| MSI GE76 Raider 11UH-472US (Serienmodell) | |
| MSI GE76 Raider 11UH-472US | |
| Átlagos Intel Core i9-11980HK, NVIDIA GeForce RTX 3080 Laptop GPU (6937 - 7088, n=3) | |
| Alienware m17 R4 | |
| MSI GE76 Raider 10UH | |
| PCMark 10 / Essentials | |
| Az osztály átlaga Gaming (8810 - 12600, n=100, az elmúlt 2 évben) | |
| MSI GE76 Raider 11UH-472US | |
| MSI GE76 Raider 11UH-472US (Serienmodell) | |
| Gigabyte Aero 17 HDR YD | |
| Átlagos Intel Core i9-11980HK, NVIDIA GeForce RTX 3080 Laptop GPU (9665 - 10291, n=3) | |
| MSI GE76 Raider 10UH | |
| Alienware m17 R4 | |
| PCMark 10 / Productivity | |
| Az osztály átlaga Gaming (6845 - 21327, n=98, az elmúlt 2 évben) | |
| MSI GE76 Raider 11UH-472US (Serienmodell) | |
| MSI GE76 Raider 11UH-472US | |
| Gigabyte Aero 17 HDR YD | |
| Átlagos Intel Core i9-11980HK, NVIDIA GeForce RTX 3080 Laptop GPU (8934 - 9107, n=3) | |
| Alienware m17 R4 | |
| MSI GE76 Raider 10UH | |
| PCMark 10 / Digital Content Creation | |
| Az osztály átlaga Gaming (7602 - 19657, n=98, az elmúlt 2 évben) | |
| MSI GE76 Raider 11UH-472US (Serienmodell) | |
| MSI GE76 Raider 11UH-472US | |
| Gigabyte Aero 17 HDR YD | |
| Átlagos Intel Core i9-11980HK, NVIDIA GeForce RTX 3080 Laptop GPU (9855 - 10823, n=3) | |
| MSI GE76 Raider 10UH | |
| Alienware m17 R4 | |
| PCMark 10 Score | 7054 pontok | |
Segítség | ||
| DPC Latencies / LatencyMon - interrupt to process latency (max), Web, Youtube, Prime95 | |
| MSI GE76 Raider 10UH | |
| MSI GE76 Raider 11UH-472US | |
| Gigabyte Aero 17 HDR YD | |
| Alienware m17 R4 | |
* ... a kisebb jobb
| MSI GE76 Raider 11UH-472US Samsung PM9A1 MZVL21T0HCLR | MSI GE76 Raider 10UH WDC PC SN730 SDBPNTY-1T00 | Gigabyte Aero 17 HDR YD Samsung PM9A1 MZVL2512HCJQ | Alienware m17 R4 2x Micron 2300 512 GB (RAID 0) | Átlagos Samsung PM9A1 MZVL21T0HCLR | |
|---|---|---|---|---|---|
| CrystalDiskMark 5.2 / 6 | -42% | -2% | -42% | -14% | |
| Write 4K (MB/s) | 238.8 | 157.1 -34% | 230.4 -4% | 93.1 -61% | 194.2 ? -19% |
| Read 4K (MB/s) | 88 | 46.3 -47% | 91.6 4% | 46.79 -47% | 80.6 ? -8% |
| Write Seq (MB/s) | 4306 | 2396 -44% | 4216 -2% | 2853 -34% | 3638 ? -16% |
| Read Seq (MB/s) | 4549 | 2245 -51% | 4543 0% | 2556 -44% | 3838 ? -16% |
| Write 4K Q32T1 (MB/s) | 699 | 436.1 -38% | 667 -5% | 475 -32% | 500 ? -28% |
| Read 4K Q32T1 (MB/s) | 752 | 524 -30% | 728 -3% | 529 -30% | 605 ? -20% |
| Write Seq Q32T1 (MB/s) | 5119 | 3086 -40% | 5043 -1% | 3331 -35% | 4898 ? -4% |
| Read Seq Q32T1 (MB/s) | 7086 | 3363 -53% | 6821 -4% | 3319 -53% | 6775 ? -4% |
| AS SSD | -70% | 0% | -68% | -7% | |
| Seq Read (MB/s) | 5435 | 2967 -45% | 5438 0% | 2733 -50% | 4901 ? -10% |
| Seq Write (MB/s) | 3954 | 2604 -34% | 3904 -1% | 2822 -29% | 3334 ? -16% |
| 4K Read (MB/s) | 52.9 | 42.97 -19% | 56.2 6% | 45.04 -15% | 72.4 ? 37% |
| 4K Write (MB/s) | 158.8 | 107.8 -32% | 165.8 4% | 88.4 -44% | 186 ? 17% |
| 4K-64 Read (MB/s) | 2551 | 1684 -34% | 2489 -2% | 1388 -46% | 1871 ? -27% |
| 4K-64 Write (MB/s) | 3155 | 2164 -31% | 3480 10% | 1227 -61% | 2764 ? -12% |
| Access Time Read * (ms) | 0.044 | 0.116 -164% | 0.054 -23% | 0.079 -80% | 0.0377 ? 14% |
| Access Time Write * (ms) | 0.026 | 0.106 -308% | 0.026 -0% | 0.095 -265% | 0.03431 ? -32% |
| Score Read (Points) | 3148 | 2023 -36% | 3089 -2% | 1706 -46% | 2433 ? -23% |
| Score Write (Points) | 3709 | 2532 -32% | 4036 9% | 1598 -57% | 3284 ? -11% |
| Score Total (Points) | 8383 | 5571 -34% | 8620 3% | 4184 -50% | 6892 ? -18% |
| Teljes átlag (program / beállítások) | -56% /
-58% | -1% /
-1% | -55% /
-57% | -11% /
-10% |
* ... a kisebb jobb

Continuous load read: DiskSpd Read Loop, Queue Depth 8
| 3DMark 11 Performance | 30194 pontok | |
| 3DMark Cloud Gate Standard Score | 47525 pontok | |
| 3DMark Fire Strike Score | 21608 pontok | |
Segítség | ||
| The Witcher 3 - 1920x1080 Ultra Graphics & Postprocessing (HBAO+) | |
| Az osztály átlaga Gaming (95 - 240, n=8, az elmúlt 2 évben) | |
| MSI GE76 Raider 10UH | |
| Alienware m17 R4 | |
| MSI GE76 Raider 11UH-472US | |
| Átlagos NVIDIA GeForce RTX 3080 Laptop GPU (85.1 - 123, n=40) | |
| Gigabyte Aero 17 HDR YD | |
| Cyberpunk 2077 1.0 - 1920x1080 Ultra Preset | |
| Alienware m17 R4 | |
| MSI GE76 Raider 11UH-472US | |
| Átlagos NVIDIA GeForce RTX 3080 Laptop GPU (52.9 - 84.3, n=9) | |
| Gigabyte Aero 17 HDR YD | |
| GTA V - 1920x1080 High/On (Advanced Graphics Off) AA:2xMSAA + FX AF:8x | |
| Az osztály átlaga Gaming (110.7 - 189, n=70, az elmúlt 2 évben) | |
| Gigabyte Aero 17 HDR YD | |
| MSI GE76 Raider 11UH-472US | |
| Átlagos NVIDIA GeForce RTX 3080 Laptop GPU (137 - 176, n=30) | |
| MSI GE76 Raider 10UH | |
| Alienware m17 R4 | |
| Final Fantasy XV Benchmark - 1920x1080 High Quality | |
| Az osztály átlaga Gaming (41 - 215, n=100, az elmúlt 2 évben) | |
| MSI GE76 Raider 10UH | |
| MSI GE76 Raider 11UH-472US | |
| Átlagos NVIDIA GeForce RTX 3080 Laptop GPU (55.5 - 115, n=34) | |
| Gigabyte Aero 17 HDR YD | |
| Alienware m17 R4 | |
| Dota 2 Reborn - 1920x1080 ultra (3/3) best looking | |
| Az osztály átlaga Gaming (84.8 - 248, n=111, az elmúlt 2 évben) | |
| Gigabyte Aero 17 HDR YD | |
| MSI GE76 Raider 11UH-472US | |
| Alienware m17 R4 | |
| Átlagos NVIDIA GeForce RTX 3080 Laptop GPU (98 - 156, n=45) | |
| MSI GE76 Raider 10UH | |
The Witcher 3 FPS diagram
| alacsony | közepes | magas | ultra | QHD | 4K | |
|---|---|---|---|---|---|---|
| GTA V (2015) | 182 | 177 | 164 | |||
| The Witcher 3 (2015) | 112 | |||||
| Dota 2 Reborn (2015) | 173 | 159 | 148 | 138 | ||
| Final Fantasy XV Benchmark (2018) | 183 | 136 | 108 | |||
| X-Plane 11.11 (2018) | 122 | 104 | 84.2 | |||
| Far Cry 5 (2018) | 136 | 115 | 113 | 110 | ||
| Strange Brigade (2018) | 446 | 265 | 219 | 196 | ||
| Cyberpunk 2077 1.0 (2020) | 105 | 99.2 | 90.6 | 80.1 | ||
| Diablo 4 (2023) | 184.6 | 124 | 65.5 |
Zajszint
| Üresjárat |
| 25 / 27 / 35 dB(A) |
| Terhelés |
| 54 / 55 dB(A) |
 | ||
30 dB csendes 40 dB(A) hallható 50 dB(A) hangos |
||
min: | ||
(-) A felső oldalon a maximális hőmérséklet 46 °C / 115 F, összehasonlítva a 40.4 °C / 105 F átlagával , 21.2 és 68.8 °C között a Gaming osztálynál.
(-) Az alsó maximum 48 °C / 118 F-ig melegszik fel, összehasonlítva a 43.2 °C / 110 F átlagával
(+) Üresjáratban a felső oldal átlagos hőmérséklete 29.3 °C / 85 F, összehasonlítva a 33.9 °C / ### eszközátlaggal class_avg_f### F.
(-) A The Witcher 3 játék során a felső oldal átlaghőmérséklete 40.7 °C / 105 F, összehasonlítva a 33.9 °C / ## eszközátlaggal #class_avg_f### F.
(+) A csuklótámasz és az érintőpad eléri a bőr maximális hőmérsékletét (34 °C / 93.2 F), ezért nem forrók.
(-) A hasonló eszközök csuklótámasz területének átlagos hőmérséklete 28.8 °C / 83.8 F volt (-5.2 °C / -9.4 F).
MSI GE76 Raider 11UH-472US hangelemzés
(+) | a hangszórók viszonylag hangosan tudnak játszani (87 dB)
Basszus 100 - 315 Hz
(±) | csökkentett basszus – átlagosan 14.8%-kal alacsonyabb, mint a medián
(±) | a basszus linearitása átlagos (10.5% delta az előző frekvenciához)
Közepes 400-2000 Hz
(+) | kiegyensúlyozott középpontok – csak 4.1% választja el a mediántól
(+) | a középpontok lineárisak (3.3% delta az előző frekvenciához)
Maximum 2-16 kHz
(+) | kiegyensúlyozott csúcsok – csak 3.2% választja el a mediántól
(+) | a csúcsok lineárisak (4.3% delta az előző frekvenciához képest)
Összességében 100 - 16.000 Hz
(+) | általános hangzás lineáris (12.6% eltérés a mediánhoz képest)
Ugyanazon osztályhoz képest
» 16%Ebben az osztályban az összes tesztelt eszköz %-a jobb volt, 4% hasonló, 81%-kal rosszabb
» A legjobb delta értéke 6%, az átlag 18%, a legrosszabb 132% volt
Az összes tesztelt eszközzel összehasonlítva
» 11% az összes tesztelt eszköz jobb volt, 3% hasonló, 86%-kal rosszabb
» A legjobb delta értéke 4%, az átlag 24%, a legrosszabb 134% volt
Gigabyte Aero 17 HDR YD hangelemzés
(+) | a hangszórók viszonylag hangosan tudnak játszani (88 dB)
Basszus 100 - 315 Hz
(-) | szinte nincs basszus – átlagosan 33.9%-kal alacsonyabb a mediánnál
(±) | a basszus linearitása átlagos (9.6% delta az előző frekvenciához)
Közepes 400-2000 Hz
(+) | kiegyensúlyozott középpontok – csak 2.9% választja el a mediántól
(+) | a középpontok lineárisak (6.5% delta az előző frekvenciához)
Maximum 2-16 kHz
(±) | magasabb csúcsok – átlagosan 5.1%-kal magasabb, mint a medián
(+) | a csúcsok lineárisak (4.7% delta az előző frekvenciához képest)
Összességében 100 - 16.000 Hz
(±) | az általános hang linearitása átlagos (19.8% eltérés a mediánhoz képest)
Ugyanazon osztályhoz képest
» 70%Ebben az osztályban az összes tesztelt eszköz %-a jobb volt, 6% hasonló, 24%-kal rosszabb
» A legjobb delta értéke 6%, az átlag 18%, a legrosszabb 132% volt
Az összes tesztelt eszközzel összehasonlítva
» 50% az összes tesztelt eszköz jobb volt, 7% hasonló, 42%-kal rosszabb
» A legjobb delta értéke 4%, az átlag 24%, a legrosszabb 134% volt
| Kikapcsolt állapot / Készenlét | |
| Üresjárat | |
| Terhelés |
|
Kulcs:
min: | |
| MSI GE76 Raider 11UH-472US i9-11980HK, GeForce RTX 3080 Laptop GPU | MSI GE76 Raider 10UH i7-10870H, GeForce RTX 3080 Laptop GPU | Gigabyte Aero 17 HDR YD i9-11980HK, GeForce RTX 3080 Laptop GPU | Alienware m17 R4 i9-10980HK, GeForce RTX 3080 Laptop GPU | Az osztály átlaga Gaming | |
|---|---|---|---|---|---|
| Power Consumption | -29% | -44% | -116% | -9% | |
| Idle Minimum * (Watt) | 10 | 15.5 -55% | 25 -150% | 42 -320% | 13.1 ? -31% |
| Idle Average * (Watt) | 16 | 31.3 -96% | 28 -75% | 48 -200% | 18.8 ? -18% |
| Idle Maximum * (Watt) | 26 | 31.7 -22% | 40 -54% | 58 -123% | 24.4 ? 6% |
| Load Average * (Watt) | 103 | 93.6 9% | 114 -11% | 124 -20% | 108.5 ? -5% |
| Witcher 3 ultra * (Watt) | 204 | 233 -14% | 176 14% | 219 -7% | |
| Load Maximum * (Watt) | 266 | 260.3 2% | 236 11% | 337 -27% | 254 ? 5% |
* ... a kisebb jobb
Energy consumption during The Witcher 3 / Stress test
| MSI GE76 Raider 11UH-472US i9-11980HK, GeForce RTX 3080 Laptop GPU, 99.9 Wh | MSI GE76 Raider 10UH i7-10870H, GeForce RTX 3080 Laptop GPU, 99.9 Wh | Gigabyte Aero 17 HDR YD i9-11980HK, GeForce RTX 3080 Laptop GPU, 99 Wh | Alienware m17 R4 i9-10980HK, GeForce RTX 3080 Laptop GPU, 86 Wh | Az osztály átlaga Gaming | |
|---|---|---|---|---|---|
| Akkumulátor üzemidő | 11% | -9% | -38% | 12% | |
| Reader / Idle (h) | 7.8 | 8.2 5% | 8.71 ? 12% | ||
| WiFi v1.3 (h) | 5.5 | 6.3 15% | 5.6 2% | 2.4 -56% | 6.98 ? 27% |
| Load (h) | 1.5 | 1.7 13% | 1.2 -20% | 1.2 -20% | 1.47 ? -2% |
Pro
Kontra
Összegzés - A legmodernebb gamer laptop

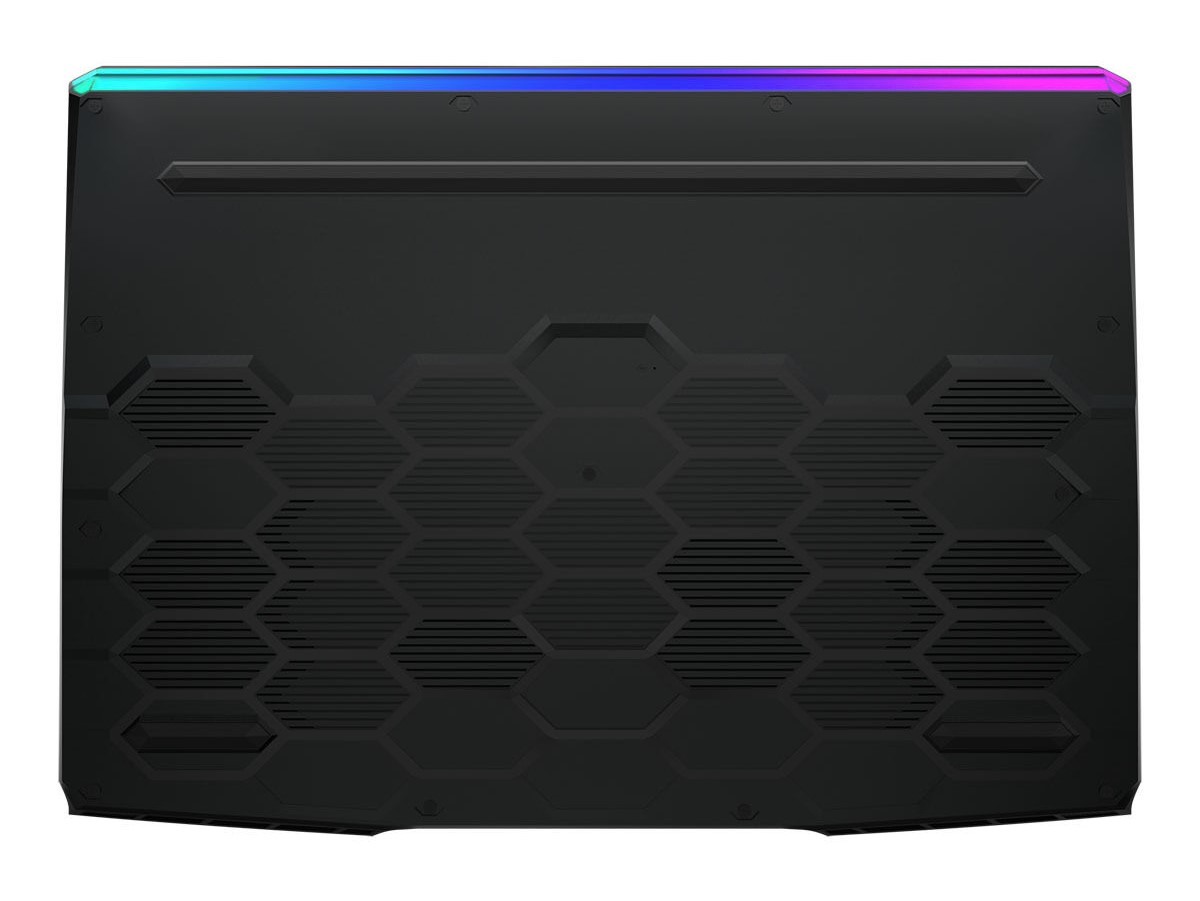
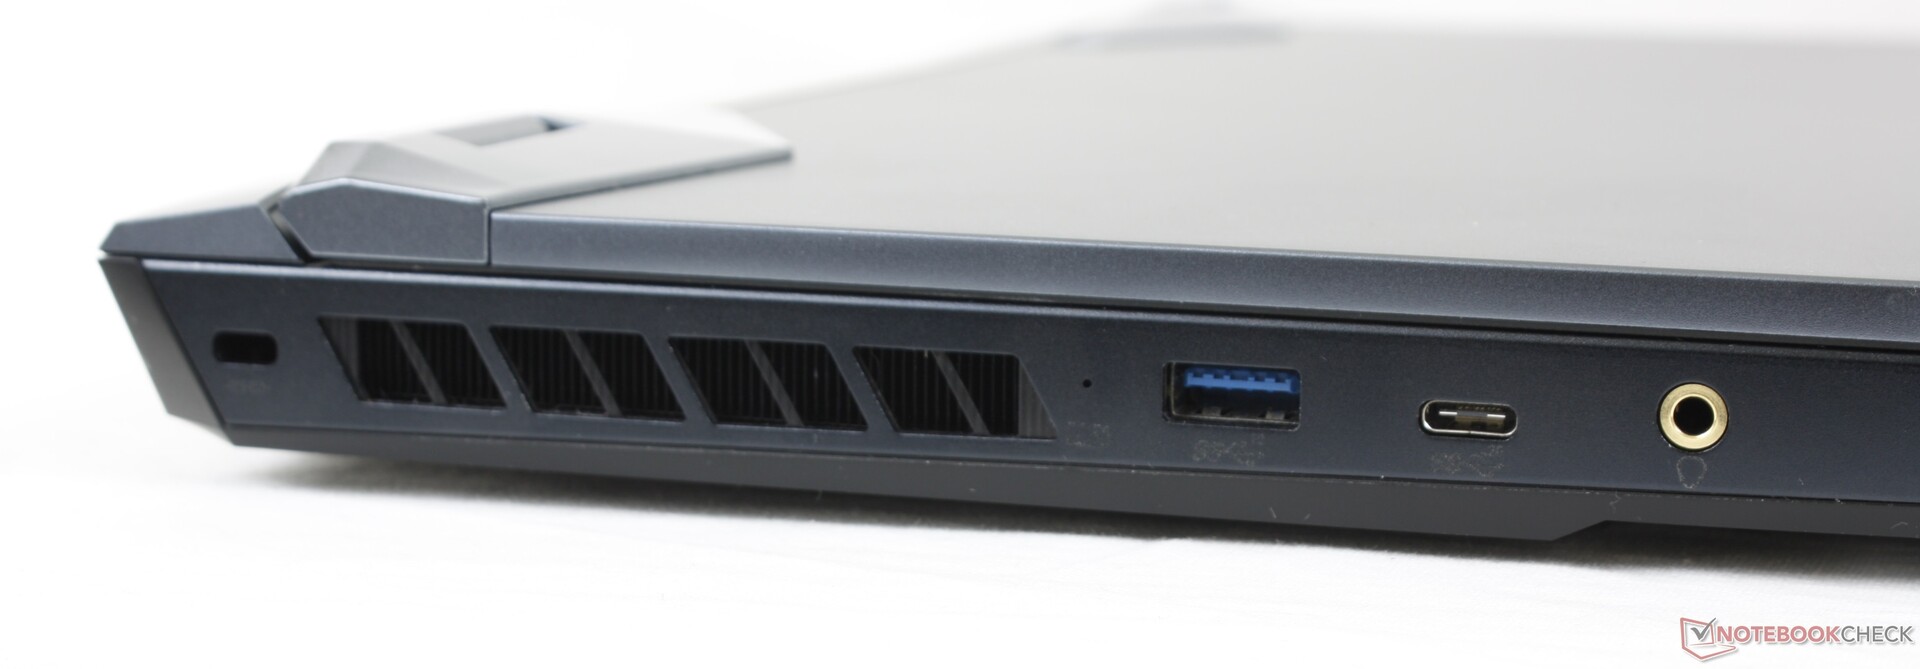
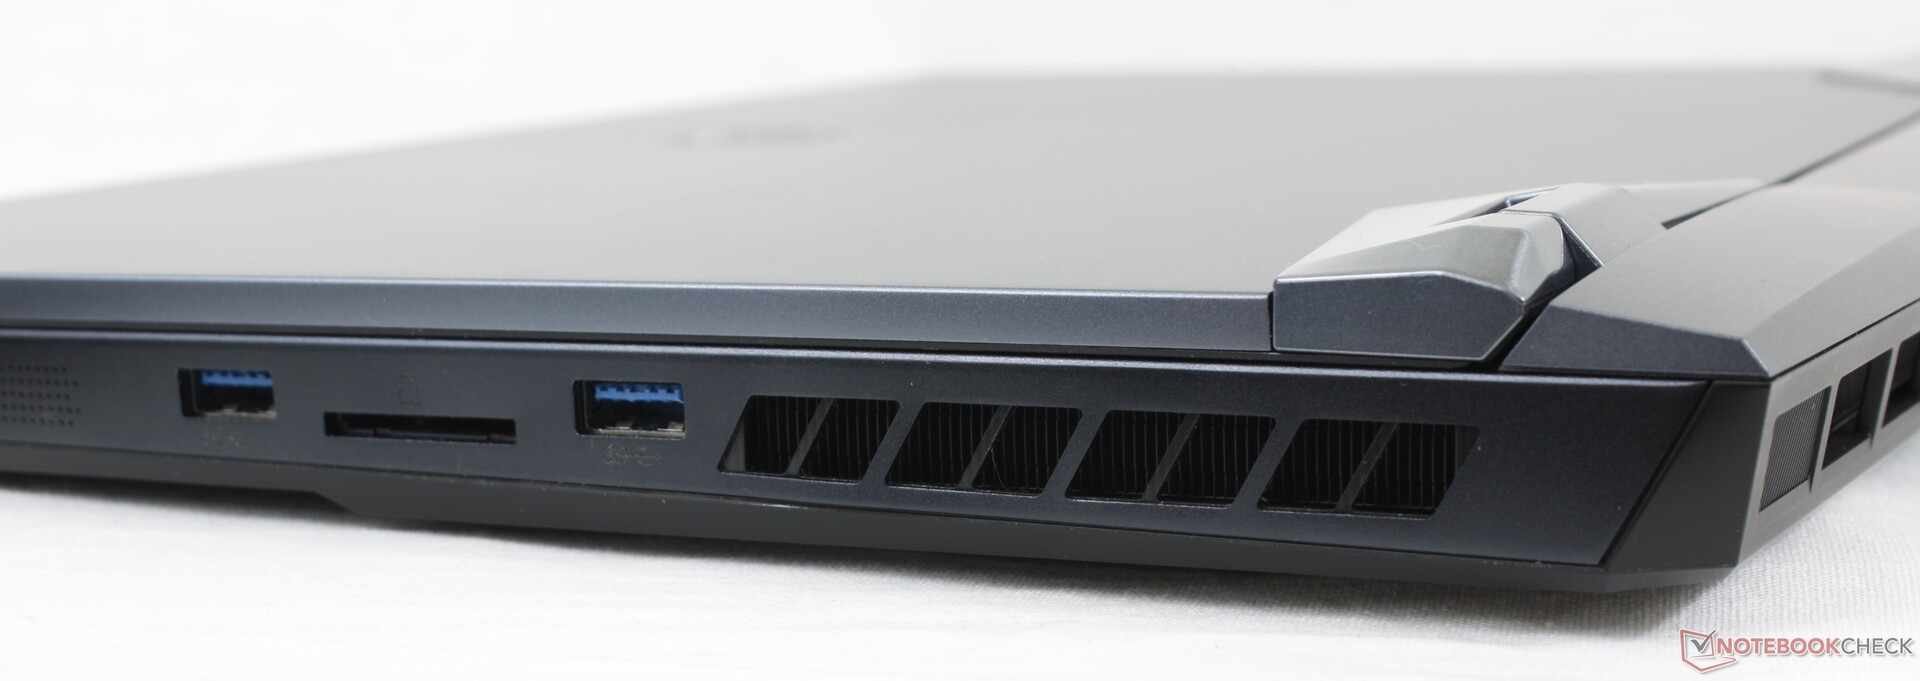
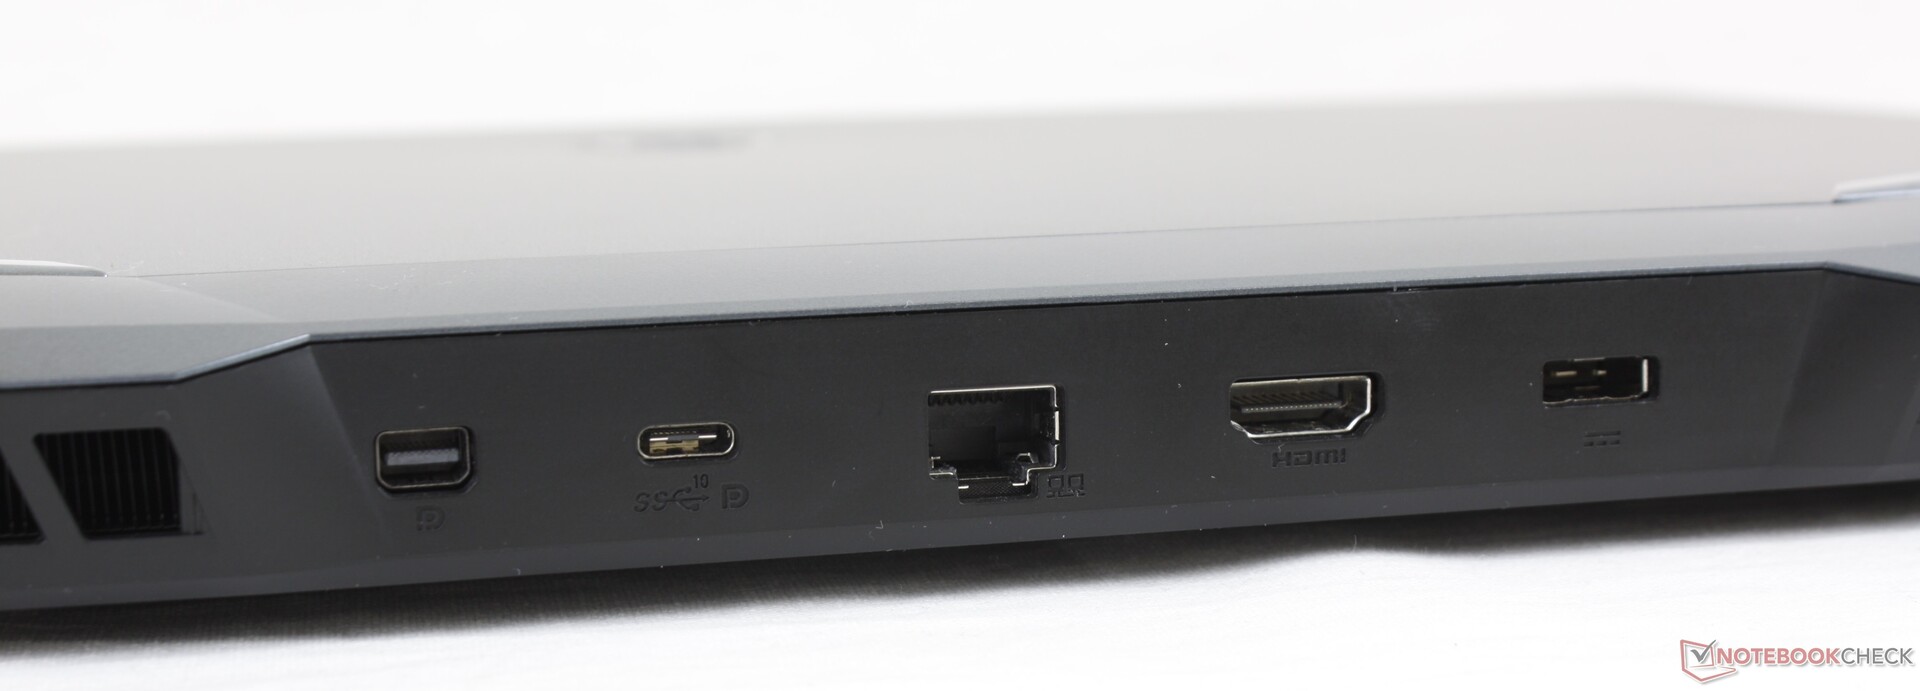
Az MSI GE76 Raider 11UH az elődjének szinte minden funkciójával rendelkezik. Az új processzorral és ugyanazzal az Nvidia GeForce RTX 3080-zal a teljesítmény legalább a GE76 Raider 10UH teljesítményével egyenértékű, és így minden új játékhoz megfelelő. A portválaszték is maradt a régi, de az egyik USB-C port most már a Thunderbolt 4-et is támogatja. A jó karbantartási lehetőségeknek köszönhetően a RAM és a tárolóeszköz egyaránt frissíthető később is.
A GE76 Raider UH11-gyel az MSI egy erős laptopot kínál, amely optimálisan alkalmas minden modern játék futtatására.
A GE76 Raider 10UH modellel ellentétben a 11UH már nagyobb felbontású kijelzővel is kapható. Az általunk tesztelt konfiguráció a legmagasabb, 360 Hz-es frissítési frekvenciával rendelkezik, amely csak Full HD felbontásban érhető el. A panel korlátozott színtere kritikát érdemel, mivel ez az árát tekintve nem elfogadható. Összességében a GE76 az egyik legjobb gamer laptop RTX 3080-nal.
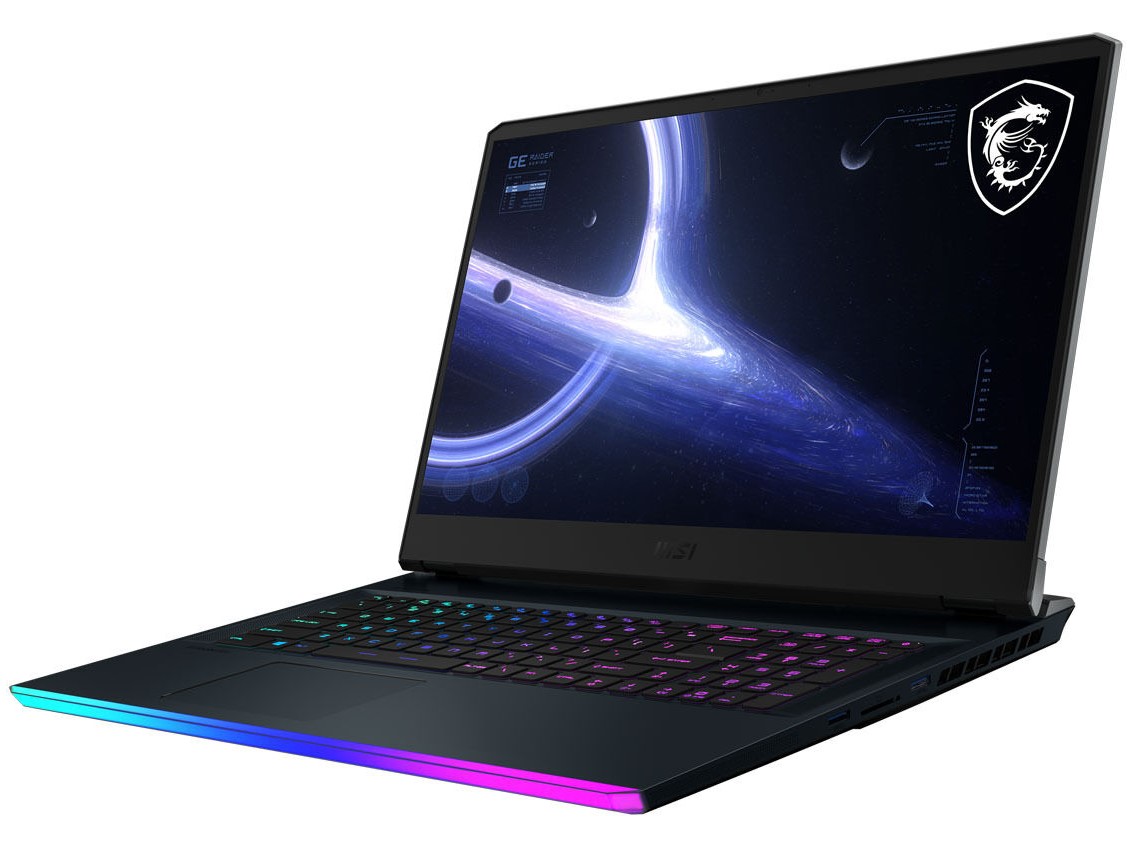
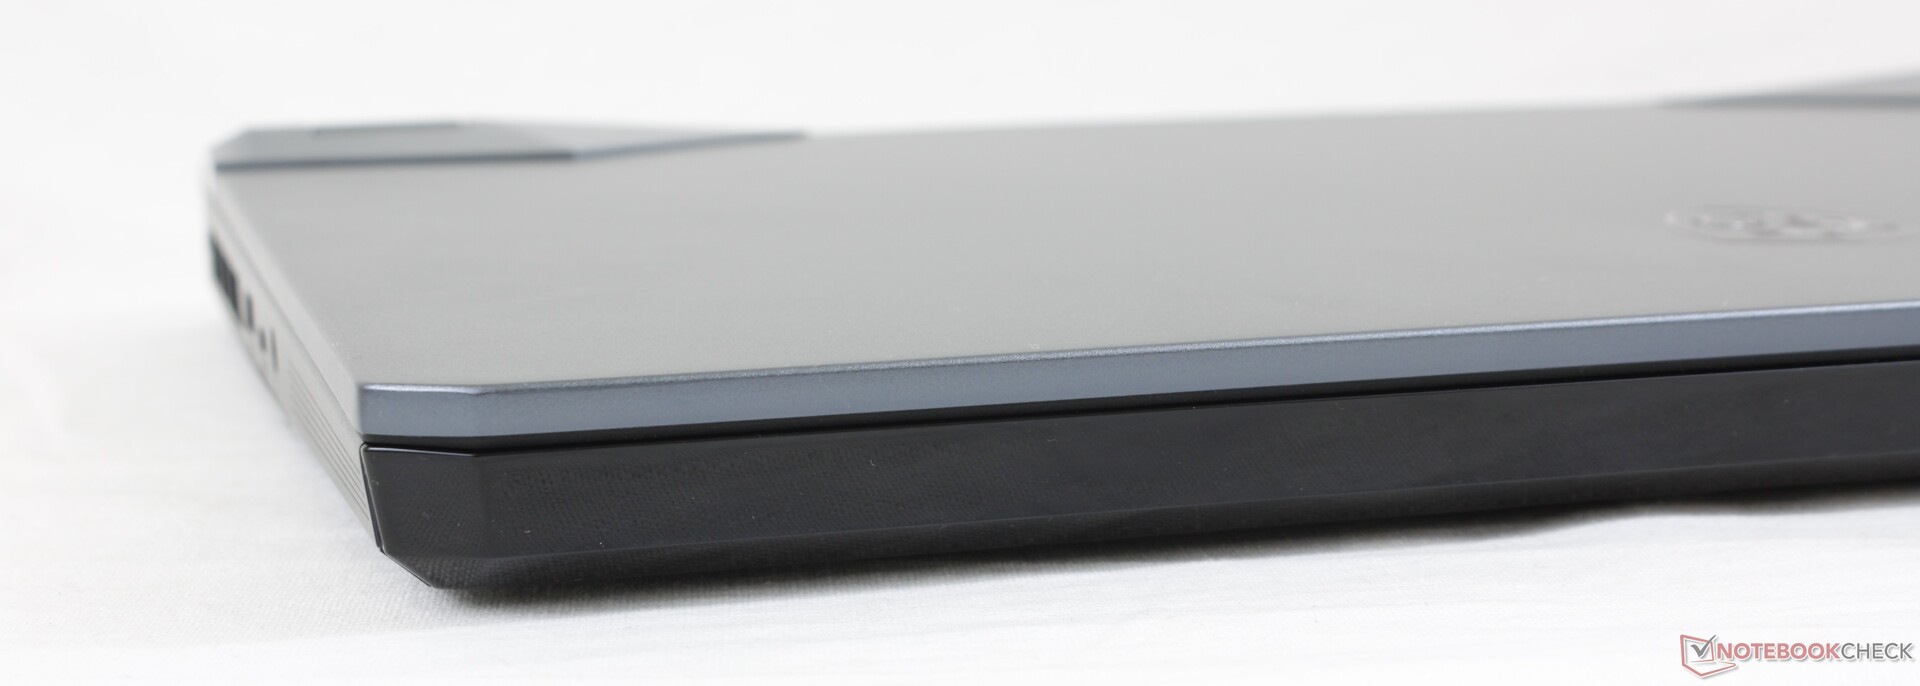
Az, hogy a 2,1 MP-es webkamera valamivel nagyobb felbontású képeket készít, a mindennapi használat során sajnos alig észrevehető. Az MSI GE76 Raider UH11 azonban a méretek tekintetében is különbözik az olyan készülékekhez képest, mint a Gigabyte Aero 17 HDR YD és az Alienware m17 R4. Aki vékony készülékházat keres, annak a konkurencia jobb választás.
Frissítés: A sorozatgyártású modell CPU-teljesítménye most már jelentősen nagyobb, mint a GE76 Raider 10UH elődjéé.
Ár és elérhetőség
A cikk írásának időpontjában a Core i9-11980HK-val felszerelt MSI GE76 Raider 11UH már többnyire elfogyottnak tűnik. Ennek ellenére figyelemmel követhető például az Amazon és a newegg, vagy az MSI webáruháza, ahol a készülék 32 GB RAM-mal és 1 TB SSD-tárolóval konfigurálva 3.399,99 dolláros áron érhető el. Akinek nem okoz gondot a kevésbé erős processzor, annak a Core i7-11800H-val felszerelt változat 3.099 dollárért van raktáron az Amazon-on.
MSI GE76 Raider 11UH-472US
- 08/16/2021 v7 (old)
Mike Wobker
Price comparison

