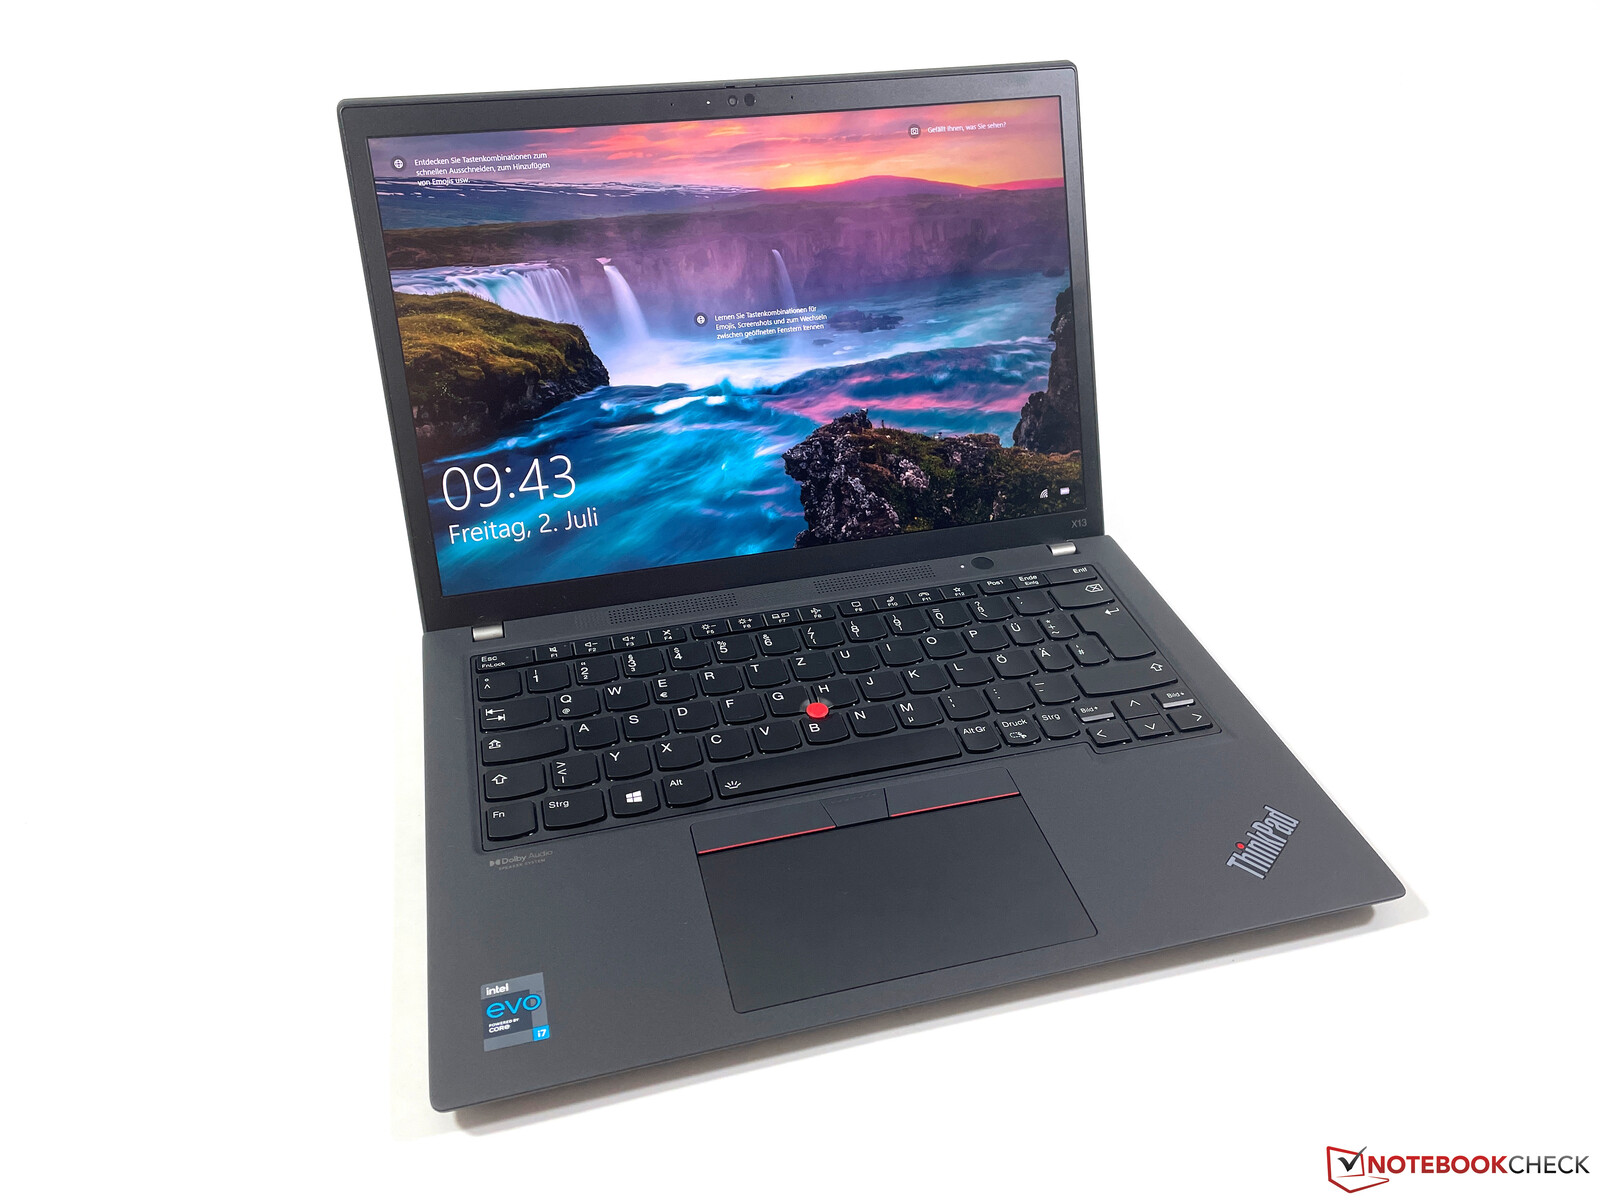
Lenovo ThinkPad X13 G2 rövid értékelés: A tökéletes mobil társ?
Possible Competitors
Értékelés | Dátum | Modell | Súly | Magasság | Méret | Felbontás | Legjobb ár |
|---|---|---|---|---|---|---|---|
| 89.3 % v7 (old) | 12/2021 | Lenovo ThinkPad X13 G2 20WK0024GE i7-1165G7, Iris Xe G7 96EUs | 1.3 kg | 18.2 mm | 13.30" | 1920x1200 | |
| 88.1 % v7 (old) | 12/2020 | Dell XPS 13 9310 Core i7 FHD i7-1165G7, Iris Xe G7 96EUs | 1.3 kg | 14.8 mm | 13.40" | 1920x1200 | |
| 91.1 % v7 (old) | 12/2020 | Apple MacBook Pro 13 Late 2020 M1 Entry (8 / 256 GB) M1, M1 8-Core GPU | 1.4 kg | 15.6 mm | 13.30" | 2560x1600 | |
| 88.7 % v7 (old) | 12/2020 | HP EliteBook 830 G7 i7-10810U, UHD Graphics 620 | 1.3 kg | 18.1 mm | 13.30" | 1920x1080 | |
| 87.8 % v7 (old) | 03/2021 | Huawei MateBook X Pro 2021 i7-1165G7, Iris Xe G7 96EUs | 1.3 kg | 14.6 mm | 13.90" | 3000x2000 |

| Networking | |
| iperf3 transmit AX12 | |
| Lenovo ThinkPad X13 G2 20WK0024GE | |
| Átlagos Intel Wi-Fi 6E AX210 (675 - 1602, n=27) | |
| Huawei MateBook X Pro 2021 | |
| HP EliteBook 830 G7 | |
| Dell XPS 13 9310 Core i7 FHD | |
| Lenovo ThinkPad X13-20UGS00800 | |
| Apple MacBook Pro 13 Late 2020 M1 Entry (8 / 256 GB) | |
| iperf3 receive AX12 | |
| Lenovo ThinkPad X13 G2 20WK0024GE | |
| Dell XPS 13 9310 Core i7 FHD | |
| Huawei MateBook X Pro 2021 | |
| HP EliteBook 830 G7 | |
| Lenovo ThinkPad X13-20UGS00800 | |
| Átlagos Intel Wi-Fi 6E AX210 (914 - 1716, n=27) | |
| Apple MacBook Pro 13 Late 2020 M1 Entry (8 / 256 GB) | |


| |||||||||||||||||||||||||
Fényerő megoszlás: 89 %
Centrumban: 319 cd/m²
Kontraszt: 1333:1 (Fekete: 0.24 cd/m²)
ΔE ColorChecker Calman: 2.7 | ∀{0.5-29.43 Ø4.71}
calibrated: 0.9
ΔE Greyscale Calman: 4.1 | ∀{0.09-98 Ø4.96}
71.1% AdobeRGB 1998 (Argyll 3D)
99.7% sRGB (Argyll 3D)
71.1% Display P3 (Argyll 3D)
Gamma: 2.24
CCT: 6429 K
| Lenovo ThinkPad X13 G2 20WK0024GE NV133WUM-N61, IPS, 1920x1200, 13.3" | Dell XPS 13 9310 Core i7 FHD Sharp LQ134N1, IPS, 1920x1200, 13.4" | Apple MacBook Pro 13 Late 2020 M1 Entry (8 / 256 GB) IPS, 2560x1600, 13.3" | HP EliteBook 830 G7 Chi Mei CMN13A9, IPS, 1920x1080, 13.3" | Huawei MateBook X Pro 2021 TIANMA XM, IPS, 3000x2000, 13.9" | Lenovo ThinkPad X13-20UGS00800 B133HAK01.1, IPS LED, 1920x1080, 13.3" | Lenovo ThinkPad X13 Yoga G2 LP133WQ1-SPF2, IPS LED, 2560x1600, 13.3" | |
|---|---|---|---|---|---|---|---|
| Display | 1% | -5% | -7% | -7% | -2% | ||
| Display P3 Coverage (%) | 71.1 | 70.9 0% | 65.7 -8% | 64.9 -9% | 64.8 -9% | 68.3 -4% | |
| sRGB Coverage (%) | 99.7 | 99.1 -1% | 97.4 -2% | 94.4 -5% | 95.6 -4% | 99.1 -1% | |
| AdobeRGB 1998 Coverage (%) | 71.1 | 72.9 3% | 67.4 -5% | 66.3 -7% | 65.7 -8% | 70.3 -1% | |
| Response Times | -81% | -52% | -69% | -38% | -79% | -78% | |
| Response Time Grey 50% / Grey 80% * (ms) | 30.8 ? | 52 ? -69% | 48 ? -56% | 46.8 ? -52% | 37.6 ? -22% | 56.8 ? -84% | 52 ? -69% |
| Response Time Black / White * (ms) | 17.2 ? | 33.2 ? -93% | 25.2 ? -47% | 32 ? -86% | 26.4 ? -53% | 30 ? -74% | 32 ? -86% |
| PWM Frequency (Hz) | 2475 ? | 122000 ? | 26600 ? | ||||
| Screen | 2% | 37% | 2% | 24% | -23% | 30% | |
| Brightness middle (cd/m²) | 320 | 543.3 70% | 510 59% | 454.5 42% | 502 57% | 331 3% | 460 44% |
| Brightness (cd/m²) | 310 | 524 69% | 491 58% | 435 40% | 474 53% | 315 2% | 423 36% |
| Brightness Distribution (%) | 89 | 92 3% | 94 6% | 91 2% | 89 0% | 90 1% | 85 -4% |
| Black Level * (cd/m²) | 0.24 | 0.38 -58% | 0.29 -21% | 0.27 -13% | 0.33 -38% | 0.21 12% | 0.33 -38% |
| Contrast (:1) | 1333 | 1430 7% | 1759 32% | 1683 26% | 1521 14% | 1576 18% | 1394 5% |
| Colorchecker dE 2000 * | 2.7 | 3.02 -12% | 1.3 52% | 3.12 -16% | 1.35 50% | 6.1 -126% | 1 63% |
| Colorchecker dE 2000 max. * | 7.6 | 7.61 -0% | 3 61% | 4.85 36% | 3.67 52% | 10 -32% | 1.5 80% |
| Colorchecker dE 2000 calibrated * | 0.9 | 1.23 -37% | 1.97 -119% | 1.2 -33% | 1.2 -33% | 0.8 11% | |
| Greyscale dE 2000 * | 4.1 | 5 -22% | 2 51% | 3.1 24% | 1.7 59% | 6.3 -54% | 1.2 71% |
| Gamma | 2.24 98% | 2.02 109% | 2.23 99% | 2.01 109% | 2.24 98% | 2.77 79% | 2.26 97% |
| CCT | 6429 101% | 6550 99% | 6933 94% | 6902 94% | 6440 101% | 6938 94% | 6652 98% |
| Color Space (Percent of AdobeRGB 1998) (%) | 66.8 | 88.3 | 61.5 | 61.1 | 60.7 | 64.4 | |
| Color Space (Percent of sRGB) (%) | 99.6 | 100 | 97 | 94.3 | 95.4 | 99.12 | |
| Teljes átlag (program / beállítások) | -26% /
-10% | -8% /
20% | -24% /
-9% | -7% /
8% | -36% /
-28% | -17% /
8% |
* ... a kisebb jobb
Megjelenítési válaszidők
| ↔ Válaszidő Fekete-fehér | ||
|---|---|---|
| 17.2 ms ... emelkedés és süllyedés ↘ kombinálva | ↗ 8.4 ms emelkedés | 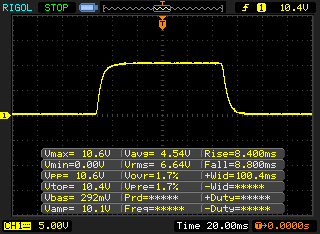 |
| ↘ 8.8 ms ősz | ||
| A képernyő jó reakciósebességet mutat tesztjeinkben, de túl lassú lehet a versenyképes játékosok számára. Összehasonlításképpen, az összes tesztelt eszköz 0.1 (minimum) és 240 (maximum) ms között mozog. » 39 % of all devices are better. Ez azt jelenti, hogy a mért válaszidő jobb, mint az összes vizsgált eszköz átlaga (19.8 ms). | ||
| ↔ Válaszidő 50% szürke és 80% szürke között | ||
| 30.8 ms ... emelkedés és süllyedés ↘ kombinálva | ↗ 14.8 ms emelkedés | 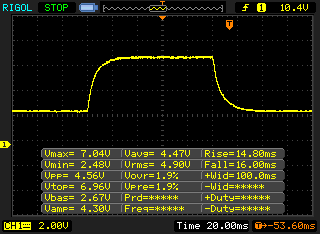 |
| ↘ 16 ms ősz | ||
| A képernyő lassú reakciósebességet mutat tesztjeinkben, és nem lesz kielégítő a játékosok számára. Összehasonlításképpen, az összes tesztelt eszköz 0.165 (minimum) és 636 (maximum) ms között mozog. » 41 % of all devices are better. Ez azt jelenti, hogy a mért válaszidő hasonló az összes vizsgált eszköz átlagához (31 ms). | ||
Képernyő villogása / PWM (impulzusszélesség-moduláció)
| Képernyő villogása / PWM nem érzékelhető | 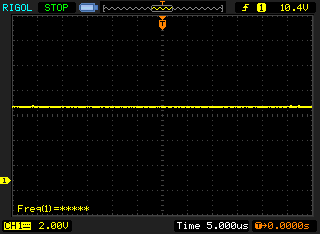 | ||
Összehasonlításképpen: az összes tesztelt eszköz 52 %-a nem használja a PWM-et a kijelző elsötétítésére. Ha PWM-et észleltek, akkor átlagosan 7754 (minimum: 5 - maximum: 343500) Hz-t mértek. | |||
Cinebench R15 Multi Loop
Cinebench R20: CPU (Single Core) | CPU (Multi Core)
Cinebench R15: CPU Single 64Bit | CPU Multi 64Bit
Blender: v2.79 BMW27 CPU
7-Zip 18.03: 7z b 4 -mmt1 | 7z b 4
Geekbench 5.5: Single-Core | Multi-Core
HWBOT x265 Benchmark v2.2: 4k Preset
LibreOffice : 20 Documents To PDF
R Benchmark 2.5: Overall mean
| Cinebench R23 / Single Core | |
| Az osztály átlaga Subnotebook (358 - 2213, n=60, az elmúlt 2 évben) | |
| Lenovo ThinkPad X13 G2 20WK0024GE | |
| Apple MacBook Pro 13 Late 2020 M1 Entry (8 / 256 GB) | |
| Átlagos Intel Core i7-1165G7 (1110 - 1539, n=59) | |
| Huawei MateBook X Pro 2021 | |
| Cinebench R23 / Multi Core | |
| Az osztály átlaga Subnotebook (1555 - 21812, n=59, az elmúlt 2 évben) | |
| Apple MacBook Pro 13 Late 2020 M1 Entry (8 / 256 GB) | |
| Lenovo ThinkPad X13 G2 20WK0024GE | |
| Átlagos Intel Core i7-1165G7 (2525 - 6862, n=64) | |
| Huawei MateBook X Pro 2021 | |
| Cinebench R20 / CPU (Single Core) | |
| Az osztály átlaga Subnotebook (128 - 832, n=56, az elmúlt 2 évben) | |
| Lenovo ThinkPad X13 G2 20WK0024GE | |
| Dell XPS 13 9310 Core i7 FHD | |
| Átlagos Intel Core i7-1165G7 (442 - 589, n=81) | |
| Huawei MateBook X Pro 2021 | |
| Lenovo ThinkPad X13-20UGS00800 | |
| HP EliteBook 830 G7 | |
| Apple MacBook Pro 13 Late 2020 M1 Entry (8 / 256 GB) | |
| Lenovo ThinkPad X13-20T20033GE | |
| Cinebench R20 / CPU (Multi Core) | |
| Az osztály átlaga Subnotebook (579 - 8541, n=56, az elmúlt 2 évben) | |
| Lenovo ThinkPad X13-20UGS00800 | |
| Lenovo ThinkPad X13 G2 20WK0024GE | |
| Apple MacBook Pro 13 Late 2020 M1 Entry (8 / 256 GB) | |
| Átlagos Intel Core i7-1165G7 (1060 - 2657, n=81) | |
| Dell XPS 13 9310 Core i7 FHD | |
| Huawei MateBook X Pro 2021 | |
| HP EliteBook 830 G7 | |
| Lenovo ThinkPad X13-20T20033GE | |
| Cinebench R15 / CPU Single 64Bit | |
| Az osztály átlaga Subnotebook (72.4 - 322, n=56, az elmúlt 2 évben) | |
| Lenovo ThinkPad X13 G2 20WK0024GE | |
| Dell XPS 13 9310 Core i7 FHD | |
| Átlagos Intel Core i7-1165G7 (115 - 230, n=78) | |
| Huawei MateBook X Pro 2021 | |
| Apple MacBook Pro 13 Late 2020 M1 Entry (8 / 256 GB) | |
| Lenovo ThinkPad X13-20UGS00800 | |
| HP EliteBook 830 G7 | |
| Lenovo ThinkPad X13-20T20033GE | |
| Cinebench R15 / CPU Multi 64Bit | |
| Az osztály átlaga Subnotebook (327 - 3345, n=56, az elmúlt 2 évben) | |
| Lenovo ThinkPad X13-20UGS00800 | |
| Apple MacBook Pro 13 Late 2020 M1 Entry (8 / 256 GB) | |
| Lenovo ThinkPad X13 G2 20WK0024GE | |
| Dell XPS 13 9310 Core i7 FHD | |
| Átlagos Intel Core i7-1165G7 (553 - 1027, n=86) | |
| Lenovo ThinkPad X13-20T20033GE | |
| Huawei MateBook X Pro 2021 | |
| Blender / v2.79 BMW27 CPU | |
| Lenovo ThinkPad X13-20T20033GE | |
| Huawei MateBook X Pro 2021 | |
| HP EliteBook 830 G7 | |
| Dell XPS 13 9310 Core i7 FHD | |
| Átlagos Intel Core i7-1165G7 (468 - 1138, n=80) | |
| Lenovo ThinkPad X13 G2 20WK0024GE | |
| Lenovo ThinkPad X13-20UGS00800 | |
| Az osztály átlaga Subnotebook (159 - 2271, n=57, az elmúlt 2 évben) | |
| 7-Zip 18.03 / 7z b 4 -mmt1 | |
| Az osztály átlaga Subnotebook (2643 - 6699, n=58, az elmúlt 2 évben) | |
| Dell XPS 13 9310 Core i7 FHD | |
| Lenovo ThinkPad X13 G2 20WK0024GE | |
| Átlagos Intel Core i7-1165G7 (4478 - 5507, n=80) | |
| Huawei MateBook X Pro 2021 | |
| HP EliteBook 830 G7 | |
| Lenovo ThinkPad X13-20UGS00800 | |
| Lenovo ThinkPad X13-20T20033GE | |
| 7-Zip 18.03 / 7z b 4 | |
| Az osztály átlaga Subnotebook (11668 - 77867, n=56, az elmúlt 2 évben) | |
| Lenovo ThinkPad X13-20UGS00800 | |
| Lenovo ThinkPad X13 G2 20WK0024GE | |
| Átlagos Intel Core i7-1165G7 (15347 - 27405, n=80) | |
| HP EliteBook 830 G7 | |
| Dell XPS 13 9310 Core i7 FHD | |
| Huawei MateBook X Pro 2021 | |
| Lenovo ThinkPad X13-20T20033GE | |
| Geekbench 5.5 / Single-Core | |
| Az osztály átlaga Subnotebook (726 - 2224, n=48, az elmúlt 2 évben) | |
| Apple MacBook Pro 13 Late 2020 M1 Entry (8 / 256 GB) | |
| Dell XPS 13 9310 Core i7 FHD | |
| Lenovo ThinkPad X13 G2 20WK0024GE | |
| Átlagos Intel Core i7-1165G7 (1302 - 1595, n=77) | |
| Huawei MateBook X Pro 2021 | |
| HP EliteBook 830 G7 | |
| Lenovo ThinkPad X13-20UGS00800 | |
| Lenovo ThinkPad X13-20T20033GE | |
| Geekbench 5.5 / Multi-Core | |
| Az osztály átlaga Subnotebook (2557 - 17218, n=48, az elmúlt 2 évben) | |
| Apple MacBook Pro 13 Late 2020 M1 Entry (8 / 256 GB) | |
| Dell XPS 13 9310 Core i7 FHD | |
| Lenovo ThinkPad X13 G2 20WK0024GE | |
| Lenovo ThinkPad X13-20UGS00800 | |
| Huawei MateBook X Pro 2021 | |
| Átlagos Intel Core i7-1165G7 (3078 - 5926, n=77) | |
| Lenovo ThinkPad X13-20T20033GE | |
| HP EliteBook 830 G7 | |
| HWBOT x265 Benchmark v2.2 / 4k Preset | |
| Az osztály átlaga Subnotebook (0.97 - 25.1, n=56, az elmúlt 2 évben) | |
| Lenovo ThinkPad X13-20UGS00800 | |
| Lenovo ThinkPad X13 G2 20WK0024GE | |
| Átlagos Intel Core i7-1165G7 (1.39 - 8.47, n=80) | |
| Dell XPS 13 9310 Core i7 FHD | |
| Huawei MateBook X Pro 2021 | |
| HP EliteBook 830 G7 | |
| Lenovo ThinkPad X13-20T20033GE | |
| LibreOffice / 20 Documents To PDF | |
| HP EliteBook 830 G7 | |
| Lenovo ThinkPad X13-20UGS00800 | |
| Az osztály átlaga Subnotebook (39.9 - 220, n=55, az elmúlt 2 évben) | |
| Lenovo ThinkPad X13-20T20033GE | |
| Átlagos Intel Core i7-1165G7 (21.5 - 88.1, n=78) | |
| Dell XPS 13 9310 Core i7 FHD | |
| Lenovo ThinkPad X13 G2 20WK0024GE | |
| Huawei MateBook X Pro 2021 | |
| R Benchmark 2.5 / Overall mean | |
| Lenovo ThinkPad X13-20T20033GE | |
| HP EliteBook 830 G7 | |
| Lenovo ThinkPad X13-20UGS00800 | |
| Huawei MateBook X Pro 2021 | |
| Átlagos Intel Core i7-1165G7 (0.552 - 1.002, n=80) | |
| Dell XPS 13 9310 Core i7 FHD | |
| Lenovo ThinkPad X13 G2 20WK0024GE | |
| Az osztály átlaga Subnotebook (0.4024 - 1.456, n=57, az elmúlt 2 évben) | |
* ... a kisebb jobb
| PCMark 10 / Score | |
| Az osztály átlaga Subnotebook (4920 - 9939, n=45, az elmúlt 2 évben) | |
| Lenovo ThinkPad X13 G2 20WK0024GE | |
| Átlagos Intel Core i7-1165G7, Intel Iris Xe Graphics G7 96EUs (4531 - 5454, n=50) | |
| Lenovo ThinkPad X13-20UGS00800 | |
| Dell XPS 13 9310 Core i7 FHD | |
| Huawei MateBook X Pro 2021 | |
| HP EliteBook 830 G7 | |
| Lenovo ThinkPad X13-20T20033GE | |
| PCMark 10 / Essentials | |
| Az osztály átlaga Subnotebook (8552 - 11646, n=45, az elmúlt 2 évben) | |
| Huawei MateBook X Pro 2021 | |
| Lenovo ThinkPad X13 G2 20WK0024GE | |
| Átlagos Intel Core i7-1165G7, Intel Iris Xe Graphics G7 96EUs (8997 - 11505, n=50) | |
| Dell XPS 13 9310 Core i7 FHD | |
| Lenovo ThinkPad X13-20UGS00800 | |
| Lenovo ThinkPad X13-20T20033GE | |
| HP EliteBook 830 G7 | |
| PCMark 10 / Productivity | |
| Az osztály átlaga Subnotebook (5435 - 16606, n=45, az elmúlt 2 évben) | |
| Lenovo ThinkPad X13-20UGS00800 | |
| HP EliteBook 830 G7 | |
| Lenovo ThinkPad X13 G2 20WK0024GE | |
| Dell XPS 13 9310 Core i7 FHD | |
| Lenovo ThinkPad X13-20T20033GE | |
| Huawei MateBook X Pro 2021 | |
| Átlagos Intel Core i7-1165G7, Intel Iris Xe Graphics G7 96EUs (5570 - 7136, n=50) | |
| PCMark 10 / Digital Content Creation | |
| Az osztály átlaga Subnotebook (5722 - 13779, n=45, az elmúlt 2 évben) | |
| Lenovo ThinkPad X13 G2 20WK0024GE | |
| Átlagos Intel Core i7-1165G7, Intel Iris Xe Graphics G7 96EUs (4083 - 5550, n=50) | |
| Lenovo ThinkPad X13-20UGS00800 | |
| Dell XPS 13 9310 Core i7 FHD | |
| Huawei MateBook X Pro 2021 | |
| HP EliteBook 830 G7 | |
| Lenovo ThinkPad X13-20T20033GE | |
| PCMark 10 Score | 5105 pontok | |
Segítség | ||
| DPC Latencies / LatencyMon - interrupt to process latency (max), Web, Youtube, Prime95 | |
| Lenovo ThinkPad X13-20UGS00800 | |
| Huawei MateBook X Pro 2021 | |
| Dell XPS 13 9310 Core i7 FHD | |
| Lenovo ThinkPad X13-20T20033GE | |
| HP EliteBook 830 G7 | |
| Lenovo ThinkPad X13 G2 20WK0024GE | |
* ... a kisebb jobb
| Lenovo ThinkPad X13 G2 20WK0024GE SK Hynix HFS512 GDE9X081N | Dell XPS 13 9310 Core i7 FHD Micron 2300 512GB MTFDHBA512TDV | HP EliteBook 830 G7 Samsung SSD PM981a MZVLB512HBJQ | Huawei MateBook X Pro 2021 Samsung PM981a MZVLB1T0HBLR | Átlagos SK Hynix HFS512 GDE9X081N | |
|---|---|---|---|---|---|
| CrystalDiskMark 5.2 / 6 | -12% | -7% | 14% | -5% | |
| Write 4K (MB/s) | 171.4 | 97.5 -43% | 118.3 -31% | 197.5 15% | 137.4 ? -20% |
| Read 4K (MB/s) | 70.8 | 50.9 -28% | 60.4 -15% | 52.9 -25% | 61.7 ? -13% |
| Write Seq (MB/s) | 1771 | 1811 2% | 2067 17% | 2174 23% | 2043 ? 15% |
| Read Seq (MB/s) | 1755 | 1836 5% | 2394 36% | 2156 23% | 1800 ? 3% |
| Write 4K Q32T1 (MB/s) | 525 | 521 -1% | 325.5 -38% | 632 20% | 463 ? -12% |
| Read 4K Q32T1 (MB/s) | 479.5 | 357.5 -25% | 332.2 -31% | 694 45% | 408 ? -15% |
| Write Seq Q32T1 (MB/s) | 2818 | 2879 2% | 2978 6% | 3017 7% | 2893 ? 3% |
| Read Seq Q32T1 (MB/s) | 3548 | 3204 -10% | 3552 0% | 3561 0% | 3585 ? 1% |
| AS SSD | -155% | -57% | -9% | -15% | |
| Seq Read (MB/s) | 2776 | 2091 -25% | 2081 -25% | 2794 1% | 2727 ? -2% |
| Seq Write (MB/s) | 1461 | 1396 -4% | 1433 -2% | 2385 63% | 1664 ? 14% |
| 4K Read (MB/s) | 63.8 | 49.29 -23% | 49.92 -22% | 60.7 -5% | 53.6 ? -16% |
| 4K Write (MB/s) | 209.4 | 104.2 -50% | 119.1 -43% | 180.8 -14% | 152.5 ? -27% |
| 4K-64 Read (MB/s) | 1148 | 827 -28% | 585 -49% | 1768 54% | 1025 ? -11% |
| 4K-64 Write (MB/s) | 1623 | 1636 1% | 1630 0% | 1800 11% | 1731 ? 7% |
| Access Time Read * (ms) | 0.032 | 0.066 -106% | 0.043 -34% | 0.037 -16% | 0.05417 ? -69% |
| Access Time Write * (ms) | 0.019 | 0.365 -1821% | 0.097 -411% | 0.073 -284% | 0.026 ? -37% |
| Score Read (Points) | 1489 | 1086 -27% | 843 -43% | 2108 42% | 1351 ? -9% |
| Score Write (Points) | 1978 | 1880 -5% | 1892 -4% | 2219 12% | 2051 ? 4% |
| Score Total (Points) | 4178 | 3499 -16% | 3149 -25% | 5392 29% | 4051 ? -3% |
| Copy ISO MB/s (MB/s) | 1833 | 1544 -16% | 2452 34% | 2065 13% | 2050 ? 12% |
| Copy Program MB/s (MB/s) | 993 | 613 -38% | 72.2 -93% | 734 -26% | 542 ? -45% |
| Copy Game MB/s (MB/s) | 1607 | 1451 -10% | 404 -75% | 1629 1% | 1228 ? -24% |
| Teljes átlag (program / beállítások) | -84% /
-103% | -32% /
-39% | 3% /
-1% | -10% /
-11% |
* ... a kisebb jobb

Disk Throttling: DiskSpd Read Loop, Queue Depth 8
| 3DMark 11 - 1280x720 Performance GPU | |
| Az osztály átlaga Subnotebook (995 - 18489, n=54, az elmúlt 2 évben) | |
| Lenovo ThinkPad X13 G2 20WK0024GE | |
| Dell XPS 13 9310 Core i7 FHD | |
| Átlagos Intel Iris Xe Graphics G7 96EUs (2867 - 7676, n=209) | |
| Huawei MateBook X Pro 2021 | |
| Lenovo ThinkPad X13-20UGS00800 | |
| HP EliteBook 830 G7 | |
| Lenovo ThinkPad X13-20T20033GE | |
| 3DMark | |
| 1280x720 Cloud Gate Standard Graphics | |
| Az osztály átlaga Subnotebook (5577 - 61591, n=28, az elmúlt 2 évben) | |
| Lenovo ThinkPad X13 G2 20WK0024GE | |
| Huawei MateBook X Pro 2021 | |
| Átlagos Intel Iris Xe Graphics G7 96EUs (13162 - 39880, n=187) | |
| Dell XPS 13 9310 Core i7 FHD | |
| Lenovo ThinkPad X13-20UGS00800 | |
| HP EliteBook 830 G7 | |
| 1920x1080 Fire Strike Graphics | |
| Az osztály átlaga Subnotebook (832 - 32931, n=56, az elmúlt 2 évben) | |
| Lenovo ThinkPad X13 G2 20WK0024GE | |
| Huawei MateBook X Pro 2021 | |
| Átlagos Intel Iris Xe Graphics G7 96EUs (2286 - 6624, n=222) | |
| Dell XPS 13 9310 Core i7 FHD | |
| Lenovo ThinkPad X13-20UGS00800 | |
| HP EliteBook 830 G7 | |
| Lenovo ThinkPad X13-20T20033GE | |
| 2560x1440 Time Spy Graphics | |
| Az osztály átlaga Subnotebook (804 - 14477, n=55, az elmúlt 2 évben) | |
| Lenovo ThinkPad X13 G2 20WK0024GE | |
| Átlagos Intel Iris Xe Graphics G7 96EUs (707 - 1890, n=218) | |
| Huawei MateBook X Pro 2021 | |
| Dell XPS 13 9310 Core i7 FHD | |
| Lenovo ThinkPad X13-20UGS00800 | |
| HP EliteBook 830 G7 | |
| Lenovo ThinkPad X13-20T20033GE | |
| 3DMark 11 Performance | 7169 pontok | |
| 3DMark Ice Storm Standard Score | 95856 pontok | |
| 3DMark Cloud Gate Standard Score | 20532 pontok | |
| 3DMark Fire Strike Score | 4795 pontok | |
| 3DMark Time Spy Score | 1746 pontok | |
Segítség | ||
| F1 2020 | |
| 1920x1080 Ultra High Preset AA:T AF:16x | |
| Lenovo ThinkPad X13 G2 20WK0024GE | |
| Átlagos Intel Iris Xe Graphics G7 96EUs (15 - 28, n=31) | |
| 1920x1080 High Preset AA:T AF:16x | |
| Lenovo ThinkPad X13 G2 20WK0024GE | |
| Átlagos Intel Iris Xe Graphics G7 96EUs (22 - 44.4, n=32) | |
| 1920x1080 Medium Preset AF:16x | |
| Lenovo ThinkPad X13 G2 20WK0024GE | |
| Átlagos Intel Iris Xe Graphics G7 96EUs (23.1 - 57.5, n=34) | |
| 1280x720 Ultra Low Preset | |
| Lenovo ThinkPad X13 G2 20WK0024GE | |
| Átlagos Intel Iris Xe Graphics G7 96EUs (49 - 109.6, n=34) | |
| X-Plane 11.11 | |
| 1920x1080 high (fps_test=3) | |
| Az osztály átlaga Subnotebook (20.7 - 50.5, n=53, az elmúlt 2 évben) | |
| Dell XPS 13 9310 Core i7 FHD | |
| Lenovo ThinkPad X13 G2 20WK0024GE | |
| Átlagos Intel Iris Xe Graphics G7 96EUs (11.1 - 59.8, n=213) | |
| Huawei MateBook X Pro 2021 | |
| Lenovo ThinkPad X13-20UGS00800 | |
| Lenovo ThinkPad X13-20T20033GE | |
| HP EliteBook 830 G7 | |
| 1920x1080 med (fps_test=2) | |
| Az osztály átlaga Subnotebook (25.1 - 65.9, n=53, az elmúlt 2 évben) | |
| Dell XPS 13 9310 Core i7 FHD | |
| Lenovo ThinkPad X13 G2 20WK0024GE | |
| Átlagos Intel Iris Xe Graphics G7 96EUs (11.6 - 69.5, n=214) | |
| Huawei MateBook X Pro 2021 | |
| Lenovo ThinkPad X13-20UGS00800 | |
| Lenovo ThinkPad X13-20T20033GE | |
| HP EliteBook 830 G7 | |
| 1280x720 low (fps_test=1) | |
| Az osztály átlaga Subnotebook (33.3 - 82.5, n=58, az elmúlt 2 évben) | |
| Dell XPS 13 9310 Core i7 FHD | |
| Lenovo ThinkPad X13 G2 20WK0024GE | |
| Átlagos Intel Iris Xe Graphics G7 96EUs (13.4 - 88.4, n=213) | |
| Lenovo ThinkPad X13-20UGS00800 | |
| Huawei MateBook X Pro 2021 | |
| Lenovo ThinkPad X13-20T20033GE | |
| HP EliteBook 830 G7 | |
Witcher 3 FPS Diagram
| alacsony | közepes | magas | ultra | |
|---|---|---|---|---|
| GTA V (2015) | 89.2 | 27.4 | 10.8 | |
| The Witcher 3 (2015) | 97 | 58 | 31 | 12.7 |
| Dota 2 Reborn (2015) | 83 | 72.1 | 46.9 | 44.4 |
| Final Fantasy XV Benchmark (2018) | 39.3 | 21.3 | 15.8 | |
| X-Plane 11.11 (2018) | 43.2 | 36.1 | 32.4 | |
| Far Cry 5 (2018) | 55 | 26 | 24 | 21 |
| Strange Brigade (2018) | 91.2 | 38.9 | 30.9 | 25 |
| F1 2020 (2020) | 88 | 46 | 34 | 23 |
Zajszint
| Üresjárat |
| 25.5 / 25.5 / 29 dB(A) |
| Terhelés |
| 37.4 / 37.4 dB(A) |
 | ||
30 dB csendes 40 dB(A) hallható 50 dB(A) hangos |
||
min: | ||
| Lenovo ThinkPad X13 G2 20WK0024GE Iris Xe G7 96EUs, i7-1165G7, SK Hynix HFS512 GDE9X081N | Dell XPS 13 9310 Core i7 FHD Iris Xe G7 96EUs, i7-1165G7, Micron 2300 512GB MTFDHBA512TDV | Apple MacBook Pro 13 Late 2020 M1 Entry (8 / 256 GB) M1 8-Core GPU, M1, Apple SSD AP0256 | HP EliteBook 830 G7 UHD Graphics 620, i7-10810U, Samsung SSD PM981a MZVLB512HBJQ | Huawei MateBook X Pro 2021 Iris Xe G7 96EUs, i7-1165G7, Samsung PM981a MZVLB1T0HBLR | Lenovo ThinkPad X13-20UGS00800 Vega 7, R7 PRO 4750U, Samsung SSD PM981a MZVLB512HBJQ | |
|---|---|---|---|---|---|---|
| Noise | 6% | -7% | 0% | 7% | -2% | |
| off / környezet * (dB) | 25.5 | 25.7 -1% | 29.2 -15% | 26.8 -5% | 25.4 -0% | 29.1 -14% |
| Idle Minimum * (dB) | 25.5 | 25.7 -1% | 29.2 -15% | 27.1 -6% | 25.6 -0% | 29.1 -14% |
| Idle Average * (dB) | 25.5 | 25.7 -1% | 29.2 -15% | 27.1 -6% | 25.6 -0% | 29.1 -14% |
| Idle Maximum * (dB) | 29 | 25.9 11% | 29.2 -1% | 27.1 7% | 25.6 12% | 29.1 -0% |
| Load Average * (dB) | 37.4 | 26.2 30% | 32.1 14% | 31.4 16% | 28.7 23% | 31.1 17% |
| Witcher 3 ultra * (dB) | 37.4 | 36.5 2% | 32 14% | |||
| Load Maximum * (dB) | 37.4 | 36.6 2% | 41.9 -12% | 39 -4% | 38.2 -2% | 31.8 15% |
* ... a kisebb jobb
(-) A felső oldalon a maximális hőmérséklet 53.9 °C / 129 F, összehasonlítva a 35.9 °C / 97 F átlagával , 21.4 és 59 °C között a Subnotebook osztálynál.
(-) Az alsó maximum 49.1 °C / 120 F-ig melegszik fel, összehasonlítva a 39.2 °C / 103 F átlagával
(+) Üresjáratban a felső oldal átlagos hőmérséklete 24 °C / 75 F, összehasonlítva a 30.8 °C / ### eszközátlaggal class_avg_f### F.
(-) A The Witcher 3 játék során a felső oldal átlaghőmérséklete 39.4 °C / 103 F, összehasonlítva a 30.8 °C / ## eszközátlaggal #class_avg_f### F.
(±) A csuklótámasz és az érintőpad tapintásra nagyon felforrósodhat, maximum 37 °C / 98.6 F.
(-) A hasonló eszközök csuklótámasz területének átlagos hőmérséklete 28.2 °C / 82.8 F volt (-8.8 °C / -15.8 F).
Lenovo ThinkPad X13 G2 20WK0024GE hangelemzés
(±) | a hangszóró hangereje átlagos, de jó (77.4 dB)
Basszus 100 - 315 Hz
(-) | szinte nincs basszus – átlagosan 21.2%-kal alacsonyabb a mediánnál
(±) | a basszus linearitása átlagos (7.8% delta az előző frekvenciához)
Közepes 400-2000 Hz
(+) | kiegyensúlyozott középpontok – csak 3.5% választja el a mediántól
(±) | a középpontok linearitása átlagos (7.6% delta az előző gyakorisághoz)
Maximum 2-16 kHz
(+) | kiegyensúlyozott csúcsok – csak 1.5% választja el a mediántól
(+) | a csúcsok lineárisak (2.8% delta az előző frekvenciához képest)
Összességében 100 - 16.000 Hz
(±) | az általános hang linearitása átlagos (18% eltérés a mediánhoz képest)
Ugyanazon osztályhoz képest
» 51%Ebben az osztályban az összes tesztelt eszköz %-a jobb volt, 8% hasonló, 41%-kal rosszabb
» A legjobb delta értéke 5%, az átlag 18%, a legrosszabb 53% volt
Az összes tesztelt eszközzel összehasonlítva
» 38% az összes tesztelt eszköz jobb volt, 8% hasonló, 54%-kal rosszabb
» A legjobb delta értéke 4%, az átlag 23%, a legrosszabb 134% volt
Apple MacBook Pro 13 Late 2020 M1 Entry (8 / 256 GB) hangelemzés
(±) | a hangszóró hangereje átlagos, de jó (77.5 dB)
Basszus 100 - 315 Hz
(±) | csökkentett basszus – átlagosan 8.7%-kal alacsonyabb, mint a medián
(±) | a basszus linearitása átlagos (8.6% delta az előző frekvenciához)
Közepes 400-2000 Hz
(+) | kiegyensúlyozott középpontok – csak 4.2% választja el a mediántól
(+) | a középpontok lineárisak (4.2% delta az előző frekvenciához)
Maximum 2-16 kHz
(+) | kiegyensúlyozott csúcsok – csak 1.2% választja el a mediántól
(+) | a csúcsok lineárisak (4% delta az előző frekvenciához képest)
Összességében 100 - 16.000 Hz
(+) | általános hangzás lineáris (12.9% eltérés a mediánhoz képest)
Ugyanazon osztályhoz képest
» 20%Ebben az osztályban az összes tesztelt eszköz %-a jobb volt, 5% hasonló, 75%-kal rosszabb
» A legjobb delta értéke 5%, az átlag 18%, a legrosszabb 53% volt
Az összes tesztelt eszközzel összehasonlítva
» 12% az összes tesztelt eszköz jobb volt, 3% hasonló, 85%-kal rosszabb
» A legjobb delta értéke 4%, az átlag 23%, a legrosszabb 134% volt
Huawei MateBook X Pro 2021 hangelemzés
(+) | a hangszórók viszonylag hangosan tudnak játszani (82.7 dB)
Basszus 100 - 315 Hz
(±) | csökkentett basszus – átlagosan 13.6%-kal alacsonyabb, mint a medián
(±) | a basszus linearitása átlagos (10.1% delta az előző frekvenciához)
Közepes 400-2000 Hz
(+) | kiegyensúlyozott középpontok – csak 2.9% választja el a mediántól
(+) | a középpontok lineárisak (3.3% delta az előző frekvenciához)
Maximum 2-16 kHz
(+) | kiegyensúlyozott csúcsok – csak 4.6% választja el a mediántól
(±) | a csúcsok linearitása átlagos (8.2% delta az előző gyakorisághoz)
Összességében 100 - 16.000 Hz
(+) | általános hangzás lineáris (11.8% eltérés a mediánhoz képest)
Ugyanazon osztályhoz képest
» 13%Ebben az osztályban az összes tesztelt eszköz %-a jobb volt, 4% hasonló, 83%-kal rosszabb
» A legjobb delta értéke 5%, az átlag 18%, a legrosszabb 53% volt
Az összes tesztelt eszközzel összehasonlítva
» 9% az összes tesztelt eszköz jobb volt, 3% hasonló, 89%-kal rosszabb
» A legjobb delta értéke 4%, az átlag 23%, a legrosszabb 134% volt
| Kikapcsolt állapot / Készenlét | |
| Üresjárat | |
| Terhelés |
|
Kulcs:
min: | |
| Lenovo ThinkPad X13 G2 20WK0024GE i7-1165G7, Iris Xe G7 96EUs, SK Hynix HFS512 GDE9X081N, IPS, 1920x1200, 13.3" | Dell XPS 13 9310 Core i7 FHD i7-1165G7, Iris Xe G7 96EUs, Micron 2300 512GB MTFDHBA512TDV, IPS, 1920x1200, 13.4" | Apple MacBook Pro 13 Late 2020 M1 Entry (8 / 256 GB) M1, M1 8-Core GPU, Apple SSD AP0256, IPS, 2560x1600, 13.3" | HP EliteBook 830 G7 i7-10810U, UHD Graphics 620, Samsung SSD PM981a MZVLB512HBJQ, IPS, 1920x1080, 13.3" | Huawei MateBook X Pro 2021 i7-1165G7, Iris Xe G7 96EUs, Samsung PM981a MZVLB1T0HBLR, IPS, 3000x2000, 13.9" | Lenovo ThinkPad X13-20UGS00800 R7 PRO 4750U, Vega 7, Samsung SSD PM981a MZVLB512HBJQ, IPS LED, 1920x1080, 13.3" | Átlagos Intel Iris Xe Graphics G7 96EUs | Az osztály átlaga Subnotebook | |
|---|---|---|---|---|---|---|---|---|
| Power Consumption | 0% | 16% | 7% | -40% | -34% | -43% | -11% | |
| Idle Minimum * (Watt) | 2.8 | 3.9 -39% | 1.67 40% | 3.6 -29% | 6.7 -139% | 6 -114% | 5.51 ? -97% | 3.73 ? -33% |
| Idle Average * (Watt) | 5.9 | 5.9 -0% | 6.7 -14% | 4.7 20% | 10 -69% | 8.9 -51% | 8.66 ? -47% | 6.51 ? -10% |
| Idle Maximum * (Watt) | 6.8 | 6.3 7% | 7.4 -9% | 5.1 25% | 10.3 -51% | 11.3 -66% | 10.9 ? -60% | 7.88 ? -16% |
| Load Average * (Watt) | 41.5 | 39.7 4% | 28 33% | 33.3 20% | 35.7 14% | 34.2 18% | 45.6 ? -10% | 42.3 ? -2% |
| Witcher 3 ultra * (Watt) | 34.2 | 34.8 -2% | 32.7 4% | |||||
| Load Maximum * (Watt) | 68.2 | 47.5 30% | 47.5 30% | 70 -3% | 67.6 1% | 37.2 45% | 67.8 ? 1% | 64.8 ? 5% |
* ... a kisebb jobb
Power Consumption Witcher 3
| Lenovo ThinkPad X13 G2 20WK0024GE i7-1165G7, Iris Xe G7 96EUs, 54.7 Wh | Dell XPS 13 9310 Core i7 FHD i7-1165G7, Iris Xe G7 96EUs, 52 Wh | Apple MacBook Pro 13 Late 2020 M1 Entry (8 / 256 GB) M1, M1 8-Core GPU, 58.2 Wh | HP EliteBook 830 G7 i7-10810U, UHD Graphics 620, 53 Wh | Huawei MateBook X Pro 2021 i7-1165G7, Iris Xe G7 96EUs, 56 Wh | Lenovo ThinkPad X13-20UGS00800 R7 PRO 4750U, Vega 7, 48 Wh | Lenovo ThinkPad X13-20T20033GE i5-10210U, UHD Graphics 620, 48 Wh | Az osztály átlaga Subnotebook | |
|---|---|---|---|---|---|---|---|---|
| Akkumulátor üzemidő | 70% | 66% | 90% | 60% | -17% | 21% | 28% | |
| H.264 (h) | 15 | 19.2 28% | 8.3 -45% | 11.7 -22% | 15.3 ? 2% | |||
| WiFi v1.3 (h) | 10 | 11 10% | 20.4 104% | 11.5 15% | 10.5 5% | 8.7 -13% | 9.3 -7% | 14 ? 40% |
| Load (h) | 1.4 | 3.2 129% | 3.7 164% | 3 114% | 1.5 7% | 2.7 93% | 1.998 ? 43% |
Pro
Kontra
Összegzés - ThinkPad X13 G2 szokatlan potenciállal
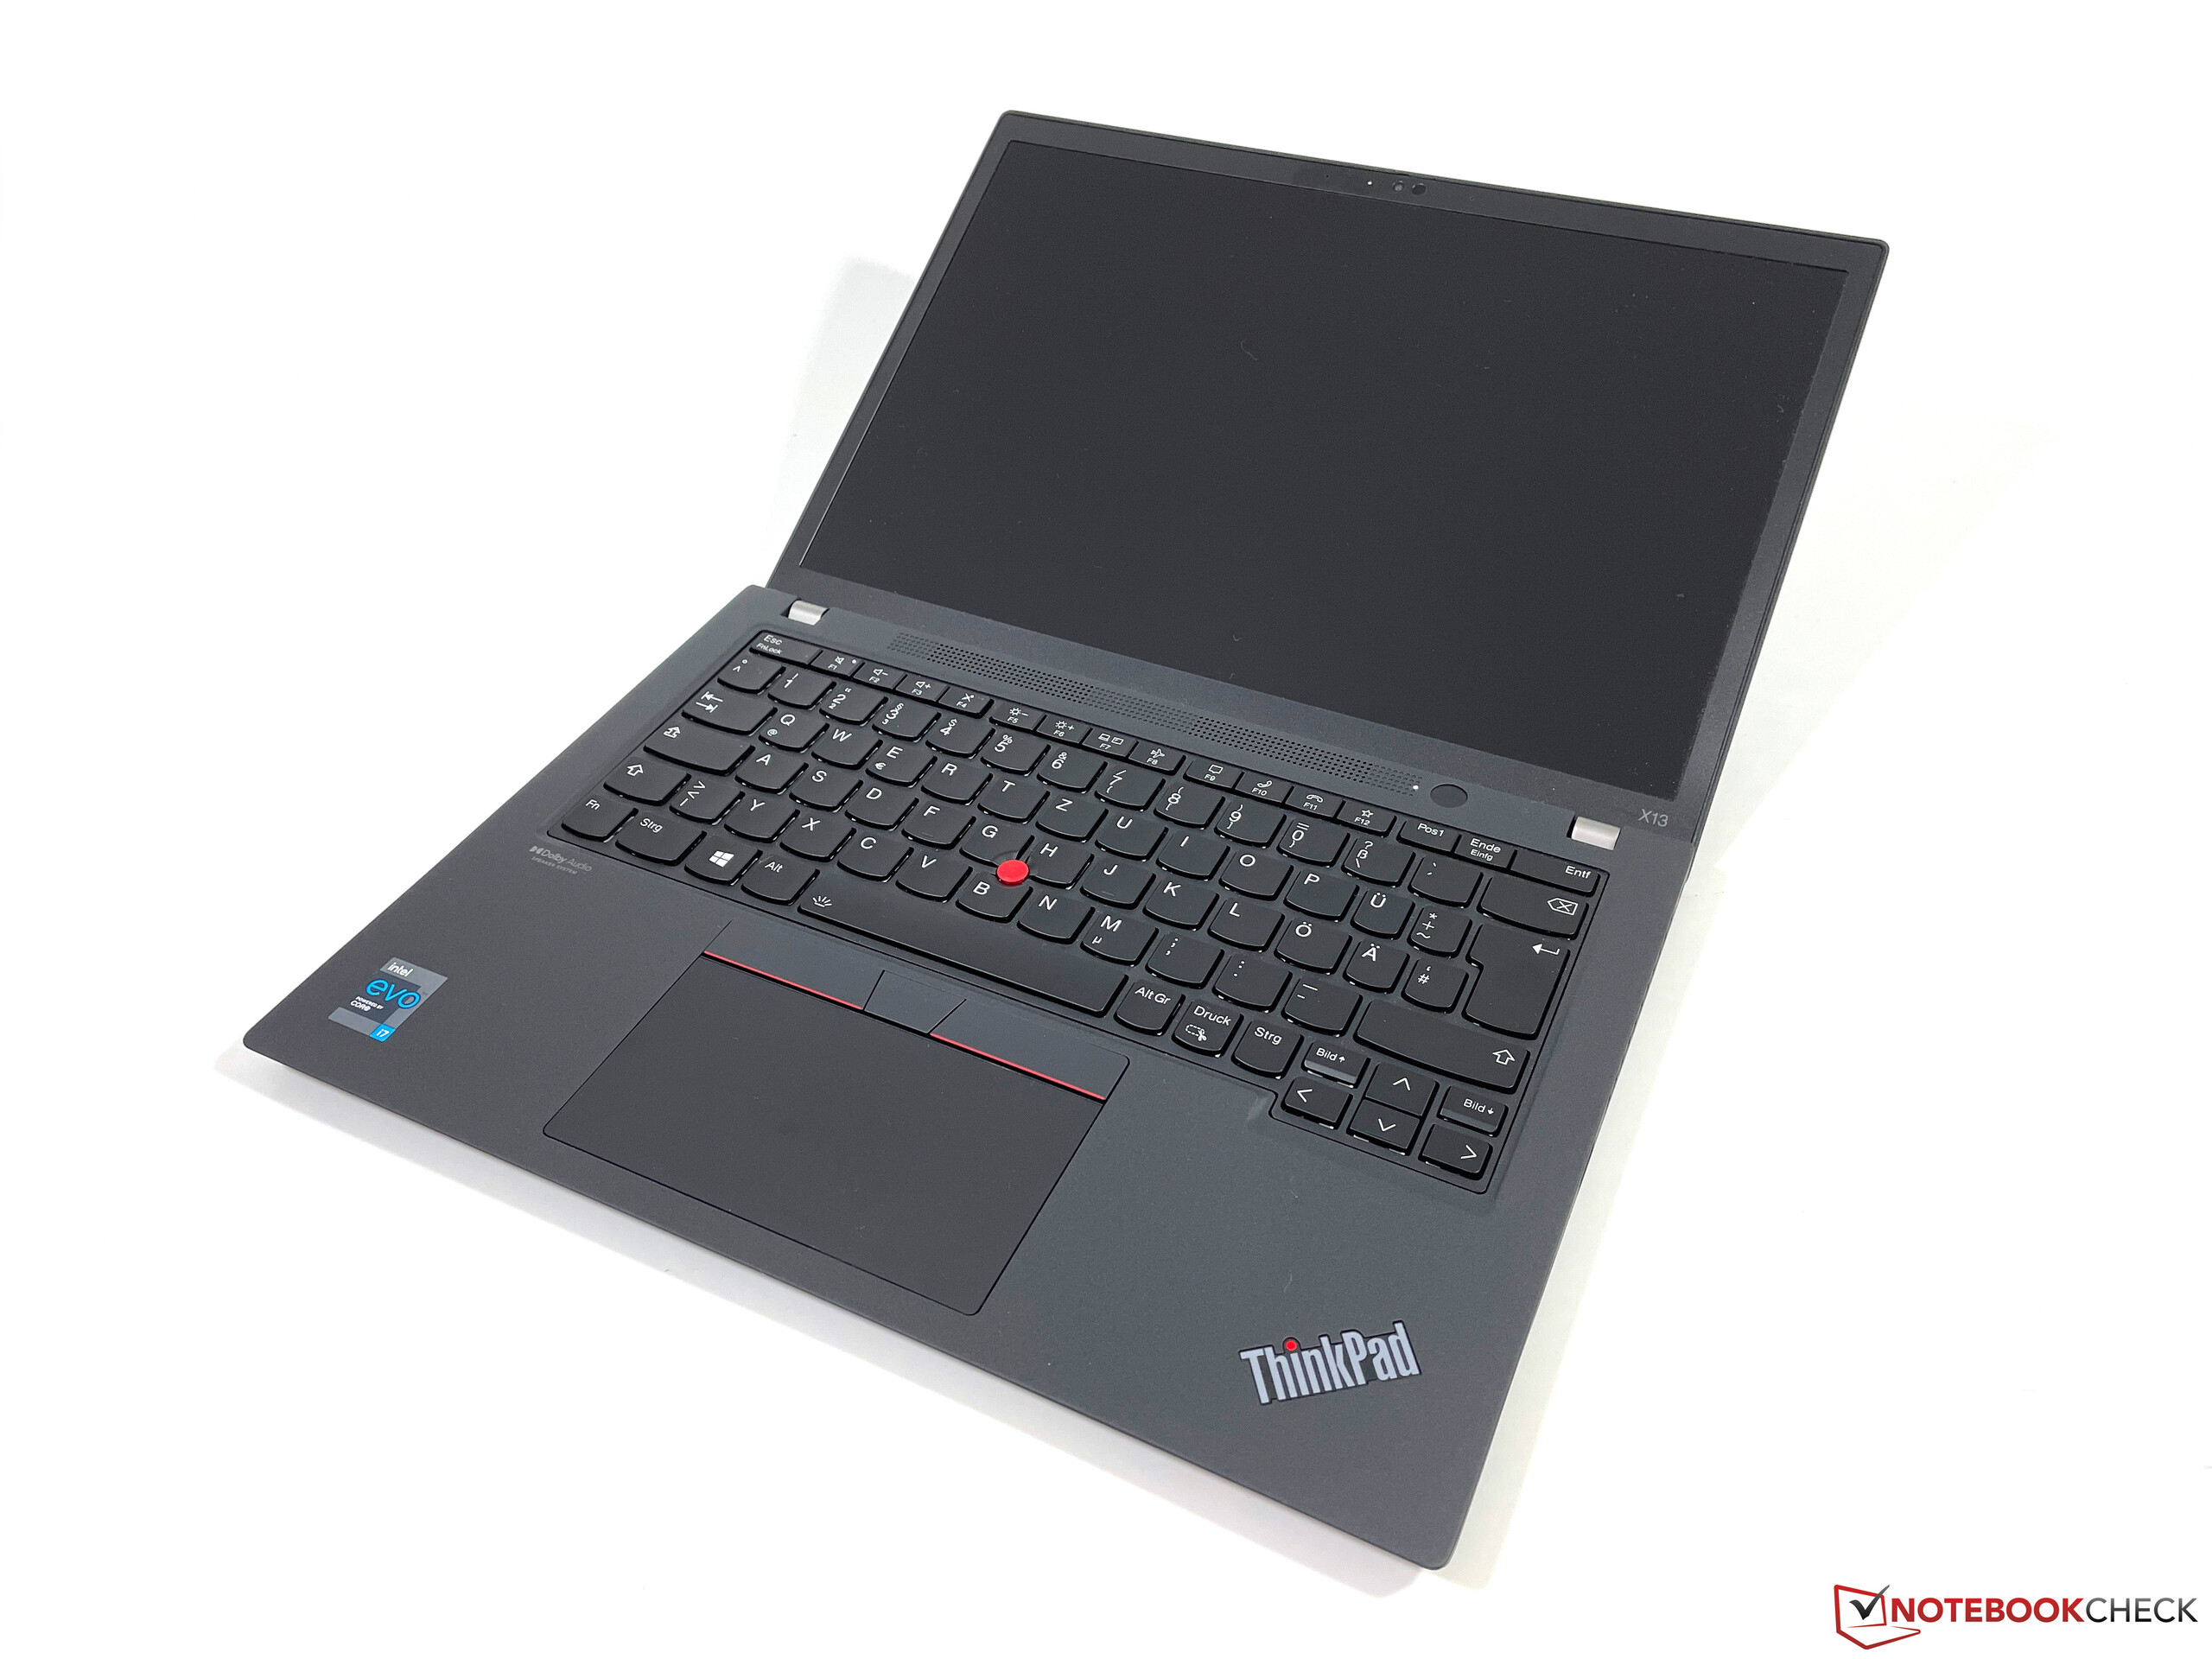
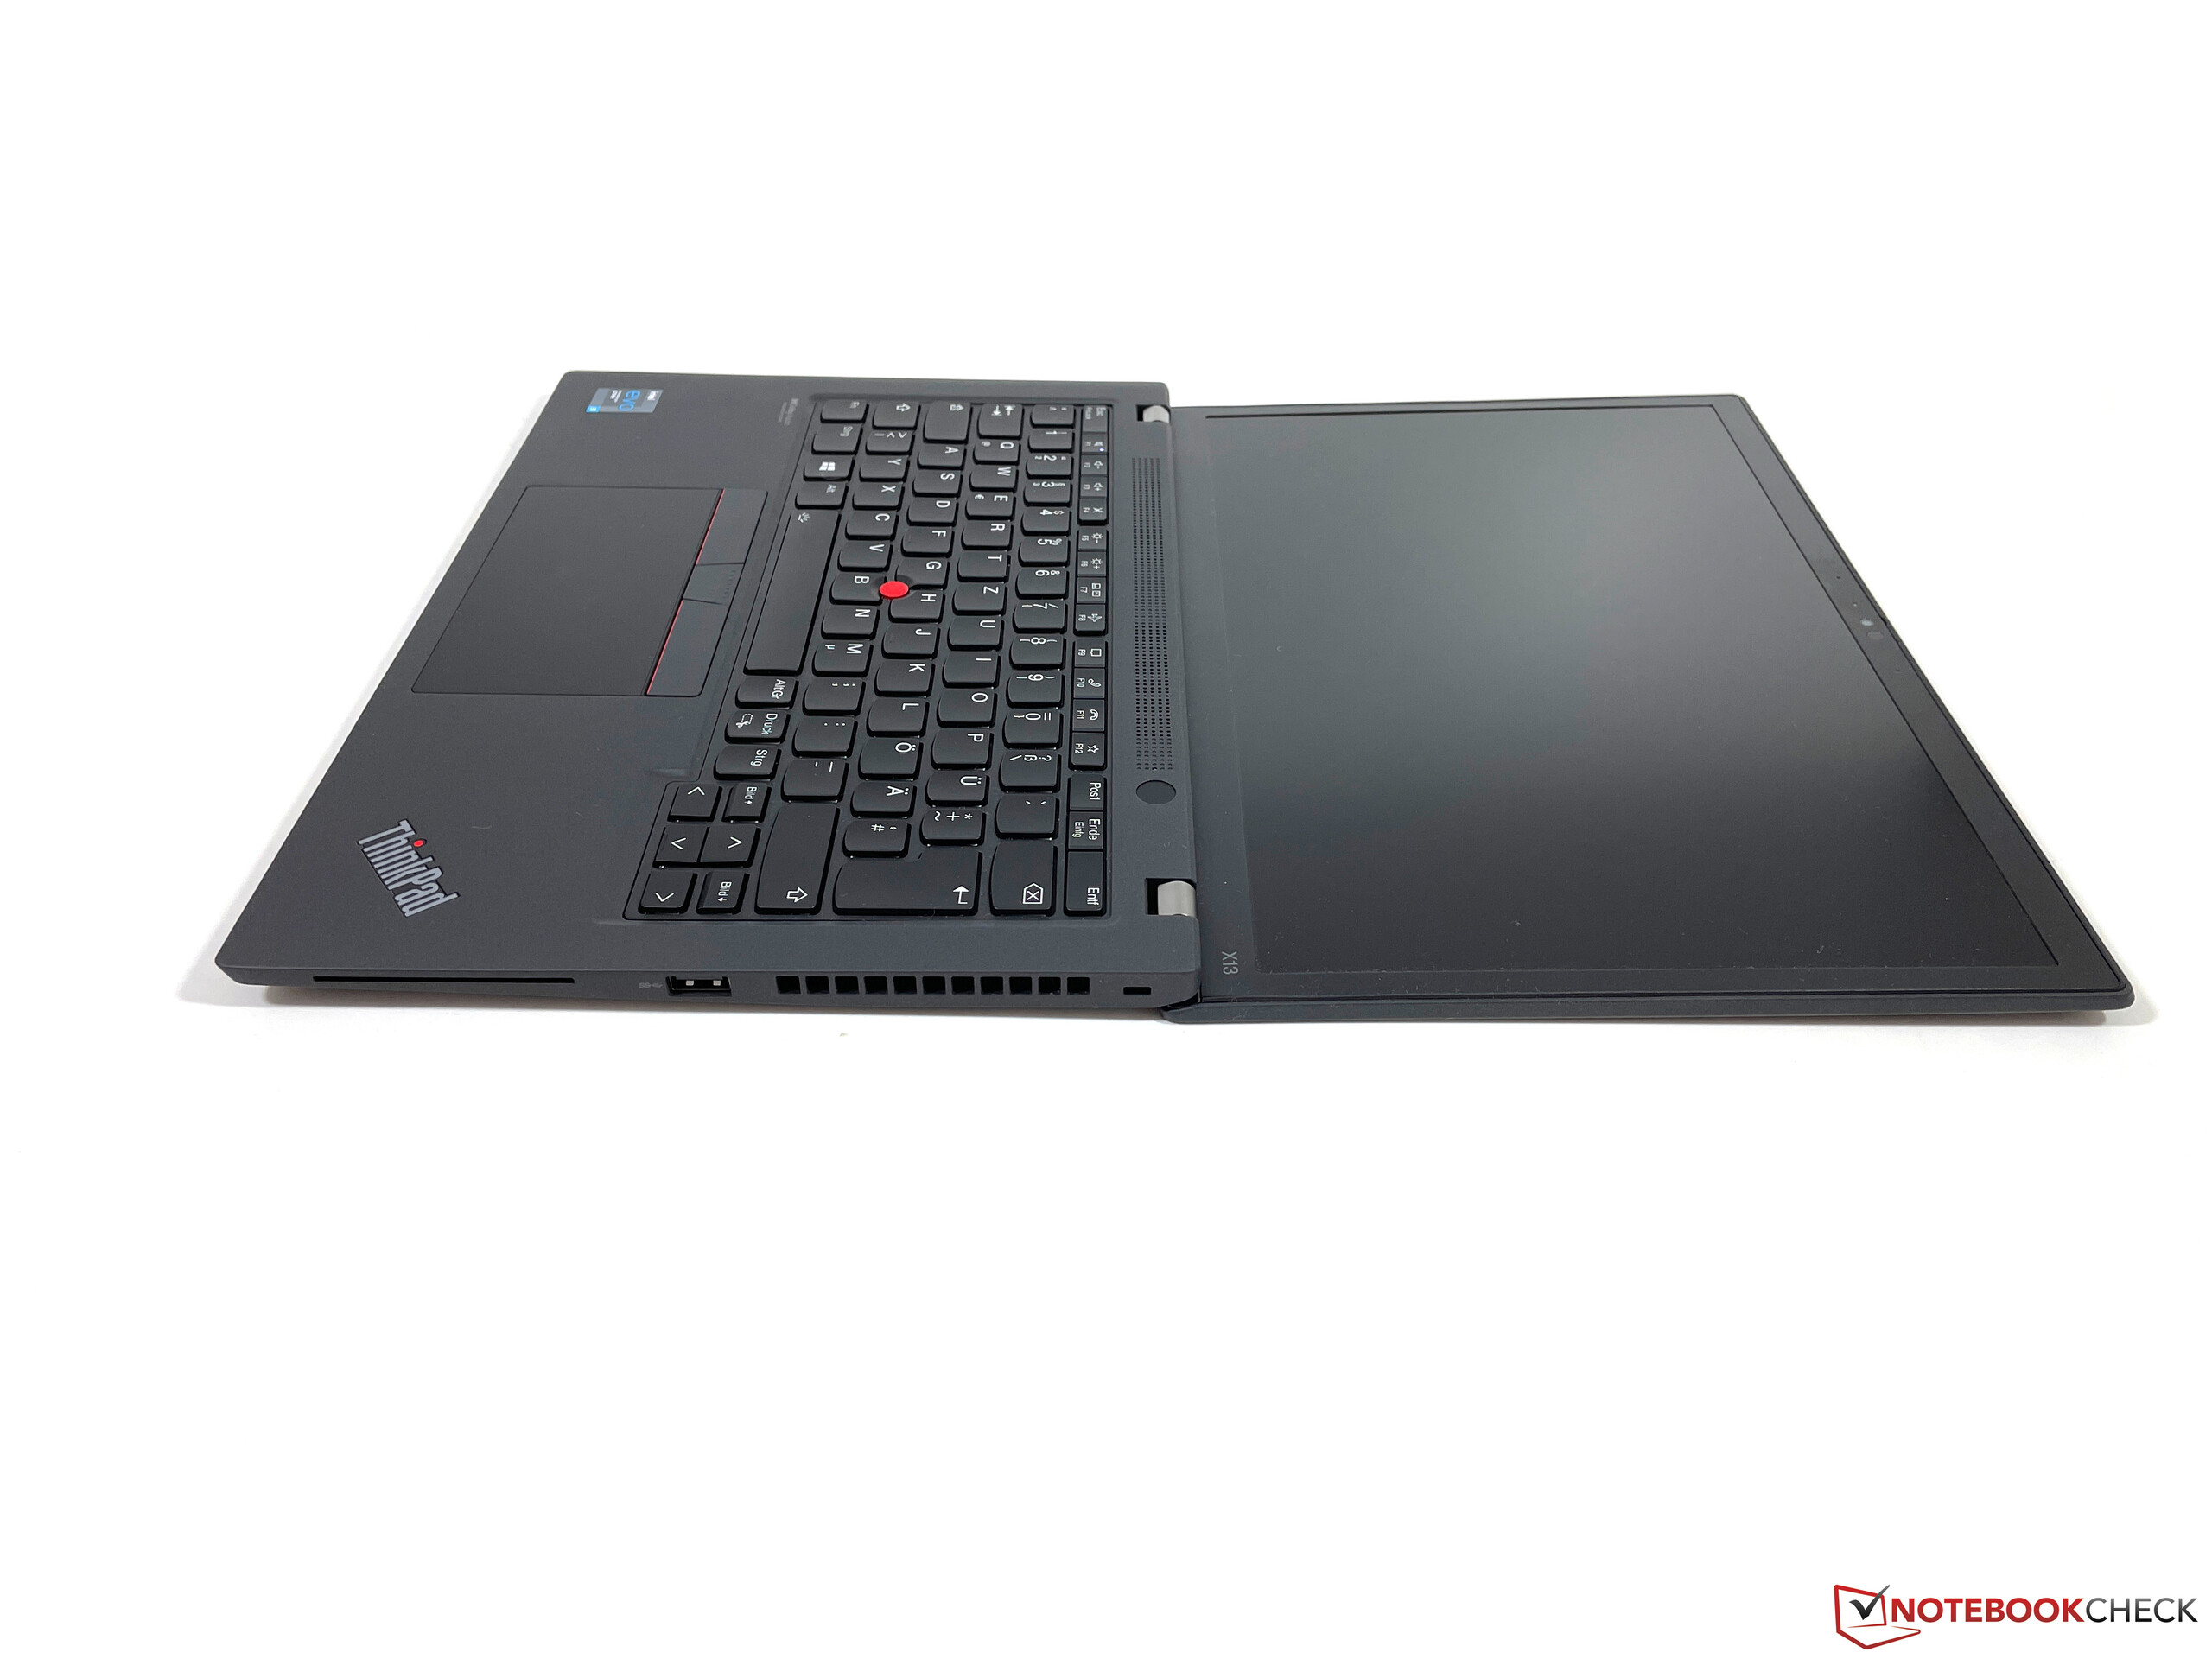
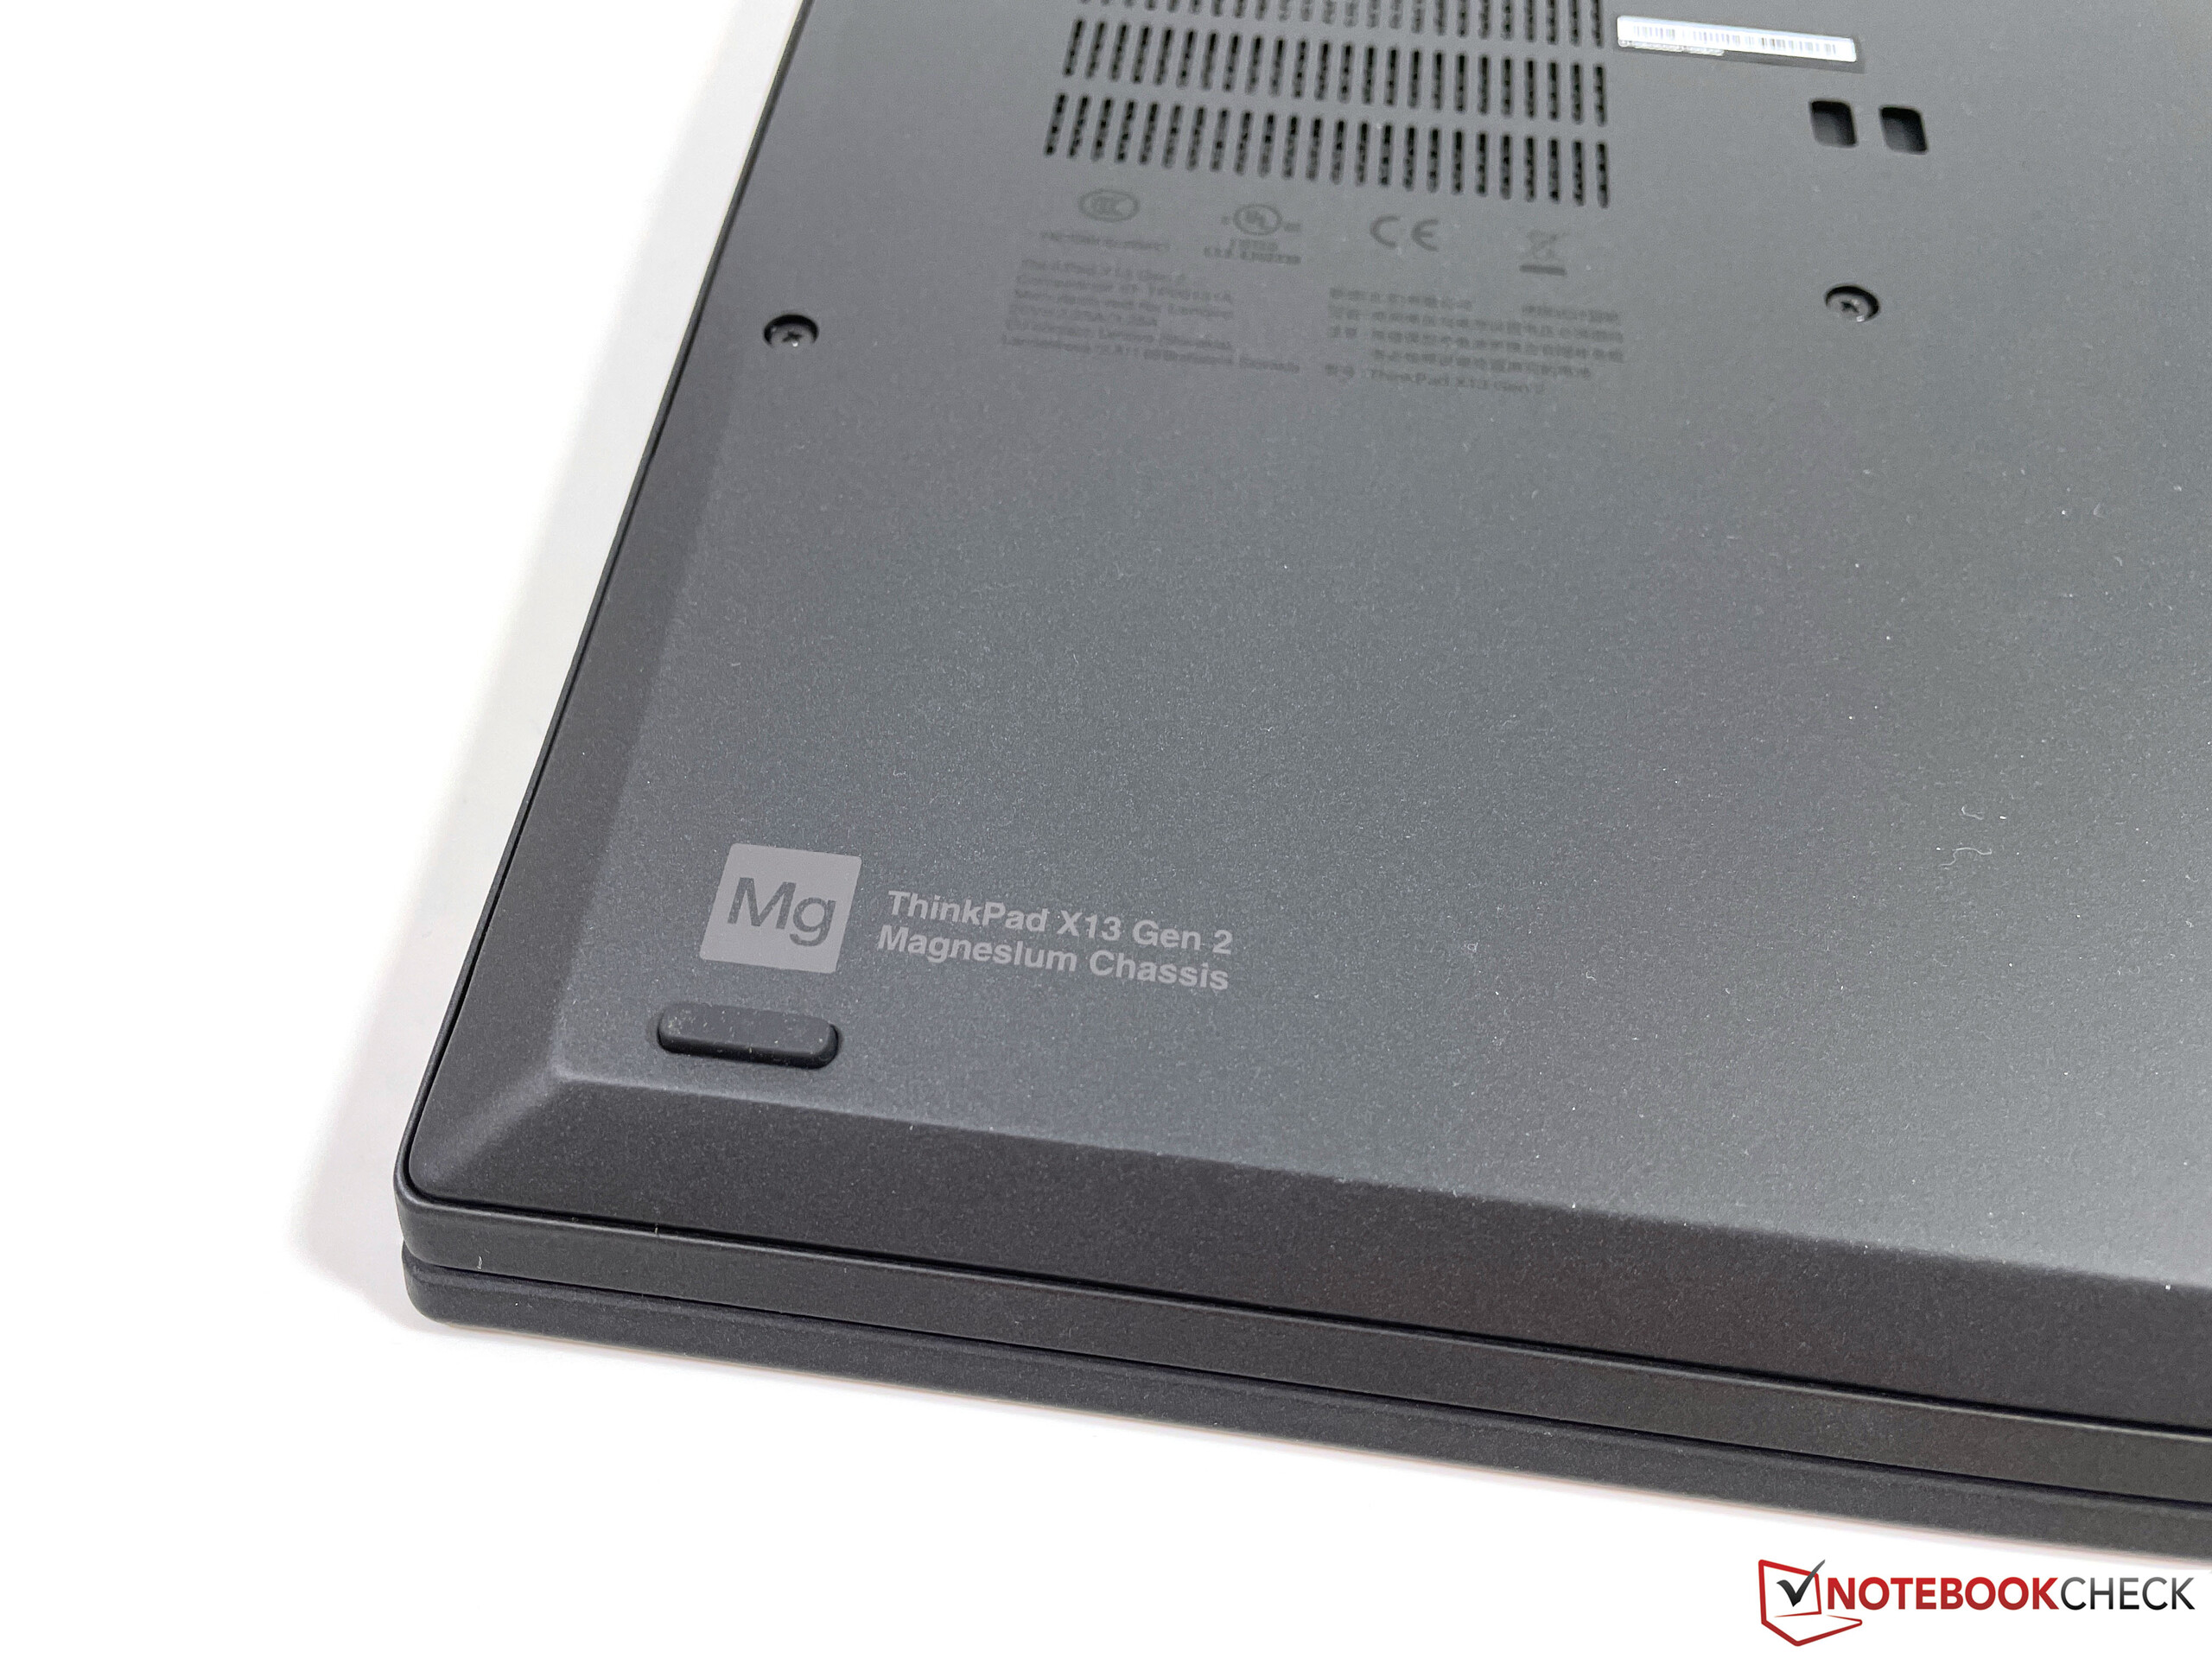
Az új ThinkPad X13 G2 egy jó frissítés. A készülék valamivel kompaktabb lett, 16:10-es kijelzőt kapunk, a Tiger Lake processzor teljesítménye jó, és a Lenovo-nak sikerült növelnie az akkumulátor kapacitását is.
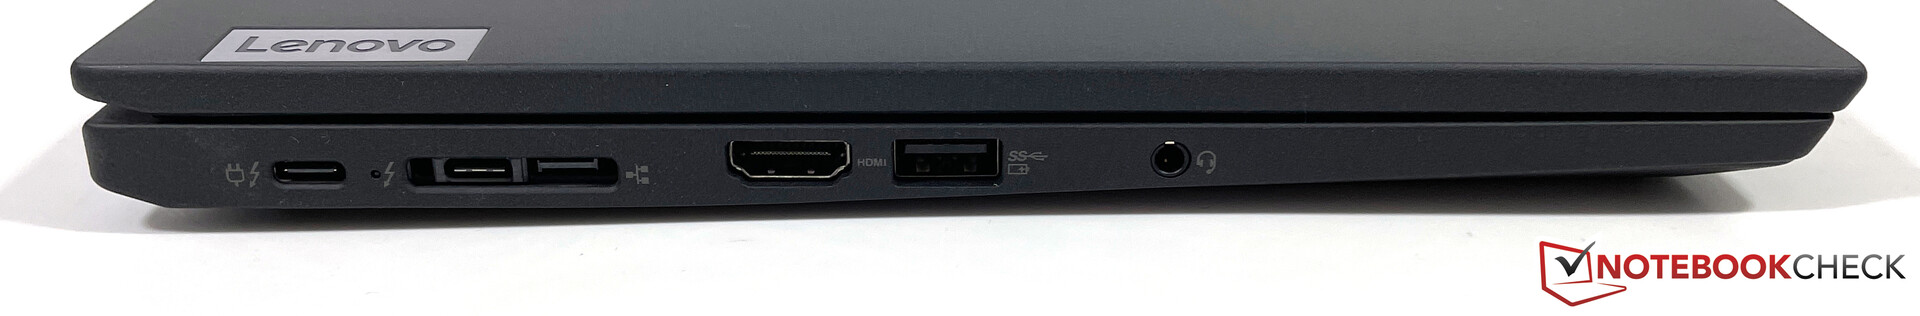
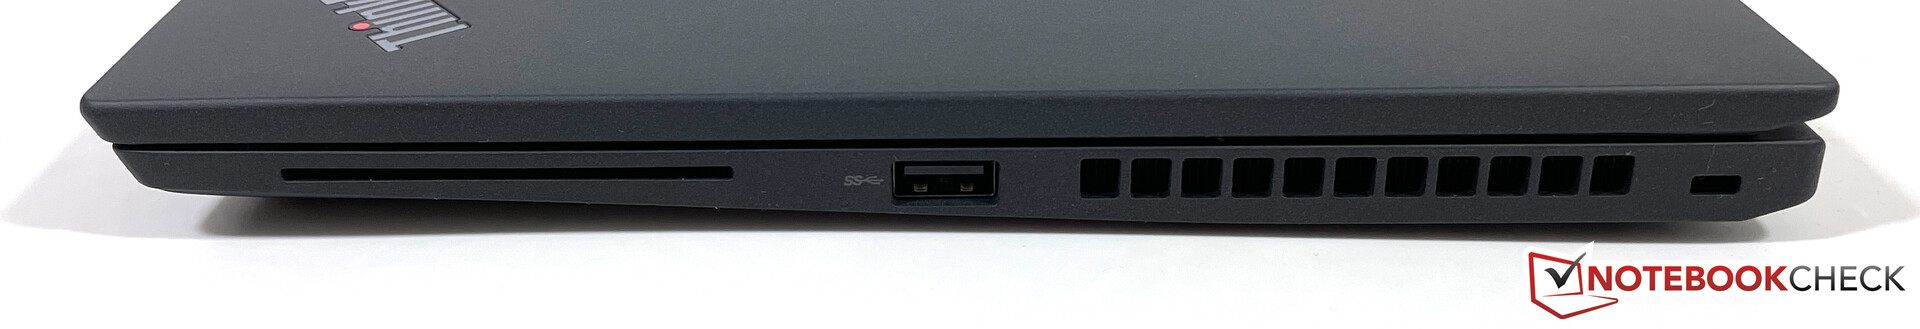
A legnagyobb előny az olyan fogyasztói eszközökkel szemben, mint a Dell XPS 13, az Apple MacBook Pro 13 és a Huawei MateBook X Pro, az átfogó csatlakoztathatósági lehetőségek, beleértve a SmartCard-olvasót és az opcionális WWAN-modulokat az LTE vagy akár az 5G eléréséhez: az üzleti készülékek a garancia tekintetében is előnyben vannak.
A Lenovo továbbra is azt a trendet követi, amely szerint a helytakarékosság érdekében a billentyűzeteket csökkentett lenyomási távval és sekélyebb billentyűkkel szereli fel. A gyártó továbbra is a bevált ThinkPad minőséget hirdeti, és a billentyűzet semmiképpen sem rossz, de ha összehasonlítjuk például a jelenlegi feleannyiba kerülő ThinkPad E14 G3 billentyűzetével, akkor gyorsan észrevehetjük, mennyivel jobb is lehetne.
Nagyszerű csatlakoztathatóság 5G-vel, 16:10-es képernyő és hosszú üzemidő: A ThinkPad X13 G2 még mindig nagyon jó mobil társ, még ha a billentyűzet nem is olyan jó, mint régen.
A képernyő tekintetében is kissé csalódottak vagyunk. A matt IPS-kijelző képminősége jó, mi viszont szívesen láttunk volna nagyobb fényerejű panelt. Mindenképpen az opcionális, 2560 x 1600 pixeles WQXGA panelt javasolnánk, amely fényesebb, még jobb képminőséget kínál, és nincs nagy hatással az üzemidőre, ahogyan azt az X13 Yoga G2 értékelésekor is láthattuk. Az új EliteBook 830 G8-at és (amint elérhetővé válik) a ThinkPad X13 G2 AMD-s változatát is értékelni fogjuk.
Ár és Elérhetőség
A Lenovo.com oldalon ~1200 dolláros kezdőáron konfigurálhatjuk magunknak a ThinkPad X13 G2-t. Az általunk tesztelt konfiguráció jelenleg 1500 dollár körüli áron kapható.
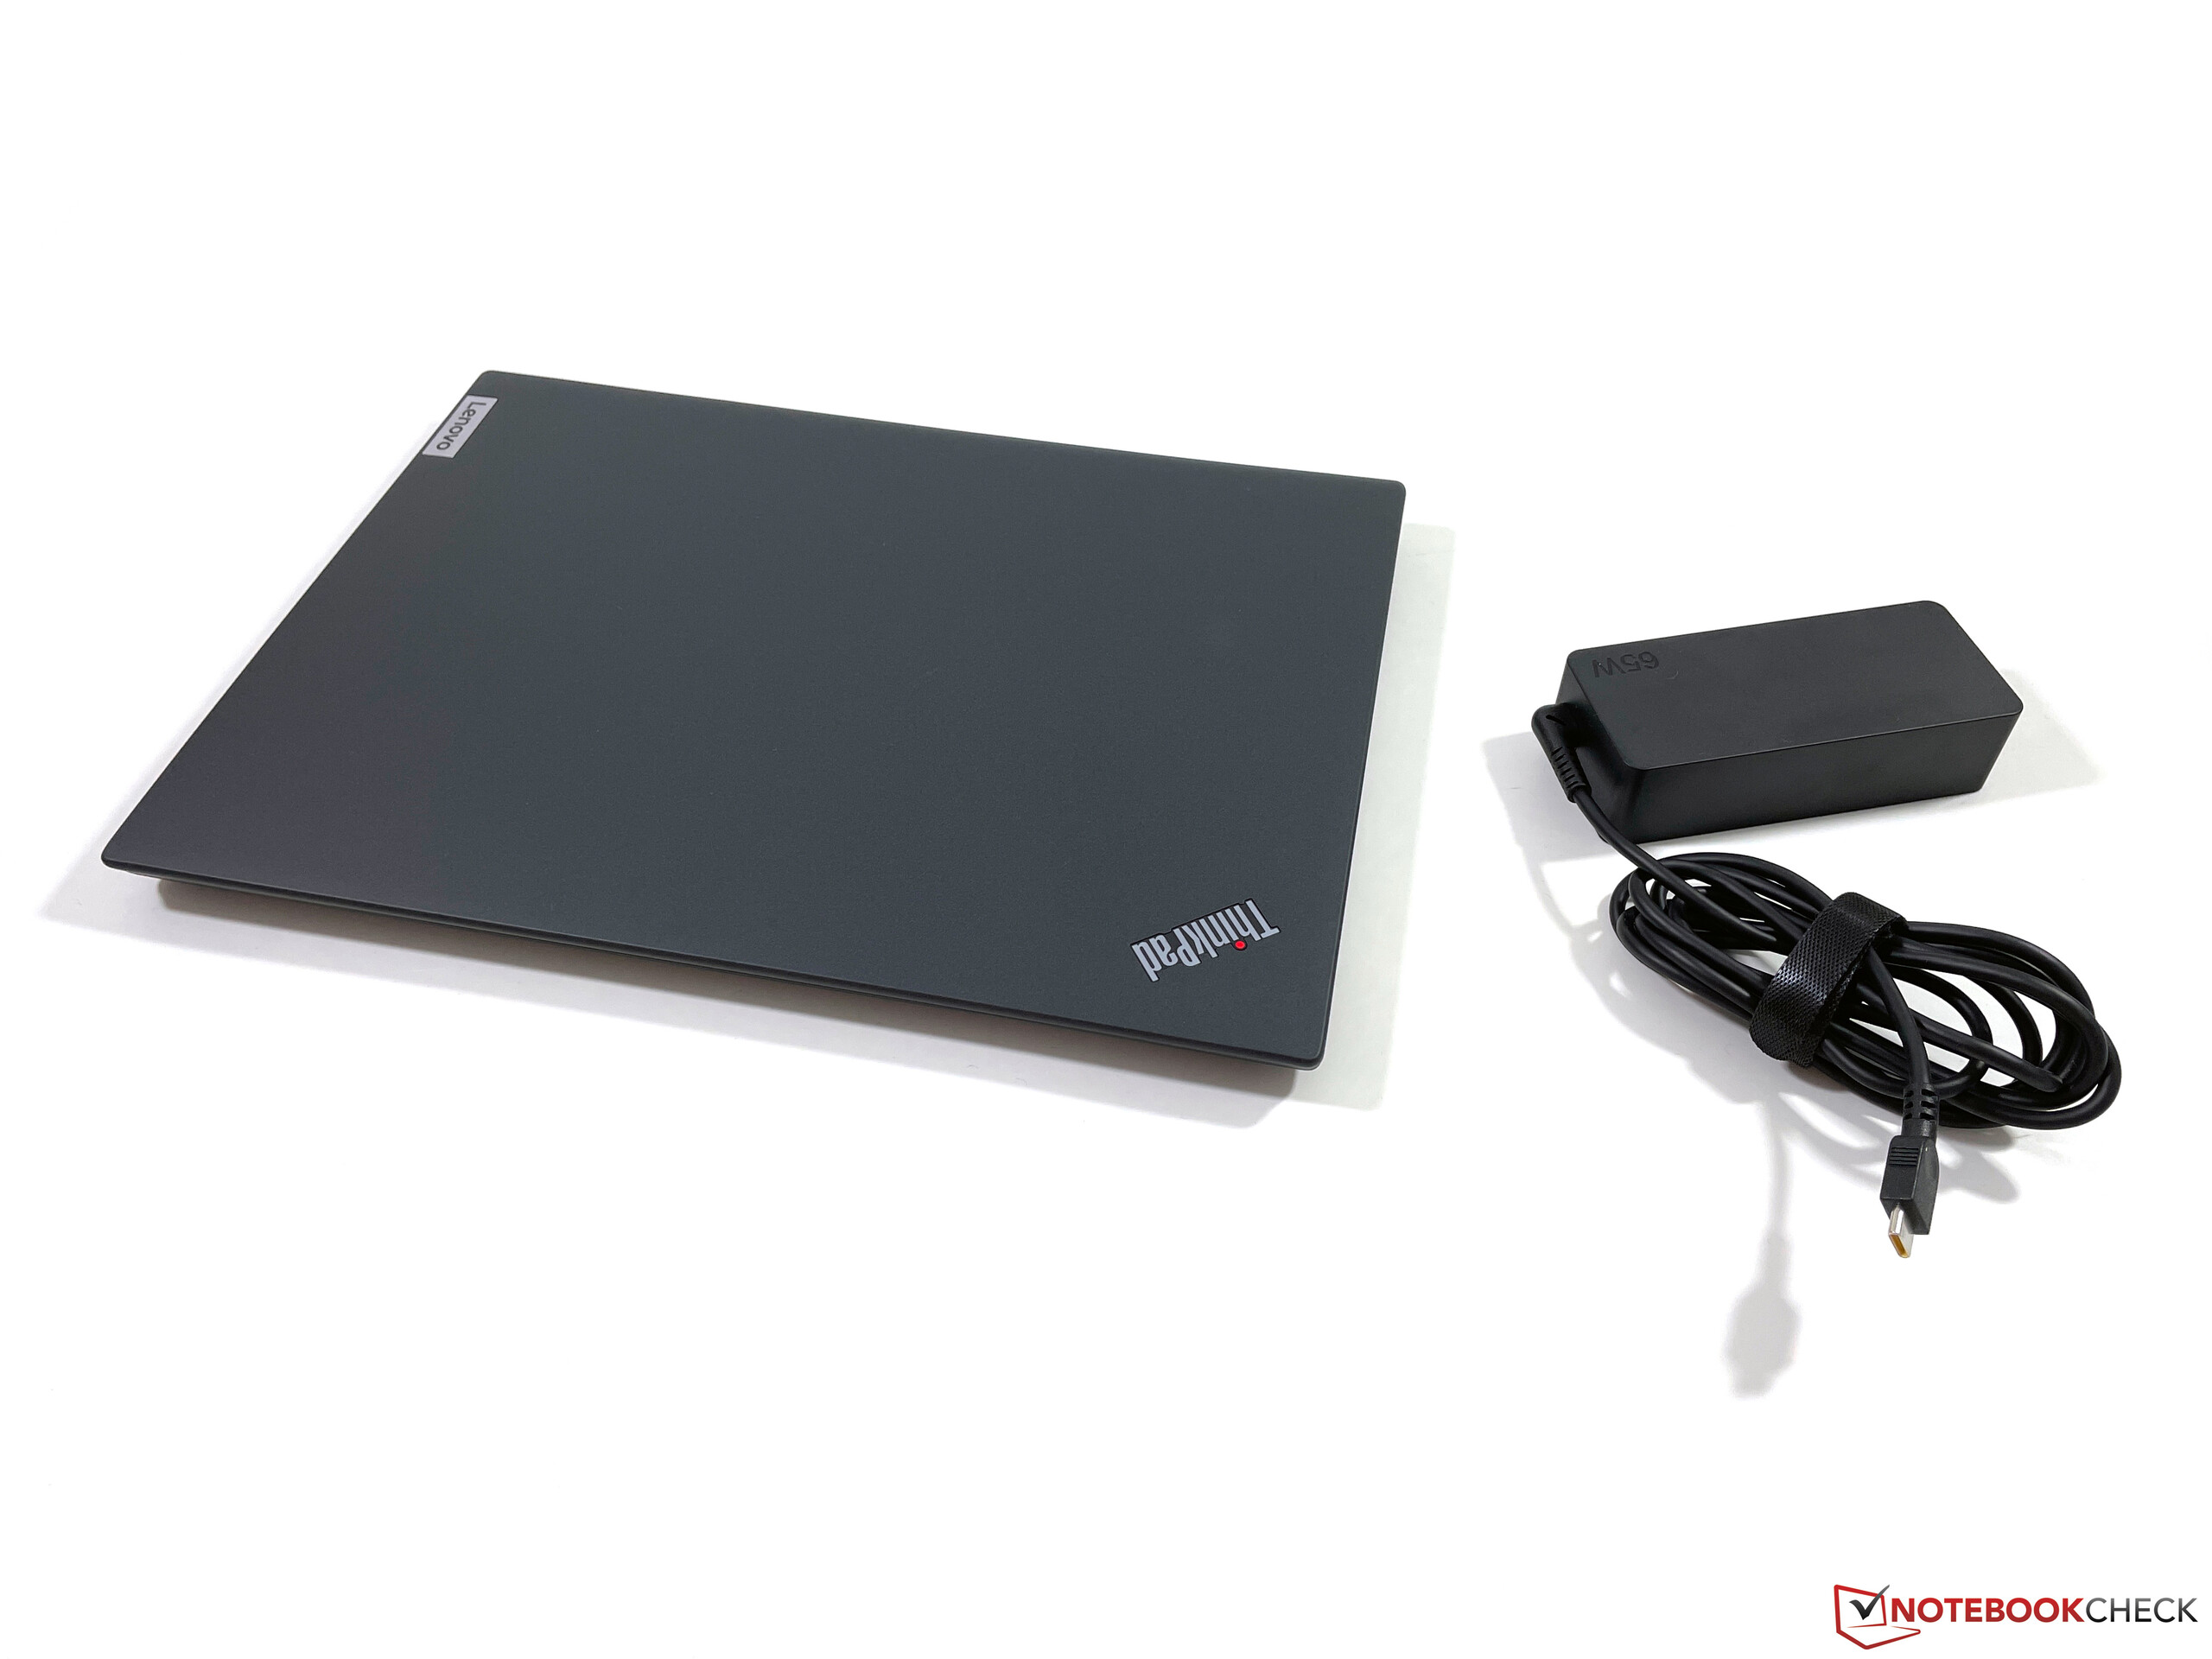
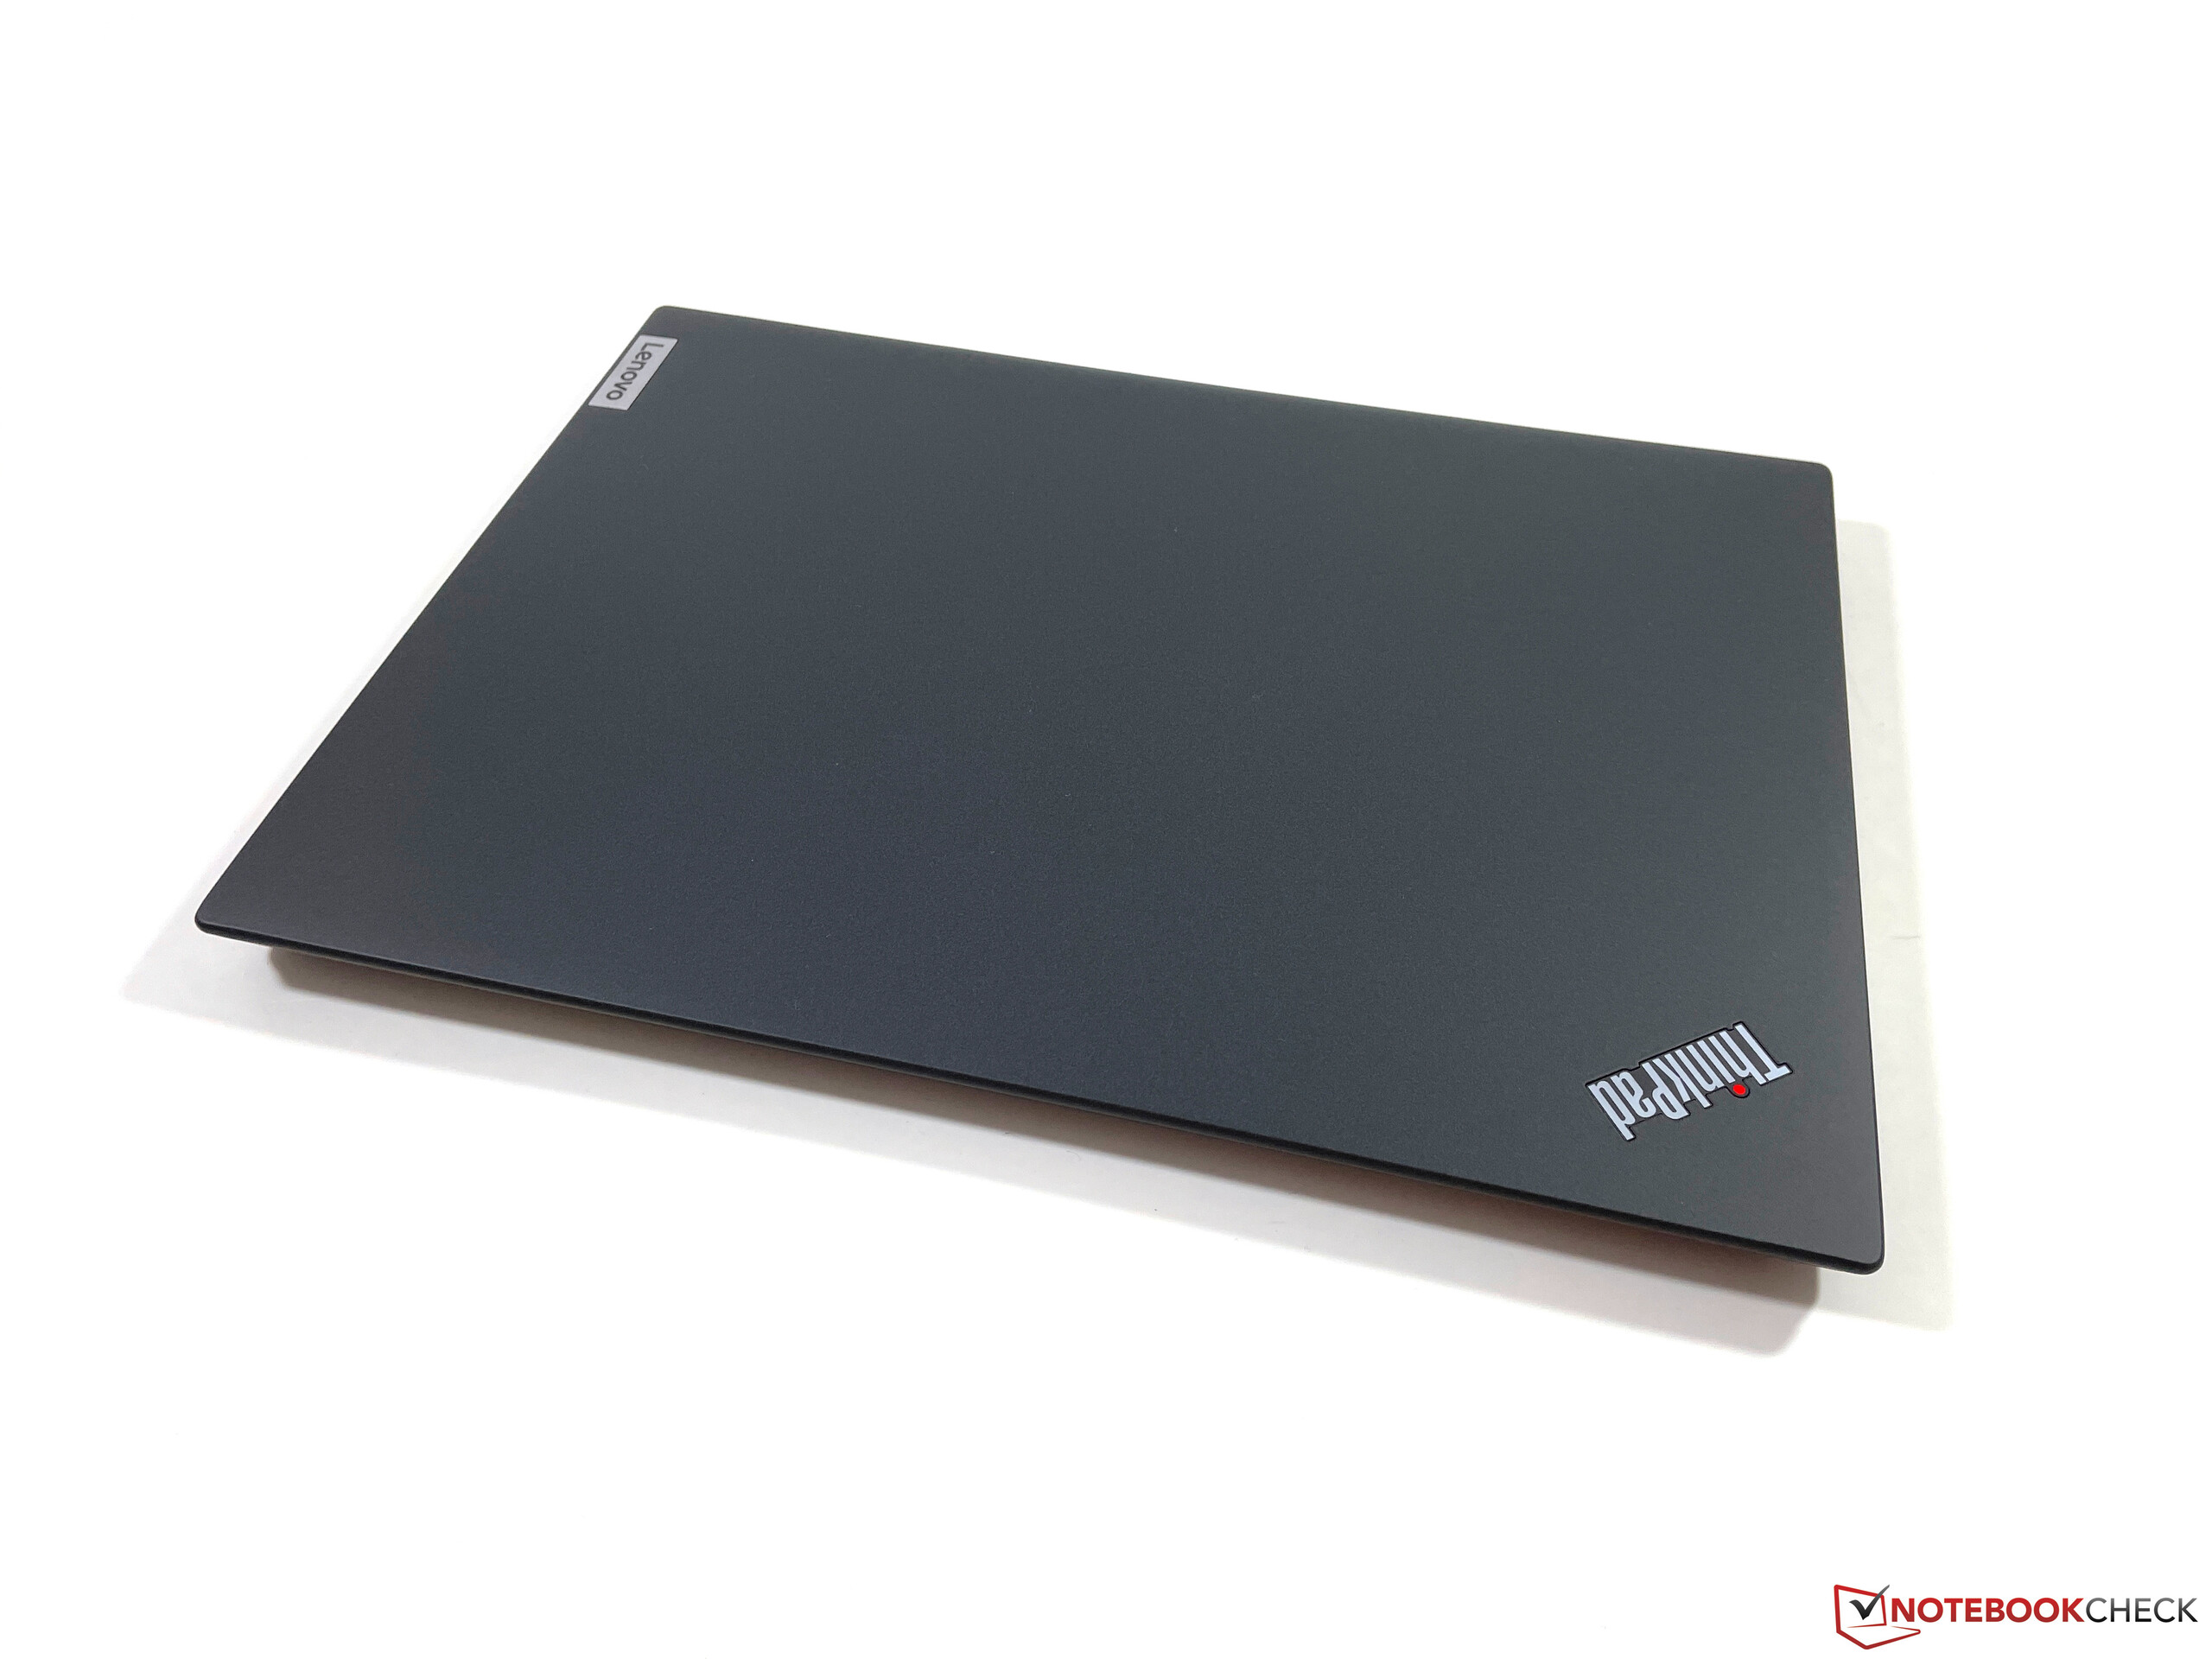
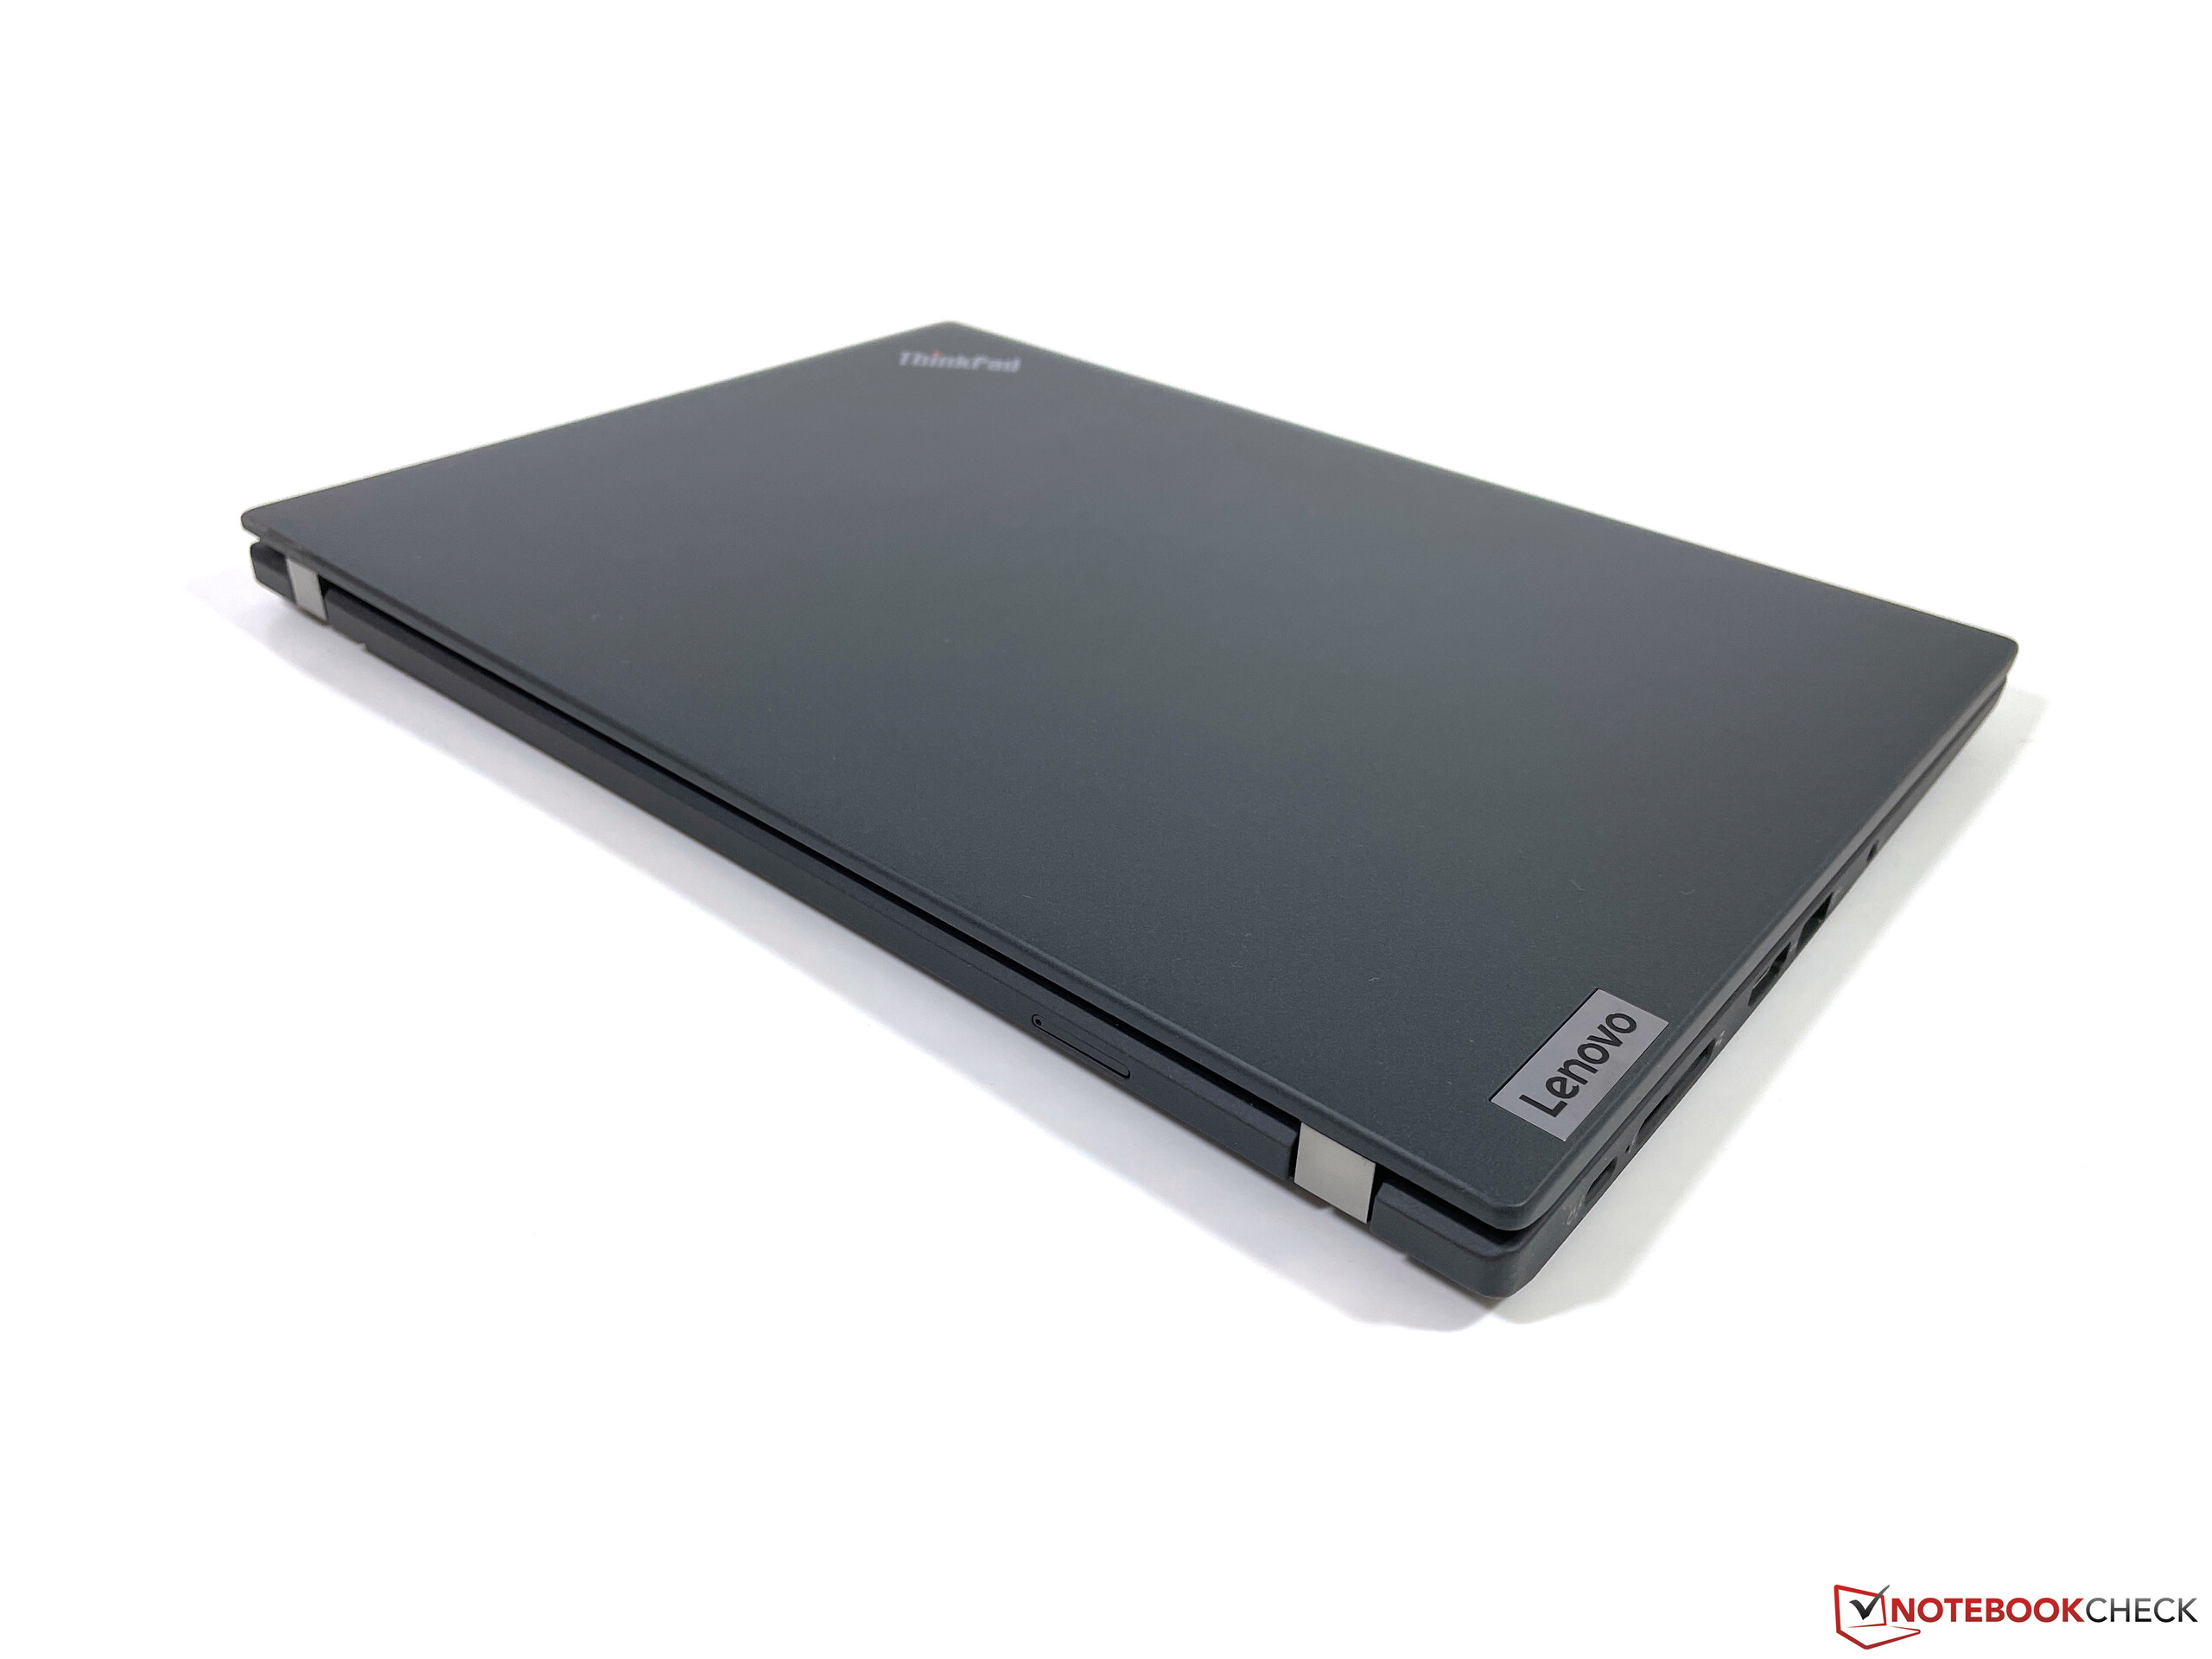
Lenovo ThinkPad X13 G2 20WK0024GE
- 07/06/2021 v7 (old)
Andreas Osthoff
Price comparison

