Intel Celeron N5095 Jasper Lake benchmark: Beelink U59 mini PC rövid értékelés
Potential Competitors in Comparison
Értékelés | Dátum | Modell | Súly | Magasság | Méret | Felbontás | Legjobb ár |
|---|---|---|---|---|---|---|---|
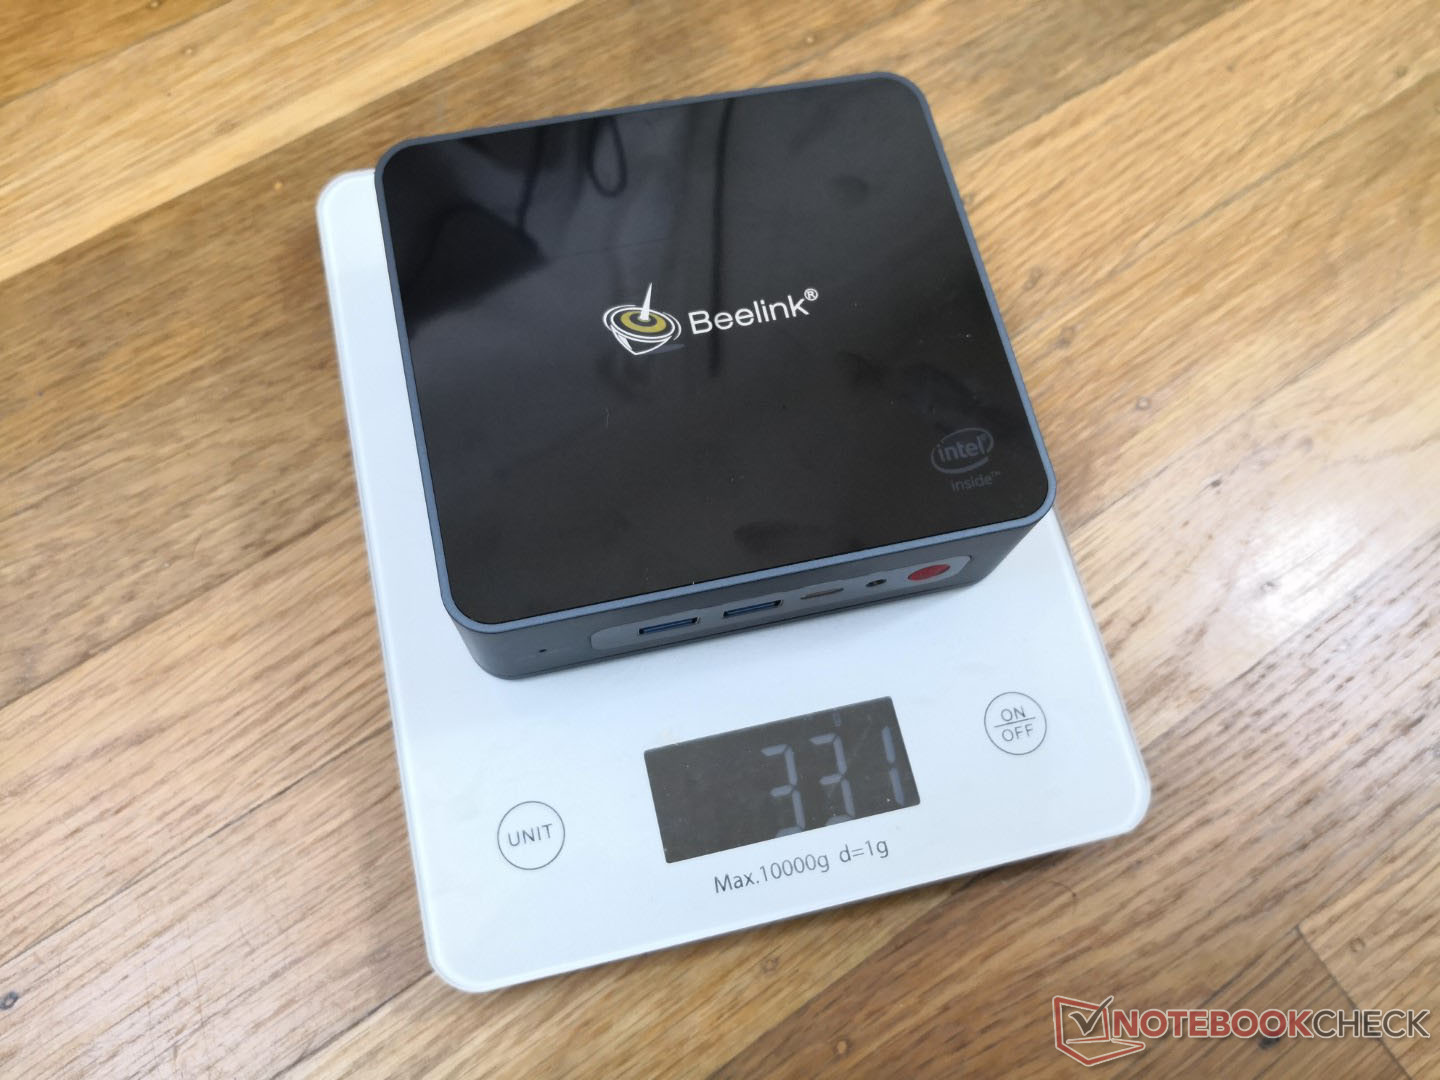
v (old) | 04/2022 | Beelink U59 Celeron N5095, UHD Graphics (Jasper Lake 16 EU) | 329 g | 42 mm | x | ||
v (old) | Intel NUC11TNKi5 i5-1135G7, Iris Xe G7 80EUs | 504 g | 37 mm | x | |||
v (old) | Intel NUC8i7BE i7-8559U, Iris Plus Graphics 655 | 683 g | 51 mm | x | |||
v (old) | Beelink SEi10 i3-1005G1, UHD Graphics G1 (Ice Lake 32 EU) | 350 g | 41 mm | x | |||
v (old) | Zotac ZBOX MI642 Nano i5-10210U, UHD Graphics 620 | 472 g | 51 mm | x | |||
v (old) | GMK NucBox K1 Celeron J4125, UHD Graphics 600 | 130 g | 42 mm | x |
| Networking | |
| iperf3 transmit AX12 | |
| Intel NUC11TNKi5 | |
| Beelink SEi10 | |
| Intel NUC8i7BE | |
| Beelink U59 | |
| GMK NucBox K1 | |
| iperf3 receive AX12 | |
| Intel NUC11TNKi5 | |
| Beelink SEi10 | |
| Intel NUC8i7BE | |
| GMK NucBox K1 | |
| Beelink U59 | |
Cinebench R15 Multi Loop
Cinebench R23: Multi Core | Single Core
Cinebench R20: CPU (Multi Core) | CPU (Single Core)
Cinebench R15: CPU Multi 64Bit | CPU Single 64Bit
Blender: v2.79 BMW27 CPU
7-Zip 18.03: 7z b 4 | 7z b 4 -mmt1
Geekbench 5.5: Multi-Core | Single-Core
HWBOT x265 Benchmark v2.2: 4k Preset
LibreOffice : 20 Documents To PDF
R Benchmark 2.5: Overall mean
| CPU Performance rating | |
| Intel NUC11TNKi5 | |
| Intel NUC8i7BE -3! | |
| Zotac ZBOX MI642 Nano -2! | |
| Beelink SEi10 -2! | |
| Beelink U59 -2! | |
| Átlagos Intel Celeron N5095 | |
| GMK NucBox K1 -2! | |
| Blackview AceBook 1 -2! | |
| Jumper Tech Ez Book X3 Air -2! | |
| Asus BR1100FKA-BP0109RA | |
| Chuwi LapBook Plus -6! | |
| Cinebench R23 / Multi Core | |
| Intel NUC11TNKi5 | |
| Beelink U59 | |
| Átlagos Intel Celeron N5095 (2150 - 2219, n=5) | |
| Blackview AceBook 1 | |
| Asus BR1100FKA-BP0109RA | |
| Cinebench R23 / Single Core | |
| Intel NUC11TNKi5 | |
| Beelink U59 | |
| Átlagos Intel Celeron N5095 (587 - 621, n=5) | |
| Asus BR1100FKA-BP0109RA | |
| Blackview AceBook 1 | |
| Cinebench R20 / CPU (Multi Core) | |
| Intel NUC11TNKi5 | |
| Intel NUC8i7BE | |
| Zotac ZBOX MI642 Nano | |
| Beelink SEi10 | |
| Beelink U59 | |
| Átlagos Intel Celeron N5095 (804 - 844, n=5) | |
| Jumper Tech Ez Book X3 Air | |
| Blackview AceBook 1 | |
| Asus BR1100FKA-BP0109RA | |
| GMK NucBox K1 | |
| Chuwi LapBook Plus | |
| Cinebench R20 / CPU (Single Core) | |
| Intel NUC11TNKi5 | |
| Intel NUC8i7BE | |
| Zotac ZBOX MI642 Nano | |
| Beelink SEi10 | |
| Beelink U59 | |
| Átlagos Intel Celeron N5095 (228 - 239, n=5) | |
| Asus BR1100FKA-BP0109RA | |
| GMK NucBox K1 | |
| Blackview AceBook 1 | |
| Jumper Tech Ez Book X3 Air | |
| Chuwi LapBook Plus | |
| Cinebench R15 / CPU Multi 64Bit | |
| Intel NUC8i7BE | |
| Intel NUC11TNKi5 | |
| Zotac ZBOX MI642 Nano | |
| Beelink SEi10 | |
| Beelink U59 | |
| Átlagos Intel Celeron N5095 (221 - 379, n=6) | |
| GMK NucBox K1 | |
| Blackview AceBook 1 | |
| Jumper Tech Ez Book X3 Air | |
| Asus BR1100FKA-BP0109RA | |
| Chuwi LapBook Plus | |
| Cinebench R15 / CPU Single 64Bit | |
| Intel NUC11TNKi5 | |
| Intel NUC8i7BE | |
| Zotac ZBOX MI642 Nano | |
| Beelink SEi10 | |
| Beelink U59 | |
| Átlagos Intel Celeron N5095 (95.4 - 109, n=5) | |
| Asus BR1100FKA-BP0109RA | |
| GMK NucBox K1 | |
| Blackview AceBook 1 | |
| Jumper Tech Ez Book X3 Air | |
| Chuwi LapBook Plus | |
| Blender / v2.79 BMW27 CPU | |
| Chuwi LapBook Plus | |
| Asus BR1100FKA-BP0109RA | |
| Jumper Tech Ez Book X3 Air | |
| Blackview AceBook 1 | |
| GMK NucBox K1 | |
| Átlagos Intel Celeron N5095 (1502 - 1624, n=5) | |
| Beelink U59 | |
| Beelink SEi10 | |
| Zotac ZBOX MI642 Nano | |
| Intel NUC8i7BE | |
| Intel NUC8i7BE | |
| Intel NUC11TNKi5 | |
| 7-Zip 18.03 / 7z b 4 | |
| Intel NUC8i7BE | |
| Intel NUC8i7BE | |
| Intel NUC11TNKi5 | |
| Zotac ZBOX MI642 Nano | |
| Beelink U59 | |
| Átlagos Intel Celeron N5095 (10924 - 11168, n=5) | |
| Beelink SEi10 | |
| GMK NucBox K1 | |
| Blackview AceBook 1 | |
| Jumper Tech Ez Book X3 Air | |
| Asus BR1100FKA-BP0109RA | |
| Chuwi LapBook Plus | |
| 7-Zip 18.03 / 7z b 4 -mmt1 | |
| Intel NUC8i7BE | |
| Intel NUC8i7BE | |
| Intel NUC11TNKi5 | |
| Zotac ZBOX MI642 Nano | |
| Beelink SEi10 | |
| Beelink U59 | |
| Átlagos Intel Celeron N5095 (2935 - 3124, n=5) | |
| Asus BR1100FKA-BP0109RA | |
| Blackview AceBook 1 | |
| GMK NucBox K1 | |
| Jumper Tech Ez Book X3 Air | |
| Chuwi LapBook Plus | |
| Geekbench 5.5 / Multi-Core | |
| Intel NUC11TNKi5 | |
| Zotac ZBOX MI642 Nano | |
| Intel NUC8i7BE | |
| Beelink SEi10 | |
| Átlagos Intel Celeron N5095 (1933 - 2052, n=4) | |
| Jumper Tech Ez Book X3 Air | |
| GMK NucBox K1 | |
| Asus BR1100FKA-BP0109RA | |
| Geekbench 5.5 / Single-Core | |
| Intel NUC11TNKi5 | |
| Beelink SEi10 | |
| Zotac ZBOX MI642 Nano | |
| Intel NUC8i7BE | |
| Átlagos Intel Celeron N5095 (637 - 659, n=4) | |
| GMK NucBox K1 | |
| Jumper Tech Ez Book X3 Air | |
| Asus BR1100FKA-BP0109RA | |
| HWBOT x265 Benchmark v2.2 / 4k Preset | |
| Intel NUC11TNKi5 | |
| Intel NUC8i7BE | |
| Intel NUC8i7BE | |
| Zotac ZBOX MI642 Nano | |
| Beelink SEi10 | |
| Beelink U59 | |
| Átlagos Intel Celeron N5095 (1.9 - 2.05, n=5) | |
| GMK NucBox K1 | |
| Jumper Tech Ez Book X3 Air | |
| Blackview AceBook 1 | |
| Chuwi LapBook Plus | |
| Asus BR1100FKA-BP0109RA | |
| LibreOffice / 20 Documents To PDF | |
| Asus BR1100FKA-BP0109RA | |
| Blackview AceBook 1 | |
| Jumper Tech Ez Book X3 Air | |
| GMK NucBox K1 | |
| Átlagos Intel Celeron N5095 (97 - 107.9, n=5) | |
| Beelink U59 | |
| Zotac ZBOX MI642 Nano | |
| Beelink SEi10 | |
| Intel NUC11TNKi5 | |
| R Benchmark 2.5 / Overall mean | |
| Asus BR1100FKA-BP0109RA | |
| Jumper Tech Ez Book X3 Air | |
| Blackview AceBook 1 | |
| GMK NucBox K1 | |
| Átlagos Intel Celeron N5095 (1.16 - 1.2, n=5) | |
| Beelink U59 | |
| Beelink SEi10 | |
| Zotac ZBOX MI642 Nano | |
| Intel NUC8i7BE | |
| Intel NUC11TNKi5 | |
* ... a kisebb jobb
AIDA64: FP32 Ray-Trace | FPU Julia | CPU SHA3 | CPU Queen | FPU SinJulia | FPU Mandel | CPU AES | CPU ZLib | FP64 Ray-Trace | CPU PhotoWorxx
| Performance rating | |
| Intel NUC11TNKi5 | |
| Intel NUC8i7BE -1! | |
| Zotac ZBOX MI642 Nano | |
| Beelink U59 | |
| AIDA64 / FP32 Ray-Trace | |
| Intel NUC11TNKi5 | |
| Intel NUC8i7BE | |
| Zotac ZBOX MI642 Nano | |
| Beelink U59 | |
| AIDA64 / FPU Julia | |
| Intel NUC11TNKi5 | |
| Intel NUC8i7BE | |
| Zotac ZBOX MI642 Nano | |
| Beelink U59 | |
| AIDA64 / CPU SHA3 | |
| Intel NUC11TNKi5 | |
| Zotac ZBOX MI642 Nano | |
| Beelink U59 | |
| AIDA64 / CPU Queen | |
| Intel NUC8i7BE | |
| Zotac ZBOX MI642 Nano | |
| Intel NUC11TNKi5 | |
| Beelink U59 | |
| AIDA64 / FPU SinJulia | |
| Intel NUC8i7BE | |
| Intel NUC11TNKi5 | |
| Zotac ZBOX MI642 Nano | |
| Beelink U59 | |
| AIDA64 / FPU Mandel | |
| Intel NUC11TNKi5 | |
| Intel NUC8i7BE | |
| Zotac ZBOX MI642 Nano | |
| Beelink U59 | |
| AIDA64 / CPU AES | |
| Intel NUC11TNKi5 | |
| Beelink U59 | |
| Intel NUC8i7BE | |
| Zotac ZBOX MI642 Nano | |
| AIDA64 / CPU ZLib | |
| Intel NUC11TNKi5 | |
| Intel NUC8i7BE | |
| Zotac ZBOX MI642 Nano | |
| Beelink U59 | |
| AIDA64 / FP64 Ray-Trace | |
| Intel NUC11TNKi5 | |
| Intel NUC8i7BE | |
| Zotac ZBOX MI642 Nano | |
| Beelink U59 | |
| AIDA64 / CPU PhotoWorxx | |
| Intel NUC8i7BE | |
| Intel NUC11TNKi5 | |
| Zotac ZBOX MI642 Nano | |
| Beelink U59 | |
| PCMark 10 / Score | |
| Intel NUC8i7BE | |
| Intel NUC11TNKi5 | |
| Zotac ZBOX MI642 Nano | |
| Beelink SEi10 | |
| Beelink U59 | |
| Átlagos Intel Celeron N5095, Intel UHD Graphics (Jasper Lake 16 EU) (2317 - 2417, n=5) | |
| GMK NucBox K1 | |
| PCMark 10 / Essentials | |
| Intel NUC11TNKi5 | |
| Intel NUC8i7BE | |
| Zotac ZBOX MI642 Nano | |
| Beelink SEi10 | |
| Beelink U59 | |
| Átlagos Intel Celeron N5095, Intel UHD Graphics (Jasper Lake 16 EU) (5516 - 5874, n=5) | |
| GMK NucBox K1 | |
| PCMark 10 / Productivity | |
| Intel NUC8i7BE | |
| Zotac ZBOX MI642 Nano | |
| Intel NUC11TNKi5 | |
| Beelink SEi10 | |
| Beelink U59 | |
| Átlagos Intel Celeron N5095, Intel UHD Graphics (Jasper Lake 16 EU) (3454 - 3666, n=5) | |
| GMK NucBox K1 | |
| PCMark 10 / Digital Content Creation | |
| Intel NUC11TNKi5 | |
| Intel NUC8i7BE | |
| Zotac ZBOX MI642 Nano | |
| Beelink SEi10 | |
| Beelink U59 | |
| Átlagos Intel Celeron N5095, Intel UHD Graphics (Jasper Lake 16 EU) (1752 - 1787, n=5) | |
| GMK NucBox K1 | |
| PCMark 10 Score | 2410 pontok | |
Segítség | ||
| AIDA64 / Memory Copy | |
| Intel NUC8i7BE | |
| Zotac ZBOX MI642 Nano | |
| Beelink U59 | |
| Intel NUC11TNKi5 | |
| AIDA64 / Memory Read | |
| Intel NUC8i7BE | |
| Zotac ZBOX MI642 Nano | |
| Intel NUC11TNKi5 | |
| Beelink U59 | |
| AIDA64 / Memory Write | |
| Intel NUC8i7BE | |
| Zotac ZBOX MI642 Nano | |
| Beelink U59 | |
| Intel NUC11TNKi5 | |
| AIDA64 / Memory Latency | |
| Zotac ZBOX MI642 Nano | |
| Intel NUC11TNKi5 | |
| Beelink U59 | |
| Intel NUC8i7BE | |
* ... a kisebb jobb
| DPC Latencies / LatencyMon - interrupt to process latency (max), Web, Youtube, Prime95 | |
| GMK NucBox K1 | |
| Beelink SEi10 | |
| Beelink U59 | |
| Intel NUC11TNKi5 | |
* ... a kisebb jobb

| Drive Performance rating - Percent | |
| Beelink SEi10 | |
| Zotac ZBOX MI642 Nano | |
| Intel NUC11TNKi5 | |
| Beelink U59 | |
| GMK NucBox K1 | |
| DiskSpd | |
| seq read | |
| Beelink SEi10 | |
| Intel NUC11TNKi5 | |
| Zotac ZBOX MI642 Nano | |
| Beelink U59 | |
| GMK NucBox K1 | |
| seq write | |
| Beelink SEi10 | |
| Zotac ZBOX MI642 Nano | |
| Intel NUC11TNKi5 | |
| Beelink U59 | |
| GMK NucBox K1 | |
| seq q8 t1 read | |
| Beelink SEi10 | |
| Intel NUC11TNKi5 | |
| Zotac ZBOX MI642 Nano | |
| Beelink U59 | |
| GMK NucBox K1 | |
| seq q8 t1 write | |
| Beelink SEi10 | |
| Zotac ZBOX MI642 Nano | |
| Intel NUC11TNKi5 | |
| GMK NucBox K1 | |
| Beelink U59 | |
| 4k q1 t1 read | |
| Beelink SEi10 | |
| Zotac ZBOX MI642 Nano | |
| Intel NUC11TNKi5 | |
| Beelink U59 | |
| GMK NucBox K1 | |
| 4k q1 t1 write | |
| Beelink SEi10 | |
| Zotac ZBOX MI642 Nano | |
| GMK NucBox K1 | |
| Intel NUC11TNKi5 | |
| Beelink U59 | |
| 4k q32 t16 read | |
| Beelink SEi10 | |
| Zotac ZBOX MI642 Nano | |
| Intel NUC11TNKi5 | |
| Beelink U59 | |
| GMK NucBox K1 | |
| 4k q32 t16 write | |
| Beelink SEi10 | |
| Intel NUC11TNKi5 | |
| Zotac ZBOX MI642 Nano | |
| GMK NucBox K1 | |
| Beelink U59 | |
| AS SSD | |
| Score Total | |
| Zotac ZBOX MI642 Nano | |
| Beelink SEi10 | |
| Intel NUC11TNKi5 | |
| Beelink U59 | |
| GMK NucBox K1 | |
| Score Read | |
| Beelink SEi10 | |
| Zotac ZBOX MI642 Nano | |
| Intel NUC11TNKi5 | |
| Beelink U59 | |
| GMK NucBox K1 | |
| Score Write | |
| Intel NUC11TNKi5 | |
| Zotac ZBOX MI642 Nano | |
| Beelink U59 | |
| Beelink SEi10 | |
| GMK NucBox K1 | |
| Seq Read | |
| Beelink SEi10 | |
| Intel NUC11TNKi5 | |
| Beelink U59 | |
| Zotac ZBOX MI642 Nano | |
| GMK NucBox K1 | |
| Seq Write | |
| Intel NUC11TNKi5 | |
| Zotac ZBOX MI642 Nano | |
| GMK NucBox K1 | |
| Beelink U59 | |
| Beelink SEi10 | |
| 4K Read | |
| Zotac ZBOX MI642 Nano | |
| Beelink SEi10 | |
| Intel NUC11TNKi5 | |
| Beelink U59 | |
| GMK NucBox K1 | |
| 4K Write | |
| Zotac ZBOX MI642 Nano | |
| Beelink SEi10 | |
| GMK NucBox K1 | |
| Intel NUC11TNKi5 | |
| Beelink U59 | |
| 4K-64 Read | |
| Zotac ZBOX MI642 Nano | |
| Beelink SEi10 | |
| Intel NUC11TNKi5 | |
| Beelink U59 | |
| GMK NucBox K1 | |
| 4K-64 Write | |
| Intel NUC11TNKi5 | |
| Beelink U59 | |
| Zotac ZBOX MI642 Nano | |
| Beelink SEi10 | |
| GMK NucBox K1 | |
| Access Time Read | |
| GMK NucBox K1 | |
| Beelink U59 | |
| Intel NUC11TNKi5 | |
| Zotac ZBOX MI642 Nano | |
| Beelink SEi10 | |
| Access Time Write | |
| Beelink SEi10 | |
| GMK NucBox K1 | |
| Intel NUC11TNKi5 | |
| Beelink U59 | |
| Zotac ZBOX MI642 Nano | |
* ... a kisebb jobb
Disk Throttling: DiskSpd Read Loop, Queue Depth 8
| 3DMark Performance rating - Percent | |
| Intel NUC11TNKi5 | |
| Intel NUC8i7BE | |
| Zotac ZBOX MI642 Nano -3! | |
| Prime Computer PrimeMini 5 i7 NUC8v7PNB | |
| Beelink SEi10 | |
| Beelink U59 | |
| Átlagos Intel UHD Graphics (Jasper Lake 16 EU) | |
| Chuwi LapBook Plus -1! | |
| Blackview AceBook 1 -2! | |
| Asus BR1100FKA-BP0109RA | |
| GMK NucBox K1 | |
| Jumper Tech Ez Book X3 Air -1! | |
| 3DMark | |
| 1280x720 Cloud Gate Standard Graphics | |
| Intel NUC11TNKi5 | |
| Intel NUC8i7BE | |
| Zotac ZBOX MI642 Nano | |
| Prime Computer PrimeMini 5 i7 NUC8v7PNB | |
| Beelink SEi10 | |
| Beelink U59 | |
| Átlagos Intel UHD Graphics (Jasper Lake 16 EU) (4210 - 5217, n=8) | |
| Asus BR1100FKA-BP0109RA | |
| Chuwi LapBook Plus | |
| Blackview AceBook 1 | |
| GMK NucBox K1 | |
| 1920x1080 Fire Strike Graphics | |
| Intel NUC11TNKi5 | |
| Intel NUC8i7BE | |
| Zotac ZBOX MI642 Nano | |
| Prime Computer PrimeMini 5 i7 NUC8v7PNB | |
| Beelink SEi10 | |
| Beelink U59 | |
| Átlagos Intel UHD Graphics (Jasper Lake 16 EU) (392 - 679, n=8) | |
| Jumper Tech Ez Book X3 Air | |
| Blackview AceBook 1 | |
| GMK NucBox K1 | |
| Asus BR1100FKA-BP0109RA | |
| 2560x1440 Time Spy Graphics | |
| Intel NUC11TNKi5 | |
| Intel NUC8i7BE | |
| Prime Computer PrimeMini 5 i7 NUC8v7PNB | |
| Beelink SEi10 | |
| Beelink U59 | |
| Átlagos Intel UHD Graphics (Jasper Lake 16 EU) (129 - 182, n=5) | |
| Chuwi LapBook Plus | |
| Asus BR1100FKA-BP0109RA | |
| Jumper Tech Ez Book X3 Air | |
| GMK NucBox K1 | |
| 2560x1440 Time Spy Score | |
| Intel NUC11TNKi5 | |
| Intel NUC8i7BE | |
| Prime Computer PrimeMini 5 i7 NUC8v7PNB | |
| Beelink SEi10 | |
| Beelink U59 | |
| Átlagos Intel UHD Graphics (Jasper Lake 16 EU) (145 - 210, n=5) | |
| Chuwi LapBook Plus | |
| Asus BR1100FKA-BP0109RA | |
| Jumper Tech Ez Book X3 Air | |
| GMK NucBox K1 | |
| 3DMark 11 - 1280x720 Performance GPU | |
| Intel NUC11TNKi5 | |
| Intel NUC8i7BE | |
| Prime Computer PrimeMini 5 i7 NUC8v7PNB | |
| Beelink SEi10 | |
| Beelink U59 | |
| Átlagos Intel UHD Graphics (Jasper Lake 16 EU) (554 - 894, n=8) | |
| Chuwi LapBook Plus | |
| Jumper Tech Ez Book X3 Air | |
| GMK NucBox K1 | |
| Blackview AceBook 1 | |
| Asus BR1100FKA-BP0109RA | |
| 3DMark 11 Performance | 1028 pontok | |
| 3DMark Cloud Gate Standard Score | 4845 pontok | |
| 3DMark Fire Strike Score | 658 pontok | |
| 3DMark Time Spy Score | 210 pontok | |
Segítség | ||
Witcher 3 FPS Chart
| alacsony | közepes | magas | ultra | |
|---|---|---|---|---|
| The Witcher 3 (2015) | 14 | |||
| Dota 2 Reborn (2015) | 57.3 | 26.6 | 12 | 11.2 |
| Final Fantasy XV Benchmark (2018) | 7.17 | |||
| X-Plane 11.11 (2018) | 10.8 | 9.18 | 8.62 |
Zajszint
| Üresjárat |
| 24.5 / 24.5 / 28.6 dB(A) |
| Terhelés |
| 29.7 / 37.6 dB(A) |
 | ||
30 dB csendes 40 dB(A) hallható 50 dB(A) hangos |
||
min: | ||
| Beelink U59 UHD Graphics (Jasper Lake 16 EU), Celeron N5095, Silicon Motion AZW 512G NV428 | Intel NUC11TNKi5 Iris Xe G7 80EUs, i5-1135G7, Transcend M.2 SSD 430S TS512GMTS430S | Intel NUC8i7BE Iris Plus Graphics 655, i7-8559U | Beelink SEi10 UHD Graphics G1 (Ice Lake 32 EU), i3-1005G1, Silicon Motion AZW 256G M.2280 NVMe 4X 200725 D | Zotac ZBOX MI642 Nano UHD Graphics 620, i5-10210U, Western Digital WD Blue 3D WDBNCE5000PNC | GMK NucBox K1 UHD Graphics 600, Celeron J4125, HIKVision C100 NGFF SSD 128GB | |
|---|---|---|---|---|---|---|
| Noise | -27% | -19% | -27% | -24% | -20% | |
| off / környezet * (dB) | 24.5 | 24.8 -1% | 28.7 -17% | 27.5 -12% | 27.8 -13% | 27.8 -13% |
| Idle Minimum * (dB) | 24.5 | 35.6 -45% | 28.7 -17% | 30.9 -26% | 27.8 -13% | 27.8 -13% |
| Idle Average * (dB) | 24.5 | 35.6 -45% | 29.3 -20% | 33.5 -37% | 33.9 -38% | 27.8 -13% |
| Idle Maximum * (dB) | 28.6 | 35.6 -24% | 31.8 -11% | 33.5 -17% | 33.9 -19% | 27.8 3% |
| Load Average * (dB) | 29.7 | 36.2 -22% | 39 -31% | 38.5 -30% | 43.7 -47% | 46.8 -58% |
| Witcher 3 ultra * (dB) | 30.4 | 38 -25% | 39 -28% | |||
| Load Maximum * (dB) | 37.6 | 47.6 -27% | 41.4 -10% | 51.6 -37% | 43.7 -16% | 46.8 -24% |
* ... a kisebb jobb
| Kikapcsolt állapot / Készenlét | |
| Üresjárat | |
| Terhelés |
|
Kulcs:
min: | |
| Beelink U59 Celeron N5095, UHD Graphics (Jasper Lake 16 EU), Silicon Motion AZW 512G NV428, , x, | Intel NUC11TNKi5 i5-1135G7, Iris Xe G7 80EUs, Transcend M.2 SSD 430S TS512GMTS430S, , x, | Intel NUC8i7BE i7-8559U, Iris Plus Graphics 655, , , x, | Beelink SEi10 i3-1005G1, UHD Graphics G1 (Ice Lake 32 EU), Silicon Motion AZW 256G M.2280 NVMe 4X 200725 D, , x, | Zotac ZBOX MI642 Nano i5-10210U, UHD Graphics 620, Western Digital WD Blue 3D WDBNCE5000PNC, , x, | GMK NucBox K1 Celeron J4125, UHD Graphics 600, HIKVision C100 NGFF SSD 128GB, , x, | |
|---|---|---|---|---|---|---|
| Power Consumption | -135% | -102% | -26% | -67% | 34% | |
| Idle Minimum * (Watt) | 6.7 | 11.5 -72% | 2.7 60% | 6.3 6% | 8.9 -33% | 3.4 49% |
| Idle Average * (Watt) | 6.7 | 12.4 -85% | 3.1 54% | 6.6 1% | 9 -34% | 3.8 43% |
| Idle Maximum * (Watt) | 7.4 | 12.9 -74% | 6.3 15% | 6.7 9% | 9.9 -34% | 3.9 47% |
| Load Average * (Watt) | 16 | 40.7 -154% | 59.7 -273% | 25.9 -62% | 33 -106% | 12.5 22% |
| Witcher 3 ultra * (Watt) | 13.1 | 43.9 -235% | 47.2 -260% | |||
| Load Maximum * (Watt) | 25.6 | 73.5 -187% | 78 -205% | 46.7 -82% | 58 -127% | 22.7 11% |
* ... a kisebb jobb
Power Consumption Witcher 3 / Stresstest
Power Consumption external Monitor
Pro
Kontra
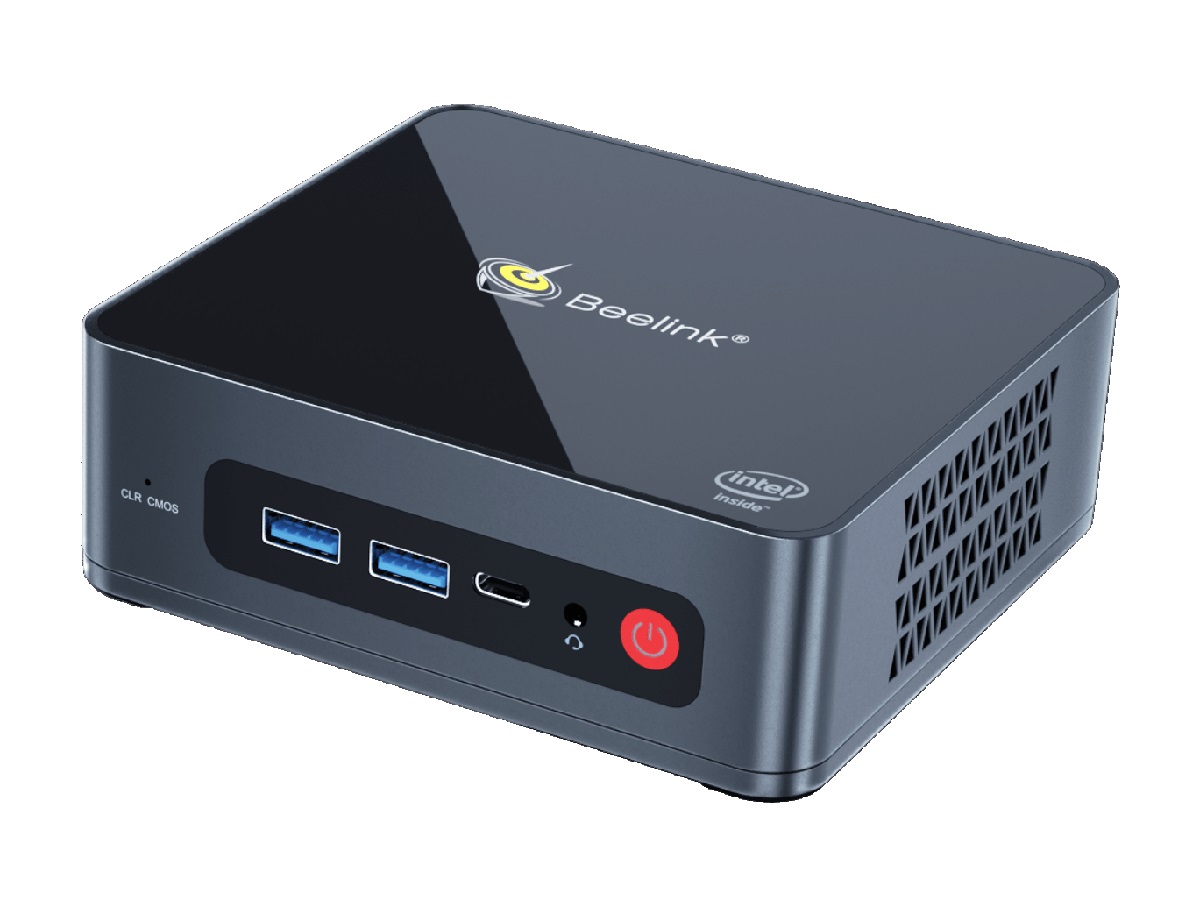
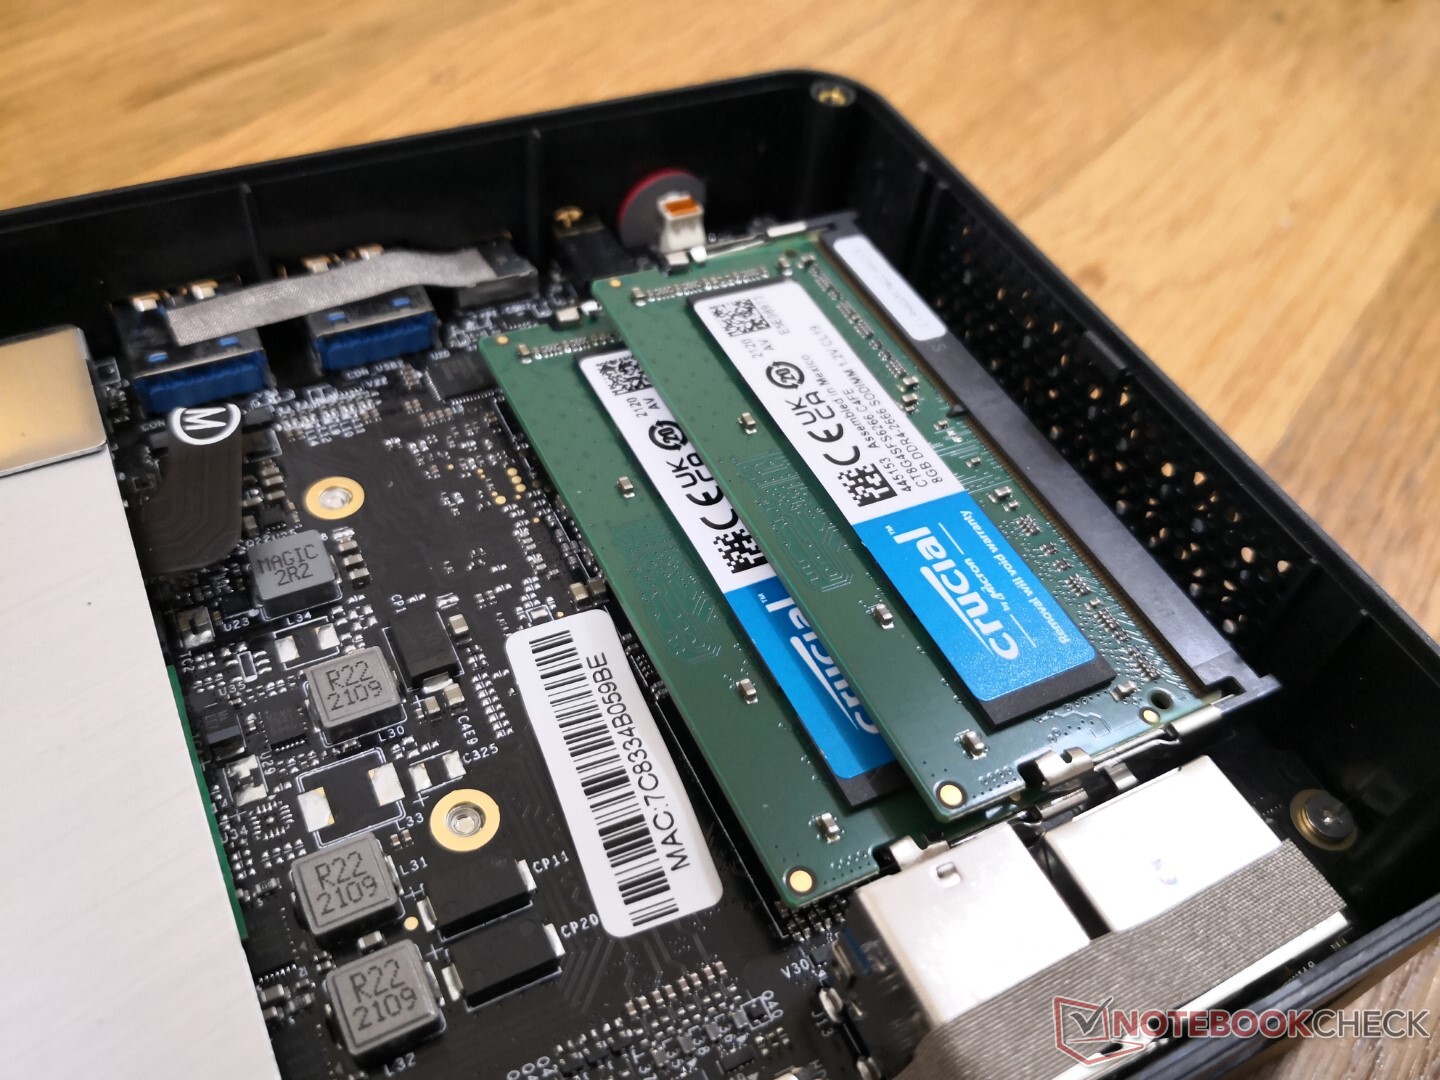
A Beelink U59-ben a legmeggyőzőbb az alacsony, 279-349 dolláros ár, RAM-mal, adattárolóval és Windows 11 Pro operációs rendszerrel. Az teljesítmény-érték arány magasabb, mint a korábbi generációs Celeron mini PC-knél is, akár 2x-2,5x-szeres lehet a többszálas teljesítményt, illetve 50%-kal nagyobb egyszálas teljesítményt és grafikát kínál. Nagyra értékeljük, hogy mindkét tárolórekesz, mindkét RAM slot és a WLAN modul könnyen hozzáférhető és bővíthető, ami azt jelenti, hogy az érdeklődő vásárlóknak nem kell a magasabb kategóriás konfigurációért fizetniük, ha nem gond nekik, hogy maguk bővítsék ezeket a komponenseket.
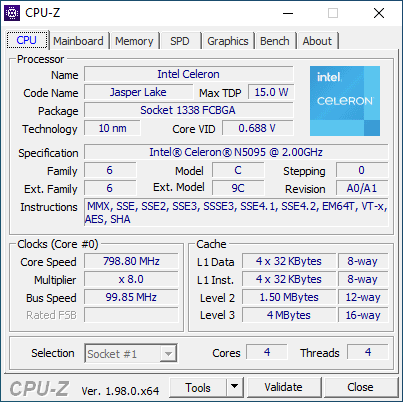
Nem egészen egy Core i3, de a Jasper Lake Celeron N5095 legalább sokkal közelebb áll hozzá, mint bármelyik korábbi mobil Celeron CPU. A Beelink U59 érezhetően jobb teljesítményt nyújt, mint a legtöbb más mini PC a 200 és 350 dollár közötti árkategóriában.
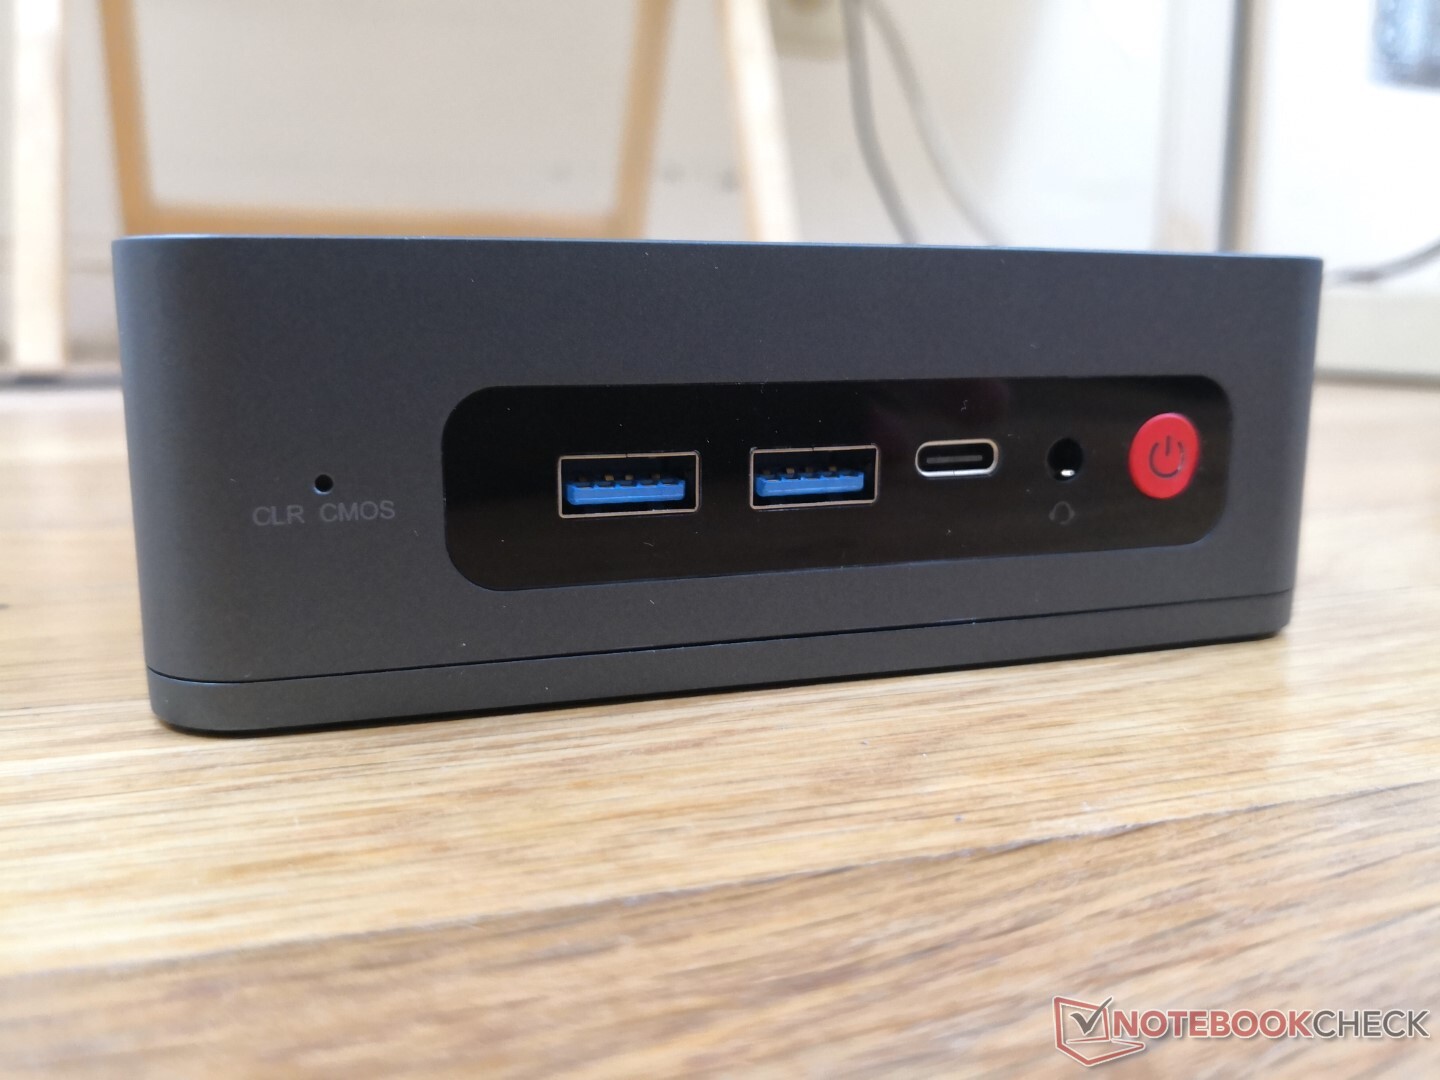
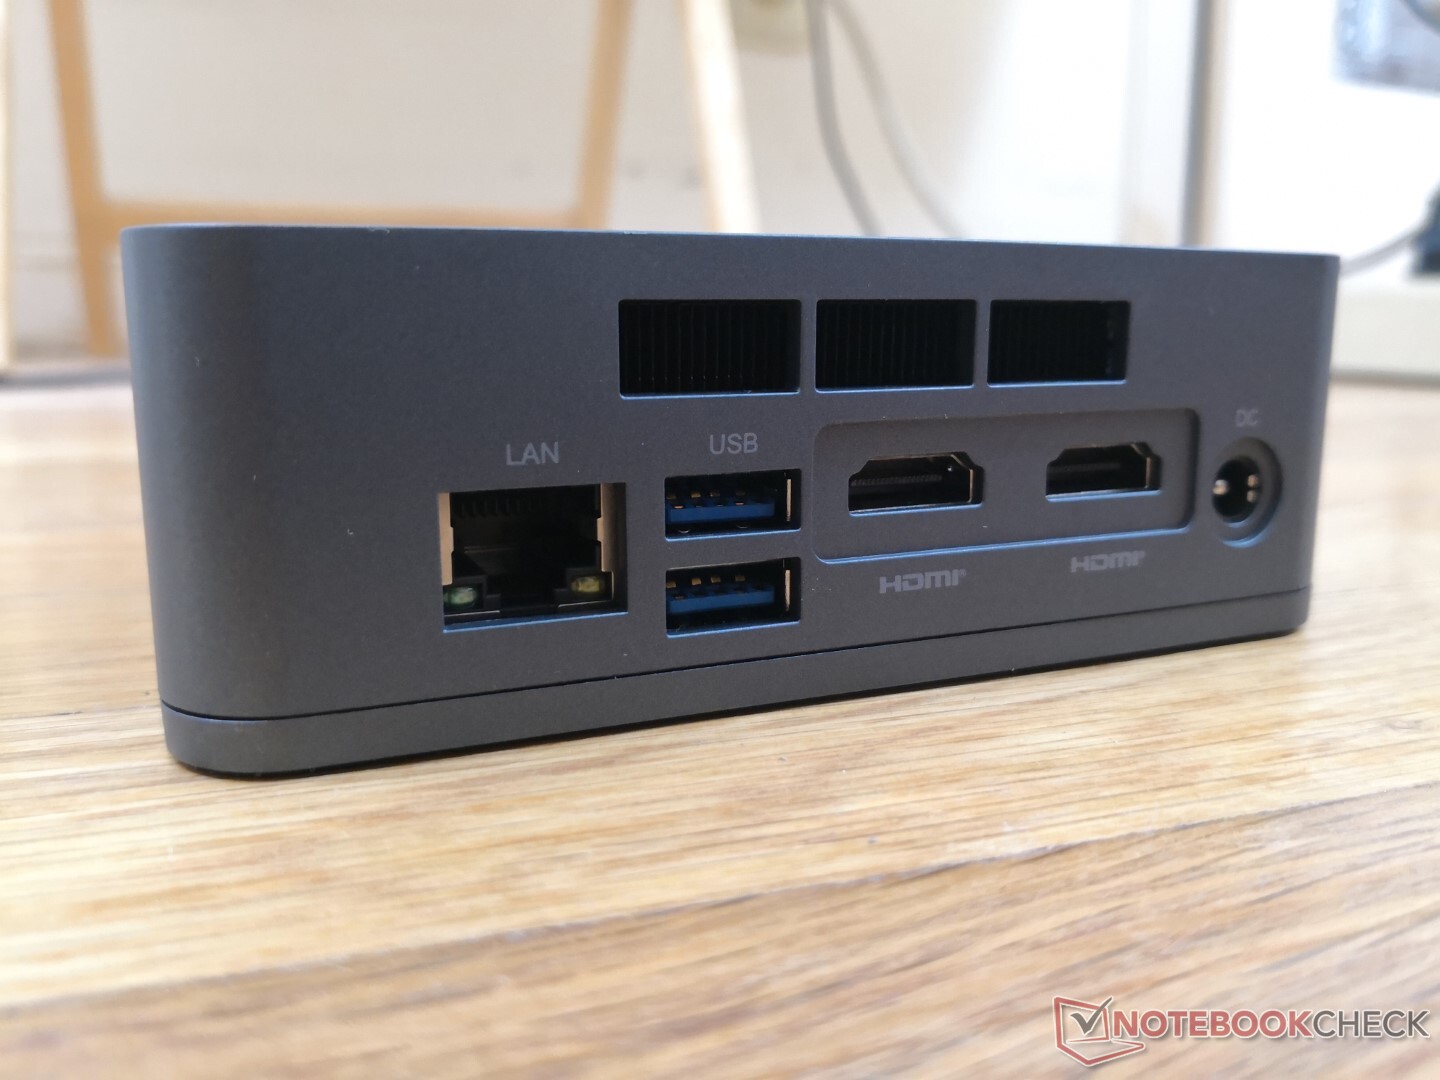
A hátrányok kisebbek, de összeadódnak. Bosszantó, hogy a rendszernek saját hálózati adapterre van szüksége, amikor ehelyett az univerzálisabb USB-C-ről is megoldható lett volna az áramellátás. A ventilátor, bár általában csendes, hajlamos a pulzálásra, amikor nő a terhelés. Az SD-kártyaolvasó hiánya bosszanthatja azokat a felhasználókat, akiknek erre szükségük lenne, míg a felső műanyaglemez olcsónak és karcolódásra hajlamosnak tűnik. Akinek azonban muszáj bármilyen Celeron mini PC-t beszereznie, annak a Jasper Lake meghajtású Beelink U59 jó választás lehet, már csak azért is, mert teljesítmény szempontjából jelentős előnyökkel rendelkezik a régebbi Celeron chipekhez képest, mint amilyenek a GMK NucBox K1 vagy a Chuwi GBox gépekben vannak.
Ár és Elérhetőség
Az Amazon jelenleg a Beelink U59 279 és 349 USD között érhető el a RAM és tárhely opcióktól függően.
Price comparison

