Notebookcheck Logo

HP ZBook Studio G3 munkaállomás rövid értékelés

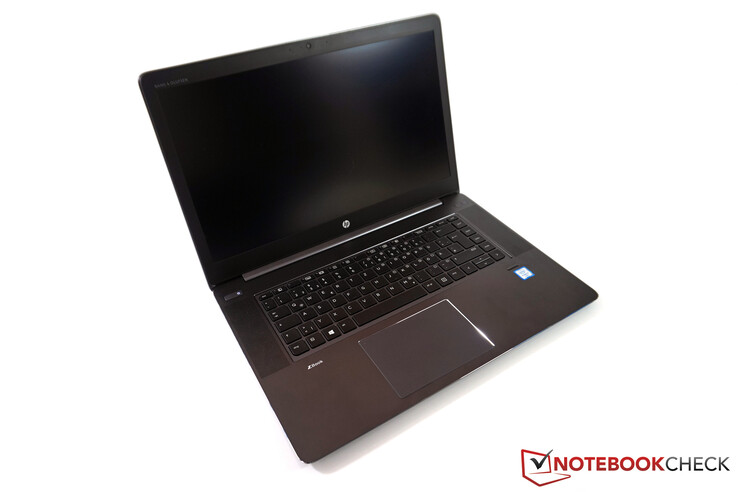
Túl ambiciózus? A HP ZBook Studio G3 a gyártó ZBook sorozatának legújabb tagja amely a trendeket követve egy vékonyabb eszköz erős hardverrel megpakolva. Több tekintetben is nagyon jó eszközt tett le az asztalra a gyártó, azonban számottevő limitációkkal kell számolni, főleg a kibocsátásokkal és az akkus üzemidővel kapcsolatban.
Geforce Laptop / Notebook Skylake Ultrabook Workstation Windows
HP ZBook Studio G3 (ZBook Studio Széria)
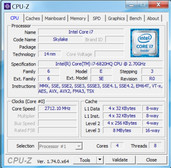
Processzor
Intel Core i7-6820HQ 4 x 2.7 - 3.6 GHz, Skylake
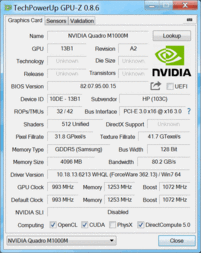
Grafikus adapter
NVIDIA Quadro M1000M - 4 GB VRAM, Mag: 1124 MHz, Memória: 1253 MHz, GDDR5, ForceWare 362.13, Optimus
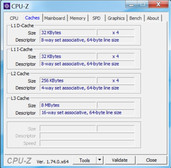
Memória
16 GB 
, DDR4-2133, két-sávos, 2/2 foglalat használatban, max. 32 GB
Kijelző
15.60 hüvelyk 16:9, 3840 x 2160 pixel 282 PPI, Sharp SPH1445, IPS, fényes: nem
Alaplap
Intel CM236 (Skylake PCH-H)
Háttértár
Samsung SM951 MZVPV512HDGL m.2 PCI-e, 512 GB 
, 420 GB ingyenes
Hangkártya
Intel Skylake PCH-H High Definition Audio Controller
Csatlakozók
3 USB 3.0, 2 USB 3.1 Gen2, 2 Thunderbolt, 1 HDMI, 1 Kensington zár, Audió csatlakozók: 3.5 mm Headset, Kártyaolvasó: SD UHS-II, 1 Ujjlenyomat olvasó, Fényerő érzékelő
Hálózat
Intel Ethernet Connection I219-LM (10/100/1000MBit/s), Intel Dual Band Wireless-AC 8260 (a/b/g/n = Wi-Fi 4/ac = Wi-Fi 5/), Bluetooth 4.2
Méret
magasság x szélesség x mélység (mm-ben) 18 x 375 x 255
Akkumulátor
64 Wh, 3930 mAh Lítium-Ion, 4-cellás
Operációs rendszer
Microsoft Windows 7 Professional (64 Bit) + Windows 10 Pro (64 Bit)
Camera
Webkamera: 720p HD-Webcam
További jellegzetességek
Hangszórók: sztereó hangszórók, Audio by Bang & Olufsen, Billentyűzet: Chiclet, Billentyűzet háttérvilágítás: igen, 150-Watt tápegység, brossúrák, HP Performance Advisor, HP Remote Graphics Software, HP Client Security, HP Drive Encryption (FIPS 140-2), Microsoft Security Essentials, Microsoft Defender, HP ePrint Driver, HP PageLift, 36 Hónap Garancia
Súly
2.086 kg, Tápegység: 446 g
Ár
3800 Euró
Hivatkozások
Megjegyzés: A gyártó különböző beszállítóktól származó alkatrészeket használhat, beleértve a hasonló specifikációjú kijelzőpaneleket, meghajtókat vagy memóriastickeket.


296
cd/m²
334
cd/m²
289
cd/m²
287
cd/m²
310
cd/m²
288
cd/m²
313
cd/m²
286
cd/m²
292
cd/m²
Fényerő megoszlás
Sharp SPH1445 tested with X-Rite i1Pro 2
Maximum: 334 cd/m² (Nits) Átlag: 299.4 cd/m² Minimum: 16 cd/m²
Fényerő megoszlás: 86 %
Centrumban: 307 cd/m²
Kontraszt: 1069:1 (Fekete: 0.29 cd/m²)
ΔE Color 5.9 | 0.5-29.43 Ø5
ΔE Greyscale 5.5 | 0.57-98 Ø5.3
99.9% sRGB (Calman 2D)
99% sRGB (Argyll 1.6.3 3D)
85% AdobeRGB 1998 (Argyll 1.6.3 3D)
98% AdobeRGB 1998 (Argyll 2.2.0 3D)
98.9% sRGB (Argyll 2.2.0 3D)
86% Display P3 (Argyll 2.2.0 3D)
Gamma: 2.09
HP ZBook Studio G3
15.60, 3840x2160, IPS
Dell Precision 5510
15.60, 3840x2160, IGZO LED
MSI WS60-6QJE316H11
15.60, 3840x2160, IPS
Lenovo ThinkPad P50
15.60, 1920x1080, IPS
Lenovo ThinkPad P50s-20FKS00400
15.50, 2880x1620, IPS
HP ZBook 15 G3
15.60, 1920x1080, UWVA-IPS
HP ZBook 15u G3
15.60, 1920x1080, TN LED
Apple MacBook Pro Retina 15 inch 2015-05
15.40, 2880x1800, IPS-Panel
Display
2%
-31%
-51%
-24%
-18%
-34%
-24%
Display P3 Coverage
86
88.4
3%
55.1
-36%
39.13
-54%
63.7
-26%
66.8
-22%
53.2
-38%
61.4
-29%
sRGB Coverage
98.9
100
1%
83
-16%
58.5
-41%
87.6
-11%
95.5
-3%
80.1
-19%
90.8
-8%
AdobeRGB 1998 Coverage
98
99.5
2%
56.9
-42%
40.45
-59%
63.8
-35%
69
-30%
54.9
-44%
62.9
-36%
Response Times
-38%
193%
-9%
0%
-26%
-18%
Response Time Grey 50% / Grey 80% *
44 ?(17, 27)
56.4 ?(23.2, 33.2)
-28%
34 ?(13, 21)
23%
46 ?(17, 29)
-5%
38 ?(15.2, 22.8)
14%
54 ?(24.4, 29.6)
-23%
45.6 ?(25.6, 20)
-4%
Response Time Black / White *
23.2 ?(6, 17.2)
34 ?(11, 23)
-47%
24 ?(9, 15)
-3%
26 ?(9, 17)
-12%
28.8 ?(8.4, 20.4)
-24%
35.6 ?(11.6, 24)
-53%
34.4 ?(16.4, 18)
-48%
PWM Frequency
200 ?(55)
1316 ?(40)
558%
219 ?(90)
10%
198 ?(95)
-1%
198.4 ?(90)
-1%
Screen
7%
-6%
-10%
-2%
-8%
-48%
15%
Brightness middle
310
391
26%
237
-24%
263
-15%
319
3%
306
-1%
297.8
-4%
341
10%
Brightness
299
361
21%
208
-30%
236
-21%
290
-3%
289
-3%
284
-5%
315
5%
Brightness Distribution
86
87
1%
77
-10%
78
-9%
82
-5%
85
-1%
89
3%
82
-5%
Black Level *
0.29
0.4
-38%
0.26
10%
0.34
-17%
0.31
-7%
0.34
-17%
0.849
-193%
0.34
-17%
Contrast
1069
978
-9%
912
-15%
774
-28%
1029
-4%
900
-16%
351
-67%
1003
-6%
Colorchecker dE 2000 *
5.9
4.85
18%
4.42
25%
2.35
60%
4.8
19%
5.1
14%
8.68
-47%
2.07
65%
Colorchecker dE 2000 max. *
10.7
8.54
20%
7.8
27%
9.9
7%
14.98
-40%
3.27
69%
Greyscale dE 2000 *
5.5
4.01
27%
4.43
19%
3.33
39%
5.7
-4%
7.4
-35%
9.3
-69%
1.9
65%
Gamma
2.09 105%
2.18 101%
2.23 99%
2.38 92%
2.07 106%
2.37 93%
2.27 97%
2.62 84%
CCT
5980 109%
7340 89%
6133 106%
6917 94%
6260 104%
7263 89%
10585 61%
6514 100%
Color Space (Percent of AdobeRGB 1998)
85
96
13%
52.5
-38%
37
-56%
56.9
-33%
63
-26%
50.99
-40%
58
-32%
Color Space (Percent of sRGB)
99
100
1%
82.9
-16%
58
-41%
87.4
-12%
95
-4%
80.42
-19%
91
-8%
Teljes átlag (program / beállítások)
-10% / -1%
52% / 27%
-23% / -19%
-9% / -6%
-17% / -13%
-33% / -40%
-5% / 6%

* ... a kisebb jobb

Megjelenítési válaszidők

A kijelző válaszideje azt mutatja, hogy a képernyő milyen gyorsan képes egyik színről a másikra váltani. A lassú válaszidők utóképekhez vezethetnek, és a mozgó tárgyak elmosódottak lehetnek (szellemképek). A gyors tempójú 3D-s címek játékosainak különösen oda kell figyelniük a gyors válaszidőkre.
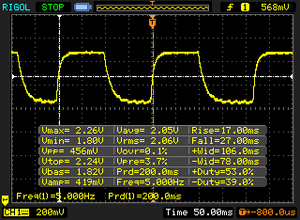
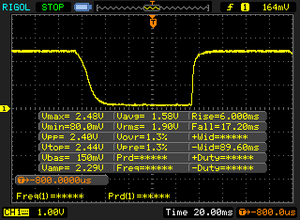
       Válaszidő Fekete-fehér
23.2 ms ... emelkedés és süllyedés ↘ kombinálva↗ 6 ms emelkedés
↘ 17.2 ms ősz
A képernyő jó reakciósebességet mutat tesztjeinkben, de túl lassú lehet a versenyképes játékosok számára.
In comparison, all tested devices range from 0.1 (minimum) to 240 (maximum) ms. » 47 % of all devices are better.
Ez azt jelenti, hogy a mért válaszidő hasonló az összes vizsgált eszköz átlagához (21.5 ms).
       Válaszidő 50% szürke és 80% szürke között
44 ms ... emelkedés és süllyedés ↘ kombinálva↗ 17 ms emelkedés
↘ 27 ms ősz
A képernyő lassú reakciósebességet mutat tesztjeinkben, és nem lesz kielégítő a játékosok számára.
In comparison, all tested devices range from 0.2 (minimum) to 636 (maximum) ms. » 69 % of all devices are better.
Ez azt jelenti, hogy a mért válaszidő rosszabb, mint az összes vizsgált eszköz átlaga (33.7 ms).

Képernyő villogása / PWM (impulzusszélesség-moduláció)

A képernyő tompításához egyes notebookok egyszerűen be- és kikapcsolják a háttérvilágítást gyors egymásutánban - ez az úgynevezett impulzusszélesség-moduláció (PWM) módszer. Ennek a ciklikus frekvenciának ideális esetben az emberi szem számára nem észlelhetőnek kell lennie. Ha ez a frekvencia túl alacsony, az érzékeny szemű felhasználóknak megerőltető lehet, fejfájást okozhat, vagy akár észre is vehetik a villódzást.
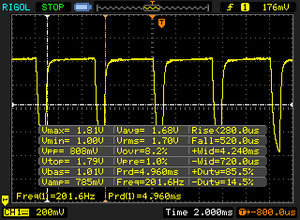
Képernyő villogása / PWM észlelve 200 Hz ≤ 55 % fényerő beállítása

The display backlight flickers at 200 Hz (worst case, e.g., utilizing PWM) Flickering detected at a brightness setting of 55 % and below. There should be no flickering or PWM above this brightness setting.

The frequency of 200 Hz is relatively low, so sensitive users will likely notice flickering and experience eyestrain at the stated brightness setting and below.

In comparison: 53 % of all tested devices do not use PWM to dim the display. If PWM was detected, an average of 17924 (minimum: 5 - maximum: 3846000) Hz was measured.

 
Cinebench R15
CPU Multi 64Bit
Dell Precision 5510
Intel Xeon E3-1505M v5
732 Points +4%
HP ZBook 15 G3
Intel Xeon E3-1505M v5
732 Points +4%
HP ZBook Studio G3
Intel Core i7-6820HQ
706 Points
MSI WS60-6QJE316H11
Intel Xeon E3-1505M v5
674 Points -5%
Apple MacBook Pro Retina 15 inch 2015-05
Intel Core i7-4870HQ
594 Points -16%
Apple MacBook Pro Retina 15 inch 2015-05
Intel Core i7-4870HQ
589 Points -17%
Lenovo ThinkPad P50
Intel Core i7-6820HQ
592 Points -16%
HP ZBook 15u G3
Intel Core i7-6600U
330 Points -53%
Lenovo ThinkPad P50s-20FKS00400
Intel Core i7-6500U
307 Points -57%
CPU Single 64Bit
MSI WS60-6QJE316H11
Intel Xeon E3-1505M v5
158 Points +6%
HP ZBook 15 G3
Intel Xeon E3-1505M v5
158 Points +6%
HP ZBook Studio G3
Intel Core i7-6820HQ
149 Points
Apple MacBook Pro Retina 15 inch 2015-05
Intel Core i7-4870HQ
144 Points -3%
Apple MacBook Pro Retina 15 inch 2015-05
Intel Core i7-4870HQ
143 Points -4%
HP ZBook 15u G3
Intel Core i7-6600U
143 Points -4%
Dell Precision 5510
Intel Xeon E3-1505M v5
142 Points -5%
Lenovo ThinkPad P50s-20FKS00400
Intel Core i7-6500U
129 Points -13%
Lenovo ThinkPad P50
Intel Core i7-6820HQ
117 Points -21%
Cinebench R11.5
CPU Multi 64Bit
Dell Precision 5510
Intel Xeon E3-1505M v5
7.93 Points +3%
HP ZBook 15 G3
Intel Xeon E3-1505M v5
7.91 Points +3%
HP ZBook Studio G3
Intel Core i7-6820HQ
7.7 Points
MSI WS60-6QJE316H11
Intel Xeon E3-1505M v5
7.42 Points -4%
Lenovo ThinkPad P50
Intel Core i7-6820HQ
6.48 Points -16%
Apple MacBook Pro Retina 15 inch 2015-05
Intel Core i7-4870HQ
6.3 Points -18%
Apple MacBook Pro Retina 15 inch 2015-05
Intel Core i7-4870HQ
6.18 Points -20%
HP ZBook 15u G3
Intel Core i7-6600U
3.67 Points -52%
Lenovo ThinkPad P50s-20FKS00400
Intel Core i7-6500U
3.45 Points -55%
CPU Single 64Bit
MSI WS60-6QJE316H11
Intel Xeon E3-1505M v5
1.78 Points +2%
HP ZBook 15 G3
Intel Xeon E3-1505M v5
1.78 Points +2%
HP ZBook Studio G3
Intel Core i7-6820HQ
1.74 Points
Apple MacBook Pro Retina 15 inch 2015-05
Intel Core i7-4870HQ
1.64 Points -6%
Apple MacBook Pro Retina 15 inch 2015-05
Intel Core i7-4870HQ
1.58 Points -9%
HP ZBook 15u G3
Intel Core i7-6600U
1.63 Points -6%
Dell Precision 5510
Intel Xeon E3-1505M v5
1.6 Points -8%
Lenovo ThinkPad P50s-20FKS00400
Intel Core i7-6500U
1.49 Points -14%
Lenovo ThinkPad P50
Intel Core i7-6820HQ
1.32 Points -24%
Cinebench R10
Rendering Multiple CPUs 32Bit
HP ZBook 15 G3
Intel Xeon E3-1505M v5
21834 Points +5%
Dell Precision 5510
Intel Xeon E3-1505M v5
21436 Points +3%
HP ZBook Studio G3
Intel Core i7-6820HQ
20868 Points
MSI WS60-6QJE316H11
Intel Xeon E3-1505M v5
20115 Points -4%
Apple MacBook Pro Retina 15 inch 2015-05
Intel Core i7-4870HQ
17747 Points -15%
Lenovo ThinkPad P50
Intel Core i7-6820HQ
17506 Points -16%
HP ZBook 15u G3
Intel Core i7-6600U
11464 Points -45%
Lenovo ThinkPad P50s-20FKS00400
Intel Core i7-6500U
10447 Points -50%
Rendering Single 32Bit
MSI WS60-6QJE316H11
Intel Xeon E3-1505M v5
5670 Points +5%
HP ZBook 15 G3
Intel Xeon E3-1505M v5
5560 Points +3%
HP ZBook Studio G3
Intel Core i7-6820HQ
5401 Points
HP ZBook 15u G3
Intel Core i7-6600U
5383 Points 0%
Dell Precision 5510
Intel Xeon E3-1505M v5
5367 Points -1%
Apple MacBook Pro Retina 15 inch 2015-05
Intel Core i7-4870HQ
5358 Points -1%
Lenovo ThinkPad P50s-20FKS00400
Intel Core i7-6500U
4886 Points -10%
Lenovo ThinkPad P50
Intel Core i7-6820HQ
4420 Points -18%
Rendering Multiple CPUs 64Bit
HP ZBook 15 G3
Intel Xeon E3-1505M v5
28384 Points +4%
Dell Precision 5510
Intel Xeon E3-1505M v5
28057 Points +3%
HP ZBook Studio G3
Intel Core i7-6820HQ
27362 Points
Apple MacBook Pro Retina 15 inch 2015-05
Intel Core i7-4870HQ
23488 Points -14%
MSI WS60-6QJE316H11
Intel Xeon E3-1505M v5
23333 Points -15%
Lenovo ThinkPad P50
Intel Core i7-6820HQ
22840 Points -17%
Lenovo ThinkPad P50s-20FKS00400
Intel Core i7-6500U
14039 Points -49%
Rendering Single CPUs 64Bit
MSI WS60-6QJE316H11
Intel Xeon E3-1505M v5
7347 Points +5%
HP ZBook 15 G3
Intel Xeon E3-1505M v5
7222 Points +3%
Apple MacBook Pro Retina 15 inch 2015-05
Intel Core i7-4870HQ
7044 Points +1%
HP ZBook Studio G3
Intel Core i7-6820HQ
6991 Points
Dell Precision 5510
Intel Xeon E3-1505M v5
6890 Points -1%
Lenovo ThinkPad P50s-20FKS00400
Intel Core i7-6500U
6241 Points -11%
Lenovo ThinkPad P50
Intel Core i7-6820HQ
5791 Points -17%
Cinebench R10 Rendering Single CPUs 64Bit
6991 Points
Cinebench R10 Rendering Multiple CPUs 64Bit
27362 Points
Cinebench R10 Shading 64Bit
6840 Points
Cinebench R10 Shading 32Bit
6833
Cinebench R10 Rendering Multiple CPUs 32Bit
20868
Cinebench R10 Rendering Single 32Bit
5401
Cinebench R11.5 OpenGL 64Bit
81.5 fps
Cinebench R11.5 CPU Multi 64Bit
7.7 Points
Cinebench R11.5 CPU Single 64Bit
1.74 Points
Cinebench R15 Ref. Match 64Bit
99.6 %
Cinebench R15 OpenGL 64Bit
93.7 fps
Cinebench R15 CPU Multi 64Bit
706 Points
Cinebench R15 CPU Single 64Bit
149 Points
Segítség
PCMark 8
Work Score Accelerated v2
HP ZBook 15 G3
E3-1505M v5, 32768, Samsung SM951 MZVPV512HDGL m.2 PCI-e
5221 Points +21%
Dell Precision 5510
E3-1505M v5, 16384, SK hynix SC920 512 GB
5100 Points +19%
HP ZBook 15u G3
6600U, 16384, Samsung SM951 MZVPV256HDGL m.2 PCI-e
4900 Points +14%
Lenovo ThinkPad P50
6820HQ, 8192, Samsung SSD PM871 MZNLN256HCHP
4677 Points +9%
Apple MacBook Pro Retina 15 inch 2015-05
4870HQ, 16384, Apple SSD SM0512G
4638 Points +8%
HP ZBook Studio G3
6820HQ, 16384, Samsung SM951 MZVPV512HDGL m.2 PCI-e
4301 Points
MSI WS60-6QJE316H11
E3-1505M v5, 16384, Toshiba NVMe THNSN5128GP
4045 Points -6%
Lenovo ThinkPad P50s-20FKS00400
6500U, 8192, Samsung PM871 MZYLN256HCHP
3744 Points -13%
Creative Score Accelerated v2
Apple MacBook Pro Retina 15 inch 2015-05
4870HQ, 16384, Apple SSD SM0512G
4662 Points +10%
HP ZBook 15u G3
6600U, 16384, Samsung SM951 MZVPV256HDGL m.2 PCI-e
4453 Points +5%
Dell Precision 5510
E3-1505M v5, 16384, SK hynix SC920 512 GB
4429 Points +5%
HP ZBook 15 G3
E3-1505M v5, 32768, Samsung SM951 MZVPV512HDGL m.2 PCI-e
4392 Points +4%
HP ZBook Studio G3
6820HQ, 16384, Samsung SM951 MZVPV512HDGL m.2 PCI-e
4235 Points
Home Score Accelerated v2
Lenovo ThinkPad P50
6820HQ, 8192, Samsung SSD PM871 MZNLN256HCHP
4213 Points +29%
HP ZBook 15u G3
6600U, 16384, Samsung SM951 MZVPV256HDGL m.2 PCI-e
3974 Points +22%
HP ZBook 15 G3
E3-1505M v5, 32768, Samsung SM951 MZVPV512HDGL m.2 PCI-e
3959 Points +21%
Dell Precision 5510
E3-1505M v5, 16384, SK hynix SC920 512 GB
3941 Points +21%
Apple MacBook Pro Retina 15 inch 2015-05
4870HQ, 16384, Apple SSD SM0512G
3821 Points +17%
HP ZBook Studio G3
6820HQ, 16384, Samsung SM951 MZVPV512HDGL m.2 PCI-e
3262 Points
MSI WS60-6QJE316H11
E3-1505M v5, 16384, Toshiba NVMe THNSN5128GP
3134 Points -4%
Lenovo ThinkPad P50s-20FKS00400
6500U, 8192, Samsung PM871 MZYLN256HCHP
2790 Points -14%
PCMark 7 - Score
HP ZBook 15 G3
E3-1505M v5, 32768, Samsung SM951 MZVPV512HDGL m.2 PCI-e
5521 Points +3%
HP ZBook 15u G3
6600U, 16384, Samsung SM951 MZVPV256HDGL m.2 PCI-e
5493 Points +3%
Apple MacBook Pro Retina 15 inch 2015-05
4870HQ, 16384, Apple SSD SM0512G
5480 Points +3%
MSI WS60-6QJE316H11
E3-1505M v5, 16384, Toshiba NVMe THNSN5128GP
5340 Points 0%
HP ZBook Studio G3
6820HQ, 16384, Samsung SM951 MZVPV512HDGL m.2 PCI-e
5336 Points
Dell Precision 5510
E3-1505M v5, 16384, SK hynix SC920 512 GB
5317 Points 0%
Lenovo ThinkPad P50s-20FKS00400
6500U, 8192, Samsung PM871 MZYLN256HCHP
4992 Points -6%
Lenovo ThinkPad P50
6820HQ, 8192, Samsung SSD PM871 MZNLN256HCHP
4892 Points -8%
PCMark 7 Score
5336 pontok
PCMark 8 Home Score Accelerated v2
3262 pontok
PCMark 8 Creative Score Accelerated v2
4235 pontok
PCMark 8 Work Score Accelerated v2
4301 pontok
Segítség
Samsung SM951 MZVPV512HDGL m.2 PCI-e
Sequential Read: 1578 MB/s
Sequential Write: 1557 MB/s
512K Read: 1234 MB/s
512K Write: 1391 MB/s
4K Read: 59.9 MB/s
4K Write: 225.6 MB/s
4K QD32 Read: 946 MB/s
4K QD32 Write: 359 MB/s
SPECviewperf 12
1900x1060 Solidworks (sw-03)
Lenovo ThinkPad P50
NVIDIA Quadro M2000M
71.7 fps +26%
HP ZBook 15 G3
NVIDIA Quadro M2000M
66 fps +16%
MSI WS60-6QJE316H11
NVIDIA Quadro M2000M
63 fps +11%
Dell Precision 5510
NVIDIA Quadro M1000M
62 fps +9%
HP ZBook Studio G3
NVIDIA Quadro M1000M
56.7 fps
Apple MacBook Pro Retina 15 inch 2015-05
AMD Radeon R9 M370X
38.02 fps -33%
Lenovo ThinkPad P50s-20FKS00400
NVIDIA Quadro M500M
37.22 fps -34%
HP ZBook 15u G3
AMD FirePro W4190M
31.41 fps -45%
1900x1060 Siemens NX (snx-02)
HP ZBook 15 G3
NVIDIA Quadro M2000M
35.87 fps +15%
Lenovo ThinkPad P50
NVIDIA Quadro M2000M
33.95 fps +9%
MSI WS60-6QJE316H11
NVIDIA Quadro M2000M
32.52 fps +4%
HP ZBook Studio G3
NVIDIA Quadro M1000M
31.13 fps
Dell Precision 5510
NVIDIA Quadro M1000M
31 fps 0%
HP ZBook 15u G3
AMD FirePro W4190M
19.89 fps -36%
Lenovo ThinkPad P50s-20FKS00400
NVIDIA Quadro M500M
19.13 fps -39%
Apple MacBook Pro Retina 15 inch 2015-05
AMD Radeon R9 M370X
10.24 fps -67%
1900x1060 Showcase (showcase-01)
MSI WS60-6QJE316H11
NVIDIA Quadro M2000M
24.25 fps +17%
HP ZBook 15 G3
NVIDIA Quadro M2000M
23.86 fps +15%
Lenovo ThinkPad P50
NVIDIA Quadro M2000M
21.35 fps +3%
HP ZBook Studio G3
NVIDIA Quadro M1000M
20.72 fps
Dell Precision 5510
NVIDIA Quadro M1000M
20 fps -3%
Apple MacBook Pro Retina 15 inch 2015-05
AMD Radeon R9 M370X
15.31 fps -26%
Lenovo ThinkPad P50s-20FKS00400
NVIDIA Quadro M500M
6.08 fps -71%
HP ZBook 15u G3
AMD FirePro W4190M
4.98 fps -76%
1900x1060 Medical (medical-01)
HP ZBook 15 G3
NVIDIA Quadro M2000M
15.03 fps +25%
Lenovo ThinkPad P50
NVIDIA Quadro M2000M
14.68 fps +22%
MSI WS60-6QJE316H11
NVIDIA Quadro M2000M
14.4 fps +19%
HP ZBook Studio G3
NVIDIA Quadro M1000M
12.06 fps
Dell Precision 5510
NVIDIA Quadro M1000M
12 fps 0%
Lenovo ThinkPad P50s-20FKS00400
NVIDIA Quadro M500M
9.51 fps -21%
Apple MacBook Pro Retina 15 inch 2015-05
AMD Radeon R9 M370X
7.5 fps -38%
HP ZBook 15u G3
AMD FirePro W4190M
6.09 fps -50%
1900x1060 Maya (maya-04)
Lenovo ThinkPad P50
NVIDIA Quadro M2000M
38.46 fps +23%
HP ZBook 15 G3
NVIDIA Quadro M2000M
35.94 fps +15%
HP ZBook Studio G3
NVIDIA Quadro M1000M
31.27 fps
Dell Precision 5510
NVIDIA Quadro M1000M
30 fps -4%
MSI WS60-6QJE316H11
NVIDIA Quadro M2000M
29.89 fps -4%
Apple MacBook Pro Retina 15 inch 2015-05
AMD Radeon R9 M370X
25.1 fps -20%
HP ZBook 15u G3
AMD FirePro W4190M
16.38 fps -48%
Lenovo ThinkPad P50s-20FKS00400
NVIDIA Quadro M500M
11.14 fps -64%
1900x1060 Energy (energy-01)
HP ZBook 15 G3
NVIDIA Quadro M2000M
3.29 fps +21%
Lenovo ThinkPad P50
NVIDIA Quadro M2000M
3.2 fps +18%
MSI WS60-6QJE316H11
NVIDIA Quadro M2000M
3.16 fps +16%
HP ZBook Studio G3
NVIDIA Quadro M1000M
2.72 fps
Dell Precision 5510
NVIDIA Quadro M1000M
0.69 fps -75%
Lenovo ThinkPad P50s-20FKS00400
NVIDIA Quadro M500M
0.53 fps -81%
HP ZBook 15u G3
AMD FirePro W4190M
0.41 fps -85%
Apple MacBook Pro Retina 15 inch 2015-05
AMD Radeon R9 M370X
0.37 fps -86%
1900x1060 Creo (creo-01)
HP ZBook 15 G3
NVIDIA Quadro M2000M
40.61 fps +20%
Lenovo ThinkPad P50
NVIDIA Quadro M2000M
38.95 fps +15%
MSI WS60-6QJE316H11
NVIDIA Quadro M2000M
37.48 fps +11%
Dell Precision 5510
NVIDIA Quadro M1000M
34 fps +1%
HP ZBook Studio G3
NVIDIA Quadro M1000M
33.8 fps
Lenovo ThinkPad P50s-20FKS00400
NVIDIA Quadro M500M
20.62 fps -39%
Apple MacBook Pro Retina 15 inch 2015-05
AMD Radeon R9 M370X
20.07 fps -41%
HP ZBook 15u G3
AMD FirePro W4190M
16.87 fps -50%
1900x1060 Catia (catia-04)
HP ZBook 15 G3
NVIDIA Quadro M2000M
47.08 fps +24%
Lenovo ThinkPad P50
NVIDIA Quadro M2000M
46.26 fps +22%
MSI WS60-6QJE316H11
NVIDIA Quadro M2000M
44.29 fps +17%
HP ZBook Studio G3
NVIDIA Quadro M1000M
37.89 fps
Dell Precision 5510
NVIDIA Quadro M1000M
37 fps -2%
Apple MacBook Pro Retina 15 inch 2015-05
AMD Radeon R9 M370X
23.89 fps -37%
Lenovo ThinkPad P50s-20FKS00400
NVIDIA Quadro M500M
21.42 fps -43%
HP ZBook 15u G3
AMD FirePro W4190M
18.62 fps -51%
SPECviewperf 11
1920x1080 Siemens NX
Lenovo ThinkPad P50
NVIDIA Quadro M2000M
43.31 fps +6%
HP ZBook 15 G3
NVIDIA Quadro M2000M
43.17 fps +6%
MSI WS60-6QJE316H11
NVIDIA Quadro M2000M
42.14 fps +3%
Dell Precision 5510
NVIDIA Quadro M1000M
41 fps 0%
HP ZBook Studio G3
NVIDIA Quadro M1000M
40.87 fps
Lenovo ThinkPad P50s-20FKS00400
NVIDIA Quadro M500M
29.41 fps -28%
1920x1080 Tcvis
HP ZBook 15 G3
NVIDIA Quadro M2000M
44.89 fps +4%
Lenovo ThinkPad P50
NVIDIA Quadro M2000M
43.93 fps +1%
HP ZBook Studio G3
NVIDIA Quadro M1000M
43.34 fps
MSI WS60-6QJE316H11
NVIDIA Quadro M2000M
42.91 fps -1%
Dell Precision 5510
NVIDIA Quadro M1000M
40 fps -8%
Lenovo ThinkPad P50s-20FKS00400
NVIDIA Quadro M500M
35.63 fps -18%
1920x1080 SolidWorks
Dell Precision 5510
NVIDIA Quadro M1000M
51 fps +10%
HP ZBook 15 G3
NVIDIA Quadro M2000M
48.13 fps +4%
MSI WS60-6QJE316H11
NVIDIA Quadro M2000M
47.71 fps +3%
Lenovo ThinkPad P50
NVIDIA Quadro M2000M
46.69 fps +1%
HP ZBook Studio G3
NVIDIA Quadro M1000M
46.32 fps
Lenovo ThinkPad P50s-20FKS00400
NVIDIA Quadro M500M
39.63 fps -14%
1920x1080 Pro/ENGINEER
HP ZBook 15 G3
NVIDIA Quadro M2000M
21.57 fps +7%
Dell Precision 5510
NVIDIA Quadro M1000M
21 fps +4%
HP ZBook Studio G3
NVIDIA Quadro M1000M
20.22 fps
Lenovo ThinkPad P50
NVIDIA Quadro M2000M
17.54 fps -13%
MSI WS60-6QJE316H11
NVIDIA Quadro M2000M
17.4 fps -14%
Lenovo ThinkPad P50s-20FKS00400
NVIDIA Quadro M500M
14.87 fps -26%
1920x1080 Maya
MSI WS60-6QJE316H11
NVIDIA Quadro M2000M
58.3 fps +4%
HP ZBook 15 G3
NVIDIA Quadro M2000M
57.7 fps +3%
Lenovo ThinkPad P50
NVIDIA Quadro M2000M
56.9 fps +1%
HP ZBook Studio G3
NVIDIA Quadro M1000M
56.2 fps
Dell Precision 5510
NVIDIA Quadro M1000M
56 fps 0%
Lenovo ThinkPad P50s-20FKS00400
NVIDIA Quadro M500M
46.88 fps -17%
1920x1080 Lightwave
Dell Precision 5510
NVIDIA Quadro M1000M
54 fps +6%
MSI WS60-6QJE316H11
NVIDIA Quadro M2000M
52.5 fps +3%
HP ZBook 15 G3
NVIDIA Quadro M2000M
52 fps +2%
HP ZBook Studio G3
NVIDIA Quadro M1000M
50.9 fps
Lenovo ThinkPad P50
NVIDIA Quadro M2000M
48.27 fps -5%
Lenovo ThinkPad P50s-20FKS00400
NVIDIA Quadro M500M
46.9 fps -8%
1920x1080 Ensight
HP ZBook 15 G3
NVIDIA Quadro M2000M
46.68 fps +16%
Lenovo ThinkPad P50
NVIDIA Quadro M2000M
46.43 fps +16%
MSI WS60-6QJE316H11
NVIDIA Quadro M2000M
43.49 fps +8%
HP ZBook Studio G3
NVIDIA Quadro M1000M
40.12 fps
Dell Precision 5510
NVIDIA Quadro M1000M
39 fps -3%
Lenovo ThinkPad P50s-20FKS00400
NVIDIA Quadro M500M
20.44 fps -49%
1920x1080 Catia
Dell Precision 5510
NVIDIA Quadro M1000M
54 fps +2%
Lenovo ThinkPad P50
NVIDIA Quadro M2000M
53.5 fps +1%
HP ZBook 15 G3
NVIDIA Quadro M2000M
53.5 fps +1%
HP ZBook Studio G3
NVIDIA Quadro M1000M
53.1 fps
MSI WS60-6QJE316H11
NVIDIA Quadro M2000M
48.98 fps -8%
Lenovo ThinkPad P50s-20FKS00400
NVIDIA Quadro M500M
38.08 fps -28%
LuxMark v2.0 64Bit
Room GPUs-only
HP ZBook 15 G3
NVIDIA Quadro M2000M
930 Samples/s +12%
MSI WS60-6QJE316H11
NVIDIA Quadro M2000M
903 Samples/s +9%
HP ZBook Studio G3
NVIDIA Quadro M1000M
830 Samples/s
Lenovo ThinkPad P50
NVIDIA Quadro M2000M
791 Samples/s -5%
Dell Precision 5510
NVIDIA Quadro M1000M
534 Samples/s -36%
Apple MacBook Pro Retina 15 inch 2015-05
AMD Radeon R9 M370X
379 Samples/s -54%
Lenovo ThinkPad P50s-20FKS00400
NVIDIA Quadro M500M
378 Samples/s -54%
Sala GPUs-only
HP ZBook 15 G3
NVIDIA Quadro M2000M
1556 Samples/s +6%
HP ZBook Studio G3
NVIDIA Quadro M1000M
1470 Samples/s
MSI WS60-6QJE316H11
NVIDIA Quadro M2000M
1434 Samples/s -2%
Lenovo ThinkPad P50
NVIDIA Quadro M2000M
1426 Samples/s -3%
HP ZBook 15u G3
AMD FirePro W4190M
1034 Samples/s -30%
Lenovo ThinkPad P50s-20FKS00400
NVIDIA Quadro M500M
945 Samples/s -36%
Dell Precision 5510
NVIDIA Quadro M1000M
889 Samples/s -40%
Apple MacBook Pro Retina 15 inch 2015-05
AMD Radeon R9 M370X
659 Samples/s -55%
SiSoft Sandra 2016
Image Processing
HP ZBook 15 G3
NVIDIA Quadro M2000M
228.6 MPix/s +18%
HP ZBook Studio G3
NVIDIA Quadro M1000M
194.4 MPix/s
MSI WS60-6QJE316H11
NVIDIA Quadro M2000M
155.8 MPix/s -20%
Lenovo ThinkPad P50
NVIDIA Quadro M2000M
155.7 MPix/s -20%
Dell Precision 5510
NVIDIA Quadro M1000M
127.5 MPix/s -34%
Lenovo ThinkPad P50s-20FKS00400
NVIDIA Quadro M500M
99.5 MPix/s -49%
GP Cryptography (Higher Security AES256+SHA2-512)
Lenovo ThinkPad P50
NVIDIA Quadro M2000M
12.28 GB/s +58%
HP ZBook 15 G3
NVIDIA Quadro M2000M
9.82 GB/s +26%
MSI WS60-6QJE316H11
NVIDIA Quadro M2000M
9.28 GB/s +19%
HP ZBook Studio G3
NVIDIA Quadro M1000M
7.77 GB/s
Dell Precision 5510
NVIDIA Quadro M1000M
7.38 GB/s -5%
Lenovo ThinkPad P50s-20FKS00400
NVIDIA Quadro M500M
5.37 GB/s -31%
GP Financial Analysis (FP High/Double Precision)
HP ZBook 15 G3
NVIDIA Quadro M2000M
21.8 KOPT/s +28%
Lenovo ThinkPad P50
NVIDIA Quadro M2000M
21.75 KOPT/s +28%
MSI WS60-6QJE316H11
NVIDIA Quadro M2000M
21.63 KOPT/s +27%
Dell Precision 5510
NVIDIA Quadro M1000M
17 KOPT/s 0%
HP ZBook Studio G3
NVIDIA Quadro M1000M
17 KOPT/s
Lenovo ThinkPad P50s-20FKS00400
NVIDIA Quadro M500M
12.82 KOPT/s -25%
Unigine Heaven 3.0
1920x1080 DX 11, Normal Tessellation, High Shaders AA:Off AF:Off
MSI WS60-6QJE316H11
NVIDIA Quadro M2000M
53.4 fps +19%
Lenovo ThinkPad P50
NVIDIA Quadro M2000M
52.5 fps +17%
HP ZBook 15 G3
NVIDIA Quadro M2000M
51.8 fps +15%
Dell Precision 5510
NVIDIA Quadro M1000M
44.9 fps 0%
HP ZBook Studio G3
NVIDIA Quadro M1000M
44.9 fps
Lenovo ThinkPad P50s-20FKS00400
NVIDIA Quadro M500M
21 fps -53%
1920x1080 OpenGL, Normal Tessellation, High Shaders AA:Off AF:Off
HP ZBook 15 G3
NVIDIA Quadro M2000M
51.6 fps +18%
HP ZBook Studio G3
NVIDIA Quadro M1000M
43.8 fps
Dell Precision 5510
NVIDIA Quadro M1000M
43.4 fps -1%
MSI WS60-6QJE316H11
NVIDIA Quadro M2000M
33.9 fps -23%
Lenovo ThinkPad P50
NVIDIA Quadro M2000M
32.4 fps -26%
Lenovo ThinkPad P50s-20FKS00400
NVIDIA Quadro M500M
20 fps -54%
Unigine Valley 1.0
1920x1080 Extreme HD DirectX AA:x8
Lenovo ThinkPad P50
NVIDIA Quadro M2000M
20.4 fps +8%
HP ZBook 15 G3
NVIDIA Quadro M2000M
20.4 fps +8%
MSI WS60-6QJE316H11
NVIDIA Quadro M2000M
20.3 fps +7%
HP ZBook Studio G3
NVIDIA Quadro M1000M
18.9 fps
Dell Precision 5510
NVIDIA Quadro M1000M
18.7 fps -1%
Lenovo ThinkPad P50s-20FKS00400
NVIDIA Quadro M500M
6.5 fps -66%
1920x1080 Extreme HD Preset OpenGL AA:x8
HP ZBook 15 G3
NVIDIA Quadro M2000M
18.3 fps +12%
HP ZBook Studio G3
NVIDIA Quadro M1000M
16.4 fps
Dell Precision 5510
NVIDIA Quadro M1000M
16.2 fps -1%
MSI WS60-6QJE316H11
NVIDIA Quadro M2000M
13.8 fps -16%
Lenovo ThinkPad P50
NVIDIA Quadro M2000M
13.2 fps -20%
Lenovo ThinkPad P50s-20FKS00400
NVIDIA Quadro M500M
6.8 fps -59%
3DMark
1920x1080 Fire Strike Score
Asus G501VW-FY081T
NVIDIA GeForce GTX 960M
4028 Points +22%
MSI WS60-6QJE316H11
NVIDIA Quadro M2000M
3952 Points +20%
HP ZBook 15 G3
NVIDIA Quadro M2000M
3820 Points +16%
Lenovo ThinkPad P50
NVIDIA Quadro M2000M
3813 Points +15%
Dell Precision 5510
NVIDIA Quadro M1000M
3344 Points +1%
HP ZBook Studio G3
NVIDIA Quadro M1000M
3302 Points
Asus N752VX-GC131T
NVIDIA GeForce GTX 950M
2866 Points -13%
Apple MacBook Pro Retina 15 inch 2015-05
AMD Radeon R9 M370X
2350 Points -29%
HP ZBook 15u G3
AMD FirePro W4190M
1517 Points -54%
Lenovo ThinkPad P50s-20FKS00400
NVIDIA Quadro M500M
1432 Points -57%
1920x1080 Fire Strike Graphics
Asus G501VW-FY081T
NVIDIA GeForce GTX 960M
4348 Points +25%
MSI WS60-6QJE316H11
NVIDIA Quadro M2000M
4243 Points +22%
Lenovo ThinkPad P50
NVIDIA Quadro M2000M
4126 Points +19%
HP ZBook 15 G3
NVIDIA Quadro M2000M
4091 Points +18%
Dell Precision 5510
NVIDIA Quadro M1000M
3517 Points +1%
HP ZBook Studio G3
NVIDIA Quadro M1000M
3478 Points
Asus N752VX-GC131T
NVIDIA GeForce GTX 950M
3174 Points -9%
Apple MacBook Pro Retina 15 inch 2015-05
AMD Radeon R9 M370X
2501 Points -28%
Lenovo ThinkPad P50s-20FKS00400
NVIDIA Quadro M500M
1610 Points -54%
HP ZBook 15u G3
AMD FirePro W4190M
1588 Points -54%
3DMark 06 Standard Score
24393 pontok
3DMark 11 Performance
4673 pontok
3DMark Ice Storm Standard Score
42096 pontok
3DMark Cloud Gate Standard Score
15717 pontok
3DMark Fire Strike Score
3302 pontok
Segítség
alacsony közepes magas ultra4K
BioShock Infinite (2013) 176.7 115 100.1 37
The Witcher 3 (2015) 59.4 36.5 20.8 10.8 7.7
Rainbow Six Siege (2015) 137.8 79.9 43.5 32 13.2

Zajszint

Üresjárat
30 / 30 / 30 dB(A)
Terhelés
51 / 52.8 dB(A)
  red to green bar
 
 
30 dB
csendes
40 dB(A)
hallható
50 dB(A)
hangos
 
min: dark, med: mid, max: light   Audix TM1 Arta (15 cm távolságról)   környezeti zaj: 30 dB(A)
HP ZBook Studio G3
6820HQ, Quadro M1000M
Dell Precision 5510
E3-1505M v5, Quadro M1000M
MSI WS60-6QJE316H11
E3-1505M v5, Quadro M2000M
Lenovo ThinkPad P50
6820HQ, Quadro M2000M
Lenovo ThinkPad P50s-20FKS00400
6500U, Quadro M500M
HP ZBook 15 G3
E3-1505M v5, Quadro M2000M
HP ZBook 15u G3
6600U, FirePro W4190M
Apple MacBook Pro Retina 15 inch 2015-05
4870HQ, Radeon R9 M370X
Noise
6%
-10%
10%
11%
3%
9%
7%
off / környezet *
30
30
-0%
Idle Minimum *
30
30
-0%
37.2
-24%
30
-0%
30
-0%
30
-0%
29.8
1%
28.9
4%
Idle Average *
30
30
-0%
37.2
-24%
30
-0%
30
-0%
30
-0%
29.8
1%
28.9
4%
Idle Maximum *
30
30
-0%
37.2
-24%
30
-0%
30
-0%
30
-0%
29.8
1%
28.9
4%
Load Average *
51
42.08
17%
42.1
17%
34.5
32%
33.5
34%
45.3
11%
39.5
23%
46
10%
Load Maximum *
52.8
46.78
11%
50.7
4%
42.1
20%
41.9
21%
49.7
6%
43.2
18%
46
13%

* ... a kisebb jobb

Max. terhelés
 55.2 °C69.8 °C56.1 °C 
 39.7 °C47.9 °C39 °C 
 37.4 °C38 °C37.6 °C 
Maximum: 69.8 °C
Átlag: 46.7 °C
46 °C77.3 °C37.7 °C
43.4 °C70.7 °C36.2 °C
37.2 °C39 °C35.3 °C
Maximum: 77.3 °C
Átlag: 47 °C
Tápegység (max.)  55.5 °C | Szobahőmérséklet 21 °C | Fennel FIRT 550-Pocket
(-) The average temperature for the upper side under maximal load is 46.7 °C / 116 F, compared to the average of 32 °C / 90 F for the devices in the class Workstation.
(-) The maximum temperature on the upper side is 69.8 °C / 158 F, compared to the average of 38.1 °C / 101 F, ranging from 22.2 to 69.8 °C for the class Workstation.
(-) The bottom heats up to a maximum of 77.3 °C / 171 F, compared to the average of 41.3 °C / 106 F
(+) In idle usage, the average temperature for the upper side is 30.1 °C / 86 F, compared to the device average of 32 °C / 90 F.
(±) The palmrests and touchpad can get very hot to the touch with a maximum of 38 °C / 100.4 F.
(-) The average temperature of the palmrest area of similar devices was 27.8 °C / 82 F (-10.2 °C / -18.4 F).
HP ZBook Studio G3
6820HQ, Quadro M1000M
Dell Precision 5510
E3-1505M v5, Quadro M1000M
MSI WS60-6QJE316H11
E3-1505M v5, Quadro M2000M
Lenovo ThinkPad P50
6820HQ, Quadro M2000M
Lenovo ThinkPad P50s-20FKS00400
6500U, Quadro M500M
HP ZBook 15 G3
E3-1505M v5, Quadro M2000M
HP ZBook 15u G3
6600U, FirePro W4190M
Apple MacBook Pro Retina 15 inch 2015-05
4870HQ, Radeon R9 M370X
Heat
22%
17%
24%
26%
16%
30%
29%
Maximum Upper Side *
69.8
45.8
34%
42.3
39%
36.7
47%
44.2
37%
54.6
22%
44.6
36%
43.2
38%
Maximum Bottom *
77.3
46.7
40%
60.1
22%
41.3
47%
57.8
25%
60.8
21%
46
40%
39
50%
Idle Upper Side *
37.8
31.2
17%
32.7
13%
31.1
18%
26.4
30%
30.3
20%
25.8
32%
30
21%
Idle Bottom *
31.4
31.9
-2%
33.1
-5%
36.2
-15%
28.1
11%
30.7
2%
27.4
13%
29.3
7%

* ... a kisebb jobb

Energiafogyasztás
Kikapcsolt állapot / Készenlétdarklight 0.2 / 0.5 Watt
Üresjáratdarkmidlight 8.7 / 14.2 / 14.4 Watt
Terhelés midlight 85.6 / 129.7 Watt
 color bar
Kulcs: min: dark, med: mid, max: light        Metrahit Energy
Jelenleg a mérésekhez a Metrahit Energy-t, egy professzionális egyfázisú áramminőség- és energiamérő digitális multimétert használjuk. Tudjon meg többet róla here. All of our test methods can be found here.
HP ZBook Studio G3
64 Wh, 3840x2160
Dell Precision 5510
56 Wh, 3840x2160
MSI WS60-6QJE316H11
47 Wh, 3840x2160
Lenovo ThinkPad P50
90 Wh, 1920x1080
Lenovo ThinkPad P50s-20FKS00400
67 Wh, 2880x1620
HP ZBook 15 G3
90 Wh, 1920x1080
HP ZBook 15u G3
90 Wh, 1920x1080
Apple MacBook Pro Retina 15 inch 2015-05
100 Wh, 2880x1800
Power Consumption
-5%
-71%
25%
43%
11%
42%
16%
Idle Minimum *
8.7
8.6
1%
18.8
-116%
5.6
36%
4.3
51%
5.7
34%
4.3
51%
6
31%
Idle Average *
14.2
16.2
-14%
29.6
-108%
8.6
39%
9.7
32%
12.2
14%
7.9
44%
12.8
10%
Idle Maximum *
14.4
16.7
-16%
30.3
-110%
9.3
35%
10.2
29%
12.6
12%
11.5
20%
13.3
8%
Load Average *
85.6
82.6
4%
90.4
-6%
89.5
-5%
45.7
47%
83.1
3%
43.3
49%
82.4
4%
Load Maximum *
129.7
131.8
-2%
150.2
-16%
105
19%
55.8
57%
138.2
-7%
72.3
44%
91.8
29%

* ... a kisebb jobb

Akkumulátor üzemidő
Üresjárat (WLAN nélkül, minimális fényerő)
8h 31min
WiFi Websurfing
3h 28min
Big Buck Bunny H.264 1080p
3h 48min
Terhelés (maximális fényerő)
1h 05min
HP ZBook Studio G3
64 Wh
Dell Precision 5510
56 Wh
MSI WS60-6QJE316H11
47 Wh
Lenovo ThinkPad P50
90 Wh
Lenovo ThinkPad P50s-20FKS00400
67 Wh
HP ZBook 15 G3
90 Wh
HP ZBook 15u G3
90 Wh
Apple MacBook Pro Retina 15 inch 2015-05
100 Wh
Akkumulátor üzemidő
19%
-45%
104%
112%
78%
72%
89%
Reader / Idle
511
428
-16%
160
-69%
860
68%
1107
117%
822
61%
756
48%
1039
103%
H.264
228
197
-14%
141
-38%
533
134%
537
136%
449
97%
413
81%
WiFi v1.3
208
286
38%
106
-49%
498
139%
408
96%
386
86%
312
50%
432
108%
Load
65
109
68%
51
-22%
113
74%
129
98%
110
69%
141
117%
105
62%
WiFi
298

Pro

+ kiváló ház
+ modern portok
+ nagyon jó UHD-IPS kijelző
+ jó beviteli eszközök
+ nagy teljesítmény, terhelés alatt is

Kontra

- zavarba ejtően magas hőmérsékletek (felületi és belső)
- hangos és pulzáló ventilátor
- övid akkus üzemidő
- nincs SmartCard olvasó
- nincs WWAN
- drága
In review: HP ZBook Studio G3. Test model courtesy of HP Germany.

A ZBook Studio G3 egy rejtély számunkra. A HP-nek sikerült több szempontból egy remek eszközt összehoznia, más pontokon viszont kiábrándítóan rosszul teljesít a munkaállomás. Sajnos az összbenyomásunk a gépet illetően negatív. Ez főleg a zaj- és hőmérséklet kibocsátásoknak és az akkus üzemidőnek köszönhető. A felület veszélyesen magas hőmérsékleteket ér el, ami akár égési sérüléseket is okozhat, akár normális terhelés mellett is. A ventilátorok szabályozása is meglehetősen idegesítő. Mivel külön üzemelnek, ezért elég gyakran képesek pulzáló viselkedést produkálni. A praktikusan négy óra alatti üzemidőt is nehéz megmagyarázni, tekintve az eszköz egyébként elég mobilis. Ezektől eltekintve csak apróbb hiányosságokban szenved, mint a SmartCard olvasó vagy a WWAN modul hiánya.

A ZBook Studio egy ambíciózus projekt. Nagy teljesítményt kapunk egy kompakt csomagban, de cserébe extrém hőmérsékleteket és idegesítő ventilátor zajt kapunk. Ennek nem volna szabad megtörténnie 3800 eurós végfelhasználói ár mellett.

A ZBook Studio tulajdonképpen több szempontból meggyőző: nagy teljesítményt kapunk egy remek házban egy kiváló 4K kijelző és kiváló beviteli eszközök társaságában. Persze továbbra is ott van az elrettentően magas 3800 eurós ár, amit nehéz a korábban említett problémák fényében megmagyarázni. A BIOS frissítések sem javítottak a helyzeten; reméljük hogy a HP legalább az idegesítő ventilátor viselkedést orvosolja. Egyelőre a nagyobb munkaállomásoknak kibocsátásokban is van előnye, és még erősebb hardverrel is szerelhetők.

Ez egy kivonatolt változata az eredeti tesznek. A hosszabb, angol nyelvű változat itt tekinthető meg.

HP ZBook Studio G3 - 05/19/2016 v5.1(old)
Andreas Osthoff
Váz
92 / 98 → 94%
Billentyűzet
88%
Érintőpad
91%
Csatlakoztathatóság
80 / 81 → 98%
Súly
62 / 10-66 → 93%
Akkumulátor
72%
Kijelző
86%
Játékok alatti teljesítmény
77%
Alkalmazások alatti teljesítmény
87%
Hőmérséklet
35 / 95 → 37%
Zaj
68 / 90 → 76%
Audio
70%
Camera
42 / 85 → 49%
Átlag
72%
80%
Workstation - Súlyozott átlag

Pricecompare

Please share our article, every link counts!
> Magyarország - Kezdőlap > Tesztek / áttekintők > HP ZBook Studio G3 munkaállomás rövid értékelés
Andreas Osthoff, 2016-06-29 (Update: 2016-08- 1)