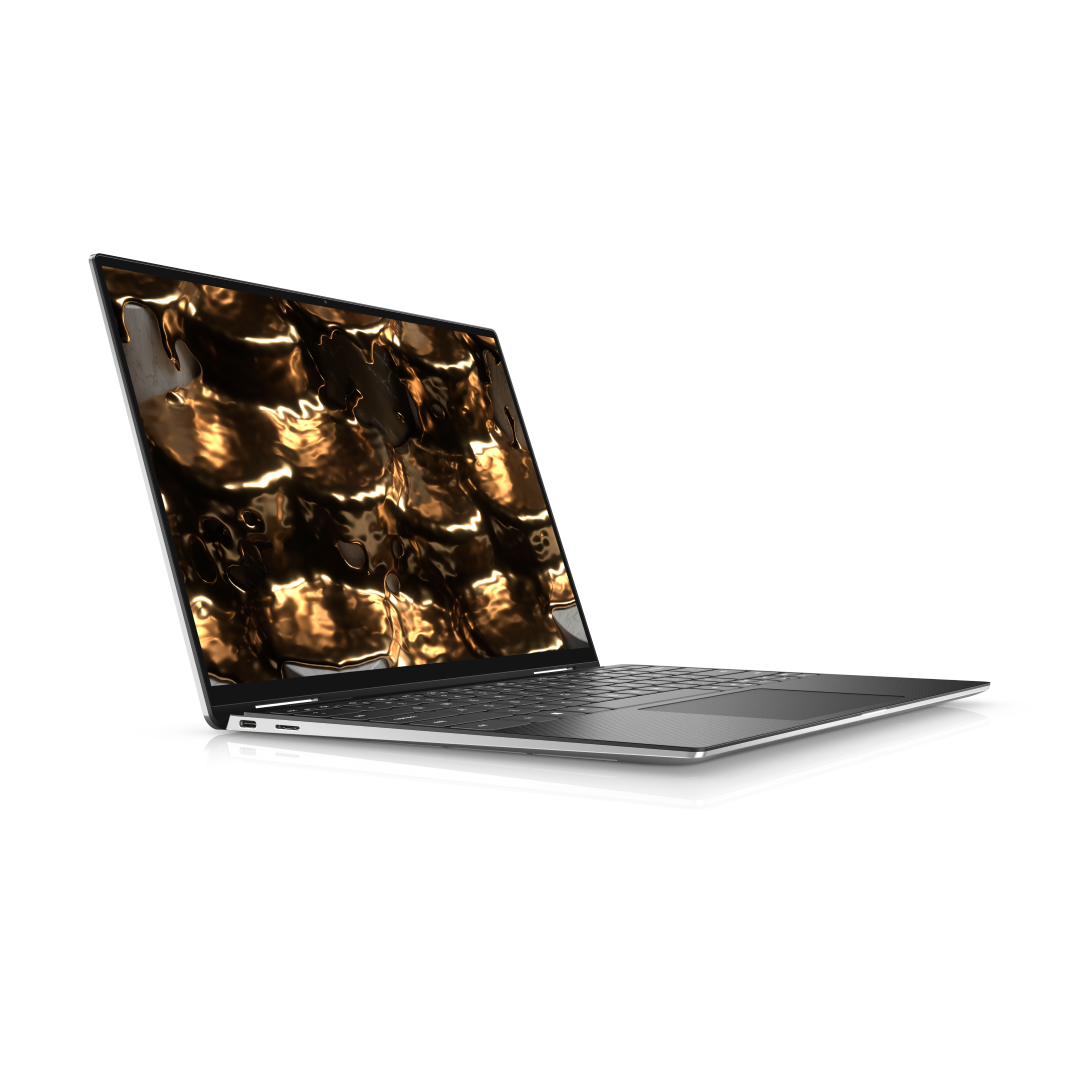
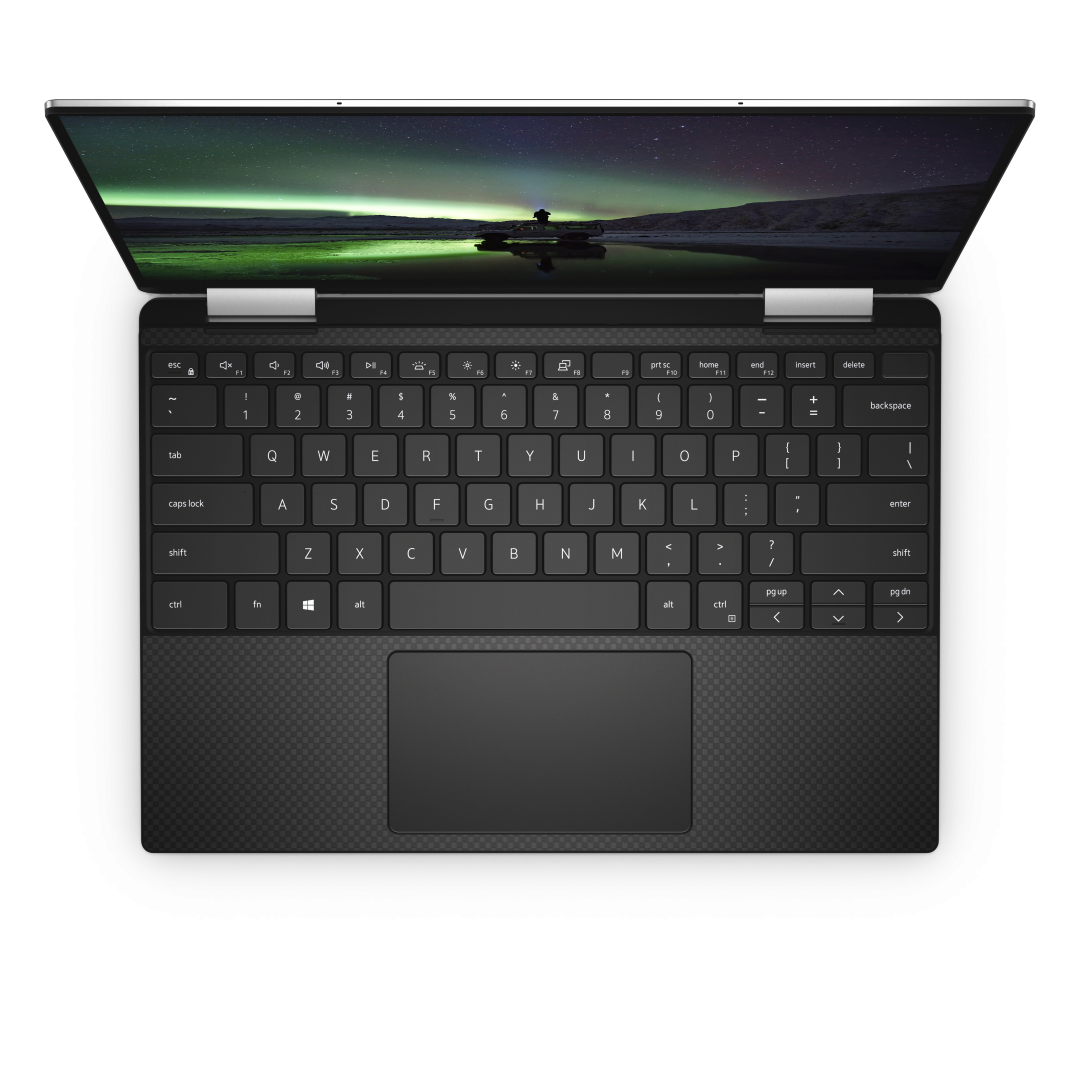
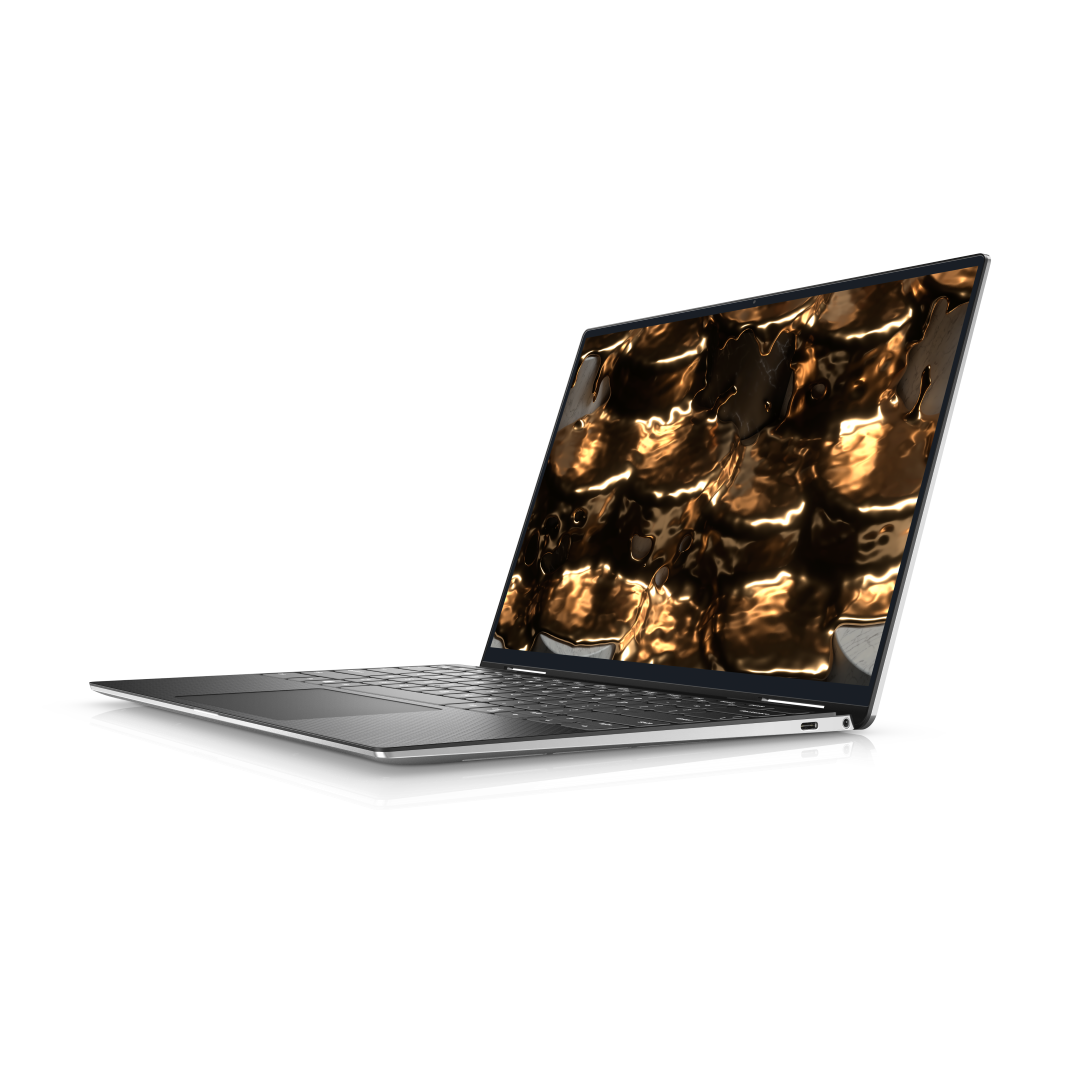
Dell XPS 13 9310 2 az 1-ben rövid értékelés: Egy dologban jobb, mint az XPS 13 7390 2 az 1-ben
potential competitors in comparison
Értékelés | Dátum | Modell | Súly | Magasság | Méret | Felbontás | Legjobb ár |
|---|---|---|---|---|---|---|---|
| 86.7 % v7 (old) | 11/2021 | Dell XPS 13 9310 2-in-1 i7-1165G7, Iris Xe G7 96EUs | 1.3 kg | 14.35 mm | 13.40" | 1920x1200 | |
| 88.1 % v7 (old) | 12/2020 | Dell XPS 13 9310 Core i7 FHD i7-1165G7, Iris Xe G7 96EUs | 1.3 kg | 14.8 mm | 13.40" | 1920x1200 | |
| 86.3 % v7 (old) | 12/2019 | Dell XPS 13 7390 2-in-1 Core i7 i7-1065G7, Iris Plus Graphics G7 (Ice Lake 64 EU) | 1.3 kg | 13 mm | 13.40" | 1920x1200 | |
| 84.7 % v7 (old) | 12/2021 | Lenovo Yoga 6 13 82ND0009US R5 5500U, Vega 7 | 1.3 kg | 18.2 mm | 13.30" | 1920x1080 | |
| 86.3 % v7 (old) | Asus ZenBook Flip 13 UX363EA-HP069T i7-1165G7, Iris Xe G7 96EUs | 1.2 kg | 13 mm | 13.30" | 1920x1080 | ||
| 85.4 % v7 (old) | 06/2021 | Samsung Galaxy Book Pro 360 13 i5-1135G7, Iris Xe G7 80EUs | 1.1 kg | 13 mm | 13.20" | 1920x1080 |


| SD Card Reader | |
| average JPG Copy Test (av. of 3 runs) | |
| Dell XPS 13 9310 Core i7 FHD (Toshiba Exceria Pro M501 64 GB UHS-II) | |
| Dell XPS 13 9310 2-in-1 (AV Pro V60) | |
| Dell XPS 13 7390 2-in-1 Core i7 (Toshiba Exceria Pro M501 64 GB UHS-II) | |
| Samsung Galaxy Book Pro 360 13 | |
| maximum AS SSD Seq Read Test (1GB) | |
| Dell XPS 13 9310 Core i7 FHD (Toshiba Exceria Pro M501 64 GB UHS-II) | |
| Dell XPS 13 9310 2-in-1 (AV Pro V60) | |
| Dell XPS 13 7390 2-in-1 Core i7 (Toshiba Exceria Pro M501 64 GB UHS-II) | |
| Samsung Galaxy Book Pro 360 13 | |
| Networking | |
| iperf3 transmit AX12 | |
| Asus ZenBook Flip 13 UX363EA-HP069T | |
| Dell XPS 13 9310 Core i7 FHD | |
| Samsung Galaxy Book Pro 360 13 | |
| Dell XPS 13 9310 2-in-1 | |
| Lenovo Yoga 6 13 82ND0009US | |
| iperf3 receive AX12 | |
| Dell XPS 13 9310 2-in-1 | |
| Dell XPS 13 9310 Core i7 FHD | |
| Asus ZenBook Flip 13 UX363EA-HP069T | |
| Samsung Galaxy Book Pro 360 13 | |
| Lenovo Yoga 6 13 82ND0009US | |


| |||||||||||||||||||||||||
Fényerő megoszlás: 90 %
Centrumban: 555.7 cd/m²
Kontraszt: 1588:1 (Fekete: 0.35 cd/m²)
ΔE ColorChecker Calman: 4.83 | ∀{0.5-29.43 Ø4.73}
calibrated: 0.76
ΔE Greyscale Calman: 6.1 | ∀{0.09-98 Ø4.97}
71.7% AdobeRGB 1998 (Argyll 3D)
99% sRGB (Argyll 3D)
69.7% Display P3 (Argyll 3D)
Gamma: 1.98
CCT: 6686 K
| Dell XPS 13 9310 2-in-1 Sharp LQ134N1, IPS, 13.4", 1920x1200 | Dell XPS 13 9310 Core i7 FHD Sharp LQ134N1, IPS, 13.4", 1920x1200 | Dell XPS 13 7390 2-in-1 Core i7 Sharp LQ134N1, IPS, 13.4", 1920x1200 | Lenovo Yoga 6 13 82ND0009US AU Optronics B133HAN05.F, IPS, 13.3", 1920x1080 | Asus ZenBook Flip 13 UX363EA-HP069T Samsung, SDC414A, OLED, 13.3", 1920x1080 | Samsung Galaxy Book Pro 360 13 AMOLED, 13.2", 1920x1080 | |
|---|---|---|---|---|---|---|
| Display | 1% | 0% | 0% | 26% | ||
| Display P3 Coverage (%) | 69.7 | 70.9 2% | 69.9 0% | 69.7 0% | 99.4 43% | |
| sRGB Coverage (%) | 99 | 99.1 0% | 99.2 0% | 99.2 0% | 100 1% | |
| AdobeRGB 1998 Coverage (%) | 71.7 | 72.9 2% | 71.5 0% | 71.4 0% | 96 34% | |
| Response Times | 12% | 21% | 23% | 96% | 96% | |
| Response Time Grey 50% / Grey 80% * (ms) | 55.6 ? | 52 ? 6% | 47.6 ? 14% | 46.8 ? 16% | 2 ? 96% | 2 ? 96% |
| Response Time Black / White * (ms) | 40.4 ? | 33.2 ? 18% | 29.2 ? 28% | 28.8 ? 29% | 2 ? 95% | 2 ? 95% |
| PWM Frequency (Hz) | 2500 ? | 2475 ? | 2500 ? | 60 | 60 ? | |
| Screen | -2% | 7% | -8% | -38% | 235% | |
| Brightness middle (cd/m²) | 555.7 | 543.3 -2% | 549.8 -1% | 291.5 -48% | 353 -36% | 287 -48% |
| Brightness (cd/m²) | 528 | 524 -1% | 520 -2% | 294 -44% | 359 -32% | 289 -45% |
| Brightness Distribution (%) | 90 | 92 2% | 86 -4% | 93 3% | 95 6% | 96 7% |
| Black Level * (cd/m²) | 0.35 | 0.38 -9% | 0.39 -11% | 0.19 46% | 0.1 71% | 0.01 97% |
| Contrast (:1) | 1588 | 1430 -10% | 1410 -11% | 1534 -3% | 3530 122% | 28700 1707% |
| Colorchecker dE 2000 * | 4.83 | 3.02 37% | 2.12 56% | 3.83 21% | 3.98 18% | 2.24 54% |
| Colorchecker dE 2000 max. * | 8.46 | 7.61 10% | 3.66 57% | 8.43 -0% | 53.07 -527% | 3.69 56% |
| Colorchecker dE 2000 calibrated * | 0.76 | 1.23 -62% | 1.37 -80% | 1.07 -41% | ||
| Greyscale dE 2000 * | 6.1 | 5 18% | 2.6 57% | 6.2 -2% | 1.41 77% | 2.73 55% |
| Gamma | 1.98 111% | 2.02 109% | 2.3 96% | 2.2 100% | 2.39 92% | 2.46 89% |
| CCT | 6686 97% | 6550 99% | 6884 94% | 6469 100% | 6346 102% | 6523 100% |
| Color Space (Percent of AdobeRGB 1998) (%) | 66.8 | 65.4 | ||||
| Color Space (Percent of sRGB) (%) | 99.6 | 99.7 | ||||
| Teljes átlag (program / beállítások) | 4% /
1% | 9% /
7% | 5% /
-2% | 29% /
-11% | 119% /
166% |
* ... a kisebb jobb
Megjelenítési válaszidők
| ↔ Válaszidő Fekete-fehér | ||
|---|---|---|
| 40.4 ms ... emelkedés és süllyedés ↘ kombinálva | ↗ 22 ms emelkedés | 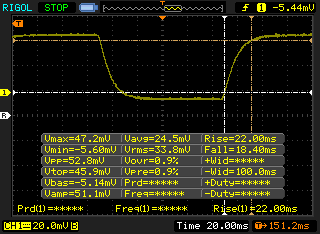 |
| ↘ 18.4 ms ősz | ||
| A képernyő lassú reakciósebességet mutat tesztjeinkben, és nem lesz kielégítő a játékosok számára. Összehasonlításképpen, az összes tesztelt eszköz 0.1 (minimum) és 240 (maximum) ms között mozog. » 97 % of all devices are better. Ez azt jelenti, hogy a mért válaszidő rosszabb, mint az összes vizsgált eszköz átlaga (19.9 ms). | ||
| ↔ Válaszidő 50% szürke és 80% szürke között | ||
| 55.6 ms ... emelkedés és süllyedés ↘ kombinálva | ↗ 27.6 ms emelkedés | 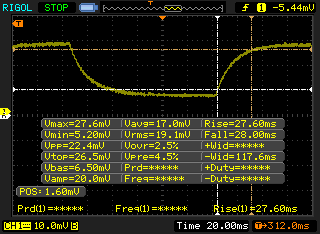 |
| ↘ 28 ms ősz | ||
| A képernyő lassú reakciósebességet mutat tesztjeinkben, és nem lesz kielégítő a játékosok számára. Összehasonlításképpen, az összes tesztelt eszköz 0.165 (minimum) és 636 (maximum) ms között mozog. » 92 % of all devices are better. Ez azt jelenti, hogy a mért válaszidő rosszabb, mint az összes vizsgált eszköz átlaga (31.1 ms). | ||
Képernyő villogása / PWM (impulzusszélesség-moduláció)
| Képernyő villogása / PWM észlelve | 2500 Hz | ≤ 25 % fényerő beállítása | 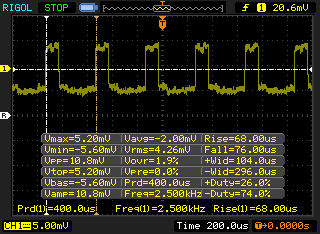 |
A kijelző háttérvilágítása 2500 Hz-en villog (a legrosszabb esetben, pl. PWM használatával) Villódzás észlelve a 25 % vagy annál kisebb fényerő-beállításnál. E fényerő-beállítás felett nem lehet villogás vagy PWM. A 2500 Hz frekvenciája meglehetősen magas, így a legtöbb PWM-re érzékeny felhasználó nem észlel semmilyen villogást. Összehasonlításképpen: az összes tesztelt eszköz 52 %-a nem használja a PWM-et a kijelző elsötétítésére. Ha PWM-et észleltek, akkor átlagosan 7784 (minimum: 5 - maximum: 343500) Hz-t mértek. | |||
Cinebench R15 Multi Loop
Cinebench R23: Multi Core | Single Core
Cinebench R15: CPU Multi 64Bit | CPU Single 64Bit
Blender: v2.79 BMW27 CPU
7-Zip 18.03: 7z b 4 -mmt1 | 7z b 4
Geekbench 5.5: Single-Core | Multi-Core
HWBOT x265 Benchmark v2.2: 4k Preset
LibreOffice : 20 Documents To PDF
R Benchmark 2.5: Overall mean
| Cinebench R20 / CPU (Multi Core) | |
| Lenovo Yoga Slim 7-14ARE | |
| Asus ZenBook 13 OLED UM325UA | |
| Lenovo Yoga 6 13 82ND0009US | |
| Dell XPS 13 7390 Core i7-10710U | |
| Átlagos Intel Core i7-1165G7 (1060 - 2657, n=81) | |
| Dell XPS 13 9310 OLED | |
| HP Spectre x360 13-aw2003dx | |
| Dell XPS 13 9310 2-in-1 | |
| Asus VivoBook S13 S333JA-DS51 | |
| Asus Zenbook S UX393JA | |
| HP Envy 13-ba0001ng | |
| HP Envy 13-aq0003ng | |
| Cinebench R20 / CPU (Single Core) | |
| Dell XPS 13 9310 OLED | |
| Átlagos Intel Core i7-1165G7 (442 - 589, n=81) | |
| HP Spectre x360 13-aw2003dx | |
| Asus ZenBook 13 OLED UM325UA | |
| Dell XPS 13 9310 2-in-1 | |
| Lenovo Yoga Slim 7-14ARE | |
| Dell XPS 13 7390 Core i7-10710U | |
| Lenovo Yoga 6 13 82ND0009US | |
| Asus Zenbook S UX393JA | |
| HP Envy 13-ba0001ng | |
| Asus VivoBook S13 S333JA-DS51 | |
| HP Envy 13-aq0003ng | |
| Cinebench R23 / Multi Core | |
| Lenovo Yoga Slim 7-14ARE | |
| Asus ZenBook 13 OLED UM325UA | |
| Lenovo Yoga 6 13 82ND0009US | |
| Átlagos Intel Core i7-1165G7 (2525 - 6862, n=64) | |
| Dell XPS 13 9310 OLED | |
| Dell XPS 13 9310 2-in-1 | |
| HP Spectre x360 13-aw2003dx | |
| Asus VivoBook S13 S333JA-DS51 | |
| Cinebench R23 / Single Core | |
| Dell XPS 13 9310 OLED | |
| Átlagos Intel Core i7-1165G7 (1110 - 1539, n=59) | |
| Dell XPS 13 9310 2-in-1 | |
| HP Spectre x360 13-aw2003dx | |
| Asus ZenBook 13 OLED UM325UA | |
| Lenovo Yoga Slim 7-14ARE | |
| Lenovo Yoga 6 13 82ND0009US | |
| Asus VivoBook S13 S333JA-DS51 | |
| Cinebench R15 / CPU Multi 64Bit | |
| Lenovo Yoga Slim 7-14ARE | |
| Asus ZenBook 13 OLED UM325UA | |
| Dell XPS 13 7390 Core i7-10710U | |
| Lenovo Yoga 6 13 82ND0009US | |
| Átlagos Intel Core i7-1165G7 (553 - 1027, n=86) | |
| HP Spectre x360 13-aw2003dx | |
| Dell XPS 13 9310 OLED | |
| Dell XPS 13 9310 2-in-1 | |
| Asus VivoBook S13 S333JA-DS51 | |
| Asus Zenbook S UX393JA | |
| HP Envy 13-ba0001ng | |
| HP Envy 13-aq0003ng | |
| Cinebench R15 / CPU Single 64Bit | |
| Dell XPS 13 9310 OLED | |
| Átlagos Intel Core i7-1165G7 (115 - 230, n=78) | |
| HP Spectre x360 13-aw2003dx | |
| Asus ZenBook 13 OLED UM325UA | |
| Lenovo Yoga Slim 7-14ARE | |
| Dell XPS 13 7390 Core i7-10710U | |
| Asus Zenbook S UX393JA | |
| HP Envy 13-ba0001ng | |
| Lenovo Yoga 6 13 82ND0009US | |
| HP Envy 13-aq0003ng | |
| Dell XPS 13 9310 2-in-1 | |
| Asus VivoBook S13 S333JA-DS51 | |
| Blender / v2.79 BMW27 CPU | |
| HP Envy 13-ba0001ng | |
| Asus Zenbook S UX393JA | |
| Asus VivoBook S13 S333JA-DS51 | |
| Dell XPS 13 9310 2-in-1 | |
| Dell XPS 13 9310 OLED | |
| HP Spectre x360 13-aw2003dx | |
| Átlagos Intel Core i7-1165G7 (468 - 1138, n=80) | |
| Dell XPS 13 7390 Core i7-10710U | |
| Lenovo Yoga 6 13 82ND0009US | |
| Asus ZenBook 13 OLED UM325UA | |
| Lenovo Yoga Slim 7-14ARE | |
| 7-Zip 18.03 / 7z b 4 -mmt1 | |
| Átlagos Intel Core i7-1165G7 (4478 - 5507, n=80) | |
| Dell XPS 13 9310 2-in-1 | |
| HP Envy 13-ba0001ng | |
| HP Spectre x360 13-aw2003dx | |
| Asus ZenBook 13 OLED UM325UA | |
| Lenovo Yoga Slim 7-14ARE | |
| Asus Zenbook S UX393JA | |
| Dell XPS 13 7390 Core i7-10710U | |
| Lenovo Yoga 6 13 82ND0009US | |
| Asus VivoBook S13 S333JA-DS51 | |
| Dell XPS 13 9310 OLED | |
| 7-Zip 18.03 / 7z b 4 | |
| Lenovo Yoga Slim 7-14ARE | |
| Asus ZenBook 13 OLED UM325UA | |
| Lenovo Yoga 6 13 82ND0009US | |
| Dell XPS 13 7390 Core i7-10710U | |
| Dell XPS 13 9310 2-in-1 | |
| Átlagos Intel Core i7-1165G7 (15347 - 27405, n=80) | |
| HP Spectre x360 13-aw2003dx | |
| Dell XPS 13 9310 OLED | |
| Asus Zenbook S UX393JA | |
| Asus VivoBook S13 S333JA-DS51 | |
| HP Envy 13-ba0001ng | |
| Geekbench 5.5 / Single-Core | |
| Dell XPS 13 9310 OLED | |
| Átlagos Intel Core i7-1165G7 (1302 - 1595, n=77) | |
| HP Spectre x360 13-aw2003dx | |
| Asus Zenbook S UX393JA | |
| HP Envy 13-ba0001ng | |
| Asus ZenBook 13 OLED UM325UA | |
| Lenovo Yoga Slim 7-14ARE | |
| Lenovo Yoga Slim 7-14ARE | |
| Asus VivoBook S13 S333JA-DS51 | |
| Geekbench 5.5 / Multi-Core | |
| Lenovo Yoga Slim 7-14ARE | |
| Lenovo Yoga Slim 7-14ARE | |
| Asus ZenBook 13 OLED UM325UA | |
| Dell XPS 13 9310 OLED | |
| HP Spectre x360 13-aw2003dx | |
| Átlagos Intel Core i7-1165G7 (3078 - 5926, n=77) | |
| Asus Zenbook S UX393JA | |
| Asus VivoBook S13 S333JA-DS51 | |
| HP Envy 13-ba0001ng | |
| HWBOT x265 Benchmark v2.2 / 4k Preset | |
| Lenovo Yoga Slim 7-14ARE | |
| Asus ZenBook 13 OLED UM325UA | |
| Lenovo Yoga 6 13 82ND0009US | |
| Dell XPS 13 9310 OLED | |
| Dell XPS 13 9310 2-in-1 | |
| Átlagos Intel Core i7-1165G7 (1.39 - 8.47, n=80) | |
| HP Spectre x360 13-aw2003dx | |
| Dell XPS 13 7390 Core i7-10710U | |
| Asus VivoBook S13 S333JA-DS51 | |
| Asus Zenbook S UX393JA | |
| HP Envy 13-ba0001ng | |
| LibreOffice / 20 Documents To PDF | |
| Lenovo Yoga 6 13 82ND0009US | |
| Asus VivoBook S13 S333JA-DS51 | |
| Asus ZenBook 13 OLED UM325UA | |
| Lenovo Yoga Slim 7-14ARE | |
| HP Envy 13-ba0001ng | |
| HP Spectre x360 13-aw2003dx | |
| Átlagos Intel Core i7-1165G7 (21.5 - 88.1, n=78) | |
| Asus Zenbook S UX393JA | |
| Dell XPS 13 9310 OLED | |
| R Benchmark 2.5 / Overall mean | |
| Asus VivoBook S13 S333JA-DS51 | |
| Asus Zenbook S UX393JA | |
| HP Envy 13-ba0001ng | |
| HP Spectre x360 13-aw2003dx | |
| Lenovo Yoga 6 13 82ND0009US | |
| Lenovo Yoga Slim 7-14ARE | |
| Dell XPS 13 9310 2-in-1 | |
| Asus ZenBook 13 OLED UM325UA | |
| Dell XPS 13 9310 OLED | |
| Átlagos Intel Core i7-1165G7 (0.552 - 1.002, n=80) | |
* ... a kisebb jobb
| PCMark 10 / Score | |
| Lenovo Yoga 6 13 82ND0009US | |
| Dell XPS 13 9310 2-in-1 | |
| Átlagos Intel Core i7-1165G7, Intel Iris Xe Graphics G7 96EUs (4531 - 5454, n=50) | |
| Dell XPS 13 9310 Core i7 FHD | |
| Asus ZenBook Flip 13 UX363EA-HP069T | |
| Dell XPS 13 7390 2-in-1 Core i7 | |
| Samsung Galaxy Book Pro 360 13 | |
| PCMark 10 / Essentials | |
| Dell XPS 13 9310 2-in-1 | |
| Asus ZenBook Flip 13 UX363EA-HP069T | |
| Átlagos Intel Core i7-1165G7, Intel Iris Xe Graphics G7 96EUs (8997 - 11505, n=50) | |
| Lenovo Yoga 6 13 82ND0009US | |
| Dell XPS 13 9310 Core i7 FHD | |
| Dell XPS 13 7390 2-in-1 Core i7 | |
| Samsung Galaxy Book Pro 360 13 | |
| PCMark 10 / Productivity | |
| Lenovo Yoga 6 13 82ND0009US | |
| Dell XPS 13 7390 2-in-1 Core i7 | |
| Asus ZenBook Flip 13 UX363EA-HP069T | |
| Dell XPS 13 9310 2-in-1 | |
| Dell XPS 13 9310 Core i7 FHD | |
| Átlagos Intel Core i7-1165G7, Intel Iris Xe Graphics G7 96EUs (5570 - 7136, n=50) | |
| Samsung Galaxy Book Pro 360 13 | |
| PCMark 10 / Digital Content Creation | |
| Lenovo Yoga 6 13 82ND0009US | |
| Dell XPS 13 9310 2-in-1 | |
| Átlagos Intel Core i7-1165G7, Intel Iris Xe Graphics G7 96EUs (4083 - 5550, n=50) | |
| Dell XPS 13 9310 Core i7 FHD | |
| Samsung Galaxy Book Pro 360 13 | |
| Asus ZenBook Flip 13 UX363EA-HP069T | |
| Dell XPS 13 7390 2-in-1 Core i7 | |
| PCMark 10 Score | 5177 pontok | |
Segítség | ||
| DPC Latencies / LatencyMon - interrupt to process latency (max), Web, Youtube, Prime95 | |
| Samsung Galaxy Book Pro 360 13 | |
| Asus ZenBook Flip 13 UX363EA-HP069T | |
| Lenovo Yoga 6 13 82ND0009US | |
| Dell XPS 13 9310 Core i7 FHD | |
| Dell XPS 13 9310 2-in-1 | |
* ... a kisebb jobb
| Dell XPS 13 9310 2-in-1 Toshiba BG4 KBG40ZPZ512G | Dell XPS 13 9310 Core i7 FHD Micron 2300 512GB MTFDHBA512TDV | Dell XPS 13 7390 2-in-1 Core i7 Toshiba BG4 KBG40ZPZ512G | Lenovo Yoga 6 13 82ND0009US WDC PC SN530 SDBPMPZ-265G | Samsung Galaxy Book Pro 360 13 Samsung PM991 MZVLQ256HAJD | |
|---|---|---|---|---|---|
| AS SSD | 70% | 2% | -28% | 15% | |
| Seq Read (MB/s) | 2031 | 2091 3% | 1801 -11% | 1860 -8% | 1771 -13% |
| Seq Write (MB/s) | 776 | 1396 80% | 1125 45% | 500 -36% | 894 15% |
| 4K Read (MB/s) | 49.55 | 49.29 -1% | 39.7 -20% | 36.26 -27% | 53.5 8% |
| 4K Write (MB/s) | 112.2 | 104.2 -7% | 67 -40% | 118.6 6% | 157.8 41% |
| 4K-64 Read (MB/s) | 1058 | 827 -22% | 1253 18% | 419 -60% | 478.1 -55% |
| 4K-64 Write (MB/s) | 328.9 | 1636 397% | 209 -36% | 219 -33% | 741 125% |
| Access Time Read * (ms) | 0.072 | 0.066 8% | 0.069 4% | 0.102 -42% | 0.156 -117% |
| Access Time Write * (ms) | 0.518 | 0.365 30% | 0.625 -21% | 0.17 67% | 0.023 96% |
| Score Read (Points) | 1311 | 1086 -17% | 1472 12% | 641 -51% | 709 -46% |
| Score Write (Points) | 519 | 1880 262% | 388 -25% | 388 -25% | 988 90% |
| Score Total (Points) | 2447 | 3499 43% | 2583 6% | 1300 -47% | 2034 -17% |
| Copy ISO MB/s (MB/s) | 1103 | 1544 40% | 1293 17% | 880 -20% | 960 -13% |
| Copy Program MB/s (MB/s) | 331.7 | 613 85% | 560 69% | 185.3 -44% | 648 95% |
| Copy Game MB/s (MB/s) | 828 | 1451 75% | 927 12% | 212.7 -74% | 882 7% |
| CrystalDiskMark 5.2 / 6 | 24% | -3% | -20% | -12% | |
| Write 4K (MB/s) | 129.6 | 97.5 -25% | 106.7 -18% | 89.2 -31% | 170.6 32% |
| Read 4K (MB/s) | 52.2 | 50.9 -2% | 49.94 -4% | 33.09 -37% | 44.51 -15% |
| Write Seq (MB/s) | 1310 | 1811 38% | 1223 -7% | 988 -25% | 872 -33% |
| Read Seq (MB/s) | 1726 | 1836 6% | 1801 4% | 1322 -23% | 1188 -31% |
| Write 4K Q32T1 (MB/s) | 334.7 | 521 56% | 325.3 -3% | 332.6 -1% | 483.1 44% |
| Read 4K Q32T1 (MB/s) | 447.6 | 357.5 -20% | 551 23% | 389.3 -13% | 284.3 -36% |
| Write Seq Q32T1 (MB/s) | 1410 | 2879 104% | 1224 -13% | 984 -30% | 950 -33% |
| Read Seq Q32T1 (MB/s) | 2390 | 3204 34% | 2350 -2% | 2461 3% | 1872 -22% |
| Teljes átlag (program / beállítások) | 47% /
53% | -1% /
0% | -24% /
-25% | 2% /
6% |
* ... a kisebb jobb

Disk Throttling: DiskSpd Read Loop, Queue Depth 8
| 3DMark 11 | |
| 1280x720 Performance GPU | |
| Dell XPS 13 9310 OLED | |
| Dell XPS 13 9310 2-in-1 | |
| Átlagos Intel Iris Xe Graphics G7 96EUs (2867 - 7676, n=209) | |
| HP Spectre x360 13-aw2003dx | |
| Lenovo Yoga Slim 7-14ARE | |
| Asus ZenBook 13 OLED UM325UA | |
| Lenovo Yoga 6 13 82ND0009US | |
| HP Envy 13-ba0001ng | |
| Dell XPS 13 7390 2-in-1 Core i7 | |
| HP Envy 13-aq0003ng | |
| Asus VivoBook S13 S333JA-DS51 | |
| Dell XPS 13 7390 Core i7-10710U | |
| 1280x720 Performance Combined | |
| Dell XPS 13 9310 2-in-1 | |
| Átlagos Intel Iris Xe Graphics G7 96EUs (1926 - 7661, n=208) | |
| HP Spectre x360 13-aw2003dx | |
| HP Envy 13-ba0001ng | |
| Lenovo Yoga Slim 7-14ARE | |
| Dell XPS 13 9310 OLED | |
| Dell XPS 13 7390 2-in-1 Core i7 | |
| HP Envy 13-aq0003ng | |
| Asus ZenBook 13 OLED UM325UA | |
| Lenovo Yoga 6 13 82ND0009US | |
| Asus VivoBook S13 S333JA-DS51 | |
| Dell XPS 13 7390 Core i7-10710U | |
| 3DMark 11 Performance | 7018 pontok | |
| 3DMark Cloud Gate Standard Score | 19494 pontok | |
| 3DMark Fire Strike Score | 4786 pontok | |
| 3DMark Time Spy Score | 1778 pontok | |
Segítség | ||
| Final Fantasy XV Benchmark | |
| 1280x720 Lite Quality | |
| Átlagos Intel Iris Xe Graphics G7 96EUs (14.9 - 56.5, n=189) | |
| HP Spectre x360 13-aw2003dx | |
| Lenovo Yoga Slim 7-14ARE | |
| Dell XPS 13 9310 2-in-1 | |
| Dell XPS 13 9310 OLED | |
| Asus ZenBook 13 OLED UM325UA | |
| Lenovo Yoga 6 13 82ND0009US | |
| Asus Zenbook S UX393JA | |
| Asus VivoBook S13 S333JA-DS51 | |
| 1920x1080 Standard Quality | |
| Átlagos Intel Iris Xe Graphics G7 96EUs (10.5 - 31.2, n=185) | |
| Dell XPS 13 9310 2-in-1 | |
| HP Spectre x360 13-aw2003dx | |
| Dell XPS 13 9310 OLED | |
| Lenovo Yoga Slim 7-14ARE | |
| Asus ZenBook 13 OLED UM325UA | |
| Lenovo Yoga 6 13 82ND0009US | |
| Asus Zenbook S UX393JA | |
| Asus VivoBook S13 S333JA-DS51 | |
| 1920x1080 High Quality | |
| HP Spectre x360 13-aw2003dx | |
| Átlagos Intel Iris Xe Graphics G7 96EUs (8.15 - 27.8, n=178) | |
| Dell XPS 13 9310 2-in-1 | |
| Dell XPS 13 9310 OLED | |
| Lenovo Yoga Slim 7-14ARE | |
| Asus ZenBook 13 OLED UM325UA | |
| Lenovo Yoga 6 13 82ND0009US | |
| Asus Zenbook S UX393JA | |
| Asus VivoBook S13 S333JA-DS51 | |
| GTA V | |
| 1024x768 Lowest Settings possible | |
| Lenovo Yoga Slim 7-14ARE | |
| Átlagos Intel Iris Xe Graphics G7 96EUs (52 - 166.4, n=168) | |
| Dell XPS 13 9310 2-in-1 | |
| Lenovo Yoga 6 13 82ND0009US | |
| 1920x1080 Lowest Settings possible | |
| Dell XPS 13 9310 2-in-1 | |
| Átlagos Intel Iris Xe Graphics G7 96EUs (34.7 - 132.1, n=141) | |
| Lenovo Yoga Slim 7-14ARE | |
| Lenovo Yoga 6 13 82ND0009US | |
| 1366x768 Normal/Off AF:4x | |
| Átlagos Intel Iris Xe Graphics G7 96EUs (24.1 - 152.7, n=169) | |
| Dell XPS 13 9310 2-in-1 | |
| 1920x1080 Normal/Off AF:4x | |
| Dell XPS 13 9310 2-in-1 | |
| Lenovo Yoga Slim 7-14ARE | |
| Átlagos Intel Iris Xe Graphics G7 96EUs (20 - 119.3, n=142) | |
| Lenovo Yoga 6 13 82ND0009US | |
| 1920x1080 High/On (Advanced Graphics Off) AA:2xMSAA + FX AF:8x | |
| Lenovo Yoga Slim 7-14ARE | |
| Dell XPS 13 9310 2-in-1 | |
| Átlagos Intel Iris Xe Graphics G7 96EUs (9.39 - 51.6, n=162) | |
| Lenovo Yoga 6 13 82ND0009US | |
| 1920x1080 Highest AA:4xMSAA + FX AF:16x | |
| Lenovo Yoga Slim 7-14ARE | |
| Dell XPS 13 9310 2-in-1 | |
| Átlagos Intel Iris Xe Graphics G7 96EUs (4.13 - 22.9, n=156) | |
| Lenovo Yoga 6 13 82ND0009US | |
| X-Plane 11.11 | |
| 1280x720 low (fps_test=1) | |
| HP Envy 13-ba0001ng | |
| Lenovo Yoga Slim 7-14ARE | |
| Átlagos Intel Iris Xe Graphics G7 96EUs (13.4 - 88.4, n=213) | |
| Asus Zenbook S UX393JA | |
| Asus ZenBook 13 OLED UM325UA | |
| Lenovo Yoga 6 13 82ND0009US | |
| Asus VivoBook S13 S333JA-DS51 | |
| Dell XPS 13 9310 OLED | |
| HP Spectre x360 13-aw2003dx | |
| Dell XPS 13 9310 2-in-1 | |
| 1920x1080 med (fps_test=2) | |
| HP Envy 13-ba0001ng | |
| Dell XPS 13 9310 OLED | |
| Átlagos Intel Iris Xe Graphics G7 96EUs (11.6 - 69.5, n=214) | |
| Lenovo Yoga Slim 7-14ARE | |
| HP Spectre x360 13-aw2003dx | |
| Dell XPS 13 9310 2-in-1 | |
| Asus ZenBook 13 OLED UM325UA | |
| Lenovo Yoga 6 13 82ND0009US | |
| Asus Zenbook S UX393JA | |
| Asus VivoBook S13 S333JA-DS51 | |
| 1920x1080 high (fps_test=3) | |
| HP Envy 13-ba0001ng | |
| Átlagos Intel Iris Xe Graphics G7 96EUs (11.1 - 59.8, n=213) | |
| Dell XPS 13 9310 2-in-1 | |
| Lenovo Yoga Slim 7-14ARE | |
| Dell XPS 13 9310 OLED | |
| Asus ZenBook 13 OLED UM325UA | |
| Lenovo Yoga 6 13 82ND0009US | |
| HP Spectre x360 13-aw2003dx | |
| Asus Zenbook S UX393JA | |
| Asus VivoBook S13 S333JA-DS51 | |
| Strange Brigade | |
| 1280x720 lowest AF:1 | |
| Dell XPS 13 9310 OLED | |
| Átlagos Intel Iris Xe Graphics G7 96EUs (48.5 - 115.1, n=172) | |
| Lenovo Yoga Slim 7-14ARE | |
| Dell XPS 13 9310 2-in-1 | |
| Lenovo Yoga 6 13 82ND0009US | |
| Asus Zenbook S UX393JA | |
| 1920x1080 medium AA:medium AF:4 | |
| Dell XPS 13 9310 2-in-1 | |
| Átlagos Intel Iris Xe Graphics G7 96EUs (18.2 - 51.4, n=170) | |
| Dell XPS 13 9310 OLED | |
| Lenovo Yoga Slim 7-14ARE | |
| Lenovo Yoga 6 13 82ND0009US | |
| Asus Zenbook S UX393JA | |
| 1920x1080 high AA:high AF:8 | |
| Dell XPS 13 9310 OLED | |
| Dell XPS 13 9310 2-in-1 | |
| Átlagos Intel Iris Xe Graphics G7 96EUs (15.4 - 39.8, n=169) | |
| Lenovo Yoga Slim 7-14ARE | |
| Lenovo Yoga 6 13 82ND0009US | |
| Asus Zenbook S UX393JA | |
| 1920x1080 ultra AA:ultra AF:16 | |
| Dell XPS 13 9310 2-in-1 | |
| Átlagos Intel Iris Xe Graphics G7 96EUs (13.2 - 31.7, n=167) | |
| Lenovo Yoga Slim 7-14ARE | |
| Dell XPS 13 9310 OLED | |
| Lenovo Yoga 6 13 82ND0009US | |
| Asus Zenbook S UX393JA | |
| Far Cry 5 | |
| 1280x720 Low Preset AA:T | |
| Dell XPS 13 9310 2-in-1 | |
| Átlagos Intel Iris Xe Graphics G7 96EUs (23 - 75, n=93) | |
| 1920x1080 Low Preset AA:T | |
| Átlagos Intel Iris Xe Graphics G7 96EUs (15 - 48, n=41) | |
| Dell XPS 13 9310 2-in-1 | |
| 1920x1080 Medium Preset AA:T | |
| Átlagos Intel Iris Xe Graphics G7 96EUs (14 - 39, n=91) | |
| Dell XPS 13 9310 2-in-1 | |
| 1920x1080 High Preset AA:T | |
| Átlagos Intel Iris Xe Graphics G7 96EUs (10 - 35, n=89) | |
| Dell XPS 13 9310 2-in-1 | |
| 1920x1080 Ultra Preset AA:T | |
| Átlagos Intel Iris Xe Graphics G7 96EUs (11 - 33, n=75) | |
| Dell XPS 13 9310 2-in-1 | |
Witcher 3 FPS Chart
| alacsony | közepes | magas | ultra | |
|---|---|---|---|---|
| GTA V (2015) | 96.7 | 80.5 | 25.4 | 10 |
| The Witcher 3 (2015) | 86.2 | 54.3 | 29.9 | 14.7 |
| Dota 2 Reborn (2015) | 109 | 61.4 | 52.8 | 52.8 |
| Final Fantasy XV Benchmark (2018) | 36.8 | 21.8 | 15.9 | |
| X-Plane 11.11 (2018) | 23.5 | 31.9 | 31.3 | |
| Far Cry 5 (2018) | 49 | 23 | 22 | 22 |
| Strange Brigade (2018) | 78.1 | 36.8 | 29.4 | 24 |
| Dell XPS 13 9310 2-in-1 Iris Xe G7 96EUs, i7-1165G7, Toshiba BG4 KBG40ZPZ512G | Dell XPS 13 9310 Core i7 FHD Iris Xe G7 96EUs, i7-1165G7, Micron 2300 512GB MTFDHBA512TDV | Dell XPS 13 7390 2-in-1 Core i7 Iris Plus Graphics G7 (Ice Lake 64 EU), i7-1065G7, Toshiba BG4 KBG40ZPZ512G | Lenovo Yoga 6 13 82ND0009US Vega 7, R5 5500U, WDC PC SN530 SDBPMPZ-265G | Asus ZenBook Flip 13 UX363EA-HP069T Iris Xe G7 96EUs, i7-1165G7, WDC PC SN730 SDBPNTY-1T00 | Samsung Galaxy Book Pro 360 13 Iris Xe G7 80EUs, i5-1135G7, Samsung PM991 MZVLQ256HAJD | |
|---|---|---|---|---|---|---|
| Noise | 4% | -8% | -1% | -12% | -7% | |
| off / környezet * (dB) | 24.3 | 25.7 -6% | 28.1 -16% | 25.1 -3% | 27 -11% | 27 -11% |
| Idle Minimum * (dB) | 24.8 | 25.7 -4% | 28.1 -13% | 25.1 -1% | 27 -9% | 27 -9% |
| Idle Average * (dB) | 24.8 | 25.7 -4% | 28.1 -13% | 25.1 -1% | 27 -9% | 27 -9% |
| Idle Maximum * (dB) | 24.8 | 25.9 -4% | 28.1 -13% | 25.1 -1% | 27 -9% | 27 -9% |
| Load Average * (dB) | 38 | 26.2 31% | 31.7 17% | 41 -8% | 46 -21% | 40.7 -7% |
| Witcher 3 ultra * (dB) | 38 | 36.5 4% | 43.4 -14% | 38.6 -2% | ||
| Load Maximum * (dB) | 41.5 | 36.6 12% | 43.4 -5% | 38.7 7% | 46.6 -12% | 40.7 2% |
* ... a kisebb jobb
Zajszint
| Üresjárat |
| 24.8 / 24.8 / 24.8 dB(A) |
| Terhelés |
| 38 / 41.5 dB(A) |
 | ||
30 dB csendes 40 dB(A) hallható 50 dB(A) hangos |
||
min: | ||
(-) A felső oldalon a maximális hőmérséklet 51 °C / 124 F, összehasonlítva a 35.4 °C / 96 F átlagával , 19.6 és 60 °C között a Convertible osztálynál.
(-) Az alsó maximum 45.4 °C / 114 F-ig melegszik fel, összehasonlítva a 36.9 °C / 98 F átlagával
(+) Üresjáratban a felső oldal átlagos hőmérséklete 22.9 °C / 73 F, összehasonlítva a 30.3 °C / ### eszközátlaggal class_avg_f### F.
(+) A csuklótámasz és az érintőpad hűvösebb, mint a bőr hőmérséklete, maximum 30.6 °C / 87.1 F, ezért hűvös tapintású.
(-) A hasonló eszközök csuklótámasz területének átlagos hőmérséklete 28 °C / 82.4 F volt (-2.6 °C / -4.7 F).
Dell XPS 13 9310 2-in-1 hangelemzés
(±) | a hangszóró hangereje átlagos, de jó (80.7 dB)
Basszus 100 - 315 Hz
(±) | csökkentett basszus – átlagosan 11.7%-kal alacsonyabb, mint a medián
(±) | a basszus linearitása átlagos (10.6% delta az előző frekvenciához)
Közepes 400-2000 Hz
(±) | magasabb középértékek – átlagosan 6.1%-kal magasabb, mint a medián
(+) | a középpontok lineárisak (4.1% delta az előző frekvenciához)
Maximum 2-16 kHz
(+) | kiegyensúlyozott csúcsok – csak 1.4% választja el a mediántól
(+) | a csúcsok lineárisak (3.6% delta az előző frekvenciához képest)
Összességében 100 - 16.000 Hz
(+) | általános hangzás lineáris (12.7% eltérés a mediánhoz képest)
Ugyanazon osztályhoz képest
» 16%Ebben az osztályban az összes tesztelt eszköz %-a jobb volt, 2% hasonló, 82%-kal rosszabb
» A legjobb delta értéke 6%, az átlag 20%, a legrosszabb 57% volt
Az összes tesztelt eszközzel összehasonlítva
» 12% az összes tesztelt eszköz jobb volt, 3% hasonló, 86%-kal rosszabb
» A legjobb delta értéke 4%, az átlag 24%, a legrosszabb 134% volt
Apple MacBook 12 (Early 2016) 1.1 GHz hangelemzés
(+) | a hangszórók viszonylag hangosan tudnak játszani (83.6 dB)
Basszus 100 - 315 Hz
(±) | csökkentett basszus – átlagosan 11.3%-kal alacsonyabb, mint a medián
(±) | a basszus linearitása átlagos (14.2% delta az előző frekvenciához)
Közepes 400-2000 Hz
(+) | kiegyensúlyozott középpontok – csak 2.4% választja el a mediántól
(+) | a középpontok lineárisak (5.5% delta az előző frekvenciához)
Maximum 2-16 kHz
(+) | kiegyensúlyozott csúcsok – csak 2% választja el a mediántól
(+) | a csúcsok lineárisak (4.5% delta az előző frekvenciához képest)
Összességében 100 - 16.000 Hz
(+) | általános hangzás lineáris (10.2% eltérés a mediánhoz képest)
Ugyanazon osztályhoz képest
» 7%Ebben az osztályban az összes tesztelt eszköz %-a jobb volt, 2% hasonló, 91%-kal rosszabb
» A legjobb delta értéke 5%, az átlag 18%, a legrosszabb 53% volt
Az összes tesztelt eszközzel összehasonlítva
» 5% az összes tesztelt eszköz jobb volt, 1% hasonló, 94%-kal rosszabb
» A legjobb delta értéke 4%, az átlag 24%, a legrosszabb 134% volt
| Kikapcsolt állapot / Készenlét | |
| Üresjárat | |
| Terhelés |
|
Kulcs:
min: | |
| Dell XPS 13 9310 2-in-1 i7-1165G7, Iris Xe G7 96EUs, Toshiba BG4 KBG40ZPZ512G, IPS, 1920x1200, 13.4" | Dell XPS 13 9310 Core i7 FHD i7-1165G7, Iris Xe G7 96EUs, Micron 2300 512GB MTFDHBA512TDV, IPS, 1920x1200, 13.4" | Dell XPS 13 7390 2-in-1 Core i7 i7-1065G7, Iris Plus Graphics G7 (Ice Lake 64 EU), Toshiba BG4 KBG40ZPZ512G, IPS, 1920x1200, 13.4" | Lenovo Yoga 6 13 82ND0009US R5 5500U, Vega 7, WDC PC SN530 SDBPMPZ-265G, IPS, 1920x1080, 13.3" | Asus ZenBook Flip 13 UX363EA-HP069T i7-1165G7, Iris Xe G7 96EUs, WDC PC SN730 SDBPNTY-1T00, OLED, 1920x1080, 13.3" | Samsung Galaxy Book Pro 360 13 i5-1135G7, Iris Xe G7 80EUs, Samsung PM991 MZVLQ256HAJD, AMOLED, 1920x1080, 13.2" | |
|---|---|---|---|---|---|---|
| Power Consumption | -11% | -9% | -20% | -11% | -22% | |
| Idle Minimum * (Watt) | 2.6 | 3.9 -50% | 2.6 -0% | 5 -92% | 4.4 -69% | 5 -92% |
| Idle Average * (Watt) | 6.4 | 5.9 8% | 5.3 17% | 6.3 2% | 7.4 -16% | 6 6% |
| Idle Maximum * (Watt) | 7.7 | 6.3 18% | 7 9% | 6.9 10% | 11.3 -47% | 11.7 -52% |
| Load Average * (Watt) | 29.9 | 39.7 -33% | 43.1 -44% | 41.5 -39% | 22 26% | 28 6% |
| Witcher 3 ultra * (Watt) | 32.2 | 34.8 -8% | 43.1 -34% | 33.2 -3% | 22.8 29% | 28.3 12% |
| Load Maximum * (Watt) | 47.5 | 47.5 -0% | 49 -3% | 46.5 2% | 42.5 11% | 53 -12% |
* ... a kisebb jobb
Power Consumption Witcher 3 / Stresstest
| Dell XPS 13 9310 2-in-1 i7-1165G7, Iris Xe G7 96EUs, 51 Wh | Dell XPS 13 9310 Core i7 FHD i7-1165G7, Iris Xe G7 96EUs, 52 Wh | Dell XPS 13 7390 2-in-1 Core i7 i7-1065G7, Iris Plus Graphics G7 (Ice Lake 64 EU), 51 Wh | Lenovo Yoga 6 13 82ND0009US R5 5500U, Vega 7, 60 Wh | Asus ZenBook Flip 13 UX363EA-HP069T i7-1165G7, Iris Xe G7 96EUs, 67 Wh | Samsung Galaxy Book Pro 360 13 i5-1135G7, Iris Xe G7 80EUs, 63 Wh | |
|---|---|---|---|---|---|---|
| Akkumulátor üzemidő | 5% | -16% | -16% | -6% | 12% | |
| Reader / Idle (h) | 25.4 | 30 18% | 17.5 -31% | 20.5 -19% | 31.3 23% | |
| WiFi v1.3 (h) | 10.7 | 11 3% | 9 -16% | 13.2 23% | 10.7 0% | 12.1 13% |
| Load (h) | 3.4 | 3.2 -6% | 2 -41% | 3.4 0% | 3.4 0% |
Pro
Kontra
Összegzés - Gyorsabb, de nem drágább
Az XPS 13 9310 2 az 1-ben jelentősen nagyobb grafikus teljesítményt nyújt, mint az XPS 13 73902 az 1-ben. Ami még jobb, hogy a rendszer mindezt ugyanabban az energiafelhasználási keretben éri el, ami azt jelenti, hogy a felhasználók jobb grafikai teljesítményt kapnak anélkül, hogy az üzemidőt, a felületi hőmérsékletet vagy a ventilátorzajt fel kellene áldozniuk. Aki sok grafikus szerkesztési munkát végez, annak kétségtelenül nagyon előnyös lehet, ha a régebbi UHD Graphics-ról vagy a tavalyi Iris Plus G7-ről az Iris Xe-re vált.
Az Intel Iris Xe hatalmas áldás volt az XPS 13 sorozat számára, de a legtöbb más ultrahordozható vagy subnotebookhoz képest instabil CPU és GPU órajelek egyes teljesítményre fókuszáló felhasználók számára bosszantóak lehetnek.
Sajnos a processzor teljesítménye alig javult a Core i7-es XPS 13 7390 2 az 1-ben modellhez képest. Az órajelek sokkal könnyebben ingadoznak az általunk vizsgált Core i7 XPS 13 9310 2 az 1-ben modellben, míg az új kijelző opciók hiánya eggyel kevesebb ösztönzőt jelent az újabb modell beszerzésére. Ennek eredményeképpen sok otthoni felhasználó a legjobb esetben is kevés előnyt talál az XPS 13 9310 2 az 1-ben modellben az XPS 13 7390 2 az 1-ben modellhez képest, különösen azért, mert a régebbi modell olcsóbb.
Ár és elérhetőség
Dell XPS 13 9310 2-in-1
- 10/02/2021 v7 (old)
Allen Ngo
Price comparison

