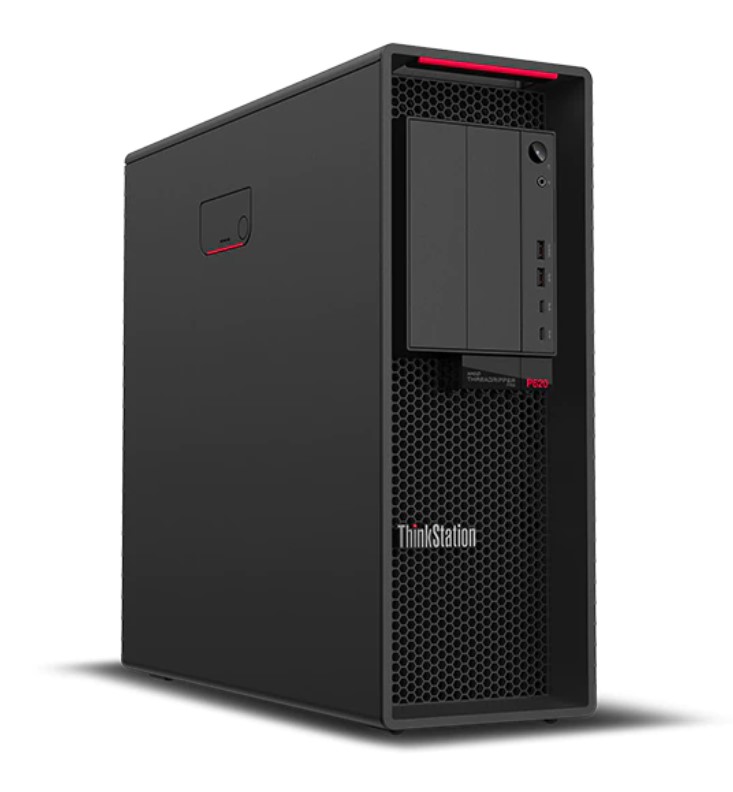
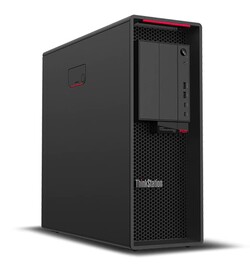
Rövid értékelés: AMD Ryzen Threadripper Pro 3995WX és Radeon Pro W6800 a Lenovo ThinkStation P620 csúcskategóriás munkaállomásban
| Cinebench R20 | |
| CPU (Multi Core) | |
| Lenovo ThinkStation P620, AMD Ryzen Threadripper PRO 3995WX | |
| AMD Ryzen 9 5950X, AMD Ryzen 9 5950X | |
| AMD Threadripper 2970WX, AMD Radeon RX Vega 64, AMD Ryzen Threadripper 2970WX | |
| Asus X299 Prime Desktop, Intel Core i9-10980XE | |
| AMD Ryzen 9 5900X, AMD Ryzen 9 5900X | |
| no name, AMD Ryzen Threadripper 2950X | |
| AMD Radeon RX Vega 64, AMD Ryzen 9 3900X | |
| Intel Core i9-11900K, Intel Core i9-11900K | |
| CPU (Single Core) | |
| Intel Core i9-11900K, Intel Core i9-11900K | |
| AMD Ryzen 9 5950X, AMD Ryzen 9 5950X | |
| AMD Ryzen 9 5900X, AMD Ryzen 9 5900X | |
| AMD Radeon RX Vega 64, AMD Ryzen 9 3900X | |
| Lenovo ThinkStation P620, AMD Ryzen Threadripper PRO 3995WX | |
| Asus X299 Prime Desktop, Intel Core i9-10980XE | |
| no name, AMD Ryzen Threadripper 2950X | |
| AMD Threadripper 2970WX, AMD Radeon RX Vega 64, AMD Ryzen Threadripper 2970WX | |
| Cinebench R15 | |
| CPU Multi 64Bit | |
| Lenovo ThinkStation P620, AMD Ryzen Threadripper PRO 3995WX | |
| AMD Ryzen 9 5950X, AMD Ryzen 9 5950X | |
| AMD Threadripper 2970WX, AMD Radeon RX Vega 64, AMD Ryzen Threadripper 2970WX | |
| AMD Ryzen 9 5900X, AMD Ryzen 9 5900X | |
| Asus X299 Prime Desktop, Intel Core i9-10980XE | |
| no name, AMD Ryzen Threadripper 2950X | |
| AMD Radeon RX Vega 64, AMD Ryzen 9 3900X | |
| Intel Core i9-11900K, Intel Core i9-11900K | |
| CPU Single 64Bit | |
| AMD Ryzen 9 5950X, AMD Ryzen 9 5950X | |
| AMD Ryzen 9 5900X, AMD Ryzen 9 5900X | |
| Intel Core i9-11900K, Intel Core i9-11900K | |
| AMD Radeon RX Vega 64, AMD Ryzen 9 3900X | |
| Asus X299 Prime Desktop, Intel Core i9-10980XE | |
| Lenovo ThinkStation P620, AMD Ryzen Threadripper PRO 3995WX | |
| no name, AMD Ryzen Threadripper 2950X | |
| AMD Threadripper 2970WX, AMD Radeon RX Vega 64, AMD Ryzen Threadripper 2970WX | |
| Cinebench R11.5 | |
| CPU Multi 64Bit | |
| Lenovo ThinkStation P620, AMD Ryzen Threadripper PRO 3995WX | |
| AMD Ryzen 9 5950X, AMD Ryzen 9 5950X | |
| AMD Ryzen 9 5900X, AMD Ryzen 9 5900X | |
| Asus X299 Prime Desktop, Intel Core i9-10980XE | |
| AMD Radeon RX Vega 64, AMD Ryzen 9 3900X | |
| no name, AMD Ryzen Threadripper 2950X | |
| Intel Core i9-11900K, Intel Core i9-11900K | |
| AMD Threadripper 2970WX, AMD Radeon RX Vega 64, AMD Ryzen Threadripper 2970WX | |
| CPU Single 64Bit | |
| AMD Ryzen 9 5900X, AMD Ryzen 9 5900X | |
| AMD Ryzen 9 5950X, AMD Ryzen 9 5950X | |
| Intel Core i9-11900K, Intel Core i9-11900K | |
| AMD Radeon RX Vega 64, AMD Ryzen 9 3900X | |
| Asus X299 Prime Desktop, Intel Core i9-10980XE | |
| Lenovo ThinkStation P620, AMD Ryzen Threadripper PRO 3995WX | |
| no name, AMD Ryzen Threadripper 2950X | |
| AMD Threadripper 2970WX, AMD Radeon RX Vega 64, AMD Ryzen Threadripper 2970WX | |
| Cinebench R10 | |
| Rendering Multiple CPUs 64Bit | |
| AMD Ryzen 9 5950X, AMD Ryzen 9 5950X | |
| AMD Ryzen 9 5900X, AMD Ryzen 9 5900X | |
| Lenovo ThinkStation P620, AMD Ryzen Threadripper PRO 3995WX | |
| Intel Core i9-11900K, Intel Core i9-11900K | |
| no name, AMD Ryzen Threadripper 2950X | |
| AMD Radeon RX Vega 64, AMD Ryzen 9 3900X | |
| AMD Threadripper 2970WX, AMD Radeon RX Vega 64, AMD Ryzen Threadripper 2970WX | |
| Rendering Single CPUs 64Bit | |
| Intel Core i9-11900K, Intel Core i9-11900K | |
| AMD Ryzen 9 5950X, AMD Ryzen 9 5950X | |
| AMD Ryzen 9 5900X, AMD Ryzen 9 5900X | |
| AMD Radeon RX Vega 64, AMD Ryzen 9 3900X | |
| Lenovo ThinkStation P620, AMD Ryzen Threadripper PRO 3995WX | |
| AMD Threadripper 2970WX, AMD Radeon RX Vega 64, AMD Ryzen Threadripper 2970WX | |
| no name, AMD Ryzen Threadripper 2950X | |
| Blender - v2.79 BMW27 CPU | |
| Intel Core i9-11900K, Intel Core i9-11900K | |
| AMD Radeon RX Vega 64, AMD Ryzen 9 3900X | |
| no name, AMD Ryzen Threadripper 2950X | |
| AMD Ryzen 9 5900X, AMD Ryzen 9 5900X | |
| Asus X299 Prime Desktop, Intel Core i9-10980XE | |
| AMD Ryzen 9 5950X, AMD Ryzen 9 5950X | |
| AMD Threadripper 2970WX, AMD Radeon RX Vega 64, AMD Ryzen Threadripper 2970WX | |
| Lenovo ThinkStation P620, AMD Ryzen Threadripper PRO 3995WX | |
| wPrime 2.10 | |
| 32m | |
| Lenovo ThinkStation P620, AMD Ryzen Threadripper PRO 3995WX | |
| no name, AMD Ryzen Threadripper 2950X | |
| AMD Threadripper 2970WX, AMD Radeon RX Vega 64, AMD Ryzen Threadripper 2970WX | |
| Intel Core i9-11900K, Intel Core i9-11900K | |
| Asus X299 Prime Desktop, Intel Core i9-10980XE | |
| AMD Radeon RX Vega 64, AMD Ryzen 9 3900X | |
| AMD Ryzen 9 5950X, AMD Ryzen 9 5950X | |
| 1024m | |
| Intel Core i9-11900K, Intel Core i9-11900K | |
| AMD Ryzen 9 5950X, AMD Ryzen 9 5950X | |
| AMD Radeon RX Vega 64, AMD Ryzen 9 3900X | |
| no name, AMD Ryzen Threadripper 2950X | |
| Asus X299 Prime Desktop, Intel Core i9-10980XE | |
| AMD Threadripper 2970WX, AMD Radeon RX Vega 64, AMD Ryzen Threadripper 2970WX | |
| Lenovo ThinkStation P620, AMD Ryzen Threadripper PRO 3995WX | |
| X264 HD Benchmark 4.0 | |
| Pass 1 | |
| AMD Ryzen 9 5950X, AMD Ryzen 9 5950X | |
| AMD Ryzen 9 5900X, AMD Ryzen 9 5900X | |
| Intel Core i9-11900K, Intel Core i9-11900K | |
| AMD Radeon RX Vega 64, AMD Ryzen 9 3900X | |
| Lenovo ThinkStation P620, AMD Ryzen Threadripper PRO 3995WX | |
| Asus X299 Prime Desktop, Intel Core i9-10980XE | |
| no name, AMD Ryzen Threadripper 2950X | |
| AMD Threadripper 2970WX, AMD Radeon RX Vega 64, AMD Ryzen Threadripper 2970WX | |
| Pass 2 | |
| AMD Ryzen 9 5950X, AMD Ryzen 9 5950X | |
| Lenovo ThinkStation P620, AMD Ryzen Threadripper PRO 3995WX | |
| AMD Ryzen 9 5900X, AMD Ryzen 9 5900X | |
| Asus X299 Prime Desktop, Intel Core i9-10980XE | |
| AMD Radeon RX Vega 64, AMD Ryzen 9 3900X | |
| no name, AMD Ryzen Threadripper 2950X | |
| Intel Core i9-11900K, Intel Core i9-11900K | |
| AMD Threadripper 2970WX, AMD Radeon RX Vega 64, AMD Ryzen Threadripper 2970WX | |
| WinRAR - Result | |
| AMD Ryzen 9 5900X, AMD Ryzen 9 5900X | |
| AMD Ryzen 9 5950X, AMD Ryzen 9 5950X | |
| Intel Core i9-11900K, Intel Core i9-11900K | |
| AMD Radeon RX Vega 64, AMD Ryzen 9 3900X | |
| Asus X299 Prime Desktop, Intel Core i9-10980XE | |
| Lenovo ThinkStation P620, AMD Ryzen Threadripper PRO 3995WX | |
| no name, AMD Ryzen Threadripper 2950X | |
| AMD Threadripper 2970WX, AMD Radeon RX Vega 64, AMD Ryzen Threadripper 2970WX | |
| TrueCrypt | |
| AES Mean 100MB | |
| AMD Ryzen 9 5950X, AMD Ryzen 9 5950X | |
| Lenovo ThinkStation P620, AMD Ryzen Threadripper PRO 3995WX | |
| AMD Ryzen 9 5900X, AMD Ryzen 9 5900X | |
| no name, AMD Ryzen Threadripper 2950X | |
| Asus X299 Prime Desktop, Intel Core i9-10980XE | |
| Intel Core i9-11900K, Intel Core i9-11900K | |
| AMD Threadripper 2970WX, AMD Radeon RX Vega 64, AMD Ryzen Threadripper 2970WX | |
| AMD Radeon RX Vega 64, AMD Ryzen 9 3900X | |
| Twofish Mean 100MB | |
| Lenovo ThinkStation P620, AMD Ryzen Threadripper PRO 3995WX | |
| AMD Ryzen 9 5950X, AMD Ryzen 9 5950X | |
| Asus X299 Prime Desktop, Intel Core i9-10980XE | |
| AMD Threadripper 2970WX, AMD Radeon RX Vega 64, AMD Ryzen Threadripper 2970WX | |
| no name, AMD Ryzen Threadripper 2950X | |
| AMD Radeon RX Vega 64, AMD Ryzen 9 3900X | |
| AMD Ryzen 9 5900X, AMD Ryzen 9 5900X | |
| Intel Core i9-11900K, Intel Core i9-11900K | |
| Serpent Mean 100MB | |
| Lenovo ThinkStation P620, AMD Ryzen Threadripper PRO 3995WX | |
| AMD Ryzen 9 5950X, AMD Ryzen 9 5950X | |
| AMD Threadripper 2970WX, AMD Radeon RX Vega 64, AMD Ryzen Threadripper 2970WX | |
| Asus X299 Prime Desktop, Intel Core i9-10980XE | |
| no name, AMD Ryzen Threadripper 2950X | |
| AMD Ryzen 9 5900X, AMD Ryzen 9 5900X | |
| AMD Radeon RX Vega 64, AMD Ryzen 9 3900X | |
| Intel Core i9-11900K, Intel Core i9-11900K | |
| Geekbench 5.5 | |
| Multi-Core | |
| AMD Ryzen 9 5950X, AMD Ryzen 9 5950X | |
| Lenovo ThinkStation P620, AMD Ryzen Threadripper PRO 3995WX | |
| AMD Ryzen 9 5900X, AMD Ryzen 9 5900X | |
| no name, AMD Ryzen Threadripper 2950X | |
| Intel Core i9-11900K, Intel Core i9-11900K | |
| AMD Threadripper 2970WX, AMD Radeon RX Vega 64, AMD Ryzen Threadripper 2970WX | |
| AMD Radeon RX Vega 64, AMD Ryzen 9 3900X | |
| Single-Core | |
| Intel Core i9-11900K, Intel Core i9-11900K | |
| Lenovo ThinkStation P620, AMD Ryzen Threadripper PRO 3995WX | |
| AMD Ryzen 9 5950X, AMD Ryzen 9 5950X | |
| AMD Ryzen 9 5900X, AMD Ryzen 9 5900X | |
| AMD Radeon RX Vega 64, AMD Ryzen 9 3900X | |
| no name, AMD Ryzen Threadripper 2950X | |
| AMD Threadripper 2970WX, AMD Radeon RX Vega 64, AMD Ryzen Threadripper 2970WX | |
| Geekbench 5.0 | |
| 5.0 Multi-Core | |
| Lenovo ThinkStation P620, AMD Ryzen Threadripper PRO 3995WX | |
| AMD Ryzen 9 5950X, AMD Ryzen 9 5950X | |
| Asus X299 Prime Desktop, Intel Core i9-10980XE | |
| AMD Ryzen 9 5900X, AMD Ryzen 9 5900X | |
| AMD Radeon RX Vega 64, AMD Ryzen 9 3900X | |
| Intel Core i9-11900K, Intel Core i9-11900K | |
| 5.0 Single-Core | |
| Intel Core i9-11900K, Intel Core i9-11900K | |
| AMD Ryzen 9 5950X, AMD Ryzen 9 5950X | |
| AMD Ryzen 9 5900X, AMD Ryzen 9 5900X | |
| Asus X299 Prime Desktop, Intel Core i9-10980XE | |
| Lenovo ThinkStation P620, AMD Ryzen Threadripper PRO 3995WX | |
| AMD Radeon RX Vega 64, AMD Ryzen 9 3900X | |
| Geekbench 4.4 | |
| 64 Bit Multi-Core Score | |
| Lenovo ThinkStation P620, AMD Ryzen Threadripper PRO 3995WX | |
| AMD Ryzen 9 5950X, AMD Ryzen 9 5950X | |
| AMD Ryzen 9 5900X, AMD Ryzen 9 5900X | |
| Asus X299 Prime Desktop, Intel Core i9-10980XE | |
| AMD Radeon RX Vega 64, AMD Ryzen 9 3900X | |
| Intel Core i9-11900K, Intel Core i9-11900K | |
| no name, AMD Ryzen Threadripper 2950X | |
| AMD Threadripper 2970WX, AMD Radeon RX Vega 64, AMD Ryzen Threadripper 2970WX | |
| 64 Bit Single-Core Score | |
| Intel Core i9-11900K, Intel Core i9-11900K | |
| AMD Ryzen 9 5900X, AMD Ryzen 9 5900X | |
| AMD Ryzen 9 5950X, AMD Ryzen 9 5950X | |
| AMD Radeon RX Vega 64, AMD Ryzen 9 3900X | |
| Asus X299 Prime Desktop, Intel Core i9-10980XE | |
| Lenovo ThinkStation P620, AMD Ryzen Threadripper PRO 3995WX | |
| no name, AMD Ryzen Threadripper 2950X | |
| AMD Threadripper 2970WX, AMD Radeon RX Vega 64, AMD Ryzen Threadripper 2970WX | |
| 3DMark 11 - 1280x720 Performance Physics | |
| AMD Ryzen 9 5950X, AMD Ryzen 9 5950X | |
| AMD Ryzen 9 5900X, AMD Ryzen 9 5900X | |
| Intel Core i9-11900K, Intel Core i9-11900K | |
| Asus X299 Prime Desktop, Intel Core i9-10980XE | |
| AMD Radeon RX Vega 64, AMD Ryzen 9 3900X | |
| Lenovo ThinkStation P620, AMD Ryzen Threadripper PRO 3995WX | |
| no name, AMD Ryzen Threadripper 2950X | |
| AMD Threadripper 2970WX, AMD Radeon RX Vega 64, AMD Ryzen Threadripper 2970WX | |
| 7-Zip 18.03 | |
| 7z b 4 | |
| Lenovo ThinkStation P620, AMD Ryzen Threadripper PRO 3995WX | |
| AMD Ryzen 9 5950X, AMD Ryzen 9 5950X | |
| AMD Ryzen 9 5900X, AMD Ryzen 9 5900X | |
| Asus X299 Prime Desktop, Intel Core i9-10980XE | |
| AMD Radeon RX Vega 64, AMD Ryzen 9 3900X | |
| Intel Core i9-11900K, Intel Core i9-11900K | |
| 7z b 4 -mmt1 | |
| AMD Ryzen 9 5950X, AMD Ryzen 9 5950X | |
| AMD Ryzen 9 5900X, AMD Ryzen 9 5900X | |
| Intel Core i9-11900K, Intel Core i9-11900K | |
| AMD Radeon RX Vega 64, AMD Ryzen 9 3900X | |
| Asus X299 Prime Desktop, Intel Core i9-10980XE | |
| Lenovo ThinkStation P620, AMD Ryzen Threadripper PRO 3995WX | |
| HWBOT x265 Benchmark v2.2 - 4k Preset | |
| Lenovo ThinkStation P620, AMD Ryzen Threadripper PRO 3995WX | |
| AMD Ryzen 9 5950X, AMD Ryzen 9 5950X | |
| Asus X299 Prime Desktop, Intel Core i9-10980XE | |
| AMD Ryzen 9 5900X, AMD Ryzen 9 5900X | |
| AMD Radeon RX Vega 64, AMD Ryzen 9 3900X | |
| Intel Core i9-11900K, Intel Core i9-11900K | |
| AMD Threadripper 2970WX, AMD Radeon RX Vega 64, AMD Ryzen Threadripper 2970WX | |
| no name, AMD Ryzen Threadripper 2950X | |
| R Benchmark 2.5 - Overall mean | |
| Lenovo ThinkStation P620, AMD Ryzen Threadripper PRO 3995WX | |
| AMD Radeon RX Vega 64, AMD Ryzen 9 3900X | |
| Intel Core i9-11900K, Intel Core i9-11900K | |
| AMD Ryzen 9 5950X, AMD Ryzen 9 5950X | |
| AMD Ryzen 9 5900X, AMD Ryzen 9 5900X | |
| LibreOffice - 20 Documents To PDF | |
| Intel Core i9-11900K, Intel Core i9-11900K | |
| Lenovo ThinkStation P620, AMD Ryzen Threadripper PRO 3995WX | |
| AMD Radeon RX Vega 64, AMD Ryzen 9 3900X | |
| AMD Ryzen 9 5900X, AMD Ryzen 9 5900X | |
| AMD Ryzen 9 5950X, AMD Ryzen 9 5950X | |
| WebXPRT 3 - Overall | |
| AMD Ryzen 9 5950X, AMD Ryzen 9 5950X | |
| AMD Ryzen 9 5900X, AMD Ryzen 9 5900X | |
| Asus X299 Prime Desktop, Intel Core i9-10980XE | |
| Lenovo ThinkStation P620, AMD Ryzen Threadripper PRO 3995WX | |
| Intel Core i9-11900K, Intel Core i9-11900K | |
| Mozilla Kraken 1.1 - Total | |
| Asus X299 Prime Desktop, Intel Core i9-10980XE | |
| Lenovo ThinkStation P620, AMD Ryzen Threadripper PRO 3995WX | |
| AMD Ryzen 9 5900X, AMD Ryzen 9 5900X | |
| AMD Ryzen 9 5950X, AMD Ryzen 9 5950X | |
| Intel Core i9-11900K, Intel Core i9-11900K | |
| 3DMark | |
| 3840x2160 Fire Strike Ultra Physics | |
| AMD Ryzen 9 5950X, AMD Ryzen 9 5950X | |
| AMD Ryzen 9 5900X, AMD Ryzen 9 5900X | |
| AMD Radeon RX Vega 64, AMD Ryzen 9 3900X | |
| Intel Core i9-11900K, Intel Core i9-11900K | |
| no name, AMD Ryzen Threadripper 2950X | |
| Lenovo ThinkStation P620, AMD Ryzen Threadripper PRO 3995WX | |
| AMD Threadripper 2970WX, AMD Radeon RX Vega 64, AMD Ryzen Threadripper 2970WX | |
| 1920x1080 Fire Strike Physics | |
| AMD Ryzen 9 5950X, AMD Ryzen 9 5950X | |
| AMD Ryzen 9 5900X, AMD Ryzen 9 5900X | |
| Intel Core i9-11900K, Intel Core i9-11900K | |
| AMD Radeon RX Vega 64, AMD Ryzen 9 3900X | |
| Asus X299 Prime Desktop, Intel Core i9-10980XE | |
| no name, AMD Ryzen Threadripper 2950X | |
| Lenovo ThinkStation P620, AMD Ryzen Threadripper PRO 3995WX | |
| AMD Threadripper 2970WX, AMD Radeon RX Vega 64, AMD Ryzen Threadripper 2970WX | |
| 2560x1440 Time Spy CPU | |
| AMD Ryzen 9 5950X, AMD Ryzen 9 5950X | |
| Intel Core i9-11900K, Intel Core i9-11900K | |
| AMD Ryzen 9 5900X, AMD Ryzen 9 5900X | |
| Asus X299 Prime Desktop, Intel Core i9-10980XE | |
| AMD Radeon RX Vega 64, AMD Ryzen 9 3900X | |
| Lenovo ThinkStation P620, AMD Ryzen Threadripper PRO 3995WX | |
| no name, AMD Ryzen Threadripper 2950X | |
| AMD Threadripper 2970WX, AMD Radeon RX Vega 64, AMD Ryzen Threadripper 2970WX | |
* ... a kisebb jobb
» A Top 10 multimédiás noteszgép - tesztek alapján
» A Top 10 játékos noteszgép
» A Top 10 belépő szintű üzleti noteszgép
» A Top 10 üzleti noteszgép
» A Top 10 notebook munkaállomása
» A Top 10 okostelefon - tesztek alapján
» A Top 10 táblagép
» A Top 10 Windows tabletje
» A Top 10 subnotebook - tesztek alapján
» A Top 10 300 euró alatti okostelefonja
» A Top 10 120 euró alatti okostelefonja
» A Top 10 phabletje (>5.5-inch)
» A Top 10 noteszgép 500 EUR (~160.000 HUF) alatt
» A Top 10 "pehelysúlyú" gaming notebookja
| SPECviewperf 2020 | |
| 3840x2160 Solidworks (solidworks-05) | |
| Lenovo ThinkStation P620, AMD Ryzen Threadripper PRO 3995WX | |
| AMD Ryzen 9 5950X, AMD Ryzen 9 5950X | |
| AMD Ryzen 9 5900X, AMD Ryzen 9 5900X | |
| Intel Core i9-11900K, Intel Core i9-11900K | |
| 3840x2160 Siemens NX (snx-04) | |
| Lenovo ThinkStation P620, AMD Ryzen Threadripper PRO 3995WX | |
| AMD Ryzen 9 5950X, AMD Ryzen 9 5950X | |
| AMD Ryzen 9 5900X, AMD Ryzen 9 5900X | |
| Intel Core i9-11900K, Intel Core i9-11900K | |
| 3840x2160 Medical (medical-03) | |
| Lenovo ThinkStation P620, AMD Ryzen Threadripper PRO 3995WX | |
| Intel Core i9-11900K, Intel Core i9-11900K | |
| AMD Ryzen 9 5900X, AMD Ryzen 9 5900X | |
| AMD Ryzen 9 5950X, AMD Ryzen 9 5950X | |
| 3840x2160 Maya (maya-06) | |
| Lenovo ThinkStation P620, AMD Ryzen Threadripper PRO 3995WX | |
| AMD Ryzen 9 5950X, AMD Ryzen 9 5950X | |
| AMD Ryzen 9 5900X, AMD Ryzen 9 5900X | |
| Intel Core i9-11900K, Intel Core i9-11900K | |
| 3840x2160 Energy (energy-03) | |
| Lenovo ThinkStation P620, AMD Ryzen Threadripper PRO 3995WX | |
| AMD Ryzen 9 5900X, AMD Ryzen 9 5900X | |
| AMD Ryzen 9 5950X, AMD Ryzen 9 5950X | |
| Intel Core i9-11900K, Intel Core i9-11900K | |
| 3840x2160 Creo (creo-03) | |
| Intel Core i9-11900K, Intel Core i9-11900K | |
| AMD Ryzen 9 5900X, AMD Ryzen 9 5900X | |
| AMD Ryzen 9 5950X, AMD Ryzen 9 5950X | |
| Lenovo ThinkStation P620, AMD Ryzen Threadripper PRO 3995WX | |
| 3840x2160 CATIA (catia-06) | |
| Intel Core i9-11900K, Intel Core i9-11900K | |
| AMD Ryzen 9 5900X, AMD Ryzen 9 5900X | |
| AMD Ryzen 9 5950X, AMD Ryzen 9 5950X | |
| Lenovo ThinkStation P620, AMD Ryzen Threadripper PRO 3995WX | |
| 3840x2160 3ds Max (3dsmax-07) | |
| Lenovo ThinkStation P620, AMD Ryzen Threadripper PRO 3995WX | |
| AMD Ryzen 9 5950X, AMD Ryzen 9 5950X | |
| Intel Core i9-11900K, Intel Core i9-11900K | |
| AMD Ryzen 9 5900X, AMD Ryzen 9 5900X | |
| SPECviewperf 13 | |
| Solidworks (sw-04) | |
| Intel Core i9-11900K, Intel Core i9-11900K | |
| AMD Ryzen 9 5900X, AMD Ryzen 9 5900X | |
| AMD Ryzen 9 5950X, AMD Ryzen 9 5950X | |
| Lenovo ThinkStation P620, AMD Ryzen Threadripper PRO 3995WX | |
| AMD Radeon RX Vega 64, AMD Ryzen 9 3900X | |
| AMD Threadripper 2970WX, AMD Radeon RX Vega 64, AMD Ryzen Threadripper 2970WX | |
| Siemens NX (snx-03) | |
| AMD Ryzen 9 5900X, AMD Ryzen 9 5900X | |
| AMD Ryzen 9 5950X, AMD Ryzen 9 5950X | |
| Intel Core i9-11900K, Intel Core i9-11900K | |
| Lenovo ThinkStation P620, AMD Ryzen Threadripper PRO 3995WX | |
| AMD Threadripper 2970WX, AMD Radeon RX Vega 64, AMD Ryzen Threadripper 2970WX | |
| AMD Radeon RX Vega 64, AMD Ryzen 9 3900X | |
| Showcase (showcase-02) | |
| Lenovo ThinkStation P620, AMD Ryzen Threadripper PRO 3995WX | |
| Intel Core i9-11900K, Intel Core i9-11900K | |
| AMD Ryzen 9 5950X, AMD Ryzen 9 5950X | |
| AMD Ryzen 9 5900X, AMD Ryzen 9 5900X | |
| AMD Radeon RX Vega 64, AMD Ryzen 9 3900X | |
| AMD Threadripper 2970WX, AMD Radeon RX Vega 64, AMD Ryzen Threadripper 2970WX | |
| Medical (medical-02) | |
| Lenovo ThinkStation P620, AMD Ryzen Threadripper PRO 3995WX | |
| AMD Ryzen 9 5900X, AMD Ryzen 9 5900X | |
| AMD Ryzen 9 5950X, AMD Ryzen 9 5950X | |
| Intel Core i9-11900K, Intel Core i9-11900K | |
| AMD Radeon RX Vega 64, AMD Ryzen 9 3900X | |
| AMD Threadripper 2970WX, AMD Radeon RX Vega 64, AMD Ryzen Threadripper 2970WX | |
| Maya (maya-05) | |
| AMD Ryzen 9 5950X, AMD Ryzen 9 5950X | |
| AMD Ryzen 9 5900X, AMD Ryzen 9 5900X | |
| Intel Core i9-11900K, Intel Core i9-11900K | |
| Lenovo ThinkStation P620, AMD Ryzen Threadripper PRO 3995WX | |
| AMD Radeon RX Vega 64, AMD Ryzen 9 3900X | |
| AMD Threadripper 2970WX, AMD Radeon RX Vega 64, AMD Ryzen Threadripper 2970WX | |
| Energy (energy-02) | |
| Lenovo ThinkStation P620, AMD Ryzen Threadripper PRO 3995WX | |
| Intel Core i9-11900K, Intel Core i9-11900K | |
| AMD Ryzen 9 5900X, AMD Ryzen 9 5900X | |
| AMD Ryzen 9 5950X, AMD Ryzen 9 5950X | |
| AMD Radeon RX Vega 64, AMD Ryzen 9 3900X | |
| AMD Threadripper 2970WX, AMD Radeon RX Vega 64, AMD Ryzen Threadripper 2970WX | |
| Catia (catia-05) | |
| AMD Ryzen 9 5950X, AMD Ryzen 9 5950X | |
| Intel Core i9-11900K, Intel Core i9-11900K | |
| Lenovo ThinkStation P620, AMD Ryzen Threadripper PRO 3995WX | |
| AMD Ryzen 9 5900X, AMD Ryzen 9 5900X | |
| AMD Radeon RX Vega 64, AMD Ryzen 9 3900X | |
| AMD Threadripper 2970WX, AMD Radeon RX Vega 64, AMD Ryzen Threadripper 2970WX | |
| 3ds Max (3dsmax-06) | |
| Lenovo ThinkStation P620, AMD Ryzen Threadripper PRO 3995WX | |
| AMD Ryzen 9 5900X, AMD Ryzen 9 5900X | |
| AMD Ryzen 9 5950X, AMD Ryzen 9 5950X | |
| Intel Core i9-11900K, Intel Core i9-11900K | |
| AMD Radeon RX Vega 64, AMD Ryzen 9 3900X | |
| AMD Threadripper 2970WX, AMD Radeon RX Vega 64, AMD Ryzen Threadripper 2970WX | |
| SPECviewperf 12 | |
| 1900x1060 Solidworks (sw-03) | |
| AMD Ryzen 9 5950X, AMD Ryzen 9 5950X | |
| Lenovo ThinkStation P620, AMD Ryzen Threadripper PRO 3995WX | |
| Intel Core i9-11900K, Intel Core i9-11900K | |
| AMD Ryzen 9 5900X, AMD Ryzen 9 5900X | |
| AMD Radeon RX Vega 64, AMD Ryzen 9 3900X | |
| AMD Threadripper 2970WX, AMD Radeon RX Vega 64, AMD Ryzen Threadripper 2970WX | |
| 1900x1060 Siemens NX (snx-02) | |
| AMD Ryzen 9 5900X, AMD Ryzen 9 5900X | |
| AMD Ryzen 9 5950X, AMD Ryzen 9 5950X | |
| Intel Core i9-11900K, Intel Core i9-11900K | |
| Lenovo ThinkStation P620, AMD Ryzen Threadripper PRO 3995WX | |
| AMD Threadripper 2970WX, AMD Radeon RX Vega 64, AMD Ryzen Threadripper 2970WX | |
| AMD Radeon RX Vega 64, AMD Ryzen 9 3900X | |
| 1900x1060 Showcase (showcase-01) | |
| Lenovo ThinkStation P620, AMD Ryzen Threadripper PRO 3995WX | |
| Intel Core i9-11900K, Intel Core i9-11900K | |
| AMD Ryzen 9 5900X, AMD Ryzen 9 5900X | |
| AMD Ryzen 9 5950X, AMD Ryzen 9 5950X | |
| AMD Threadripper 2970WX, AMD Radeon RX Vega 64, AMD Ryzen Threadripper 2970WX | |
| AMD Radeon RX Vega 64, AMD Ryzen 9 3900X | |
| 1900x1060 Medical (medical-01) | |
| Lenovo ThinkStation P620, AMD Ryzen Threadripper PRO 3995WX | |
| AMD Ryzen 9 5900X, AMD Ryzen 9 5900X | |
| AMD Ryzen 9 5950X, AMD Ryzen 9 5950X | |
| Intel Core i9-11900K, Intel Core i9-11900K | |
| AMD Radeon RX Vega 64, AMD Ryzen 9 3900X | |
| AMD Threadripper 2970WX, AMD Radeon RX Vega 64, AMD Ryzen Threadripper 2970WX | |
| 1900x1060 Maya (maya-04) | |
| Intel Core i9-11900K, Intel Core i9-11900K | |
| AMD Ryzen 9 5950X, AMD Ryzen 9 5950X | |
| AMD Ryzen 9 5900X, AMD Ryzen 9 5900X | |
| Lenovo ThinkStation P620, AMD Ryzen Threadripper PRO 3995WX | |
| AMD Radeon RX Vega 64, AMD Ryzen 9 3900X | |
| AMD Threadripper 2970WX, AMD Radeon RX Vega 64, AMD Ryzen Threadripper 2970WX | |
| 1900x1060 Energy (energy-01) | |
| Lenovo ThinkStation P620, AMD Ryzen Threadripper PRO 3995WX | |
| AMD Ryzen 9 5900X, AMD Ryzen 9 5900X | |
| Intel Core i9-11900K, Intel Core i9-11900K | |
| AMD Ryzen 9 5950X, AMD Ryzen 9 5950X | |
| AMD Radeon RX Vega 64, AMD Ryzen 9 3900X | |
| AMD Threadripper 2970WX, AMD Radeon RX Vega 64, AMD Ryzen Threadripper 2970WX | |
| 1900x1060 Creo (creo-01) | |
| AMD Ryzen 9 5900X, AMD Ryzen 9 5900X | |
| Intel Core i9-11900K, Intel Core i9-11900K | |
| AMD Ryzen 9 5950X, AMD Ryzen 9 5950X | |
| Lenovo ThinkStation P620, AMD Ryzen Threadripper PRO 3995WX | |
| AMD Radeon RX Vega 64, AMD Ryzen 9 3900X | |
| AMD Threadripper 2970WX, AMD Radeon RX Vega 64, AMD Ryzen Threadripper 2970WX | |
| 1900x1060 Catia (catia-04) | |
| Intel Core i9-11900K, Intel Core i9-11900K | |
| AMD Ryzen 9 5900X, AMD Ryzen 9 5900X | |
| Lenovo ThinkStation P620, AMD Ryzen Threadripper PRO 3995WX | |
| AMD Ryzen 9 5950X, AMD Ryzen 9 5950X | |
| AMD Radeon RX Vega 64, AMD Ryzen 9 3900X | |
| AMD Threadripper 2970WX, AMD Radeon RX Vega 64, AMD Ryzen Threadripper 2970WX | |
| 1900x1060 3ds Max (3dsmax-05) | |
| Lenovo ThinkStation P620, AMD Ryzen Threadripper PRO 3995WX | |
| AMD Ryzen 9 5900X, AMD Ryzen 9 5900X | |
| AMD Ryzen 9 5950X, AMD Ryzen 9 5950X | |
| Intel Core i9-11900K, Intel Core i9-11900K | |
| AMD Radeon RX Vega 64, AMD Ryzen 9 3900X | |
| AMD Threadripper 2970WX, AMD Radeon RX Vega 64, AMD Ryzen Threadripper 2970WX | |
| LuxMark v2.0 64Bit | |
| Room GPUs-only | |
| Lenovo ThinkStation P620, AMD Ryzen Threadripper PRO 3995WX | |
| Sala GPUs-only | |
| Lenovo ThinkStation P620, AMD Ryzen Threadripper PRO 3995WX | |
| ComputeMark v2.1 | |
| 1024x600 Normal, QJuliaRayTrace | |
| Lenovo ThinkStation P620, AMD Ryzen Threadripper PRO 3995WX | |
| 1024x600 Normal, Mandel Scalar | |
| Lenovo ThinkStation P620, AMD Ryzen Threadripper PRO 3995WX | |
| 1024x600 Normal, Mandel Vector | |
| Lenovo ThinkStation P620, AMD Ryzen Threadripper PRO 3995WX | |
| 1024x600 Normal, Fluid 2DTexArr | |
| Lenovo ThinkStation P620, AMD Ryzen Threadripper PRO 3995WX | |
| 1024x600 Normal, Fluid 3DTex | |
| Lenovo ThinkStation P620, AMD Ryzen Threadripper PRO 3995WX | |
| 1024x600 Normal, Score | |
| Lenovo ThinkStation P620, AMD Ryzen Threadripper PRO 3995WX | |
| PCMark 10 | |
| Score | |
| AMD Ryzen 9 5950X, AMD Ryzen 9 5950X | |
| AMD Ryzen 9 5900X, AMD Ryzen 9 5900X | |
| Intel Core i9-11900K, Intel Core i9-11900K | |
| no name, AMD Ryzen Threadripper 2950X | |
| AMD Radeon RX Vega 64, AMD Ryzen 9 3900X | |
| Lenovo ThinkStation P620, AMD Ryzen Threadripper PRO 3995WX | |
| Asus X299 Prime Desktop, Intel Core i9-10980XE | |
| AMD Threadripper 2970WX, AMD Radeon RX Vega 64, AMD Ryzen Threadripper 2970WX | |
| Digital Content Creation | |
| AMD Ryzen 9 5950X, AMD Ryzen 9 5950X | |
| AMD Ryzen 9 5900X, AMD Ryzen 9 5900X | |
| Lenovo ThinkStation P620, AMD Ryzen Threadripper PRO 3995WX | |
| Intel Core i9-11900K, Intel Core i9-11900K | |
| AMD Radeon RX Vega 64, AMD Ryzen 9 3900X | |
| no name, AMD Ryzen Threadripper 2950X | |
| AMD Threadripper 2970WX, AMD Radeon RX Vega 64, AMD Ryzen Threadripper 2970WX | |
| Productivity | |
| AMD Ryzen 9 5950X, AMD Ryzen 9 5950X | |
| AMD Ryzen 9 5900X, AMD Ryzen 9 5900X | |
| Intel Core i9-11900K, Intel Core i9-11900K | |
| AMD Radeon RX Vega 64, AMD Ryzen 9 3900X | |
| no name, AMD Ryzen Threadripper 2950X | |
| Lenovo ThinkStation P620, AMD Ryzen Threadripper PRO 3995WX | |
| AMD Threadripper 2970WX, AMD Radeon RX Vega 64, AMD Ryzen Threadripper 2970WX | |
| Essentials | |
| AMD Ryzen 9 5950X, AMD Ryzen 9 5950X | |
| AMD Radeon RX Vega 64, AMD Ryzen 9 3900X | |
| AMD Ryzen 9 5900X, AMD Ryzen 9 5900X | |
| Intel Core i9-11900K, Intel Core i9-11900K | |
| Lenovo ThinkStation P620, AMD Ryzen Threadripper PRO 3995WX | |
| no name, AMD Ryzen Threadripper 2950X | |
| AMD Threadripper 2970WX, AMD Radeon RX Vega 64, AMD Ryzen Threadripper 2970WX | |
| 3DMark 11 | |
| 1280x720 Performance GPU | |
| Nvidia GeForce RTX 3090 Founders Edition | |
| AMD Radeon RX 6800 XT | |
| MSI GeForce RTX 3080 Gaming X Trio | |
| Lenovo ThinkStation P620 | |
| AMD Radeon RX 6700 XT | |
| MSI GeForce RTX 3070 Ventus 3X | |
| Átlagos NVIDIA GeForce RTX 2070 Super (Desktop) (33257 - 37235, n=8) | |
| Átlagos NVIDIA GeForce RTX 2070 (Desktop) (22174 - 32373, n=7) | |
| Átlagos NVIDIA GeForce RTX 2060 Super (Desktop) (29148 - 30342, n=7) | |
| 1280x720 Performance | |
| Nvidia GeForce RTX 3090 Founders Edition | |
| AMD Radeon RX 6800 XT | |
| MSI GeForce RTX 3080 Gaming X Trio | |
| AMD Radeon RX 6700 XT | |
| MSI GeForce RTX 3070 Ventus 3X | |
| Lenovo ThinkStation P620 | |
| Átlagos NVIDIA GeForce RTX 2070 Super (Desktop) (24879 - 35274, n=8) | |
| Átlagos NVIDIA GeForce RTX 2060 Super (Desktop) (22211 - 30486, n=7) | |
| Átlagos NVIDIA GeForce RTX 2070 (Desktop) (15341 - 27206, n=7) | |
| Unigine Superposition | |
| 1280x720 720p Low | |
| Átlagos NVIDIA GeForce RTX 2070 Super (Desktop) (26742 - 45424, n=3) | |
| AMD Radeon RX 6800 XT | |
| Átlagos NVIDIA GeForce RTX 2060 Super (Desktop) (26634 - 40961, n=3) | |
| AMD Radeon RX 6700 XT | |
| Nvidia GeForce RTX 3090 Founders Edition | |
| MSI GeForce RTX 3070 Ventus 3X | |
| MSI GeForce RTX 3080 Gaming X Trio | |
| Lenovo ThinkStation P620 | |
| 1920x1080 1080p High | |
| Nvidia GeForce RTX 3090 Founders Edition | |
| AMD Radeon RX 6800 XT | |
| MSI GeForce RTX 3080 Gaming X Trio | |
| Lenovo ThinkStation P620 | |
| MSI GeForce RTX 3070 Ventus 3X | |
| AMD Radeon RX 6700 XT | |
| Átlagos NVIDIA GeForce RTX 2070 Super (Desktop) (13655 - 13832, n=3) | |
| Átlagos NVIDIA GeForce RTX 2060 Super (Desktop) (11421 - 11785, n=3) | |
| 1920x1080 1080p Extreme | |
| Nvidia GeForce RTX 3090 Founders Edition | |
| MSI GeForce RTX 3080 Gaming X Trio | |
| AMD Radeon RX 6800 XT | |
| Lenovo ThinkStation P620 | |
| MSI GeForce RTX 3070 Ventus 3X | |
| AMD Radeon RX 6700 XT | |
| Átlagos NVIDIA GeForce RTX 2070 Super (Desktop) (6161 - 6178, n=3) | |
| Átlagos NVIDIA GeForce RTX 2060 Super (Desktop) (5049 - 5143, n=3) | |
| 3840x2160 4k Optimized | |
| Nvidia GeForce RTX 3090 Founders Edition | |
| MSI GeForce RTX 3080 Gaming X Trio | |
| AMD Radeon RX 6800 XT | |
| Lenovo ThinkStation P620 | |
| MSI GeForce RTX 3070 Ventus 3X | |
| AMD Radeon RX 6700 XT | |
| Átlagos NVIDIA GeForce RTX 2070 Super (Desktop) (8096 - 8111, n=3) | |
| Átlagos NVIDIA GeForce RTX 2060 Super (Desktop) (6747 - 6863, n=3) | |
| 7680x4320 8k Optimized | |
| Nvidia GeForce RTX 3090 Founders Edition | |
| MSI GeForce RTX 3080 Gaming X Trio | |
| AMD Radeon RX 6800 XT | |
| Lenovo ThinkStation P620 | |
| MSI GeForce RTX 3070 Ventus 3X | |
| AMD Radeon RX 6700 XT | |
| Átlagos NVIDIA GeForce RTX 2070 Super (Desktop) (3419 - 3435, n=3) | |
| Átlagos NVIDIA GeForce RTX 2060 Super (Desktop) (2873 - 2914, n=3) | |
| Metro Exodus - 3840x2160 Ultra Quality AF:16x | |
| Nvidia GeForce RTX 3090 Founders Edition | |
| MSI GeForce RTX 3080 Gaming X Trio | |
| AMD Radeon RX 6800 XT | |
| Lenovo ThinkStation P620 | |
| MSI GeForce RTX 3070 Ventus 3X | |
| AMD Radeon RX 6700 XT | |
| Átlagos NVIDIA GeForce RTX 2070 Super (Desktop) (35 - 38.1, n=5) | |
| Átlagos NVIDIA GeForce RTX 2070 (Desktop) (30.5 - 32.7, n=3) | |
| Átlagos NVIDIA GeForce RTX 2060 Super (Desktop) (29.7 - 32.2, n=4) | |
| Far Cry New Dawn - 3840x2160 Ultra Preset | |
| Nvidia GeForce RTX 3090 Founders Edition | |
| AMD Radeon RX 6800 XT | |
| MSI GeForce RTX 3080 Gaming X Trio | |
| MSI GeForce RTX 3070 Ventus 3X | |
| AMD Radeon RX 6700 XT | |
| Átlagos NVIDIA GeForce RTX 2070 Super (Desktop) (55 - 58, n=5) | |
| Lenovo ThinkStation P620 | |
| Átlagos NVIDIA GeForce RTX 2070 (Desktop) (49 - 53, n=3) | |
| Átlagos NVIDIA GeForce RTX 2060 Super (Desktop) (48 - 50, n=4) | |
| Far Cry 5 - 3840x2160 Ultra Preset AA:T | |
| Nvidia GeForce RTX 3090 Founders Edition | |
| AMD Radeon RX 6800 XT | |
| MSI GeForce RTX 3080 Gaming X Trio | |
| MSI GeForce RTX 3070 Ventus 3X | |
| AMD Radeon RX 6700 XT | |
| Lenovo ThinkStation P620 | |
| Átlagos NVIDIA GeForce RTX 2070 Super (Desktop) (53 - 56, n=5) | |
| Átlagos NVIDIA GeForce RTX 2070 (Desktop) (46 - 51, n=4) | |
| Átlagos NVIDIA GeForce RTX 2060 Super (Desktop) (45 - 47, n=4) | |
| X-Plane 11.11 - 3840x2160 high (fps_test=3) | |
| MSI GeForce RTX 3080 Gaming X Trio | |
| Átlagos NVIDIA GeForce RTX 2060 Super (Desktop) (67 - 131.9, n=4) | |
| Átlagos NVIDIA GeForce RTX 2070 Super (Desktop) (67 - 131.8, n=5) | |
| Nvidia GeForce RTX 3090 Founders Edition | |
| MSI GeForce RTX 3070 Ventus 3X | |
| Átlagos NVIDIA GeForce RTX 2070 (Desktop) (n=1) | |
| AMD Radeon RX 6700 XT | |
| Lenovo ThinkStation P620 | |
| AMD Radeon RX 6800 XT | |
| Final Fantasy XV Benchmark - 3840x2160 High Quality | |
| Nvidia GeForce RTX 3090 Founders Edition | |
| MSI GeForce RTX 3080 Gaming X Trio | |
| AMD Radeon RX 6800 XT | |
| Lenovo ThinkStation P620 | |
| MSI GeForce RTX 3070 Ventus 3X | |
| AMD Radeon RX 6700 XT | |
| Átlagos NVIDIA GeForce RTX 2070 Super (Desktop) (40.6 - 44.9, n=5) | |
| Átlagos NVIDIA GeForce RTX 2070 (Desktop) (37.1 - 39.3, n=4) | |
| Átlagos NVIDIA GeForce RTX 2060 Super (Desktop) (34.9 - 38, n=4) | |
| Dota 2 Reborn - 3840x2160 ultra (3/3) best looking | |
| Nvidia GeForce RTX 3090 Founders Edition | |
| Átlagos NVIDIA GeForce RTX 2070 Super (Desktop) (106.7 - 146.3, n=5) | |
| MSI GeForce RTX 3070 Ventus 3X | |
| AMD Radeon RX 6800 XT | |
| Átlagos NVIDIA GeForce RTX 2060 Super (Desktop) (105.1 - 126.9, n=4) | |
| Átlagos NVIDIA GeForce RTX 2070 (Desktop) (n=1) | |
| AMD Radeon RX 6700 XT | |
| MSI GeForce RTX 3080 Gaming X Trio | |
| Lenovo ThinkStation P620 | |
| The Witcher 3 - 3840x2160 High Graphics & Postprocessing (Nvidia HairWorks Off) | |
| Nvidia GeForce RTX 3090 Founders Edition | |
| MSI GeForce RTX 3080 Gaming X Trio | |
| AMD Radeon RX 6800 XT | |
| Lenovo ThinkStation P620 | |
| MSI GeForce RTX 3070 Ventus 3X | |
| Átlagos NVIDIA GeForce RTX 2070 Super (Desktop) (65.5 - 71, n=5) | |
| AMD Radeon RX 6700 XT | |
| Átlagos NVIDIA GeForce RTX 2070 (Desktop) (55.9 - 67, n=4) | |
| Átlagos NVIDIA GeForce RTX 2060 Super (Desktop) (57 - 61, n=4) | |
| F1 2020 - 3840x2160 Ultra High Preset AA:T AF:16x | |
| Nvidia GeForce RTX 3090 Founders Edition | |
| AMD Radeon RX 6800 XT | |
| MSI GeForce RTX 3080 Gaming X Trio | |
| Lenovo ThinkStation P620 | |
| MSI GeForce RTX 3070 Ventus 3X | |
| AMD Radeon RX 6700 XT | |
| Átlagos NVIDIA GeForce RTX 2070 Super (Desktop) (67.6 - 71.4, n=3) | |
| Átlagos NVIDIA GeForce RTX 2070 (Desktop) (n=1) | |
| Átlagos NVIDIA GeForce RTX 2060 Super (Desktop) (55.2 - 57.4, n=4) | |
| GTA V - 3840x2160 High/On (Advanced Graphics Off) AA:FX AF:8x | |
| Nvidia GeForce RTX 3090 Founders Edition | |
| MSI GeForce RTX 3080 Gaming X Trio | |
| AMD Radeon RX 6800 XT | |
| Lenovo ThinkStation P620 | |
| MSI GeForce RTX 3070 Ventus 3X | |
| AMD Radeon RX 6700 XT | |
| Átlagos NVIDIA GeForce RTX 2070 Super (Desktop) (90.1 - 102, n=4) | |
| Átlagos NVIDIA GeForce RTX 2070 (Desktop) (79.9 - 111.9, n=3) | |
| Átlagos NVIDIA GeForce RTX 2060 Super (Desktop) (82.5 - 89, n=4) | |
| Strange Brigade - 3840x2160 ultra AA:ultra AF:16 | |
| Nvidia GeForce RTX 3090 Founders Edition | |
| MSI GeForce RTX 3080 Gaming X Trio | |
| AMD Radeon RX 6800 XT | |
| Lenovo ThinkStation P620 | |
| MSI GeForce RTX 3070 Ventus 3X | |
| AMD Radeon RX 6700 XT | |
| Átlagos NVIDIA GeForce RTX 2070 Super (Desktop) (55.5 - 75, n=2) | |
| Átlagos NVIDIA GeForce RTX 2070 (Desktop) (n=1) | |
| Átlagos NVIDIA GeForce RTX 2060 Super (Desktop) (60.6 - 64.7, n=3) | |
| alacsony | közepes | magas | ultra | QHD | 4K | |
|---|---|---|---|---|---|---|
| GTA V (2015) | 181 | 169 | 152 | 89.7 | 88.1 | 125 |
| The Witcher 3 (2015) | 354 | 236 | 199 | 157 | 99.1 | |
| Dota 2 Reborn (2015) | 143.6 | 119.3 | 99 | 85.7 | 94 | |
| Final Fantasy XV Benchmark (2018) | 178 | 174 | 137 | 106 | 60.8 | |
| X-Plane 11.11 (2018) | 62.2 | 52 | 45.4 | 45.1 | ||
| Far Cry 5 (2018) | 73 | 70 | 65 | 62 | 64 | 60 |
| Strange Brigade (2018) | 357 | 282 | 277 | 268 | 212 | 126 |
| Far Cry New Dawn (2019) | 66 | 61 | 59 | 55 | 55 | 55 |
| Metro Exodus (2019) | 124 | 121 | 186 | 172 | 171 | 54.7 |
| F1 2020 (2020) | 300 | 283 | 225 | 179 | 109 |
Energy consumption of the Lenovo ThinkStation P620
| Power Consumption | |
| 1920x1080 The Witcher 3 ultra (external Monitor) | |
| AMD Threadripper 2970WX, AMD Radeon RX Vega 64 | |
| AMD Ryzen 9 5950X (Idle: 78 W) | |
| AMD Ryzen 9 5900X (Idle: 78.1 W) | |
| no name | |
| AMD Radeon RX Vega 64 (Idle: 81.56 W) | |
| Intel Core i9-11900K (Idle: 57.3 W) | |
| Lenovo ThinkStation P620 | |
| Prime95 V2810 Stress (external Monitor) | |
| Lenovo ThinkStation P620 | |
| AMD Threadripper 2970WX, AMD Radeon RX Vega 64 | |
| Intel Core i9-11900K (Idle: 57.3 W) | |
| no name | |
| AMD Ryzen 9 5950X (Idle: 78 W) | |
| AMD Ryzen 9 5900X (Idle: 78.1 W) | |
| AMD Radeon RX Vega 64 (Idle: 81.56 W) | |
| Cinebench R15 Multi (external Monitor) | |
| AMD Threadripper 2970WX, AMD Radeon RX Vega 64 | |
| Lenovo ThinkStation P620 | |
| no name | |
| Intel Core i9-11900K (Idle: 57.3 W) | |
| AMD Ryzen 9 5900X (Idle: 78.1 W) | |
| AMD Radeon RX Vega 64 (Idle: 81.56 W) | |
| AMD Ryzen 9 5950X (Idle: 78 W) | |
| Temperatures - CPU Temperature Prime95 | |
| Intel Core i9-11900K | |
| Lenovo ThinkStation P620 | |
| AMD Ryzen 9 5900X | |
| AMD Ryzen 9 5950X | |
| no name | |
| AMD Threadripper 2970WX, AMD Radeon RX Vega 64 | |
* ... a kisebb jobb
Pro
Kontra
Összegzés - Csúcskategóriás munkaállomás ennek megfelelő áron
A Lenovo ThinkStation P620 egy modern munkaállomás sok sallang nélkül. A Lenovo itt egy meglehetősen kompakt és jól átgondolt, moduláris felépítésű házba helyezi a hardvert. Különös hangsúlyt fektettek a levegőkeringésre, hogy a beépített komponensek mindig maximális teljesítményt tudjanak nyújtani, még terhelés alatt is.
Az általunk tesztelt rendszerbe telepített AMD Ryzen Threadripper Pro 3995WX a legjobb választás, hiszen ez az eddigi leggyorsabb AMD Threadripper CPU. A processzor a 64 mag egyesítésével egészen elképesztő, és az SMT-nek köszönhetően akár 128 szálat is biztosít. Ezáltal a CPU ideális a rendkívül optimalizált, többszálas alkalmazásokhoz, amelyek jelentősen meghaladják a normál követelményeket. Esetünkben a processzor 256 GB RAM-mal rendelkezik, ami még egy munkaállomás esetében sem éppen szerény. Ilyen nagyságrendekkel egyébként csak a szerverekben találkozhatunk. Számos forgatókönyv, például virtuális gépek, ezzel a konfigurációval megvalósítható. Azok a felhasználók, akiknek még szükségük van egy RAM-meghajtóra, a bőséges RAM-ból is kiragadhatnak egy keveset anélkül, hogy a rendszer térdre esne.
Az AMD Ryzen Threadripper Pro 3995WX processzorral a Lenovo ThinkStation P620 az eddigi leggyorsabb CPU-t kínálja a többmagos optimalizált alkalmazásokhoz.
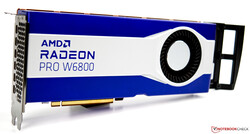
De a beépített grafikus kártya is elengedhetetlen egy munkaállomáshoz. Esetünkben a Lenovo ThinkStation P620 a vadonatúj AMD Radeon Pro W6800-nak ad otthont 32 GB GDDR6 VRAM-mal. Ez a GPU a legújabb RDNA2 architektúrán alapul, amelyet már ismerhetünk a 6000-es sorozatú gamer grafikus kártyákból. A valós idejű ray tracing mostantól natívan támogatott. Ez azt jelenti, hogy az adott munkaterhelések most már sokkal gyorsabban feldolgozhatóak, mint korábban. A virtuális munkaterület szinte korlátlanul bővíthető, akár hat kijelzővel. Alternatívaként az AMD Radeon Pro W6800 két egyidejű, natív 8K-s panelt is támogat.
A Lenovo a munkaállomás PC-k széles választékát kínálja. A gyártó emellett számos konfigurációs lehetőséget biztosít, hogy a PC-t a felhasználó igényeihez igazítsa. Jó 13 000 eurós árával a mi példányunk biztosan nem számít olcsónak. Az Amazonon például csak a CPU jelenleg legalább 5000 dollárba kerül. Aki tényleg mindent ki akar tolni a maximumig, az könnyen egy 30 000 euró feletti árú munkaállomás PC-vel végezheti.


