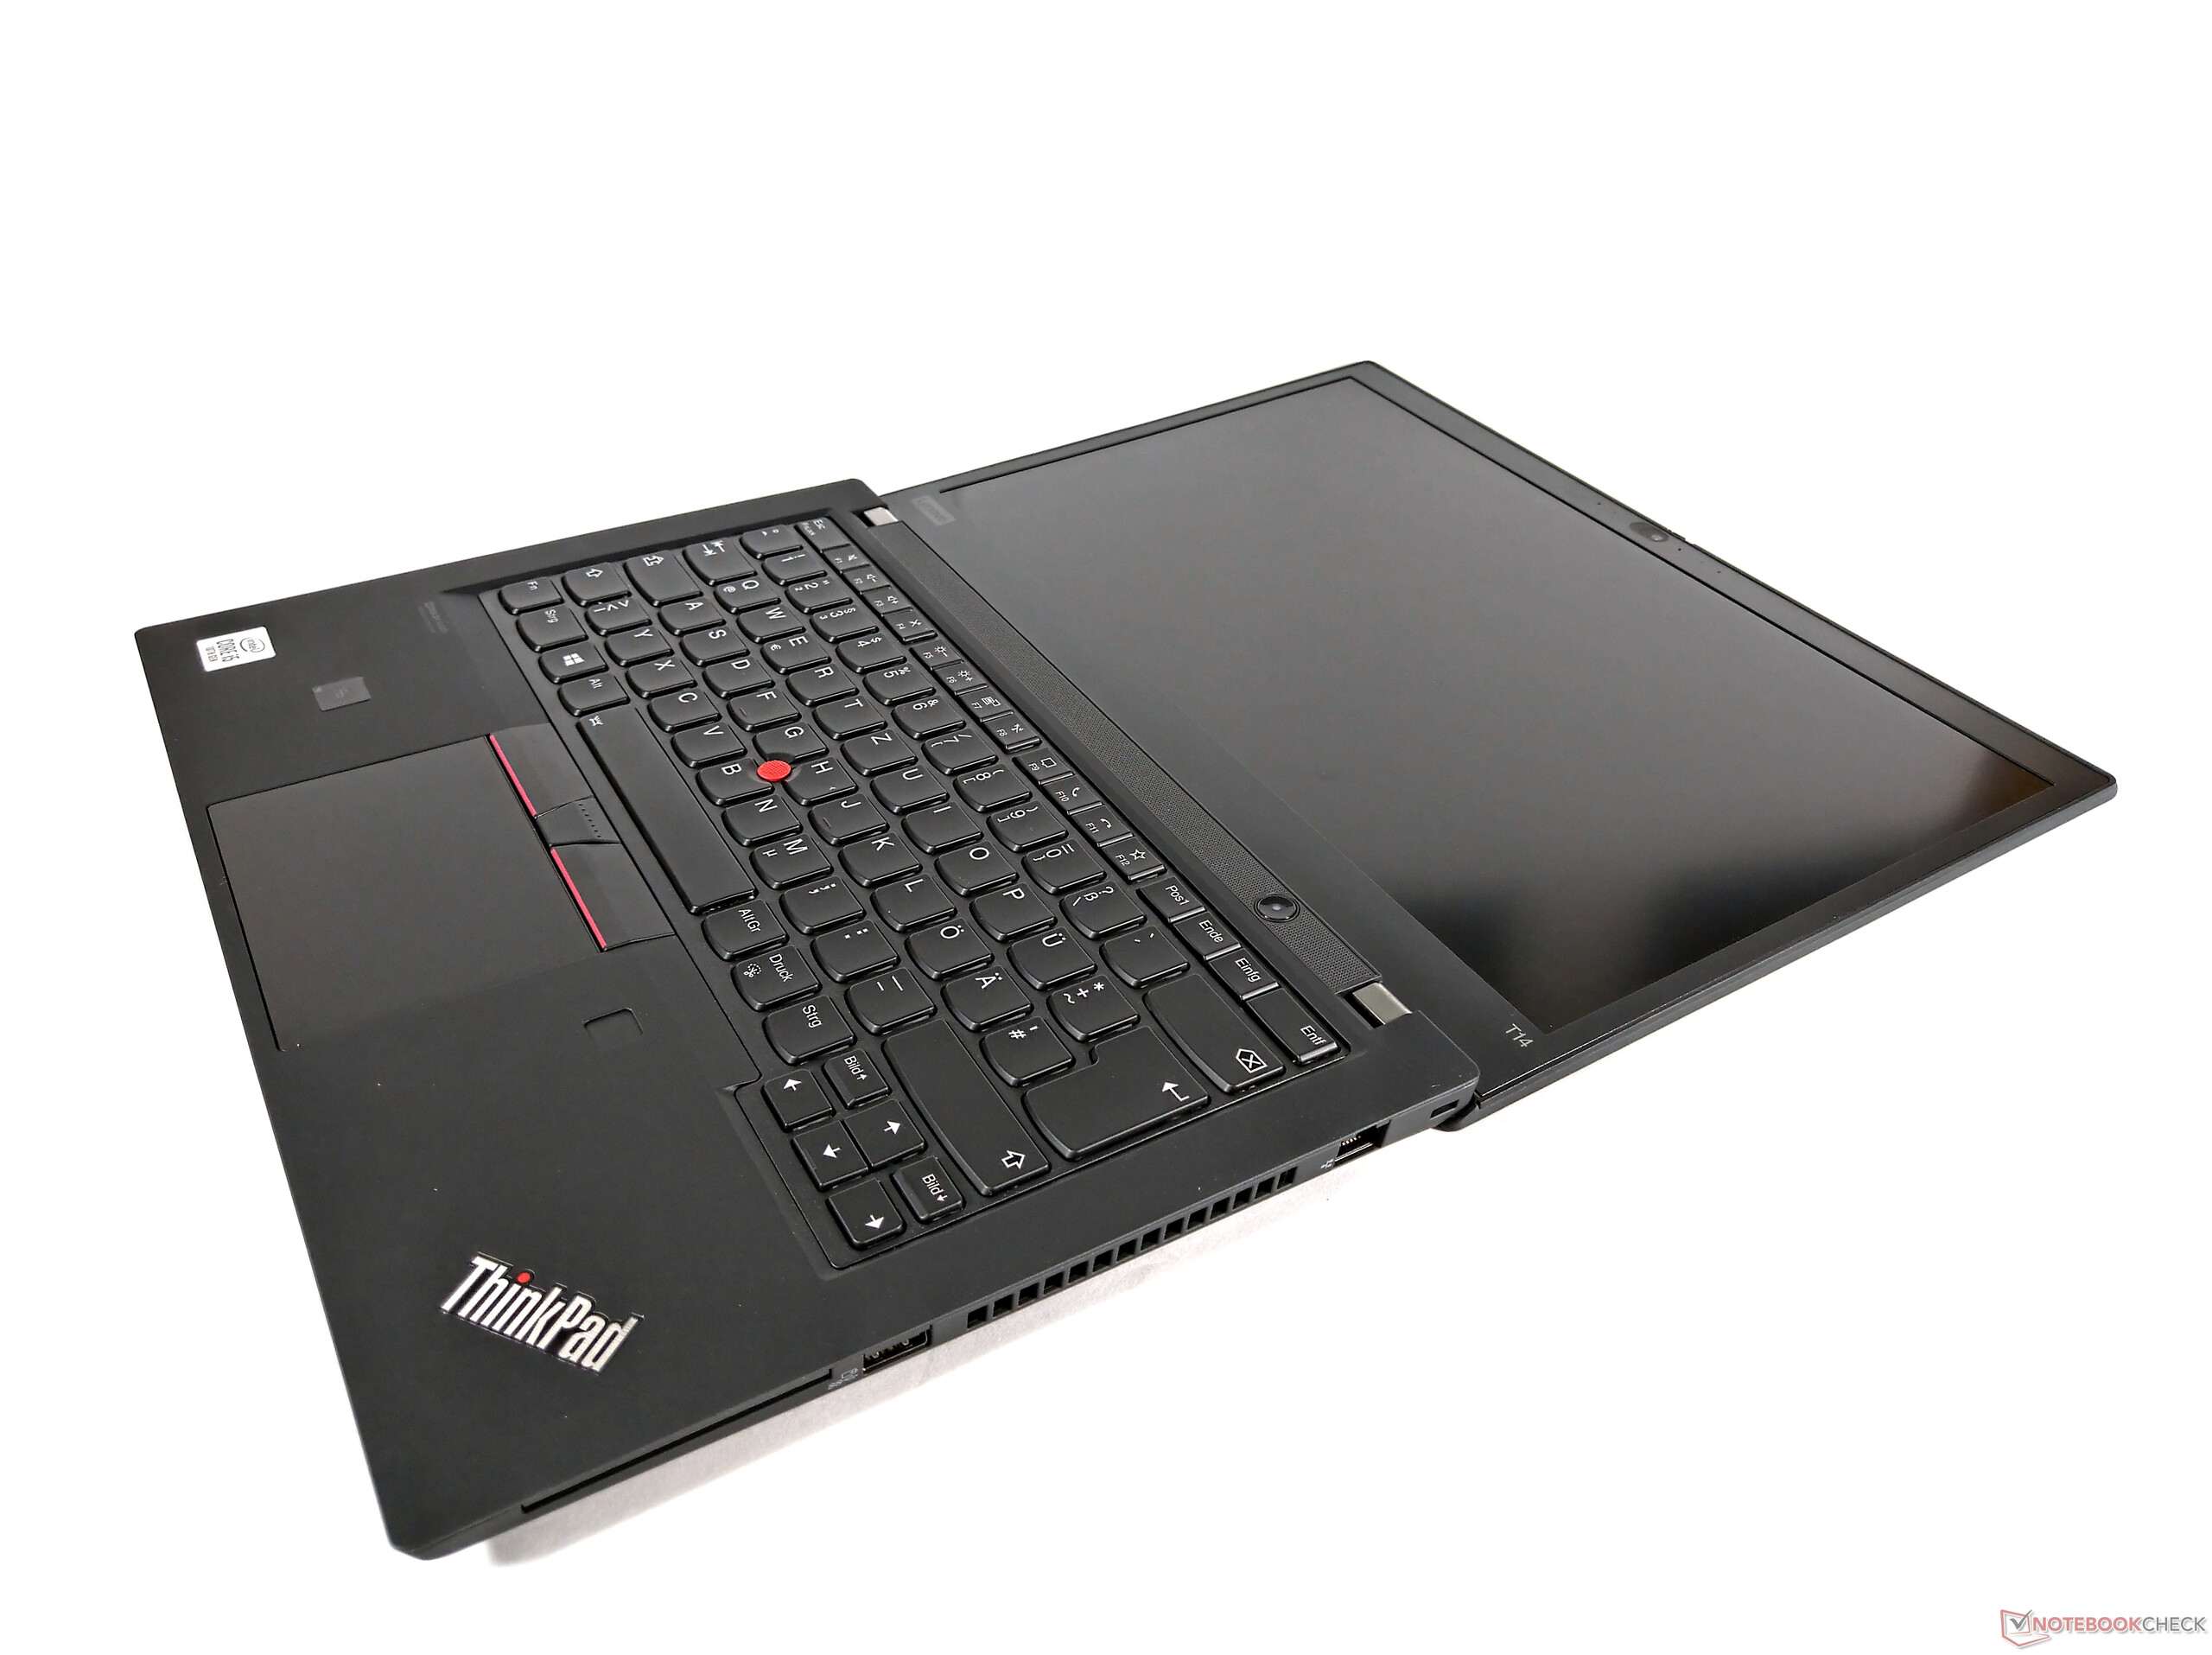
Lenovo ThinkPad T14 Laptop rövid értékelés: A Comet Lake frissítés nem nyújt sokat
Értékelés | Dátum | Modell | Súly | Magasság | Méret | Felbontás | Legjobb ár |
|---|---|---|---|---|---|---|---|
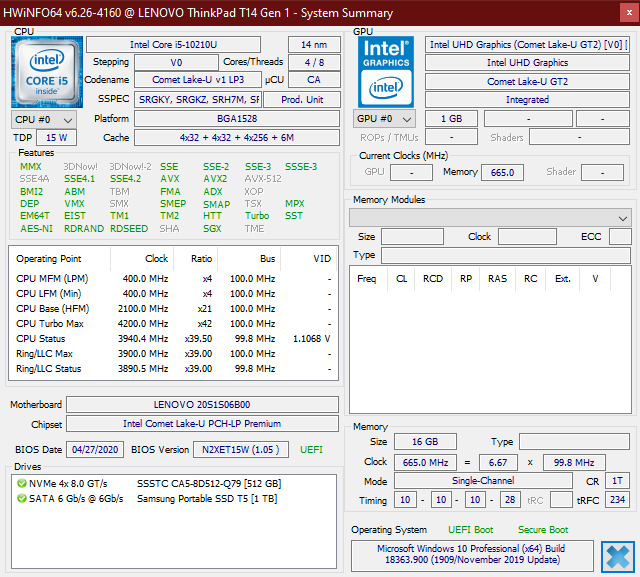
| 88 % v7 (old) | 08/2020 | Lenovo ThinkPad T14-20S1S06B00 i5-10210U, UHD Graphics 620 | 1.5 kg | 17.9 mm | 14.00" | 1920x1080 | |
| 87.9 % v7 (old) | 08/2019 | Lenovo ThinkPad T490-20N2004EGE i5-8265U, UHD Graphics 620 | 1.4 kg | 17.9 mm | 14.00" | 1920x1080 | |
| 87.2 % v7 (old) | 08/2019 | Dell Latitude 7400-8N6DH i7-8665U, UHD Graphics 620 | 1.5 kg | 18.9 mm | 14.00" | 1920x1080 | |
| 87.8 % v7 (old) | 06/2018 | HP EliteBook 840 G5-3JX61EA i5-8550U, UHD Graphics 620 | 1.5 kg | 17.9 mm | 14.00" | 1920x1080 | |
| 89.3 % v7 (old) | 06/2019 | Lenovo ThinkPad T490s-20NYS02A00 i5-8265U, UHD Graphics 620 | 1.3 kg | 16.1 mm | 14.00" | 1920x1080 |

| SD Card Reader | |
| average JPG Copy Test (av. of 3 runs) | |
| Dell Latitude 7400-8N6DH (Toshiba Exceria Pro M501 64 GB UHS-II) | |
| Lenovo ThinkPad T14-20S1S06B00 (Toshiba Exceria Pro M501 64 GB UHS-II) | |
| Lenovo ThinkPad T490 20RY0002US (Toshiba Exceria Pro M501 64 GB UHS-II) | |
| Lenovo ThinkPad T490s-20NYS02A00 (Toshiba Exceria Pro M501) | |
| Az osztály átlaga Office (22.4 - 198.5, n=22, az elmúlt 2 évben) | |
| maximum AS SSD Seq Read Test (1GB) | |
| Dell Latitude 7400-8N6DH (Toshiba Exceria Pro M501 64 GB UHS-II) | |
| Lenovo ThinkPad T490s-20NYS02A00 (Toshiba Exceria Pro M501) | |
| Lenovo ThinkPad T490 20RY0002US (Toshiba Exceria Pro M501 64 GB UHS-II) | |
| Lenovo ThinkPad T14-20S1S06B00 (Toshiba Exceria Pro M501 64 GB UHS-II) | |
| Az osztály átlaga Office (27.4 - 249, n=20, az elmúlt 2 évben) | |


| |||||||||||||||||||||||||
Fényerő megoszlás: 90 %
Centrumban: 398 cd/m²
Kontraszt: 1985:1 (Fekete: 0.2 cd/m²)
ΔE ColorChecker Calman: 3.6 | ∀{0.5-29.43 Ø4.73}
calibrated: 1.2
ΔE Greyscale Calman: 3.9 | ∀{0.09-98 Ø4.97}
96.6% sRGB (Argyll 1.6.3 3D)
61.4% AdobeRGB 1998 (Argyll 1.6.3 3D)
67.1% AdobeRGB 1998 (Argyll 3D)
96.8% sRGB (Argyll 3D)
66% Display P3 (Argyll 3D)
Gamma: 2.48
CCT: 7090 K
| Lenovo ThinkPad T14-20S1S06B00 B140HAN05.7, LTPS IPS LED, 1920x1080, 14" | Lenovo ThinkPad T490-20N2004EGE NE140FHM-N61, IGZO IPS LED, 1920x1080, 14" | Dell Latitude 7400-8N6DH AU Optronics B140HAN, IPS, 1920x1080, 14" | HP EliteBook 840 G5-3JX61EA IVO M140NVF7 R0, IPS, 1920x1080, 14" | Lenovo ThinkPad T490s-20NYS02A00 B140HAN05.7, IPS, 1920x1080, 14" | |
|---|---|---|---|---|---|
| Display | 0% | -0% | -8% | 2% | |
| Display P3 Coverage (%) | 66 | 69.2 5% | 66.1 0% | 61 -8% | 67.1 2% |
| sRGB Coverage (%) | 96.8 | 92.3 -5% | 95.3 -2% | 87.7 -9% | 97.6 1% |
| AdobeRGB 1998 Coverage (%) | 67.1 | 67.6 1% | 67.5 1% | 62.1 -7% | 68.5 2% |
| Response Times | -46% | -24% | 23% | -26% | |
| Response Time Grey 50% / Grey 80% * (ms) | 58.4 ? | 71.2 ? -22% | 62 ? -6% | 33 ? 43% | 61.6 ? -5% |
| Response Time Black / White * (ms) | 26.4 ? | 44.8 ? -70% | 37.6 ? -42% | 26 ? 2% | 38.8 ? -47% |
| PWM Frequency (Hz) | 2427 ? | 3125 ? | |||
| Screen | -22% | -18% | -22% | -0% | |
| Brightness middle (cd/m²) | 397 | 428 8% | 289 -27% | 655 65% | 391 -2% |
| Brightness (cd/m²) | 394 | 409 4% | 286 -27% | 630 60% | 389 -1% |
| Brightness Distribution (%) | 90 | 91 1% | 91 1% | 93 3% | 87 -3% |
| Black Level * (cd/m²) | 0.2 | 0.29 -45% | 0.16 20% | 0.56 -180% | 0.23 -15% |
| Contrast (:1) | 1985 | 1476 -26% | 1806 -9% | 1170 -41% | 1700 -14% |
| Colorchecker dE 2000 * | 3.6 | 4.6 -28% | 4.7 -31% | 3.27 9% | 3.4 6% |
| Colorchecker dE 2000 max. * | 5.9 | 8.2 -39% | 8.7 -47% | 5.92 -0% | 4.7 20% |
| Colorchecker dE 2000 calibrated * | 1.2 | 2 -67% | 1.3 -8% | 3.22 -168% | 1.1 8% |
| Greyscale dE 2000 * | 3.9 | 5.4 -38% | 6.4 -64% | 2.85 27% | 4 -3% |
| Gamma | 2.48 89% | 2.09 105% | 2.54 87% | 2.45 90% | 2.49 88% |
| CCT | 7090 92% | 7562 86% | 5977 109% | 6065 107% | 6809 95% |
| Color Space (Percent of AdobeRGB 1998) (%) | 61.4 | 60 -2% | 61.2 0% | 57 -7% | 62.4 2% |
| Color Space (Percent of sRGB) (%) | 96.6 | 92.2 -5% | 95.1 -2% | 88 -9% | 97.4 1% |
| Teljes átlag (program / beállítások) | -23% /
-21% | -14% /
-15% | -2% /
-14% | -8% /
-3% |
* ... a kisebb jobb
Megjelenítési válaszidők
| ↔ Válaszidő Fekete-fehér | ||
|---|---|---|
| 26.4 ms ... emelkedés és süllyedés ↘ kombinálva | ↗ 12.4 ms emelkedés | 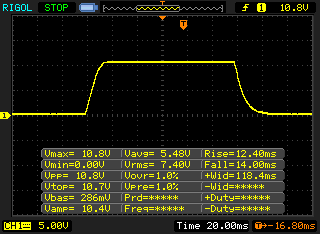 |
| ↘ 14 ms ősz | ||
| A képernyő viszonylag lassú reakciósebességet mutat tesztjeinkben, és túl lassú lehet a játékosok számára. Összehasonlításképpen, az összes tesztelt eszköz 0.1 (minimum) és 240 (maximum) ms között mozog. » 66 % of all devices are better. Ez azt jelenti, hogy a mért válaszidő rosszabb, mint az összes vizsgált eszköz átlaga (19.9 ms). | ||
| ↔ Válaszidő 50% szürke és 80% szürke között | ||
| 58.4 ms ... emelkedés és süllyedés ↘ kombinálva | ↗ 28.4 ms emelkedés | 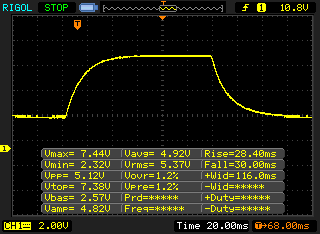 |
| ↘ 30 ms ősz | ||
| A képernyő lassú reakciósebességet mutat tesztjeinkben, és nem lesz kielégítő a játékosok számára. Összehasonlításképpen, az összes tesztelt eszköz 0.165 (minimum) és 636 (maximum) ms között mozog. » 95 % of all devices are better. Ez azt jelenti, hogy a mért válaszidő rosszabb, mint az összes vizsgált eszköz átlaga (31.1 ms). | ||
Képernyő villogása / PWM (impulzusszélesség-moduláció)
| Képernyő villogása / PWM nem érzékelhető | 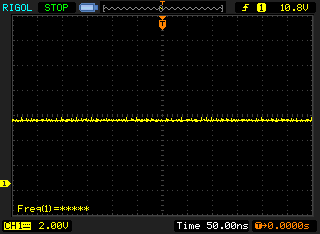 | ||
Összehasonlításképpen: az összes tesztelt eszköz 52 %-a nem használja a PWM-et a kijelző elsötétítésére. Ha PWM-et észleltek, akkor átlagosan 7798 (minimum: 5 - maximum: 343500) Hz-t mértek. | |||
Cinebench R20: CPU (Multi Core) | CPU (Single Core)
Blender: v2.79 BMW27 CPU
7-Zip 18.03: 7z b 4 -mmt1 | 7z b 4
Geekbench 5.5: Single-Core | Multi-Core
HWBOT x265 Benchmark v2.2: 4k Preset
LibreOffice : 20 Documents To PDF
R Benchmark 2.5: Overall mean
| Cinebench R15 / CPU Multi 64Bit | |
| Az osztály átlaga Office (250 - 3380, n=74, az elmúlt 2 évben) | |
| Lenovo ThinkPad T14-20S1S06B00 | |
| Lenovo ThinkPad T490s-20NYS02A00 | |
| Dell Latitude 7400-8N6DH | |
| Lenovo ThinkPad T490 20RY0002US | |
| Lenovo ThinkPad T490-20N2004EGE | |
| Átlagos Intel Core i5-10210U (320 - 790, n=35) | |
| HP EliteBook 840 G5-3JX61EA | |
| Cinebench R15 / CPU Single 64Bit | |
| Az osztály átlaga Office (99.5 - 312, n=74, az elmúlt 2 évben) | |
| Lenovo ThinkPad T490 20RY0002US | |
| Dell Latitude 7400-8N6DH | |
| HP EliteBook 840 G5-3JX61EA | |
| Lenovo ThinkPad T14-20S1S06B00 | |
| Átlagos Intel Core i5-10210U (134 - 174, n=35) | |
| Lenovo ThinkPad T490-20N2004EGE | |
| Lenovo ThinkPad T490s-20NYS02A00 | |
| Cinebench R20 / CPU (Multi Core) | |
| Az osztály átlaga Office (648 - 8840, n=72, az elmúlt 2 évben) | |
| Lenovo ThinkPad T490 20RY0002US | |
| Lenovo ThinkPad T490s-20NYS02A00 | |
| Dell Latitude 7400-8N6DH | |
| Lenovo ThinkPad T490-20N2004EGE | |
| Lenovo ThinkPad T14-20S1S06B00 | |
| Átlagos Intel Core i5-10210U (722 - 1820, n=30) | |
| Cinebench R20 / CPU (Single Core) | |
| Az osztály átlaga Office (345 - 816, n=72, az elmúlt 2 évben) | |
| Lenovo ThinkPad T490 20RY0002US | |
| Dell Latitude 7400-8N6DH | |
| Lenovo ThinkPad T14-20S1S06B00 | |
| Átlagos Intel Core i5-10210U (322 - 428, n=30) | |
| Lenovo ThinkPad T490s-20NYS02A00 | |
| Lenovo ThinkPad T490-20N2004EGE | |
| Blender / v2.79 BMW27 CPU | |
| Lenovo ThinkPad T490-20N2004EGE | |
| Átlagos Intel Core i5-10210U (585 - 1339, n=24) | |
| Lenovo ThinkPad T14-20S1S06B00 | |
| Lenovo ThinkPad T490s-20NYS02A00 | |
| Dell Latitude 7400-8N6DH | |
| Az osztály átlaga Office (158 - 1940, n=73, az elmúlt 2 évben) | |
| 7-Zip 18.03 / 7z b 4 -mmt1 | |
| Az osztály átlaga Office (3387 - 6469, n=74, az elmúlt 2 évben) | |
| Dell Latitude 7400-8N6DH | |
| Lenovo ThinkPad T14-20S1S06B00 | |
| Átlagos Intel Core i5-10210U (3504 - 4467, n=24) | |
| Lenovo ThinkPad T490s-20NYS02A00 | |
| Lenovo ThinkPad T490-20N2004EGE | |
| 7-Zip 18.03 / 7z b 4 | |
| Az osztály átlaga Office (7098 - 76886, n=75, az elmúlt 2 évben) | |
| Lenovo ThinkPad T490s-20NYS02A00 | |
| Dell Latitude 7400-8N6DH | |
| Lenovo ThinkPad T14-20S1S06B00 | |
| Átlagos Intel Core i5-10210U (10920 - 21679, n=24) | |
| Lenovo ThinkPad T490-20N2004EGE | |
| Geekbench 5.5 / Single-Core | |
| Az osztály átlaga Office (811 - 2128, n=71, az elmúlt 2 évben) | |
| Átlagos Intel Core i5-10210U (949 - 1133, n=27) | |
| Lenovo ThinkPad T14-20S1S06B00 | |
| Geekbench 5.5 / Multi-Core | |
| Az osztály átlaga Office (1483 - 16999, n=71, az elmúlt 2 évben) | |
| Átlagos Intel Core i5-10210U (2079 - 4256, n=27) | |
| Lenovo ThinkPad T14-20S1S06B00 | |
| HWBOT x265 Benchmark v2.2 / 4k Preset | |
| Az osztály átlaga Office (2.21 - 26, n=73, az elmúlt 2 évben) | |
| Lenovo ThinkPad T490s-20NYS02A00 | |
| Dell Latitude 7400-8N6DH | |
| Lenovo ThinkPad T14-20S1S06B00 | |
| Átlagos Intel Core i5-10210U (2.36 - 6.28, n=24) | |
| Lenovo ThinkPad T490-20N2004EGE | |
| LibreOffice / 20 Documents To PDF | |
| Átlagos Intel Core i5-10210U (49.6 - 80.3, n=18) | |
| Lenovo ThinkPad T14-20S1S06B00 | |
| Az osztály átlaga Office (41.5 - 102.3, n=73, az elmúlt 2 évben) | |
| R Benchmark 2.5 / Overall mean | |
| Átlagos Intel Core i5-10210U (0.658 - 0.901, n=24) | |
| Lenovo ThinkPad T14-20S1S06B00 | |
| Az osztály átlaga Office (0.4098 - 0.888, n=73, az elmúlt 2 évben) | |
* ... a kisebb jobb
| PCMark 8 | |
| Home Score Accelerated v2 | |
| Az osztály átlaga Office (n=1az elmúlt 2 évben) | |
| Lenovo ThinkPad T490s-20NYS02A00 | |
| HP EliteBook 840 G5-3JX61EA | |
| Lenovo ThinkPad T490 20RY0002US | |
| Átlagos Intel Core i5-10210U, Intel UHD Graphics 620 (3182 - 4284, n=21) | |
| Dell Latitude 7400-8N6DH | |
| Lenovo ThinkPad T14-20S1S06B00 | |
| Work Score Accelerated v2 | |
| Az osztály átlaga Office (n=1az elmúlt 2 évben) | |
| Lenovo ThinkPad T490 20RY0002US | |
| Dell Latitude 7400-8N6DH | |
| Lenovo ThinkPad T14-20S1S06B00 | |
| HP EliteBook 840 G5-3JX61EA | |
| Lenovo ThinkPad T490s-20NYS02A00 | |
| Átlagos Intel Core i5-10210U, Intel UHD Graphics 620 (4286 - 5114, n=21) | |
| PCMark 8 Home Score Accelerated v2 | 3544 pontok | |
| PCMark 8 Work Score Accelerated v2 | 5042 pontok | |
| PCMark 10 Score | 3932 pontok | |
Segítség | ||
| DPC Latencies / LatencyMon - interrupt to process latency (max), Web, Youtube, Prime95 | |
| Lenovo ThinkPad T14-20S1S06B00 | |
* ... a kisebb jobb
| Lenovo ThinkPad T14-20S1S06B00 Lite-On CA5-8D512 | Lenovo ThinkPad T490-20N2004EGE Toshiba KXG5AZNV256G | Dell Latitude 7400-8N6DH Samsung SSD PM981 MZVLB512HAJQ | HP EliteBook 840 G5-3JX61EA Toshiba KXG50ZNV1T02 | Lenovo ThinkPad T490s-20NYS02A00 Intel SSD Pro 7600p SSDPEKKF512G8L | Átlagos Lite-On CA5-8D512 | |
|---|---|---|---|---|---|---|
| CrystalDiskMark 5.2 / 6 | -16% | -3% | -23% | -12% | 13% | |
| Write 4K (MB/s) | 114.1 | 119.9 5% | 118.6 4% | 96.1 -16% | 122 7% | 132.9 ? 16% |
| Read 4K (MB/s) | 53.6 | 39.94 -25% | 44.68 -17% | 31.12 -42% | 45.56 -15% | 55 ? 3% |
| Write Seq (MB/s) | 1743 | 1334 -23% | 1866 7% | 919 -47% | 1497 -14% | 2155 ? 24% |
| Read Seq (MB/s) | 2092 | 1357 -35% | 2173 4% | 2089 0% | 2385 14% | 2264 ? 8% |
| Write 4K Q32T1 (MB/s) | 394.8 | 311.2 -21% | 330.9 -16% | 425.6 8% | 240.9 -39% | 470 ? 19% |
| Read 4K Q32T1 (MB/s) | 372.6 | 400.6 8% | 343.1 -8% | 275.3 -26% | 338 -9% | 500 ? 34% |
| Write Seq Q32T1 (MB/s) | 2176 | 1642 -25% | 1927 -11% | 958 -56% | 1528 -30% | 2217 ? 2% |
| Read Seq Q32T1 (MB/s) | 3204 | 2778 -13% | 3528 10% | 3118 -3% | 2915 -9% | 3228 ? 1% |

| 3DMark 11 - 1280x720 Performance GPU | |
| Az osztály átlaga Office (2551 - 18313, n=68, az elmúlt 2 évben) | |
| Lenovo ThinkPad T490 20RY0002US | |
| HP EliteBook 840 G5-3JX61EA | |
| Lenovo ThinkPad T490s-20NYS02A00 | |
| Dell Latitude 7400-8N6DH | |
| Lenovo ThinkPad T14-20S1S06B00 | |
| Átlagos Intel UHD Graphics 620 (1144 - 3432, n=244) | |
| 3DMark | |
| 1280x720 Cloud Gate Standard Graphics | |
| Az osztály átlaga Office (11640 - 118515, n=37, az elmúlt 2 évben) | |
| Lenovo ThinkPad T490s-20NYS02A00 | |
| Lenovo ThinkPad T490 20RY0002US | |
| HP EliteBook 840 G5-3JX61EA | |
| Dell Latitude 7400-8N6DH | |
| Átlagos Intel UHD Graphics 620 (6205 - 16400, n=225) | |
| Lenovo ThinkPad T14-20S1S06B00 | |
| 1920x1080 Fire Strike Graphics | |
| Az osztály átlaga Office (736 - 21871, n=72, az elmúlt 2 évben) | |
| Lenovo ThinkPad T490 20RY0002US | |
| HP EliteBook 840 G5-3JX61EA | |
| Lenovo ThinkPad T490s-20NYS02A00 | |
| Dell Latitude 7400-8N6DH | |
| Átlagos Intel UHD Graphics 620 (557 - 2608, n=213) | |
| Lenovo ThinkPad T14-20S1S06B00 | |
| 2560x1440 Time Spy Graphics | |
| Az osztály átlaga Office (493 - 6679, n=67, az elmúlt 2 évben) | |
| Lenovo ThinkPad T490 20RY0002US | |
| Dell Latitude 7400-8N6DH | |
| Átlagos Intel UHD Graphics 620 (299 - 797, n=88) | |
| Lenovo ThinkPad T14-20S1S06B00 | |
| 3DMark 11 Performance | 1926 pontok | |
| 3DMark Cloud Gate Standard Score | 7581 pontok | |
| 3DMark Fire Strike Score | 963 pontok | |
| 3DMark Time Spy Score | 410 pontok | |
Segítség | ||
| alacsony | közepes | magas | ultra | |
|---|---|---|---|---|
| The Witcher 3 (2015) | 15.5 | |||
| Dota 2 Reborn (2015) | 69.4 | 39.1 | 18.8 | 16.2 |
| X-Plane 11.11 (2018) | 12.8 | 11 | 10.8 | |
| Shadow of the Tomb Raider (2018) | 13 | |||
| Total War: Three Kingdoms (2019) | 23.7 |
Zajszint
| Üresjárat |
| 29.6 / 29.6 / 29.6 dB(A) |
| Terhelés |
| 33.5 / 33.5 dB(A) |
 | ||
30 dB csendes 40 dB(A) hallható 50 dB(A) hangos |
||
min: | ||
(-) A felső oldalon a maximális hőmérséklet 53 °C / 127 F, összehasonlítva a 34.3 °C / 94 F átlagával , 21.2 és 62.5 °C között a Office osztálynál.
(-) Az alsó maximum 67.2 °C / 153 F-ig melegszik fel, összehasonlítva a 36.8 °C / 98 F átlagával
(+) Üresjáratban a felső oldal átlagos hőmérséklete 25.4 °C / 78 F, összehasonlítva a 29.5 °C / ### eszközátlaggal class_avg_f### F.
(+) A csuklótámasz és az érintőpad eléri a bőr maximális hőmérsékletét (34.7 °C / 94.5 F), ezért nem forrók.
(-) A hasonló eszközök csuklótámasz területének átlagos hőmérséklete 27.5 °C / 81.5 F volt (-7.2 °C / -13 F).
Lenovo ThinkPad T14-20S1S06B00 hangelemzés
(-) | nem túl hangos hangszórók (70.6 dB)
Basszus 100 - 315 Hz
(±) | csökkentett basszus – átlagosan 12.6%-kal alacsonyabb, mint a medián
(±) | a basszus linearitása átlagos (12.5% delta az előző frekvenciához)
Közepes 400-2000 Hz
(±) | magasabb középértékek – átlagosan 7.7%-kal magasabb, mint a medián
(+) | a középpontok lineárisak (6.7% delta az előző frekvenciához)
Maximum 2-16 kHz
(+) | kiegyensúlyozott csúcsok – csak 2.9% választja el a mediántól
(+) | a csúcsok lineárisak (5.8% delta az előző frekvenciához képest)
Összességében 100 - 16.000 Hz
(±) | az általános hang linearitása átlagos (24.5% eltérés a mediánhoz képest)
Ugyanazon osztályhoz képest
» 71%Ebben az osztályban az összes tesztelt eszköz %-a jobb volt, 8% hasonló, 21%-kal rosszabb
» A legjobb delta értéke 7%, az átlag 21%, a legrosszabb 53% volt
Az összes tesztelt eszközzel összehasonlítva
» 74% az összes tesztelt eszköz jobb volt, 6% hasonló, 20%-kal rosszabb
» A legjobb delta értéke 4%, az átlag 24%, a legrosszabb 134% volt
Lenovo ThinkPad T490-20N3S02L00 hangelemzés
(-) | nem túl hangos hangszórók (70.9 dB)
Basszus 100 - 315 Hz
(-) | szinte nincs basszus – átlagosan 20.8%-kal alacsonyabb a mediánnál
(±) | a basszus linearitása átlagos (8.7% delta az előző frekvenciához)
Közepes 400-2000 Hz
(±) | magasabb középértékek – átlagosan 5.5%-kal magasabb, mint a medián
(±) | a középpontok linearitása átlagos (8.8% delta az előző gyakorisághoz)
Maximum 2-16 kHz
(+) | kiegyensúlyozott csúcsok – csak 3.4% választja el a mediántól
(±) | a csúcsok linearitása átlagos (7.3% delta az előző gyakorisághoz)
Összességében 100 - 16.000 Hz
(±) | az általános hang linearitása átlagos (28.9% eltérés a mediánhoz képest)
Ugyanazon osztályhoz képest
» 90%Ebben az osztályban az összes tesztelt eszköz %-a jobb volt, 2% hasonló, 8%-kal rosszabb
» A legjobb delta értéke 7%, az átlag 21%, a legrosszabb 53% volt
Az összes tesztelt eszközzel összehasonlítva
» 87% az összes tesztelt eszköz jobb volt, 2% hasonló, 11%-kal rosszabb
» A legjobb delta értéke 4%, az átlag 24%, a legrosszabb 134% volt
| Kikapcsolt állapot / Készenlét | |
| Üresjárat | |
| Terhelés |
|
Kulcs:
min: | |
| Lenovo ThinkPad T14-20S1S06B00 i5-10210U, UHD Graphics 620, Lite-On CA5-8D512, LTPS IPS LED, 1920x1080, 14" | Lenovo ThinkPad T490-20N2004EGE i5-8265U, UHD Graphics 620, Toshiba KXG5AZNV256G, IGZO IPS LED, 1920x1080, 14" | Dell Latitude 7400-8N6DH i7-8665U, UHD Graphics 620, Samsung SSD PM981 MZVLB512HAJQ, IPS, 1920x1080, 14" | HP EliteBook 840 G5-3JX61EA i5-8550U, UHD Graphics 620, Toshiba KXG50ZNV1T02, IPS, 1920x1080, 14" | Lenovo ThinkPad T490s-20NYS02A00 i5-8265U, UHD Graphics 620, Intel SSD Pro 7600p SSDPEKKF512G8L, IPS, 1920x1080, 14" | Átlagos Intel UHD Graphics 620 | Az osztály átlaga Office | |
|---|---|---|---|---|---|---|---|
| Power Consumption | 22% | 1% | 2% | 14% | 7% | -5% | |
| Idle Minimum * (Watt) | 3.2 | 2.34 27% | 3.9 -22% | 3.8 -19% | 2.62 18% | 3.81 ? -19% | 4.4 ? -38% |
| Idle Average * (Watt) | 6.1 | 5.22 14% | 6.1 -0% | 8.3 -36% | 5.16 15% | 6.94 ? -14% | 7.32 ? -20% |
| Idle Maximum * (Watt) | 10.4 | 8.82 15% | 8.2 21% | 10.7 -3% | 8.7 16% | 8.75 ? 16% | 8.56 ? 18% |
| Load Average * (Watt) | 45.6 | 35.8 21% | 41 10% | 35.5 22% | 40 12% | 35 ? 23% | 42.5 ? 7% |
| Load Maximum * (Watt) | 68.6 | 47.3 31% | 69.7 -2% | 37 46% | 64 7% | 47.5 ? 31% | 64.1 ? 7% |
* ... a kisebb jobb
| Lenovo ThinkPad T14-20S1S06B00 i5-10210U, UHD Graphics 620, 50 Wh | Lenovo ThinkPad T490-20N2004EGE i5-8265U, UHD Graphics 620, 50 Wh | Dell Latitude 7400-8N6DH i7-8665U, UHD Graphics 620, 60 Wh | HP EliteBook 840 G5-3JX61EA i5-8550U, UHD Graphics 620, 50 Wh | Lenovo ThinkPad T490s-20NYS02A00 i5-8265U, UHD Graphics 620, 57 Wh | Az osztály átlaga Office | |
|---|---|---|---|---|---|---|
| Akkumulátor üzemidő | 34% | 43% | -33% | 19% | 33% | |
| H.264 (h) | 10.4 | 11.3 9% | 14.4 38% | 13.9 34% | 15 ? 44% | |
| WiFi v1.3 (h) | 11 | 9.5 -14% | 11.6 5% | 7.4 -33% | 10.1 -8% | 12.9 ? 17% |
| Load (h) | 1.3 | 2.7 108% | 2.4 85% | 1.7 31% | 1.807 ? 39% |
Pro
Kontra
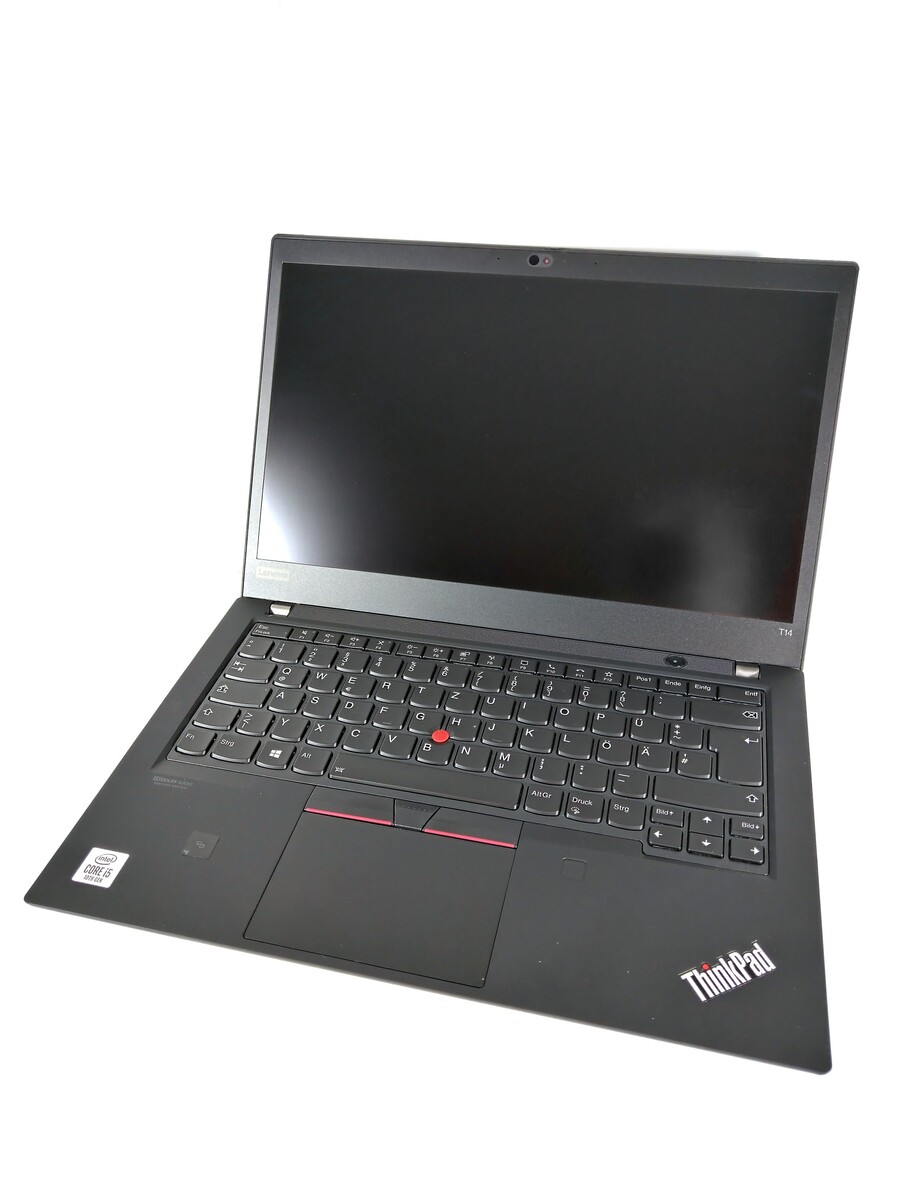

Más néven, de egyébként ugyanaz: A Lenovo ThinkPad T14 Gen 1 csak egy apró frissítése a ThinkPad T490-nek. Valóban történt néhány fejlesztés, de felmerül a kérdés, hogy van-e értelme.
Megtaláljuk benne a ThinkPad T490 erősségeit, de persze a gyenge pontjait is. Ide tartozik a Thunderbolt csatlakozás csak két PCIe sínnel, a hiányzó teljes méretű SD kártyanyílás és a nehezen felnyitható ház. Ami a laptop erősségeit illeti, azok a ház, a bemeneti eszközök, a csatlakozási lehetőségek, a kijelző és a garancia. A pozitív változások közé tartoznak a jobb hangszórók és a most még csendesebb ventilátor.
Mindenesetre az alacsony zajszint előnyösnek tekinthető. De ugyanakkor ezt negatívumként is felfoghatjuk, mivel a ThinkPad T14 2020-nak gondja van a hővel. Az alján mért több mint 65 °C a stressz teszt során egyszerűen túl sok (és ez az iGPU modell!). Egy másik lényeges pont a CPU teljesítmény, amely alig javult, sőt, bizonyos mértékben még romlott is. Felmerül a kérdés, hogy egyáltalán miért is válasszuk az új Intel ThinkPad-et.
A Lenovo ThinkPad T14 aligha ad okot arra, hogy miért kellene előnyben részesíteni az elődjéhez képest.
Az Intel Comet Lake CPU-val felszerelt ThinkPad T14-et vegyük meg? Ha az AMD modell jóval gyorsabbnak bizonyul, akkor a válasz nem. Egyedül a Thunderbolt 3 és az opcionális 4K UHD kijelző miatt van értelme az Intel modellnek. Ellenkező esetben a következő alkalmazandó: Valószínűleg az AMD a jobbik választás ebben az évben, mivel a Wi-Fi 6-ot leszámítva a Comet Lake nem ad túl sok okot a frissítésre.
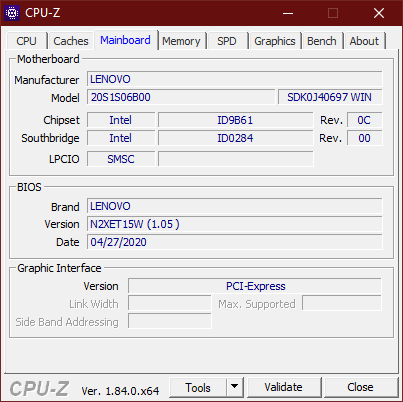
Lenovo ThinkPad T14-20S1S06B00
- 07/01/2020 v7 (old)
Benjamin Herzig
Price comparison

