Lenovo ThinkPad E14 Laptop rövid értékelés: Vékony kialakítás a bővíthetőséggel szemben
Értékelés | Dátum | Modell | Súly | Magasság | Méret | Felbontás | Legjobb ár |
|---|---|---|---|---|---|---|---|
| 84.5 % v7 (old) | 04/2020 | Lenovo ThinkPad E14 20RA001MGE i5-10210U, UHD Graphics 620 | 1.6 kg | 17.9 mm | 14.00" | 1920x1080 | |
| 85.9 % v7 (old) | 08/2019 | Lenovo ThinkPad E490-20N8000RGE i5-8265U, UHD Graphics 620 | 1.8 kg | 19.9 mm | 14.00" | 1920x1080 | |
| 80.9 % v7 (old) | MSI Modern 14 A10RB-459US i5-10210U, GeForce MX250 | 1.2 kg | 16 mm | 14.00" | 1920x1080 | ||
| 83 % v7 (old) | Dell Latitude 3400 i3-8145U, UHD Graphics 620 | 1.7 kg | 18.65 mm | 14.00" | 1920x1080 | ||
| 87.9 % v7 (old) | 08/2019 | Lenovo ThinkPad T490-20N2004EGE i5-8265U, UHD Graphics 620 | 1.4 kg | 17.9 mm | 14.00" | 1920x1080 |

| Networking | |
| iperf3 transmit AX12 | |
| Lenovo ThinkPad E490-20N8000RGE | |
| Lenovo ThinkPad T490-20N2004EGE | |
| Dell Latitude 3400 | |
| Lenovo ThinkPad E14 20RA001MGE | |
| iperf3 receive AX12 | |
| Lenovo ThinkPad E14 20RA001MGE | |
| Dell Latitude 3400 | |
| Lenovo ThinkPad T490-20N2004EGE | |
| Lenovo ThinkPad E490-20N8000RGE | |
| |||||||||||||||||||||||||
Fényerő megoszlás: 89 %
Centrumban: 308 cd/m²
Kontraszt: 1794:1 (Fekete: 0.17 cd/m²)
ΔE ColorChecker Calman: 5.9 | ∀{0.5-29.43 Ø4.72}
calibrated: 4.6
ΔE Greyscale Calman: 4.4 | ∀{0.09-98 Ø4.97}
59.6% sRGB (Argyll 1.6.3 3D)
38.2% AdobeRGB 1998 (Argyll 1.6.3 3D)
41.65% AdobeRGB 1998 (Argyll 3D)
60% sRGB (Argyll 3D)
40.31% Display P3 (Argyll 3D)
Gamma: 2.05
CCT: 6921 K
| Lenovo ThinkPad E14 20RA001MGE NV140FHM-N48, IPS LED, 1920x1080, 14" | Lenovo ThinkPad E490-20N8000RGE Lenovo NV140FHM-N49, IPS, 1920x1080, 14" | MSI Modern 14 A10RB-459US Chi Mei N140HCE-EN2, IPS, 1920x1080, 14" | Dell Latitude 3400 BOE NV14N4H, IPS, 1920x1080, 14" | Lenovo ThinkPad T490-20N2004EGE NE140FHM-N61, IGZO IPS LED, 1920x1080, 14" | |
|---|---|---|---|---|---|
| Display | -1% | 58% | 0% | 63% | |
| Display P3 Coverage (%) | 40.31 | 39.85 -1% | 64.2 59% | 40.68 1% | 69.2 72% |
| sRGB Coverage (%) | 60 | 58.6 -2% | 94.8 58% | 59.3 -1% | 92.3 54% |
| AdobeRGB 1998 Coverage (%) | 41.65 | 41.18 -1% | 65.4 57% | 42.03 1% | 67.6 62% |
| Response Times | 5% | 17% | 4% | -26% | |
| Response Time Grey 50% / Grey 80% * (ms) | 52 ? | 48.4 ? 7% | 39.2 ? 25% | 44 ? 15% | 71.2 ? -37% |
| Response Time Black / White * (ms) | 39.2 ? | 38.4 ? 2% | 35.6 ? 9% | 42 ? -7% | 44.8 ? -14% |
| PWM Frequency (Hz) | 1250 ? | 1250 ? | 25000 ? | 1000 ? | 2427 ? |
| Screen | -1% | 31% | -16% | 20% | |
| Brightness middle (cd/m²) | 305 | 305 0% | 324.1 6% | 240 -21% | 428 40% |
| Brightness (cd/m²) | 292 | 295 1% | 301 3% | 227 -22% | 409 40% |
| Brightness Distribution (%) | 89 | 90 1% | 87 -2% | 79 -11% | 91 2% |
| Black Level * (cd/m²) | 0.17 | 0.23 -35% | 0.22 -29% | 0.48 -182% | 0.29 -71% |
| Contrast (:1) | 1794 | 1326 -26% | 1473 -18% | 500 -72% | 1476 -18% |
| Colorchecker dE 2000 * | 5.9 | 5.3 10% | 1.63 72% | 4.2 29% | 4.6 22% |
| Colorchecker dE 2000 max. * | 18.4 | 18.9 -3% | 4.25 77% | 7.16 61% | 8.2 55% |
| Colorchecker dE 2000 calibrated * | 4.6 | 5 -9% | 1.42 69% | 2 57% | |
| Greyscale dE 2000 * | 4.4 | 2.3 48% | 2.2 50% | 1.75 60% | 5.4 -23% |
| Gamma | 2.05 107% | 2.09 105% | 2.26 97% | 2.36 93% | 2.09 105% |
| CCT | 6921 94% | 6246 104% | 6887 94% | 6387 102% | 7562 86% |
| Color Space (Percent of AdobeRGB 1998) (%) | 38.2 | 37.7 -1% | 60.2 58% | 38 -1% | 60 57% |
| Color Space (Percent of sRGB) (%) | 59.6 | 58.2 -2% | 95 59% | 59 -1% | 92.2 55% |
| Teljes átlag (program / beállítások) | 1% /
-1% | 35% /
35% | -4% /
-10% | 19% /
22% |
* ... a kisebb jobb
Megjelenítési válaszidők
| ↔ Válaszidő Fekete-fehér | ||
|---|---|---|
| 39.2 ms ... emelkedés és süllyedés ↘ kombinálva | ↗ 22 ms emelkedés | 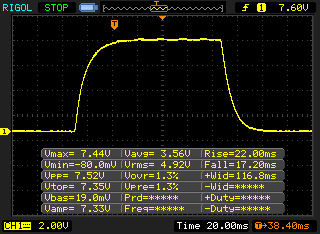 |
| ↘ 17.2 ms ősz | ||
| A képernyő lassú reakciósebességet mutat tesztjeinkben, és nem lesz kielégítő a játékosok számára. Összehasonlításképpen, az összes tesztelt eszköz 0.1 (minimum) és 240 (maximum) ms között mozog. » 97 % of all devices are better. Ez azt jelenti, hogy a mért válaszidő rosszabb, mint az összes vizsgált eszköz átlaga (19.8 ms). | ||
| ↔ Válaszidő 50% szürke és 80% szürke között | ||
| 52 ms ... emelkedés és süllyedés ↘ kombinálva | ↗ 26 ms emelkedés | 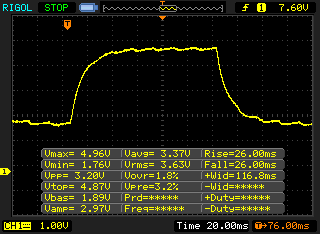 |
| ↘ 26 ms ősz | ||
| A képernyő lassú reakciósebességet mutat tesztjeinkben, és nem lesz kielégítő a játékosok számára. Összehasonlításképpen, az összes tesztelt eszköz 0.165 (minimum) és 636 (maximum) ms között mozog. » 88 % of all devices are better. Ez azt jelenti, hogy a mért válaszidő rosszabb, mint az összes vizsgált eszköz átlaga (31 ms). | ||
Képernyő villogása / PWM (impulzusszélesség-moduláció)
| Képernyő villogása / PWM észlelve | 1250 Hz | ≤ 99 % fényerő beállítása | 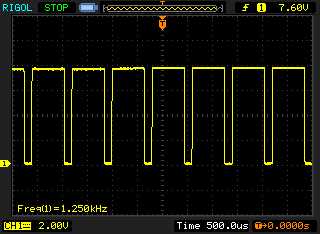 |
A kijelző háttérvilágítása 1250 Hz-en villog (a legrosszabb esetben, pl. PWM használatával) Villódzás észlelve a 99 % vagy annál kisebb fényerő-beállításnál. E fényerő-beállítás felett nem lehet villogás vagy PWM. A 1250 Hz frekvenciája meglehetősen magas, így a legtöbb PWM-re érzékeny felhasználó nem észlel semmilyen villogást. Összehasonlításképpen: az összes tesztelt eszköz 52 %-a nem használja a PWM-et a kijelző elsötétítésére. Ha PWM-et észleltek, akkor átlagosan 7765 (minimum: 5 - maximum: 343500) Hz-t mértek. | |||
| Cinebench R15 | |
| CPU Single 64Bit | |
| Az osztály átlaga Office (99.5 - 312, n=75, az elmúlt 2 évben) | |
| MSI Modern 14 A10RB-459US | |
| Lenovo ThinkPad E14 20RA001MGE | |
| Átlagos Intel Core i5-10210U (134 - 174, n=35) | |
| Lenovo ThinkPad T490-20N2004EGE | |
| Lenovo ThinkPad E490-20N8000RGE | |
| Dell Latitude 3400 | |
| CPU Multi 64Bit | |
| Az osztály átlaga Office (250 - 3380, n=75, az elmúlt 2 évben) | |
| Lenovo ThinkPad T490-20N2004EGE | |
| Átlagos Intel Core i5-10210U (320 - 790, n=35) | |
| MSI Modern 14 A10RB-459US | |
| Lenovo ThinkPad E14 20RA001MGE | |
| Lenovo ThinkPad E490-20N8000RGE | |
| Dell Latitude 3400 | |
| PCMark 8 | |
| Home Score Accelerated v2 | |
| Az osztály átlaga Office (n=1az elmúlt 2 évben) | |
| Lenovo ThinkPad E490-20N8000RGE | |
| Átlagos Intel Core i5-10210U, Intel UHD Graphics 620 (3182 - 4284, n=21) | |
| MSI Modern 14 A10RB-459US | |
| Lenovo ThinkPad T490-20N2004EGE | |
| Lenovo ThinkPad E14 20RA001MGE | |
| Dell Latitude 3400 | |
| Work Score Accelerated v2 | |
| Az osztály átlaga Office (n=1az elmúlt 2 évben) | |
| Lenovo ThinkPad E14 20RA001MGE | |
| MSI Modern 14 A10RB-459US | |
| Átlagos Intel Core i5-10210U, Intel UHD Graphics 620 (4286 - 5114, n=21) | |
| Lenovo ThinkPad T490-20N2004EGE | |
| Lenovo ThinkPad E490-20N8000RGE | |
| Dell Latitude 3400 | |
| PCMark 8 Home Score Accelerated v2 | 3402 pontok | |
| PCMark 8 Work Score Accelerated v2 | 5001 pontok | |
| PCMark 10 Score | 3901 pontok | |
Segítség | ||
| Lenovo ThinkPad E14 20RA001MGE SK hynix BC501 HFM512GDHTNG-8310A | Lenovo ThinkPad E490-20N8000RGE SK hynix BC501 HFM256GDHTNG | MSI Modern 14 A10RB-459US Kingston RBUSNS8154P3512GJ | Dell Latitude 3400 WDC PC SN520 SDAPNUW-256G | Lenovo ThinkPad T490-20N2004EGE Toshiba KXG5AZNV256G | Átlagos SK hynix BC501 HFM512GDHTNG-8310A | |
|---|---|---|---|---|---|---|
| CrystalDiskMark 5.2 / 6 | -9% | -2% | 9% | 24% | -9% | |
| Write 4K (MB/s) | 121.9 | 110.7 -9% | 107.7 -12% | 107.9 -11% | 119.9 -2% | 110 ? -10% |
| Read 4K (MB/s) | 42.66 | 41.02 -4% | 39.73 -7% | 40.27 -6% | 39.94 -6% | 40.6 ? -5% |
| Write Seq (MB/s) | 628 | 757 21% | 926 47% | 1253 100% | 1334 112% | 677 ? 8% |
| Read Seq (MB/s) | 1193 | 1037 -13% | 1014 -15% | 1298 9% | 1357 14% | 1104 ? -7% |
| Write 4K Q32T1 (MB/s) | 590 | 359 -39% | 343.6 -42% | 415 -30% | 311.2 -47% | 438 ? -26% |
| Read 4K Q32T1 (MB/s) | 414.5 | 402.4 -3% | 499.1 20% | 313.3 -24% | 400.6 -3% | 338 ? -18% |
| Write Seq Q32T1 (MB/s) | 866 | 833 -4% | 1033 19% | 1297 50% | 1642 90% | 860 ? -1% |
| Read Seq Q32T1 (MB/s) | 2078 | 1635 -21% | 1604 -23% | 1728 -17% | 2778 34% | 1786 ? -14% |

| 3DMark 11 - 1280x720 Performance GPU | |
| Az osztály átlaga Office (2551 - 18313, n=70, az elmúlt 2 évben) | |
| MSI Modern 14 A10RB-459US | |
| Lenovo ThinkPad E14 20RA001MGE | |
| Átlagos Intel UHD Graphics 620 (1144 - 3432, n=244) | |
| Lenovo ThinkPad T490-20N2004EGE | |
| Lenovo ThinkPad E490-20N8000RGE | |
| Dell Latitude 3400 | |
| 3DMark | |
| 1280x720 Cloud Gate Standard Graphics | |
| Az osztály átlaga Office (11640 - 118515, n=37, az elmúlt 2 évben) | |
| MSI Modern 14 A10RB-459US | |
| Átlagos Intel UHD Graphics 620 (6205 - 16400, n=225) | |
| Lenovo ThinkPad E14 20RA001MGE | |
| Lenovo ThinkPad E490-20N8000RGE | |
| Lenovo ThinkPad T490-20N2004EGE | |
| Dell Latitude 3400 | |
| 1920x1080 Fire Strike Graphics | |
| Az osztály átlaga Office (736 - 21871, n=73, az elmúlt 2 évben) | |
| MSI Modern 14 A10RB-459US | |
| Lenovo ThinkPad E14 20RA001MGE | |
| Átlagos Intel UHD Graphics 620 (557 - 2608, n=213) | |
| Lenovo ThinkPad E490-20N8000RGE | |
| Lenovo ThinkPad T490-20N2004EGE | |
| Dell Latitude 3400 | |
| 2560x1440 Time Spy Graphics | |
| Az osztály átlaga Office (493 - 6679, n=68, az elmúlt 2 évben) | |
| MSI Modern 14 A10RB-459US | |
| Átlagos Intel UHD Graphics 620 (299 - 797, n=88) | |
| Lenovo ThinkPad E490-20N8000RGE | |
| Dell Latitude 3400 | |
| 3DMark 11 Performance | 1938 pontok | |
| 3DMark Cloud Gate Standard Score | 8057 pontok | |
| 3DMark Fire Strike Score | 1072 pontok | |
Segítség | ||
| alacsony | közepes | magas | ultra | |
|---|---|---|---|---|
| BioShock Infinite (2013) | 59.8 | 33.23 | 27.38 | 8.74 |
| Dota 2 Reborn (2015) | 68.7 | 40.7 | 19.3 | 17.1 |
| Rise of the Tomb Raider (2016) | 20.6 | |||
| X-Plane 11.11 (2018) | 10.6 | 9.02 | 8.8 | |
| Total War: Three Kingdoms (2019) | 23.4 |
Zajszint
| Üresjárat |
| 29.2 / 29.2 / 29.2 dB(A) |
| Terhelés |
| 29.5 / 29.9 dB(A) |
 | ||
30 dB csendes 40 dB(A) hallható 50 dB(A) hangos |
||
min: | ||
(±) A felső oldalon a maximális hőmérséklet 41.7 °C / 107 F, összehasonlítva a 34.3 °C / 94 F átlagával , 21.2 és 62.5 °C között a Office osztálynál.
(±) Az alsó maximum 40.3 °C / 105 F-ig melegszik fel, összehasonlítva a 36.8 °C / 98 F átlagával
(+) Üresjáratban a felső oldal átlagos hőmérséklete 23.8 °C / 75 F, összehasonlítva a 29.5 °C / ### eszközátlaggal class_avg_f### F.
(+) A csuklótámasz és az érintőpad hűvösebb, mint a bőr hőmérséklete, maximum 30 °C / 86 F, ezért hűvös tapintású.
(-) A hasonló eszközök csuklótámasz területének átlagos hőmérséklete 27.5 °C / 81.5 F volt (-2.5 °C / -4.5 F).
Lenovo ThinkPad E14 20RA001MGE hangelemzés
(±) | a hangszóró hangereje átlagos, de jó (73.6 dB)
Basszus 100 - 315 Hz
(-) | szinte nincs basszus – átlagosan 18.3%-kal alacsonyabb a mediánnál
(-) | A basszus nem lineáris (15.8% delta az előző frekvenciához)
Közepes 400-2000 Hz
(±) | magasabb középértékek – átlagosan 6.4%-kal magasabb, mint a medián
(±) | a középpontok linearitása átlagos (8.2% delta az előző gyakorisághoz)
Maximum 2-16 kHz
(+) | kiegyensúlyozott csúcsok – csak 3.2% választja el a mediántól
(±) | a csúcsok linearitása átlagos (11.7% delta az előző gyakorisághoz)
Összességében 100 - 16.000 Hz
(±) | az általános hang linearitása átlagos (26.4% eltérés a mediánhoz képest)
Ugyanazon osztályhoz képest
» 81%Ebben az osztályban az összes tesztelt eszköz %-a jobb volt, 7% hasonló, 13%-kal rosszabb
» A legjobb delta értéke 7%, az átlag 21%, a legrosszabb 53% volt
Az összes tesztelt eszközzel összehasonlítva
» 81% az összes tesztelt eszköz jobb volt, 4% hasonló, 15%-kal rosszabb
» A legjobb delta értéke 4%, az átlag 24%, a legrosszabb 134% volt
Apple MacBook 12 (Early 2016) 1.1 GHz hangelemzés
(+) | a hangszórók viszonylag hangosan tudnak játszani (83.6 dB)
Basszus 100 - 315 Hz
(±) | csökkentett basszus – átlagosan 11.3%-kal alacsonyabb, mint a medián
(±) | a basszus linearitása átlagos (14.2% delta az előző frekvenciához)
Közepes 400-2000 Hz
(+) | kiegyensúlyozott középpontok – csak 2.4% választja el a mediántól
(+) | a középpontok lineárisak (5.5% delta az előző frekvenciához)
Maximum 2-16 kHz
(+) | kiegyensúlyozott csúcsok – csak 2% választja el a mediántól
(+) | a csúcsok lineárisak (4.5% delta az előző frekvenciához képest)
Összességében 100 - 16.000 Hz
(+) | általános hangzás lineáris (10.2% eltérés a mediánhoz képest)
Ugyanazon osztályhoz képest
» 7%Ebben az osztályban az összes tesztelt eszköz %-a jobb volt, 2% hasonló, 91%-kal rosszabb
» A legjobb delta értéke 5%, az átlag 18%, a legrosszabb 53% volt
Az összes tesztelt eszközzel összehasonlítva
» 5% az összes tesztelt eszköz jobb volt, 1% hasonló, 94%-kal rosszabb
» A legjobb delta értéke 4%, az átlag 24%, a legrosszabb 134% volt
| Kikapcsolt állapot / Készenlét | |
| Üresjárat | |
| Terhelés |
|
Kulcs:
min: | |
| Lenovo ThinkPad E14 20RA001MGE i5-10210U, UHD Graphics 620, SK hynix BC501 HFM512GDHTNG-8310A, IPS LED, 1920x1080, 14" | Lenovo ThinkPad E490-20N8000RGE i5-8265U, UHD Graphics 620, SK hynix BC501 HFM256GDHTNG, IPS, 1920x1080, 14" | MSI Modern 14 A10RB-459US i5-10210U, GeForce MX250, Kingston RBUSNS8154P3512GJ, IPS, 1920x1080, 14" | Dell Latitude 3400 i3-8145U, UHD Graphics 620, WDC PC SN520 SDAPNUW-256G, IPS, 1920x1080, 14" | Lenovo ThinkPad T490-20N2004EGE i5-8265U, UHD Graphics 620, Toshiba KXG5AZNV256G, IGZO IPS LED, 1920x1080, 14" | Átlagos Intel UHD Graphics 620 | Az osztály átlaga Office | |
|---|---|---|---|---|---|---|---|
| Power Consumption | 11% | -32% | 12% | 5% | -10% | -27% | |
| Idle Minimum * (Watt) | 3.01 | 2.76 8% | 4.2 -40% | 2.4 20% | 2.34 22% | 3.81 ? -27% | 4.41 ? -47% |
| Idle Average * (Watt) | 6.32 | 5.96 6% | 5.9 7% | 4.9 22% | 5.22 17% | 6.94 ? -10% | 7.38 ? -17% |
| Idle Maximum * (Watt) | 8.78 | 6.57 25% | 7.2 18% | 7.4 16% | 8.82 -0% | 8.75 ? -0% | 8.59 ? 2% |
| Load Average * (Watt) | 32.5 | 28.2 13% | 63.4 -95% | 31 5% | 35.8 -10% | 35 ? -8% | 43.3 ? -33% |
| Load Maximum * (Watt) | 45.5 | 43.6 4% | 67.4 -48% | 47 -3% | 47.3 -4% | 47.5 ? -4% | 64.5 ? -42% |
| Witcher 3 ultra * (Watt) | 53.5 |
* ... a kisebb jobb
| Lenovo ThinkPad E14 20RA001MGE i5-10210U, UHD Graphics 620, 45 Wh | Lenovo ThinkPad E490-20N8000RGE i5-8265U, UHD Graphics 620, 45 Wh | MSI Modern 14 A10RB-459US i5-10210U, GeForce MX250, 50 Wh | Lenovo ThinkPad T490-20N2004EGE i5-8265U, UHD Graphics 620, 50 Wh | Dell Latitude 3400 i3-8145U, UHD Graphics 620, 56 Wh | Az osztály átlaga Office | |
|---|---|---|---|---|---|---|
| Akkumulátor üzemidő | 8% | 4% | 27% | 14% | 34% | |
| H.264 (h) | 10.3 | 11.5 12% | 11.3 10% | 15 ? 46% | ||
| WiFi v1.3 (h) | 8.5 | 8.1 -5% | 8.6 1% | 9.5 12% | 9.7 14% | 12.8 ? 51% |
| Load (h) | 1.7 | 2 18% | 1.8 6% | 2.7 59% | 1.793 ? 5% | |
| Reader / Idle (h) | 17.7 | 16.4 | 23.7 ? |
Pro
Kontra
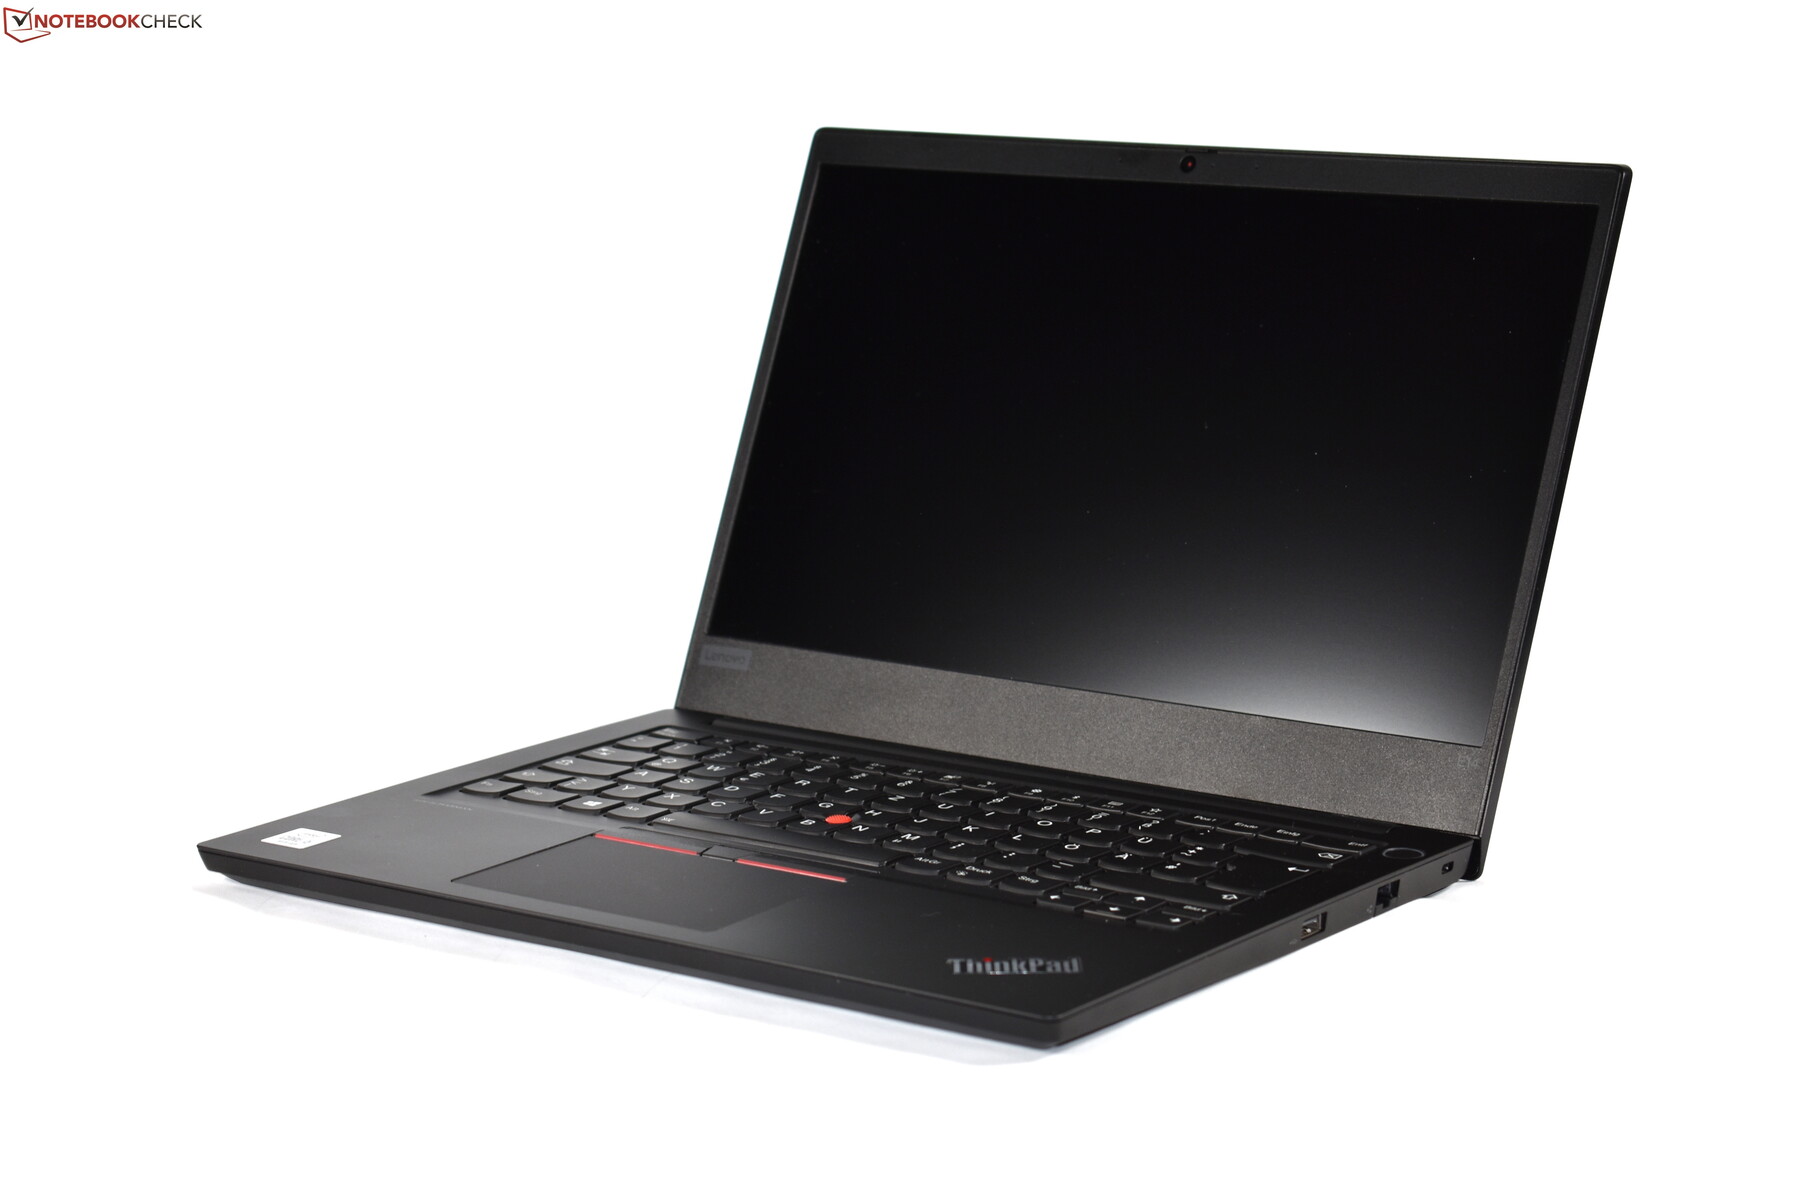
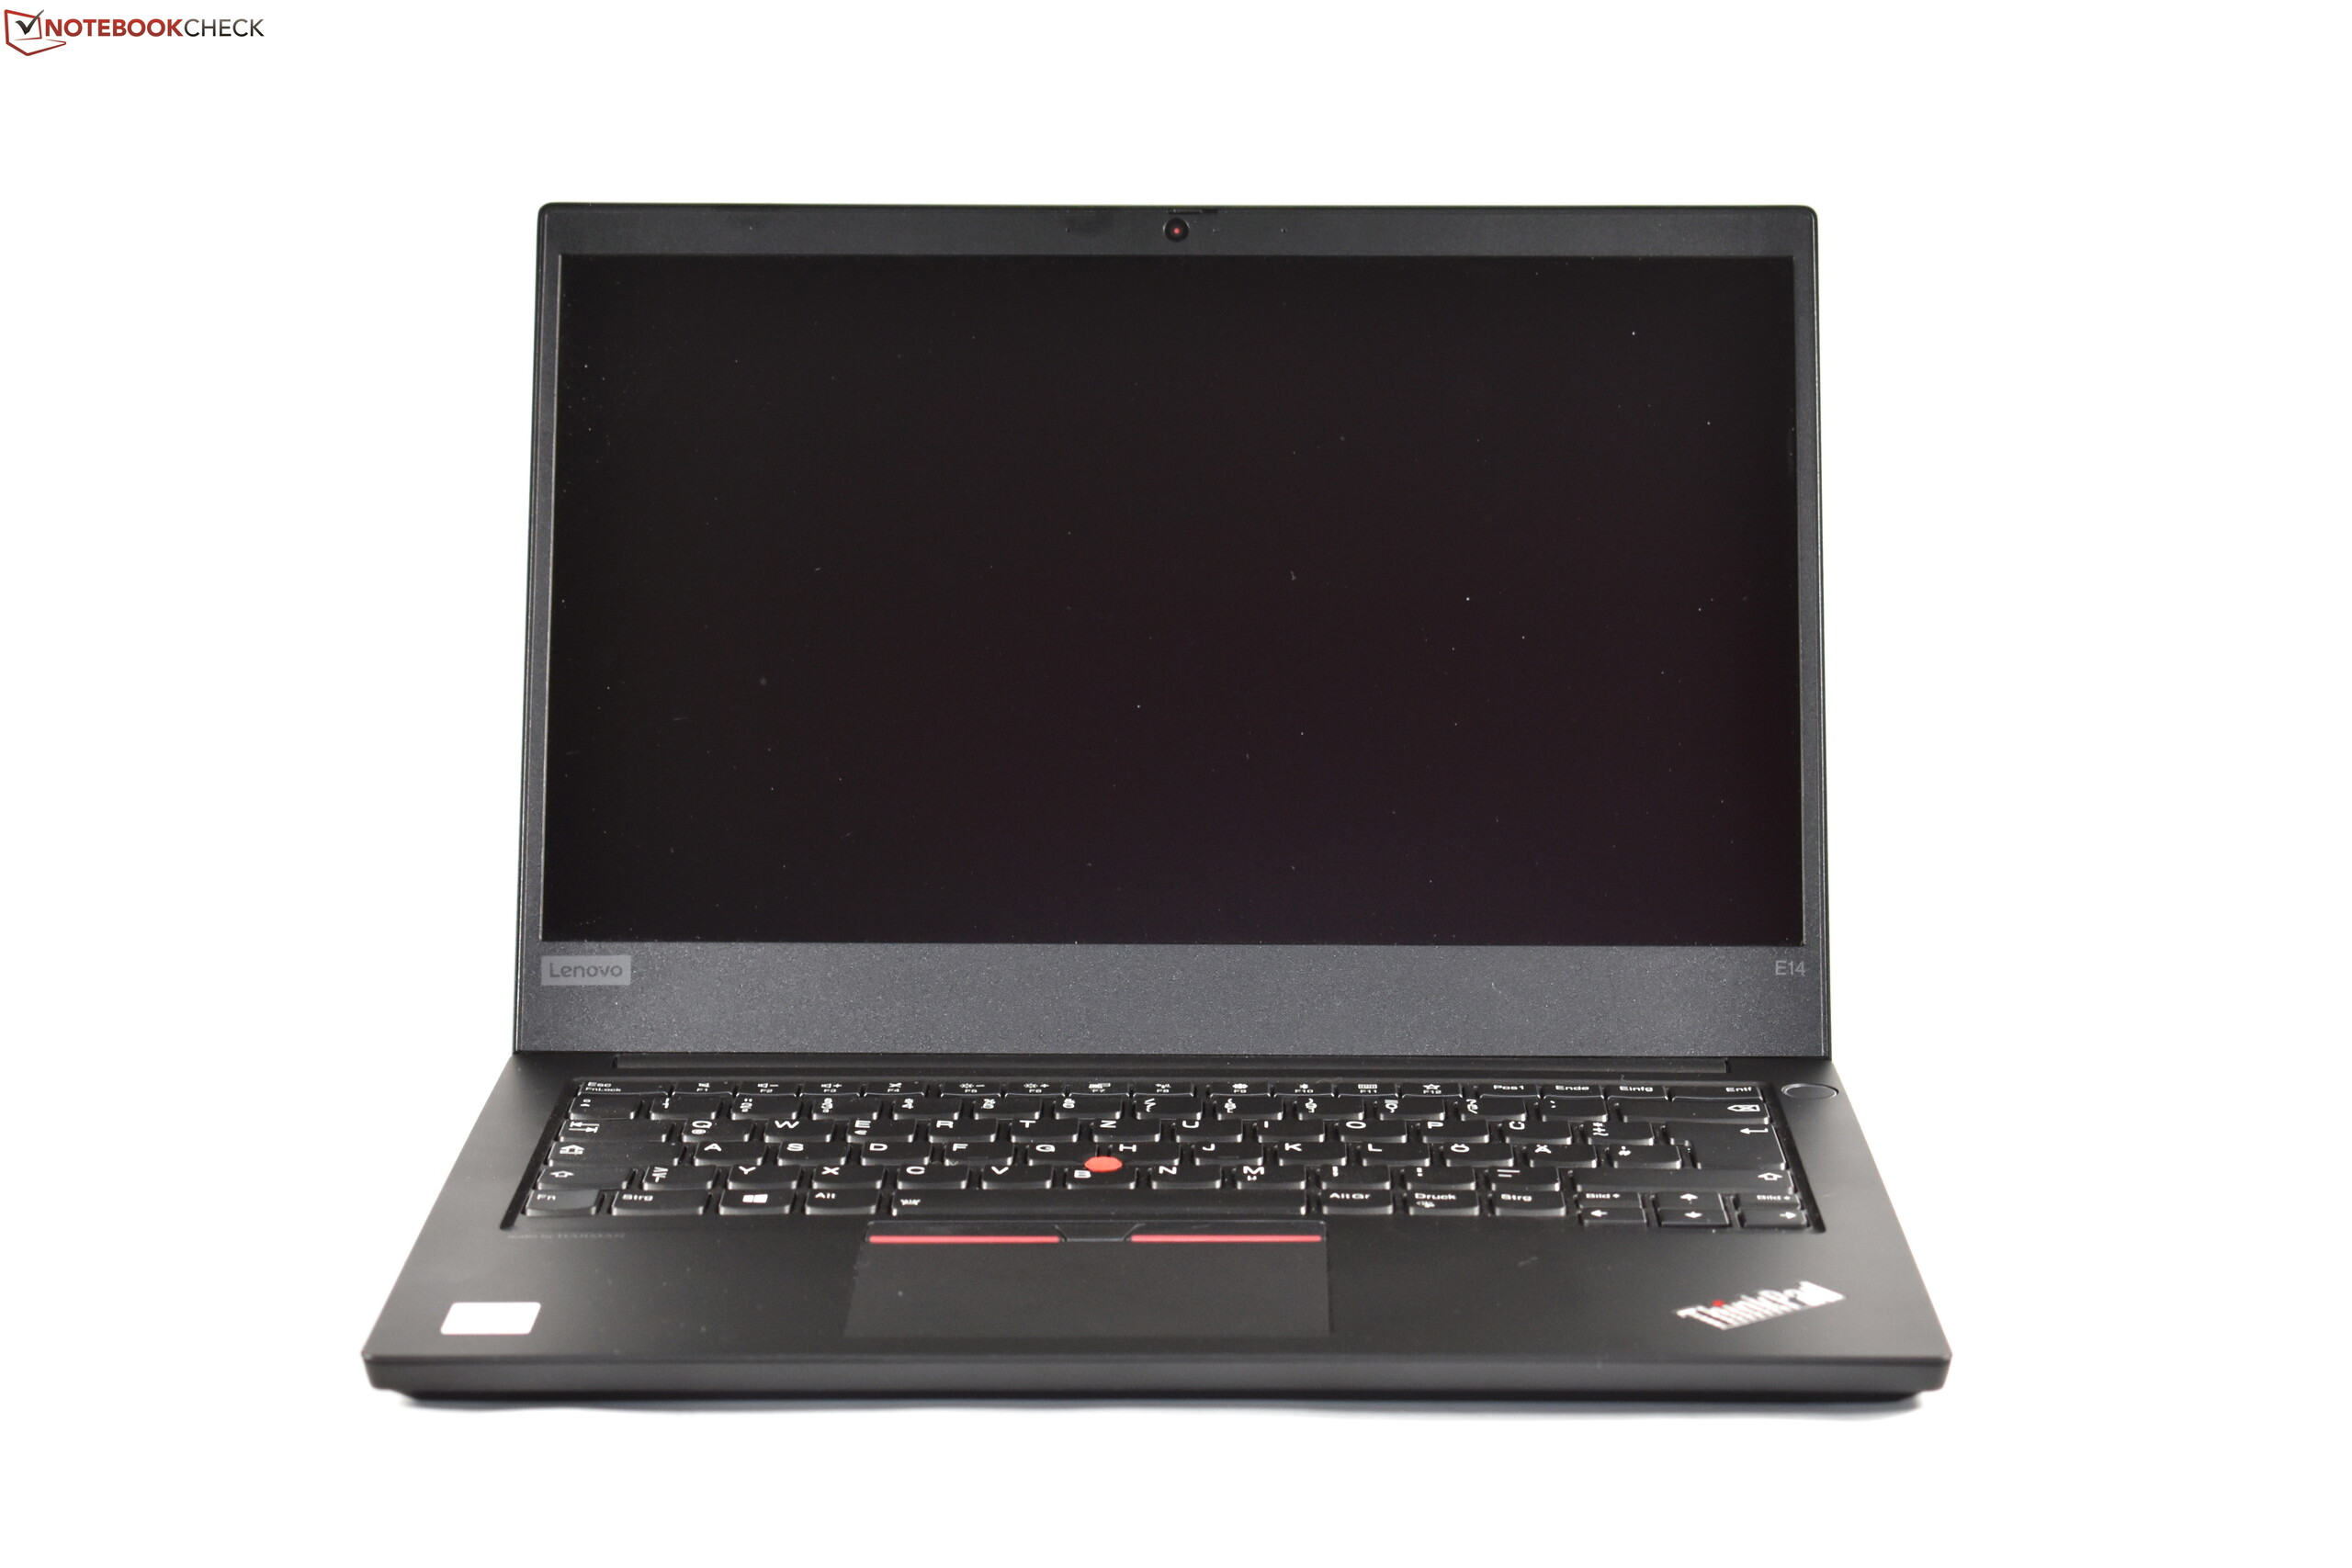
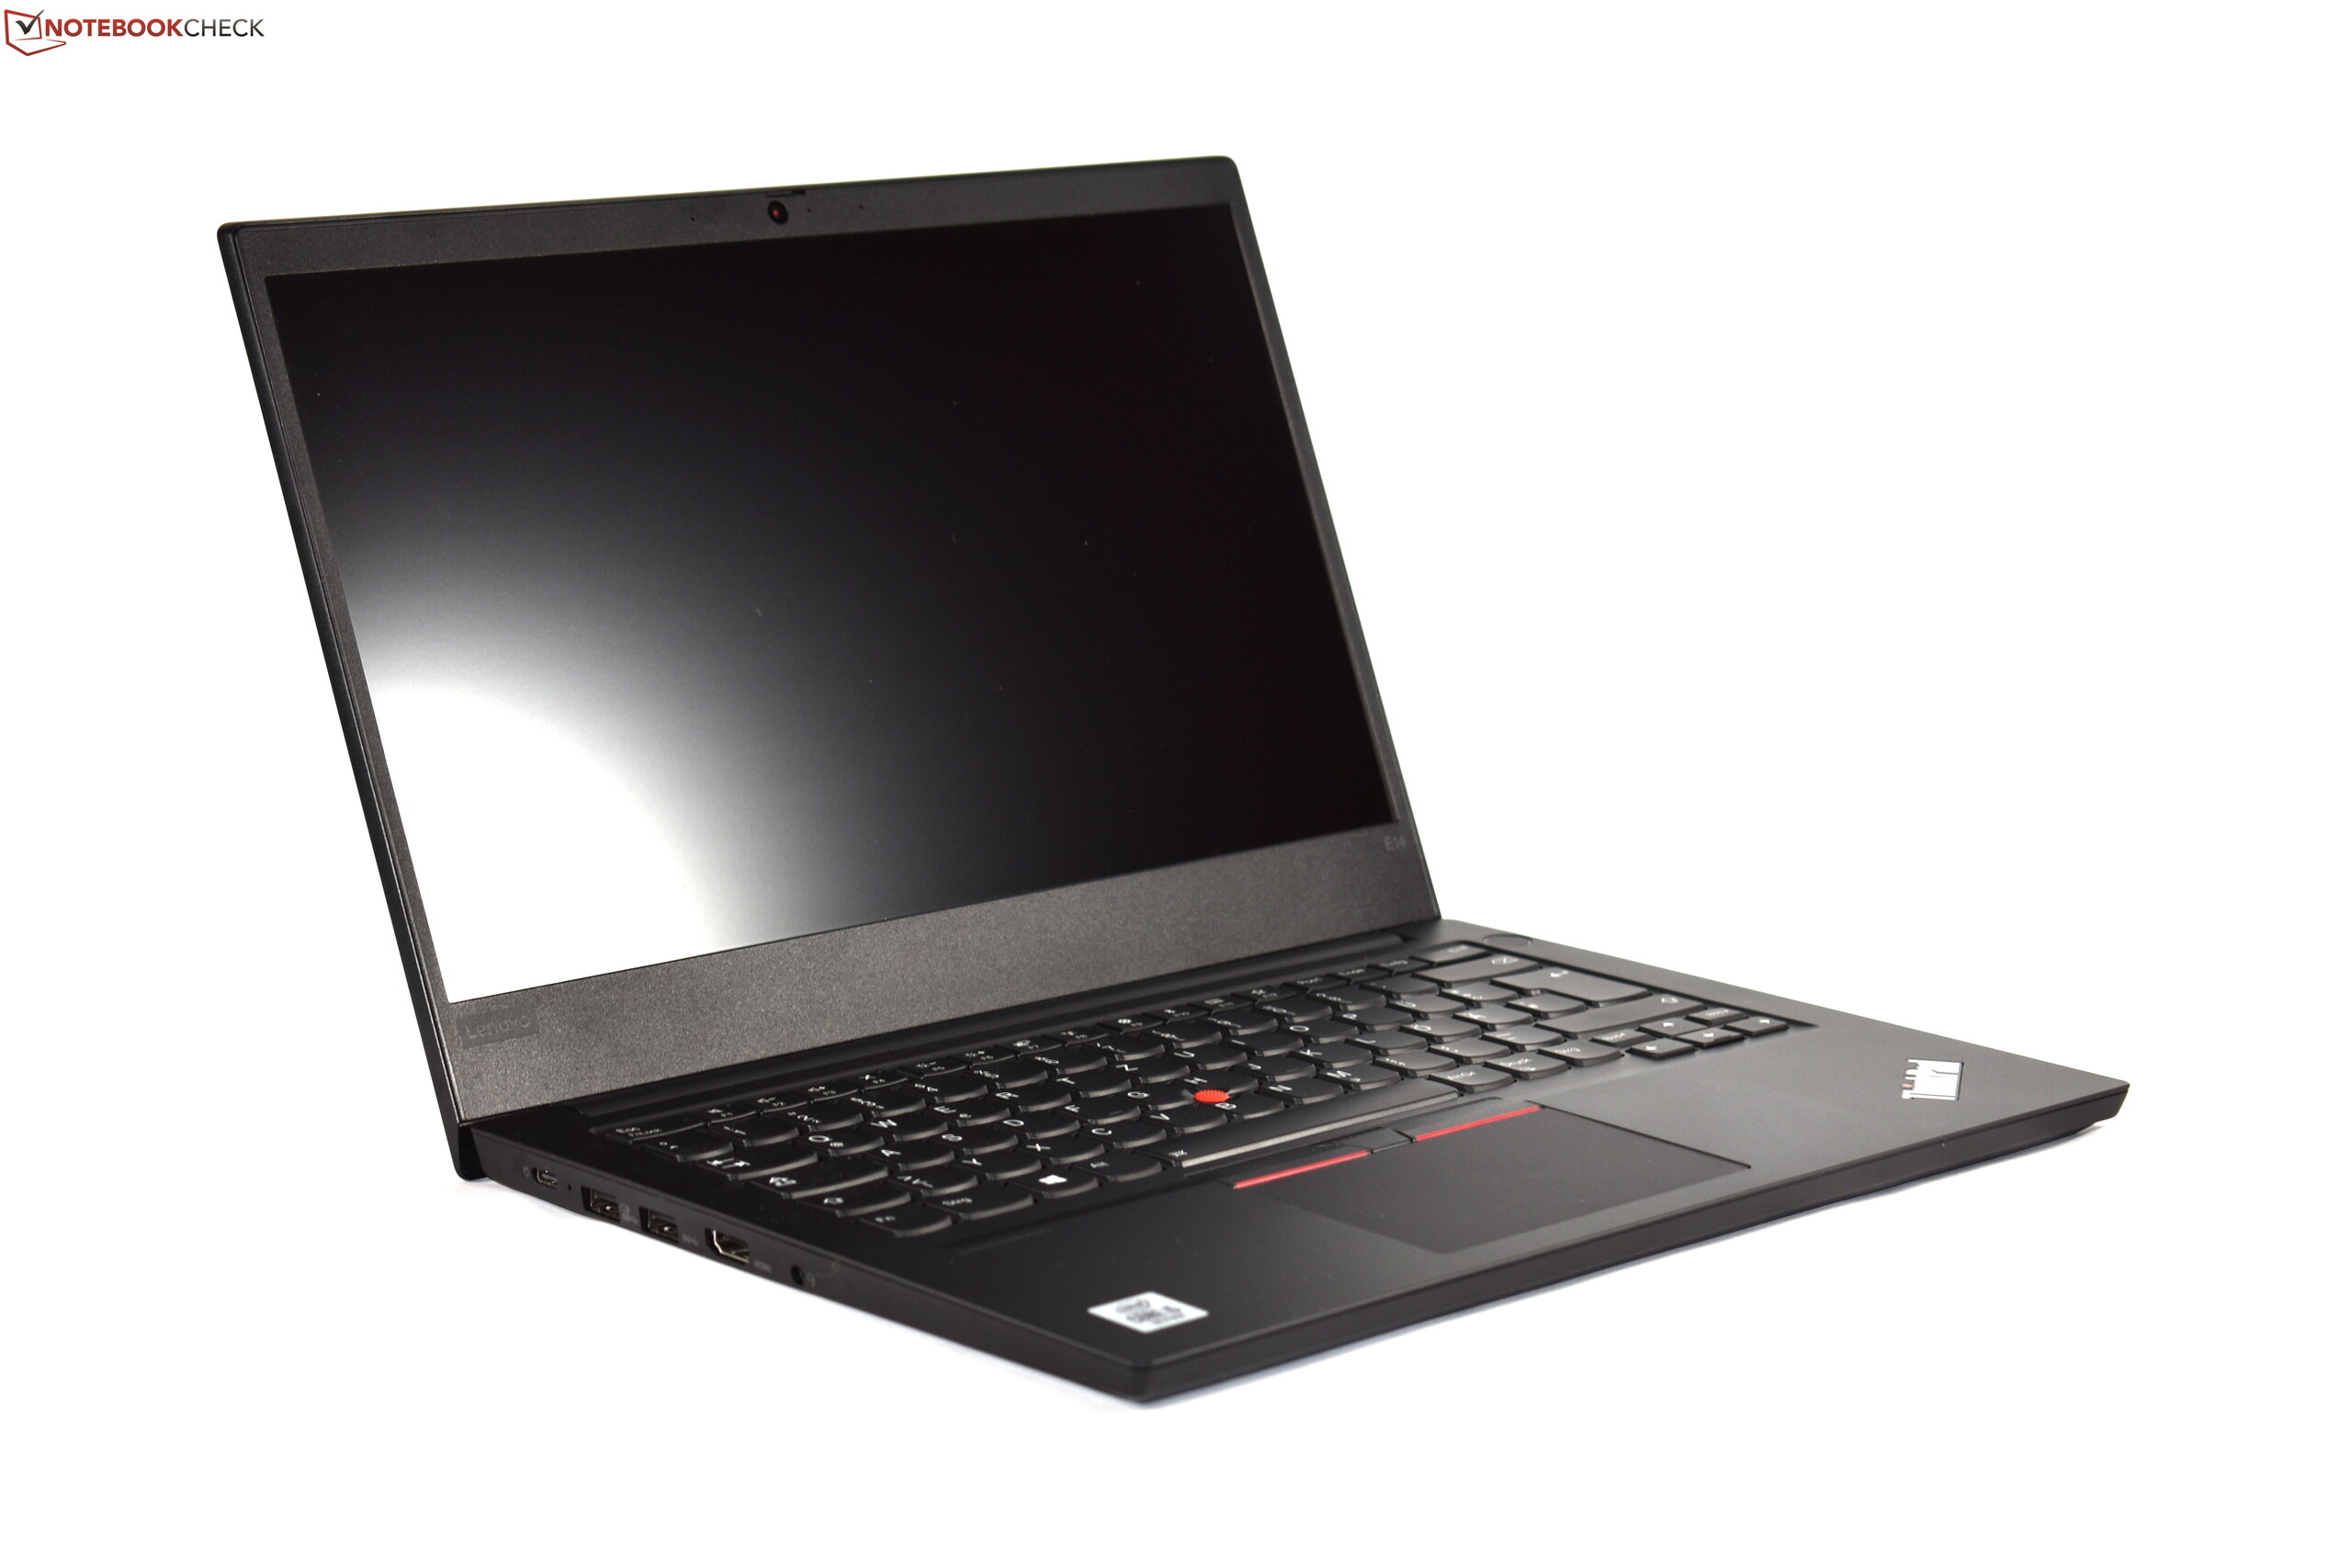
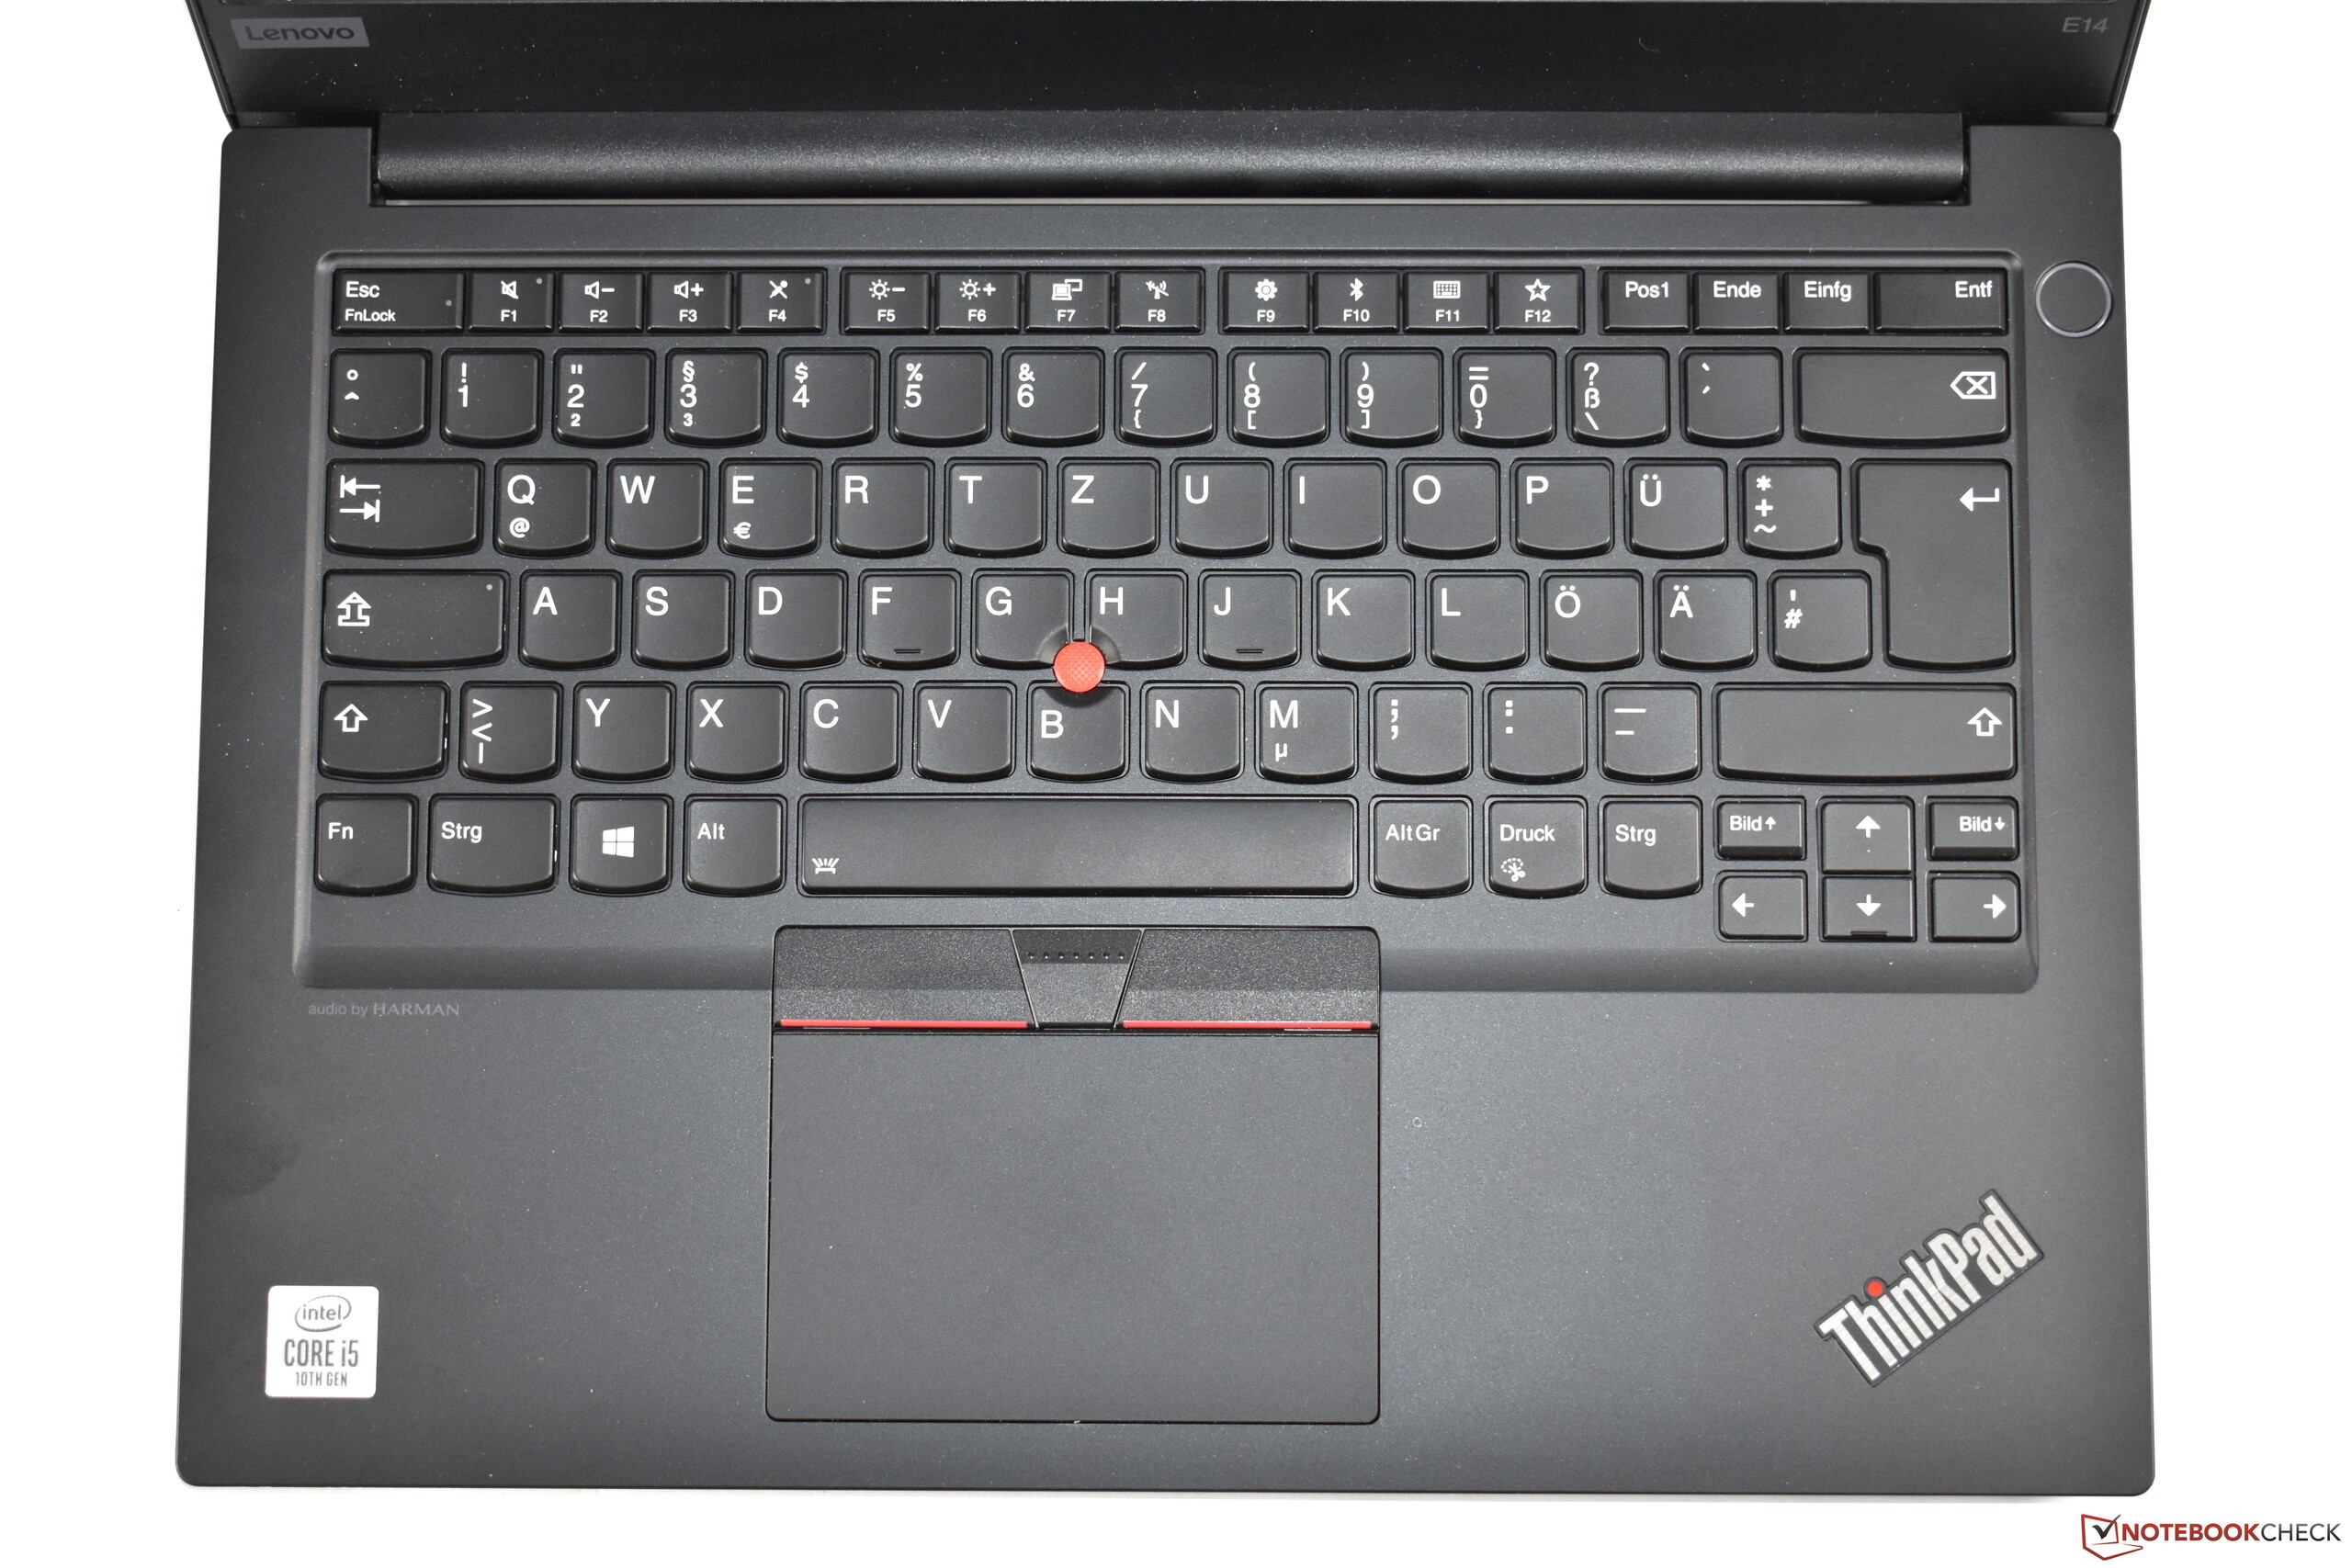
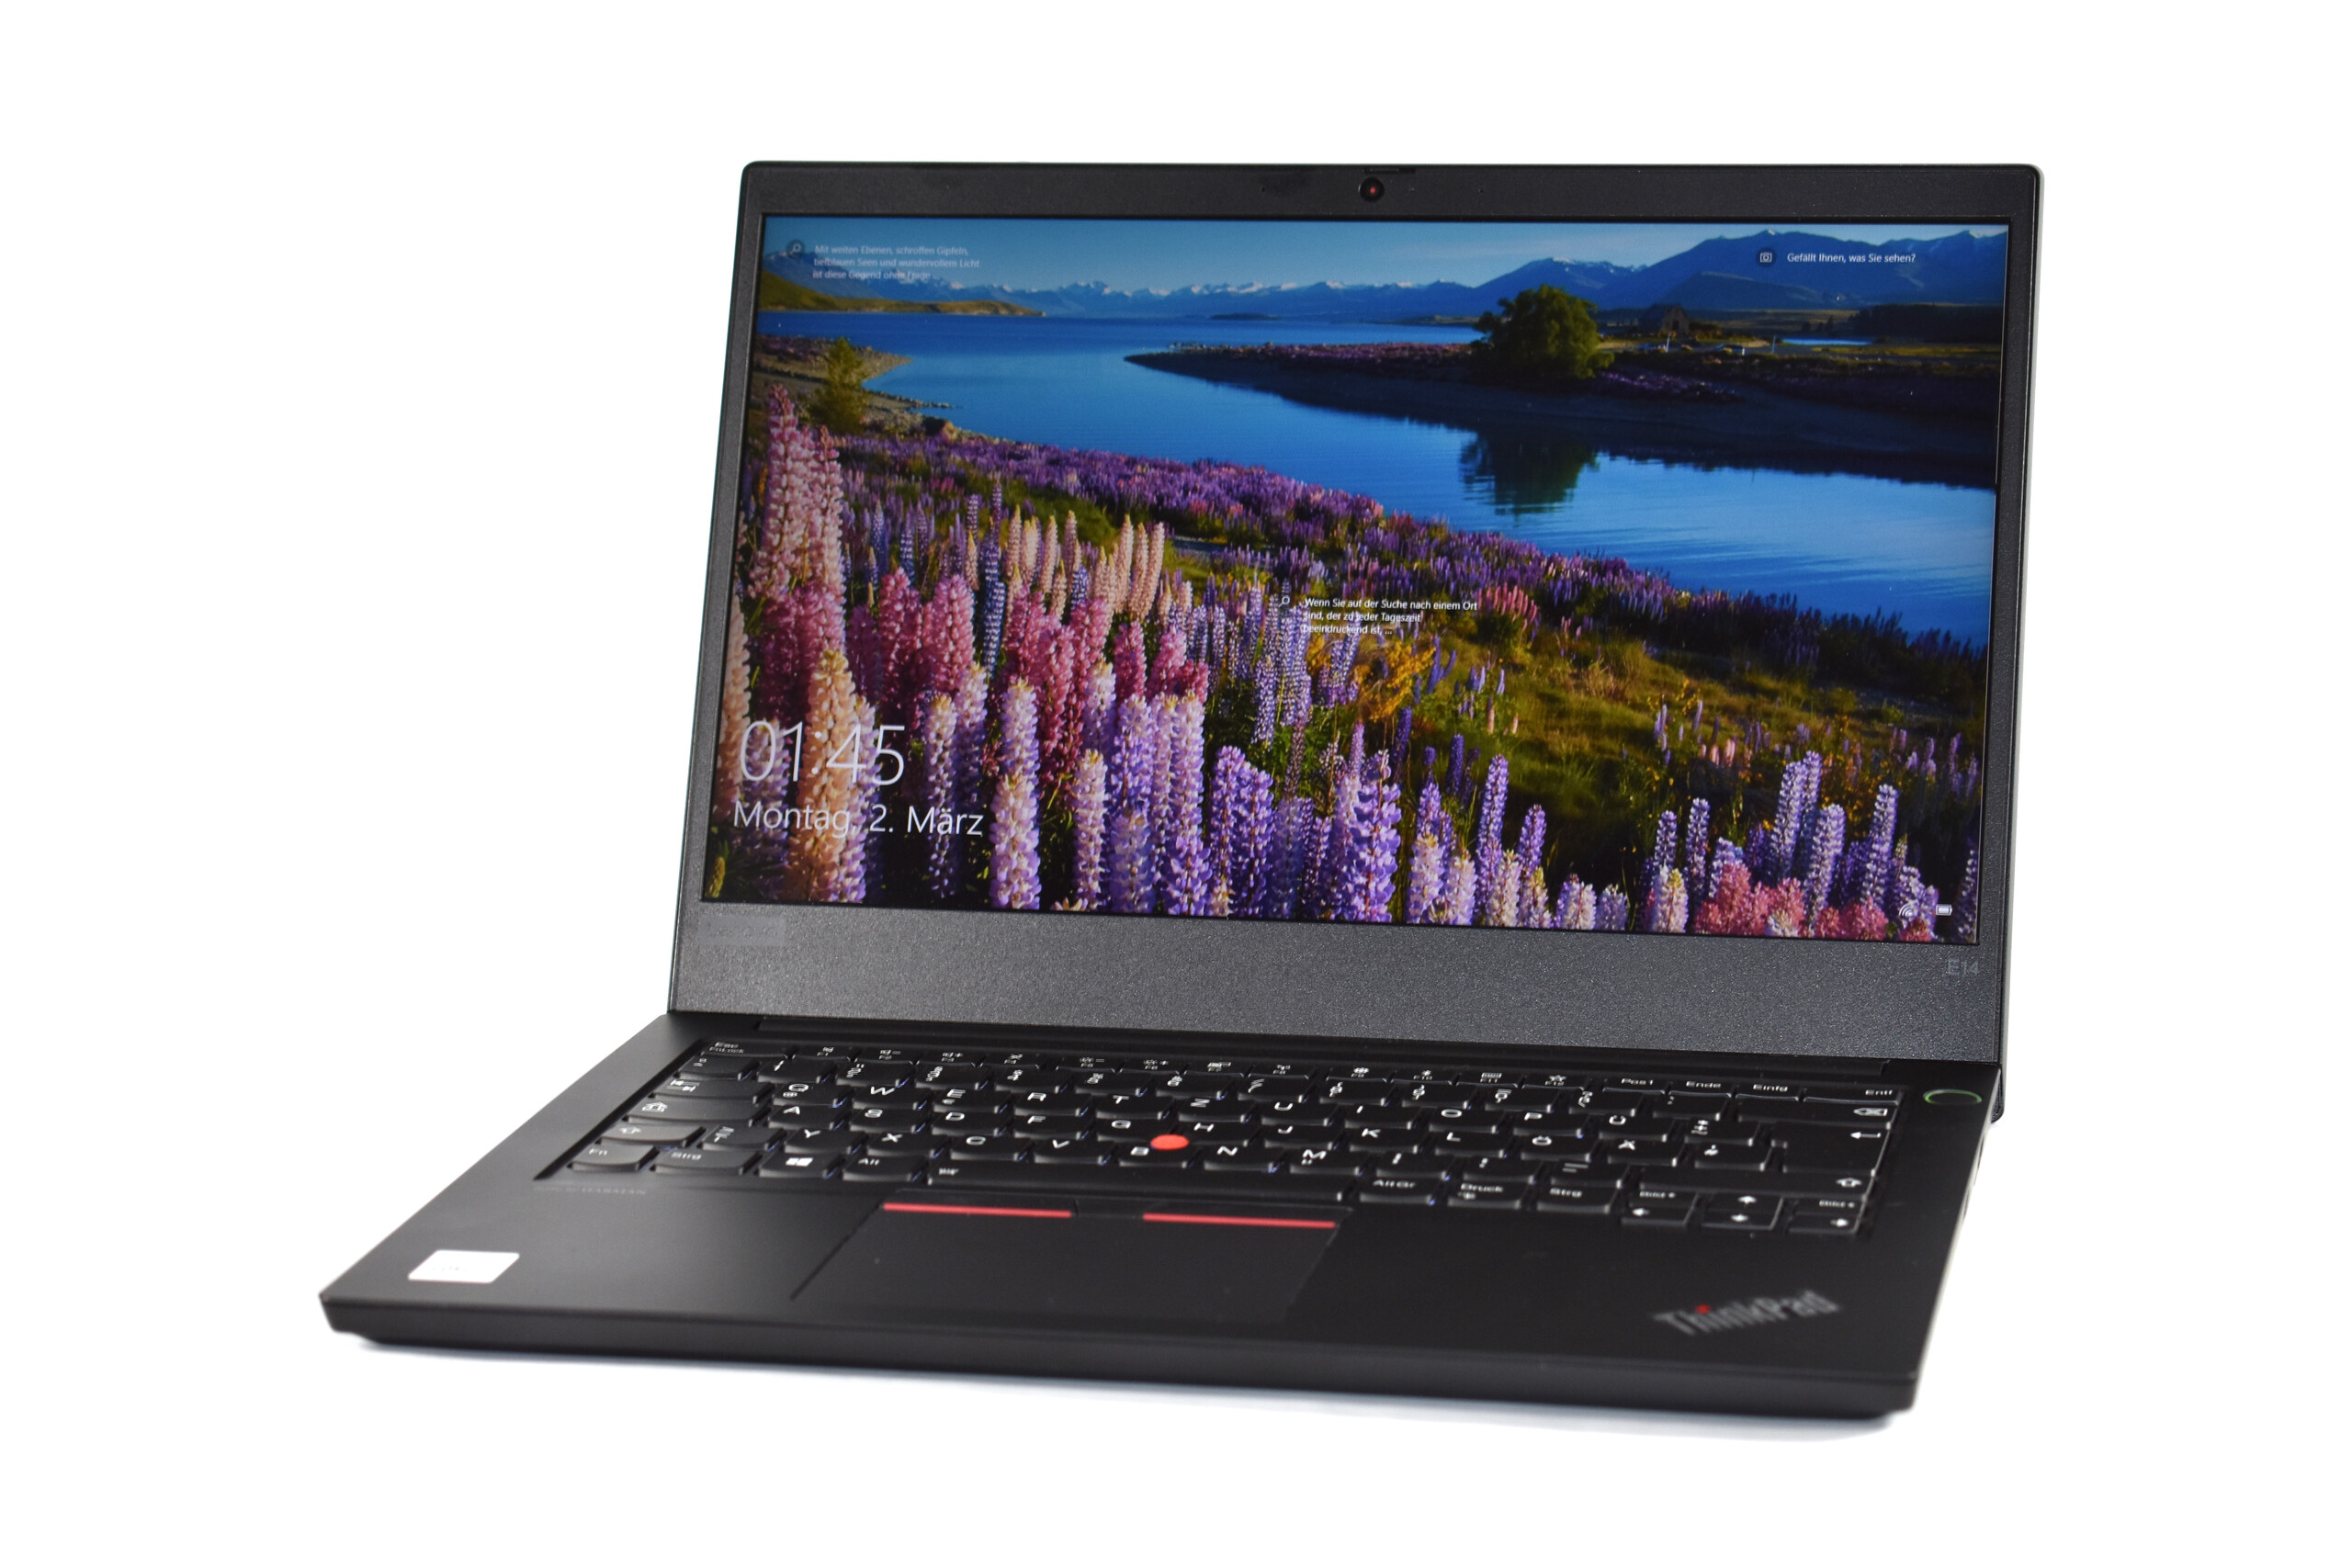
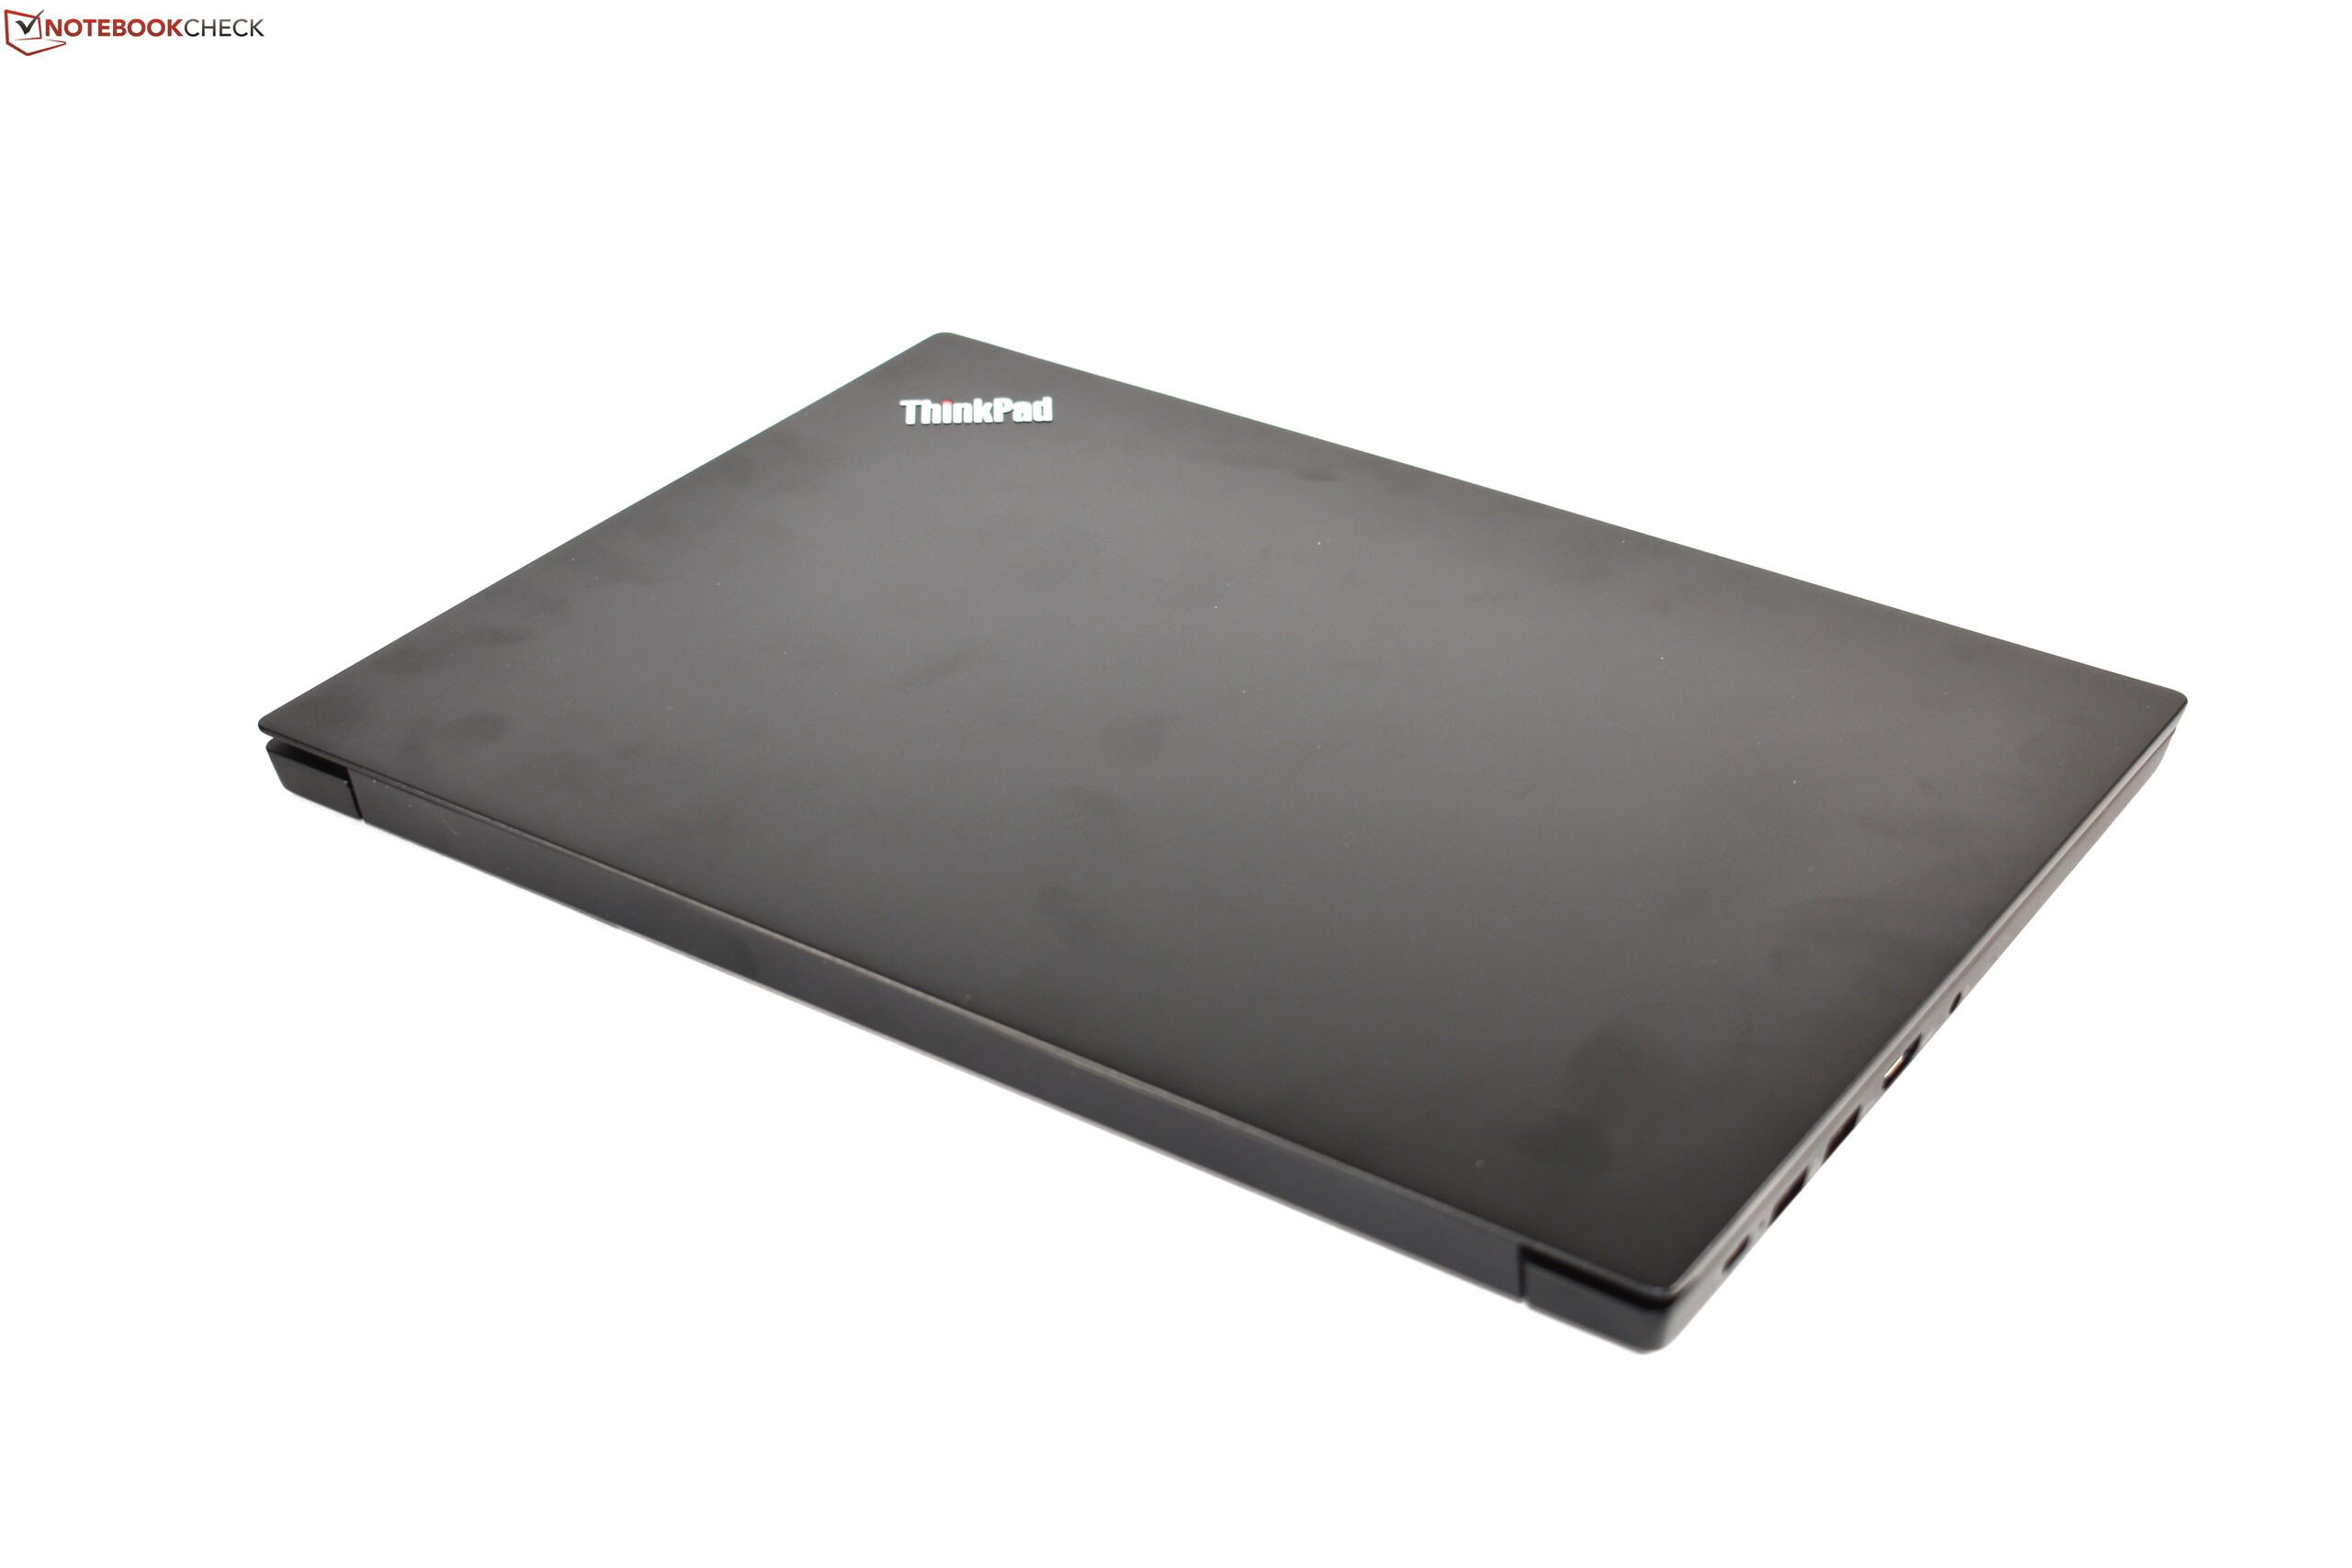
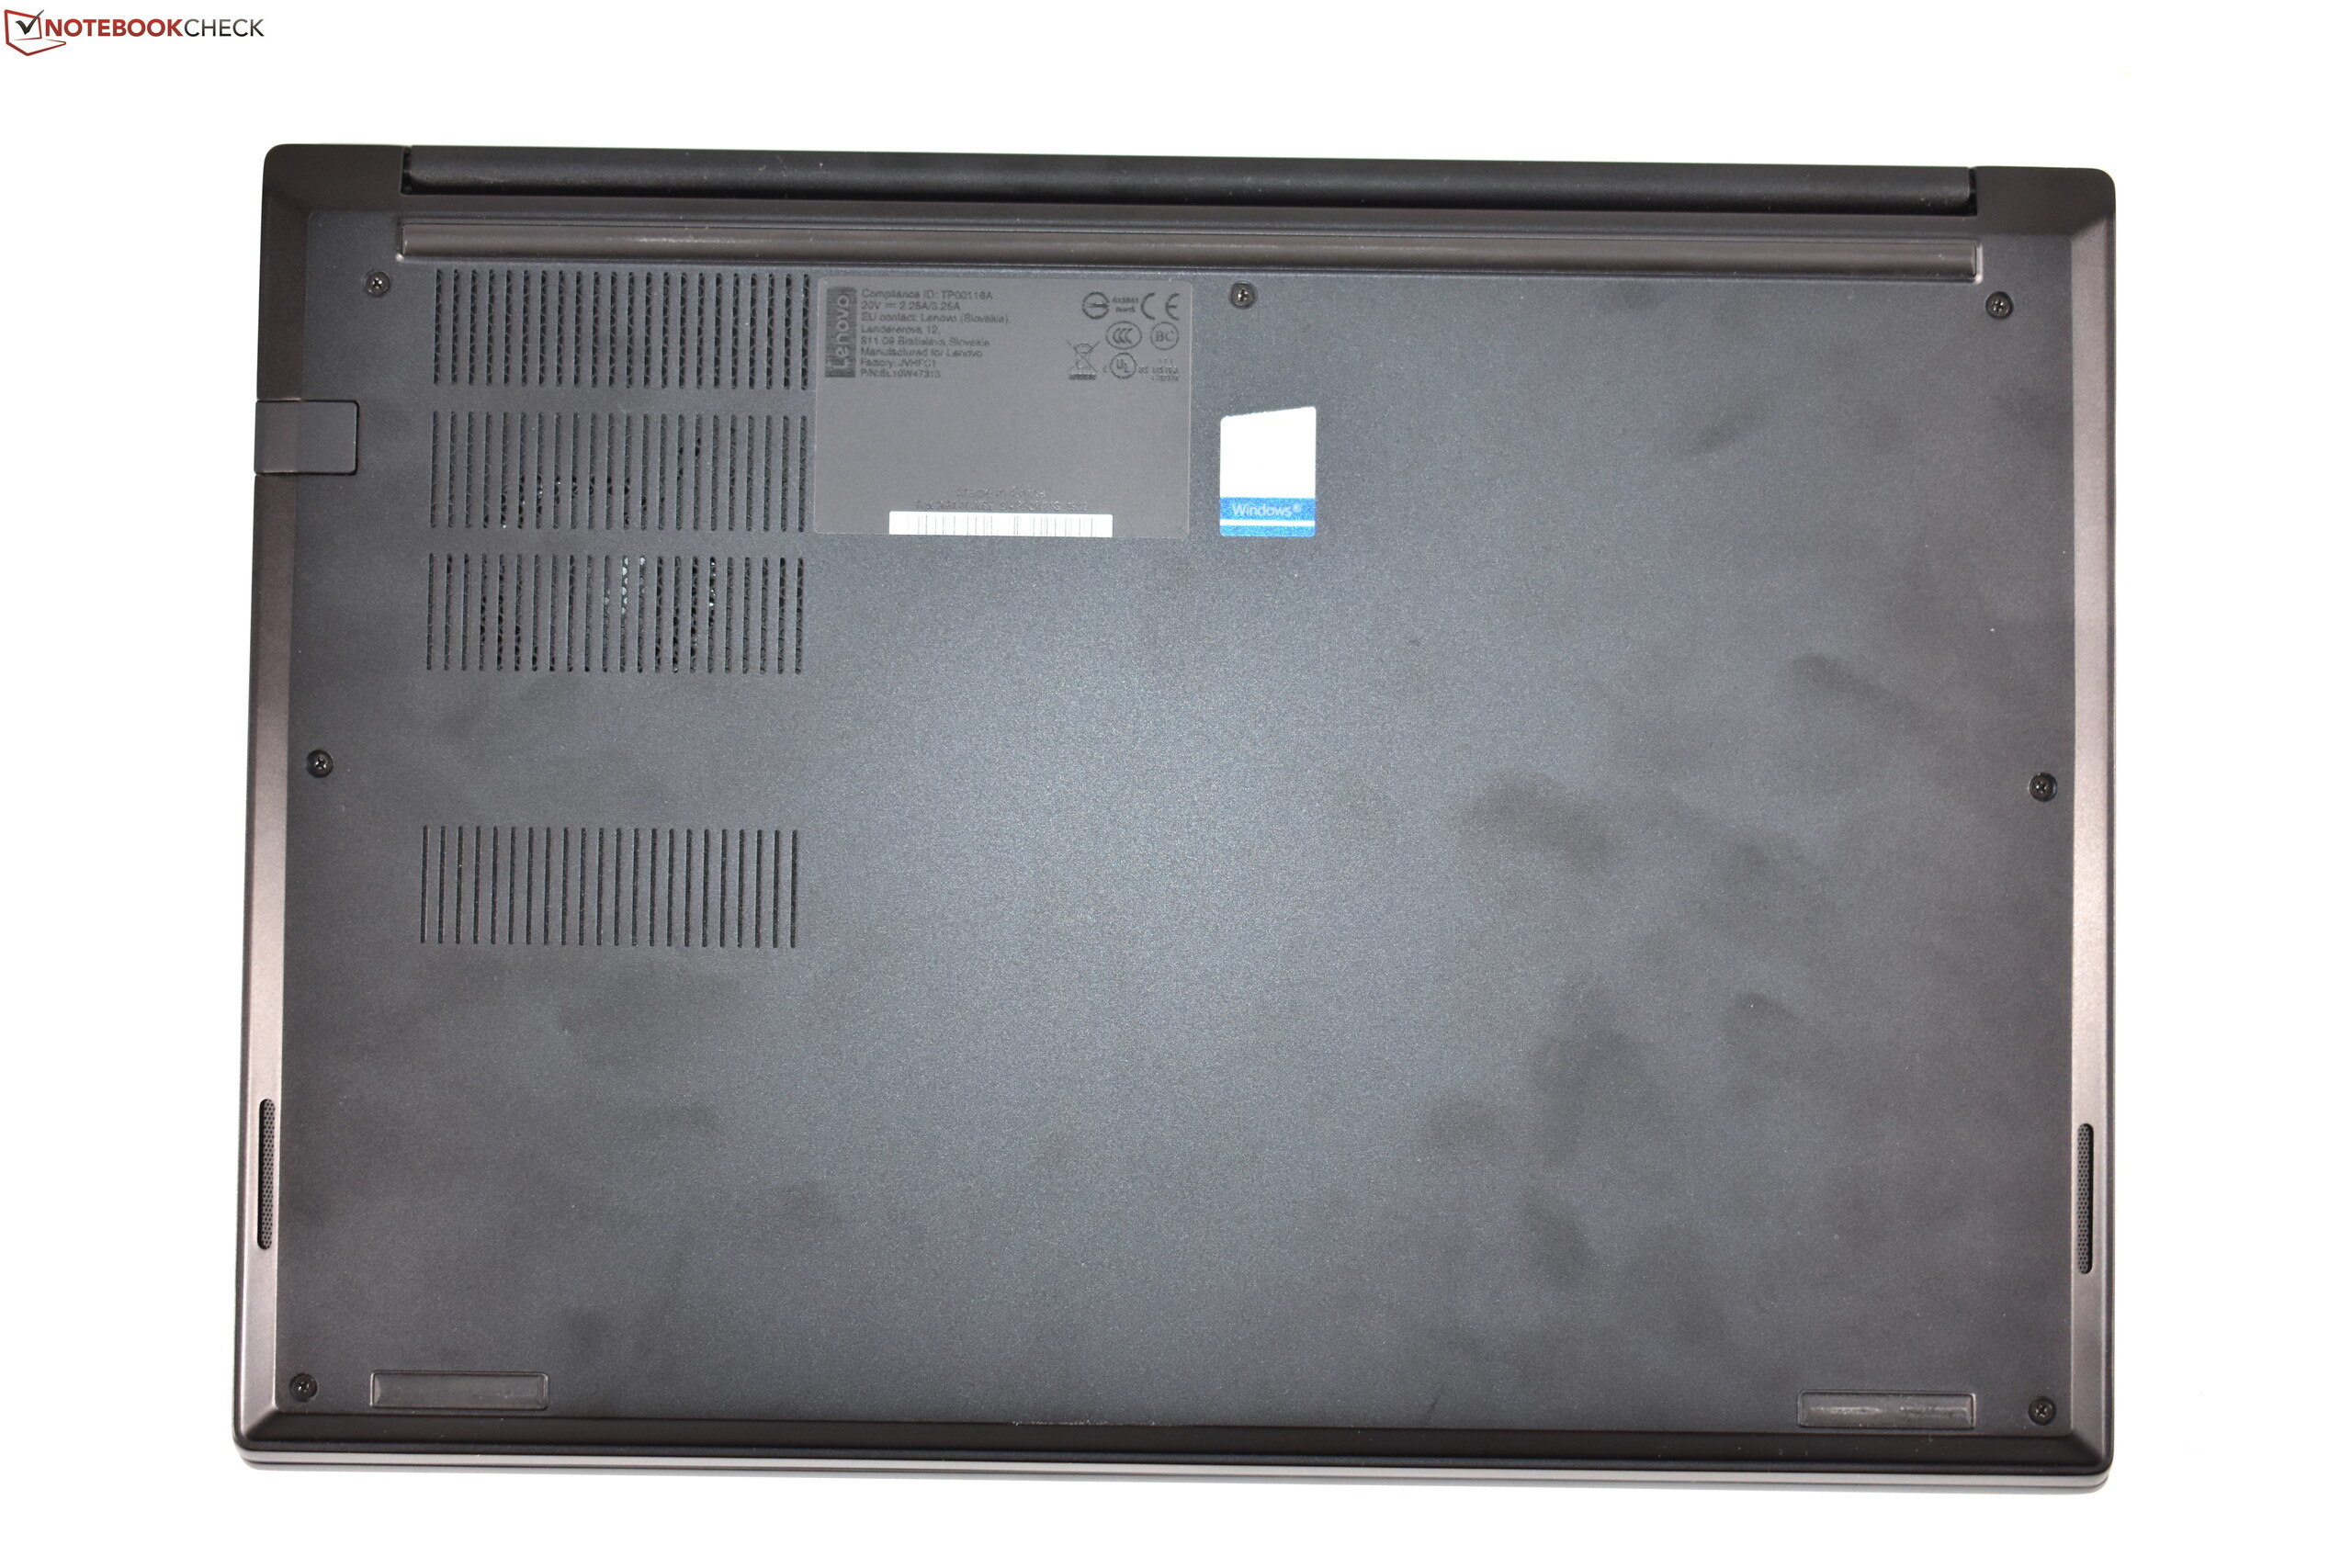
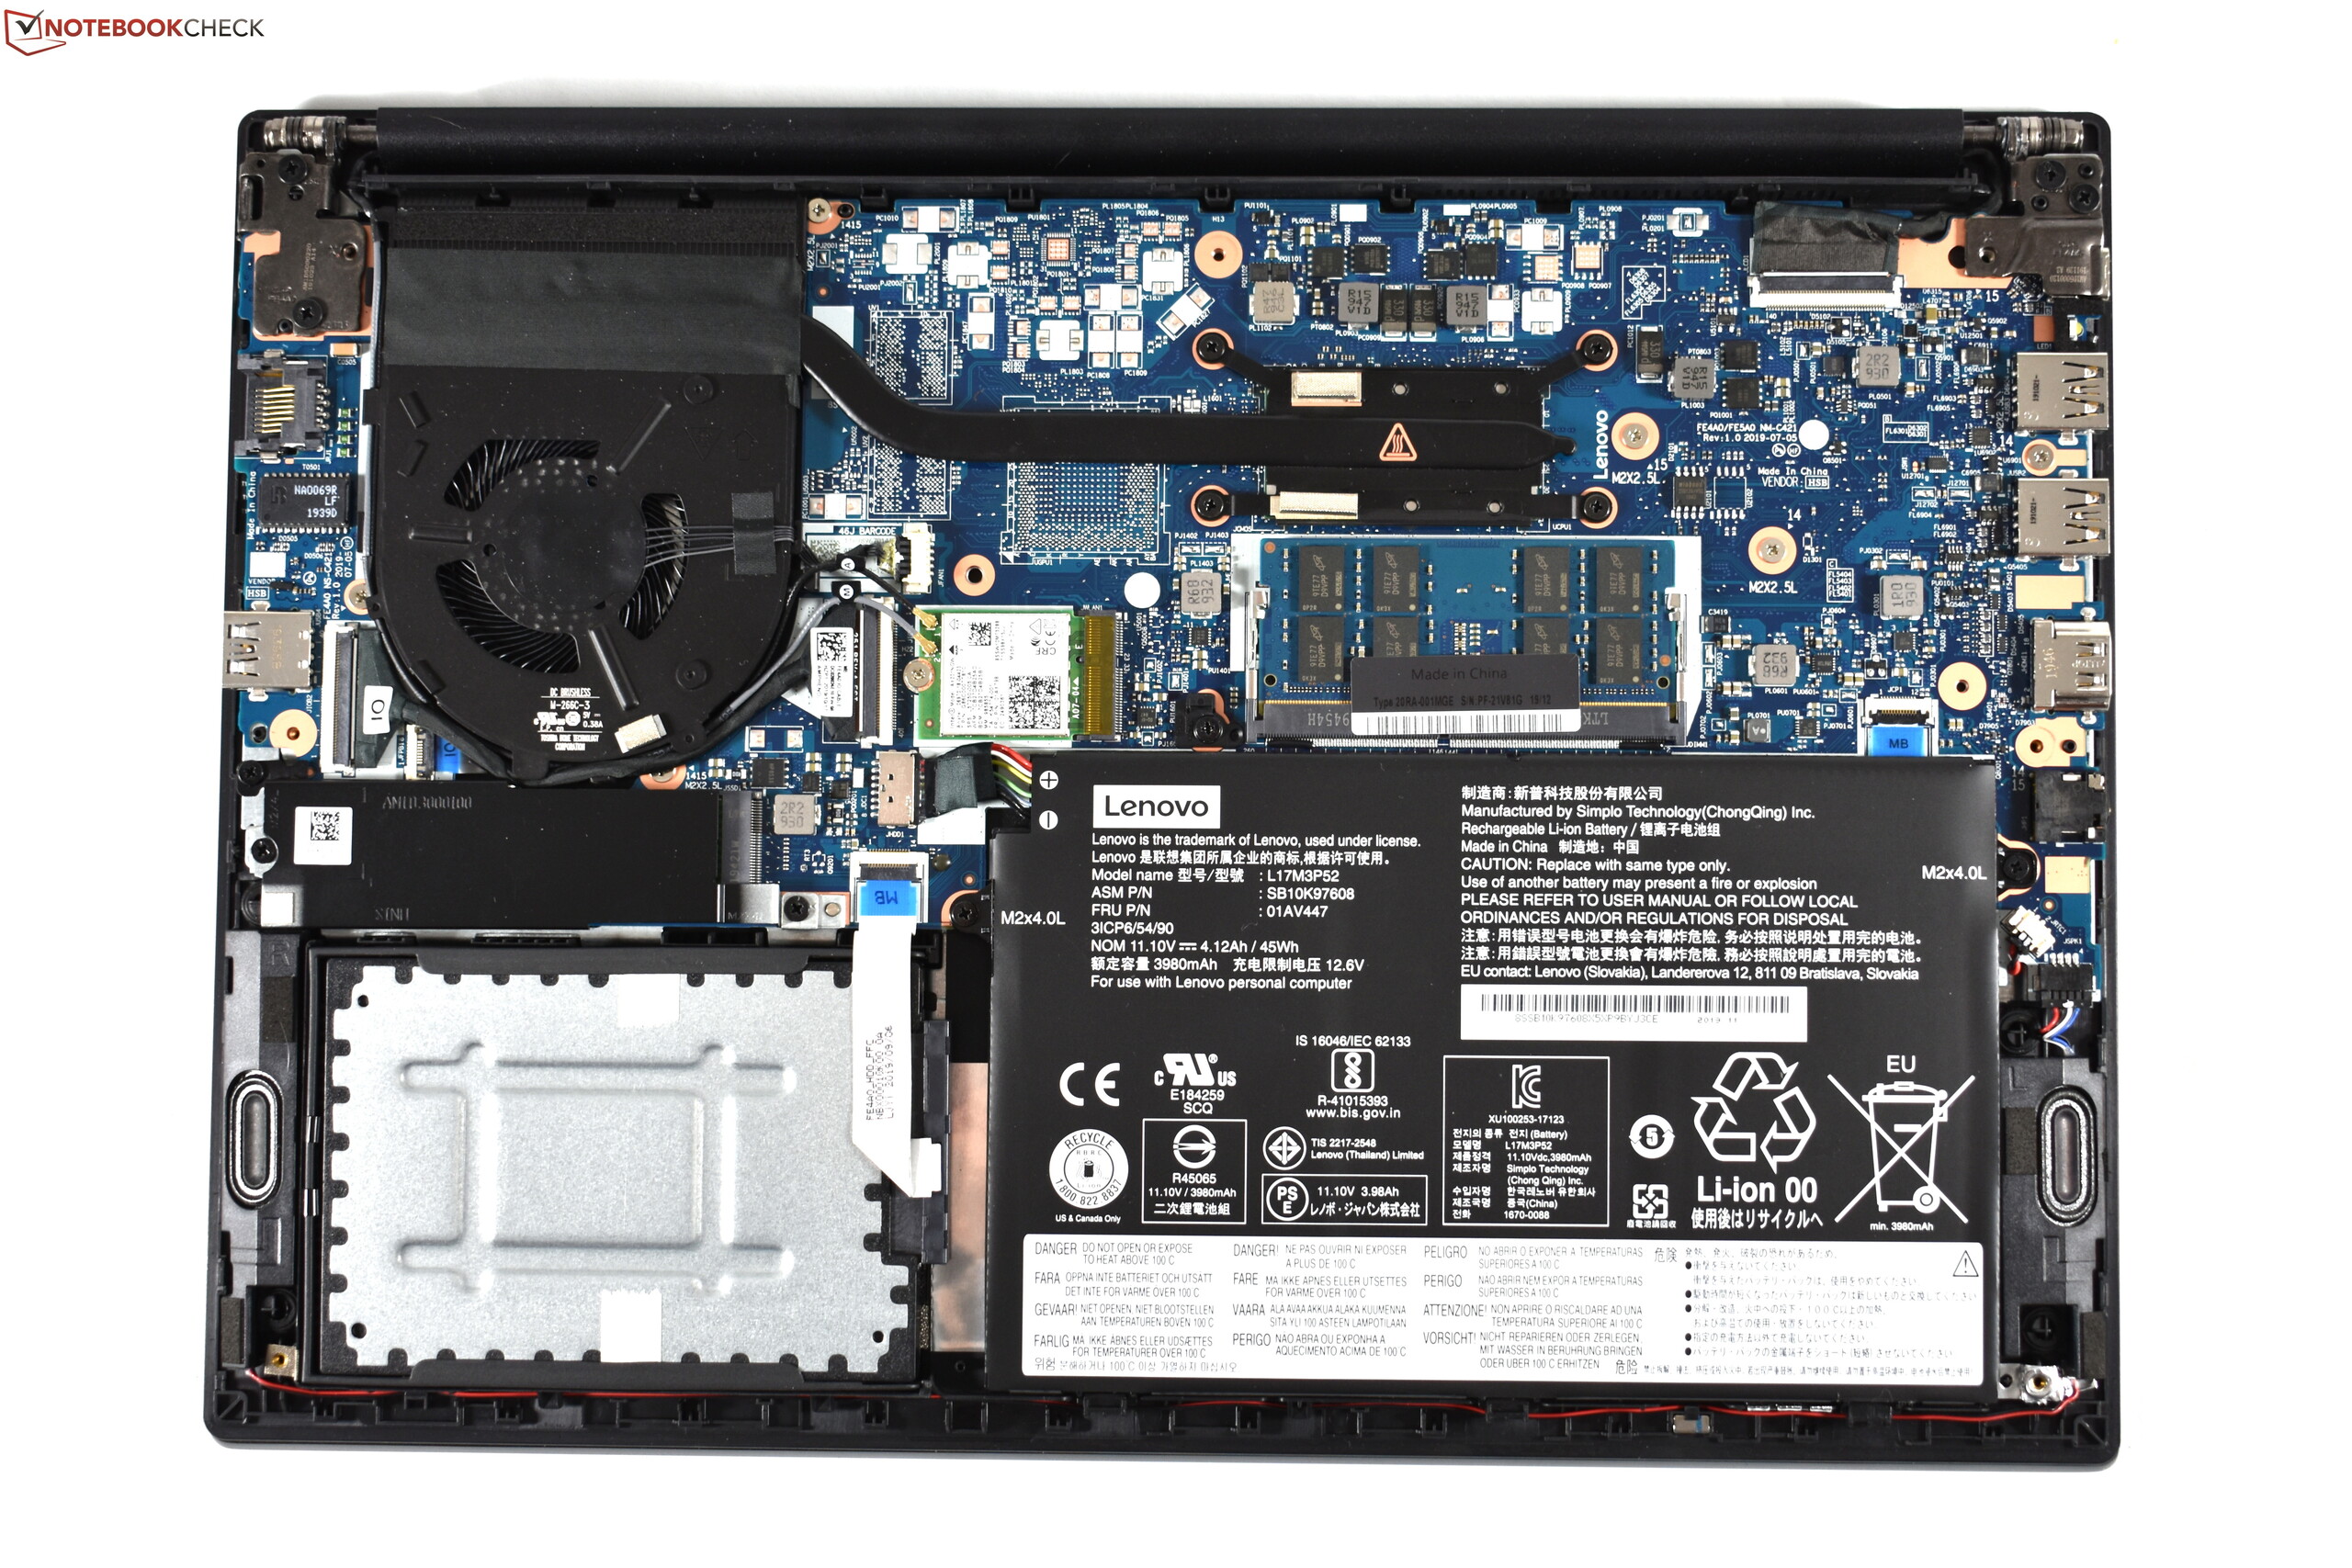
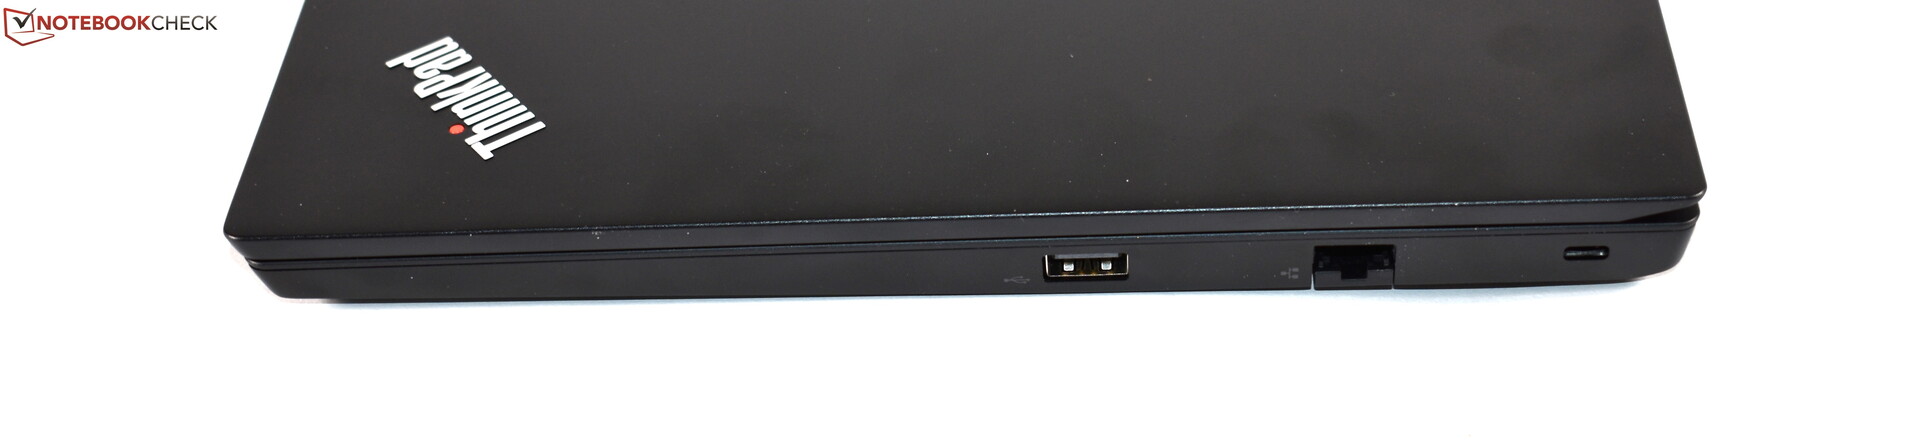
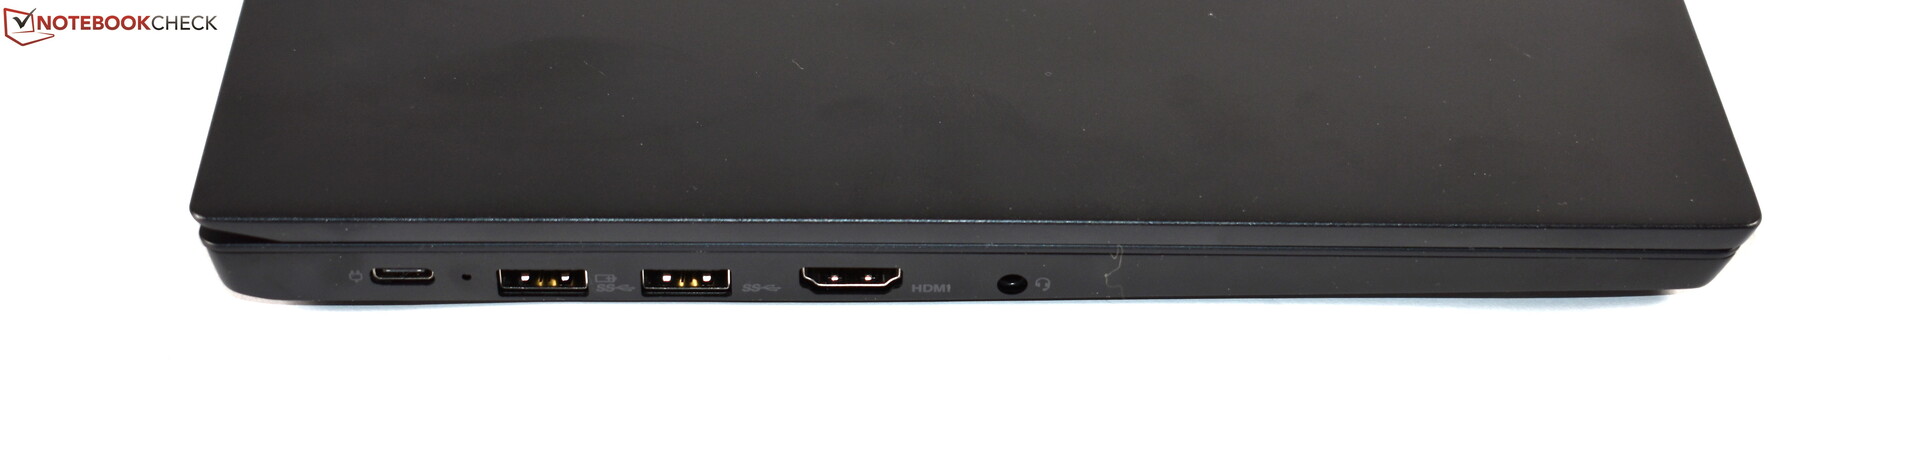
A Lenovo az új ThinkPad E14-gyel folytatja az E sorozat fejlesztését. A vékonyabb váz sok tervezési megoldást vesz át a régebbi ThinkPad E490-től, és így több erősségét is átviszi. Az egyik közülük: A kiváló ThinkPad bemeneti eszközök. Egyebek közé tartozik a jó üzemidő és a még terhelés alatt is alacsony hő/zajszint. A ThinkPad E14 még ezen kívül bővíthető is, főként ha tárhelyről van szó. Az alumínium megnövekedett használatának köszönhetően a tapintási minőség is javult.
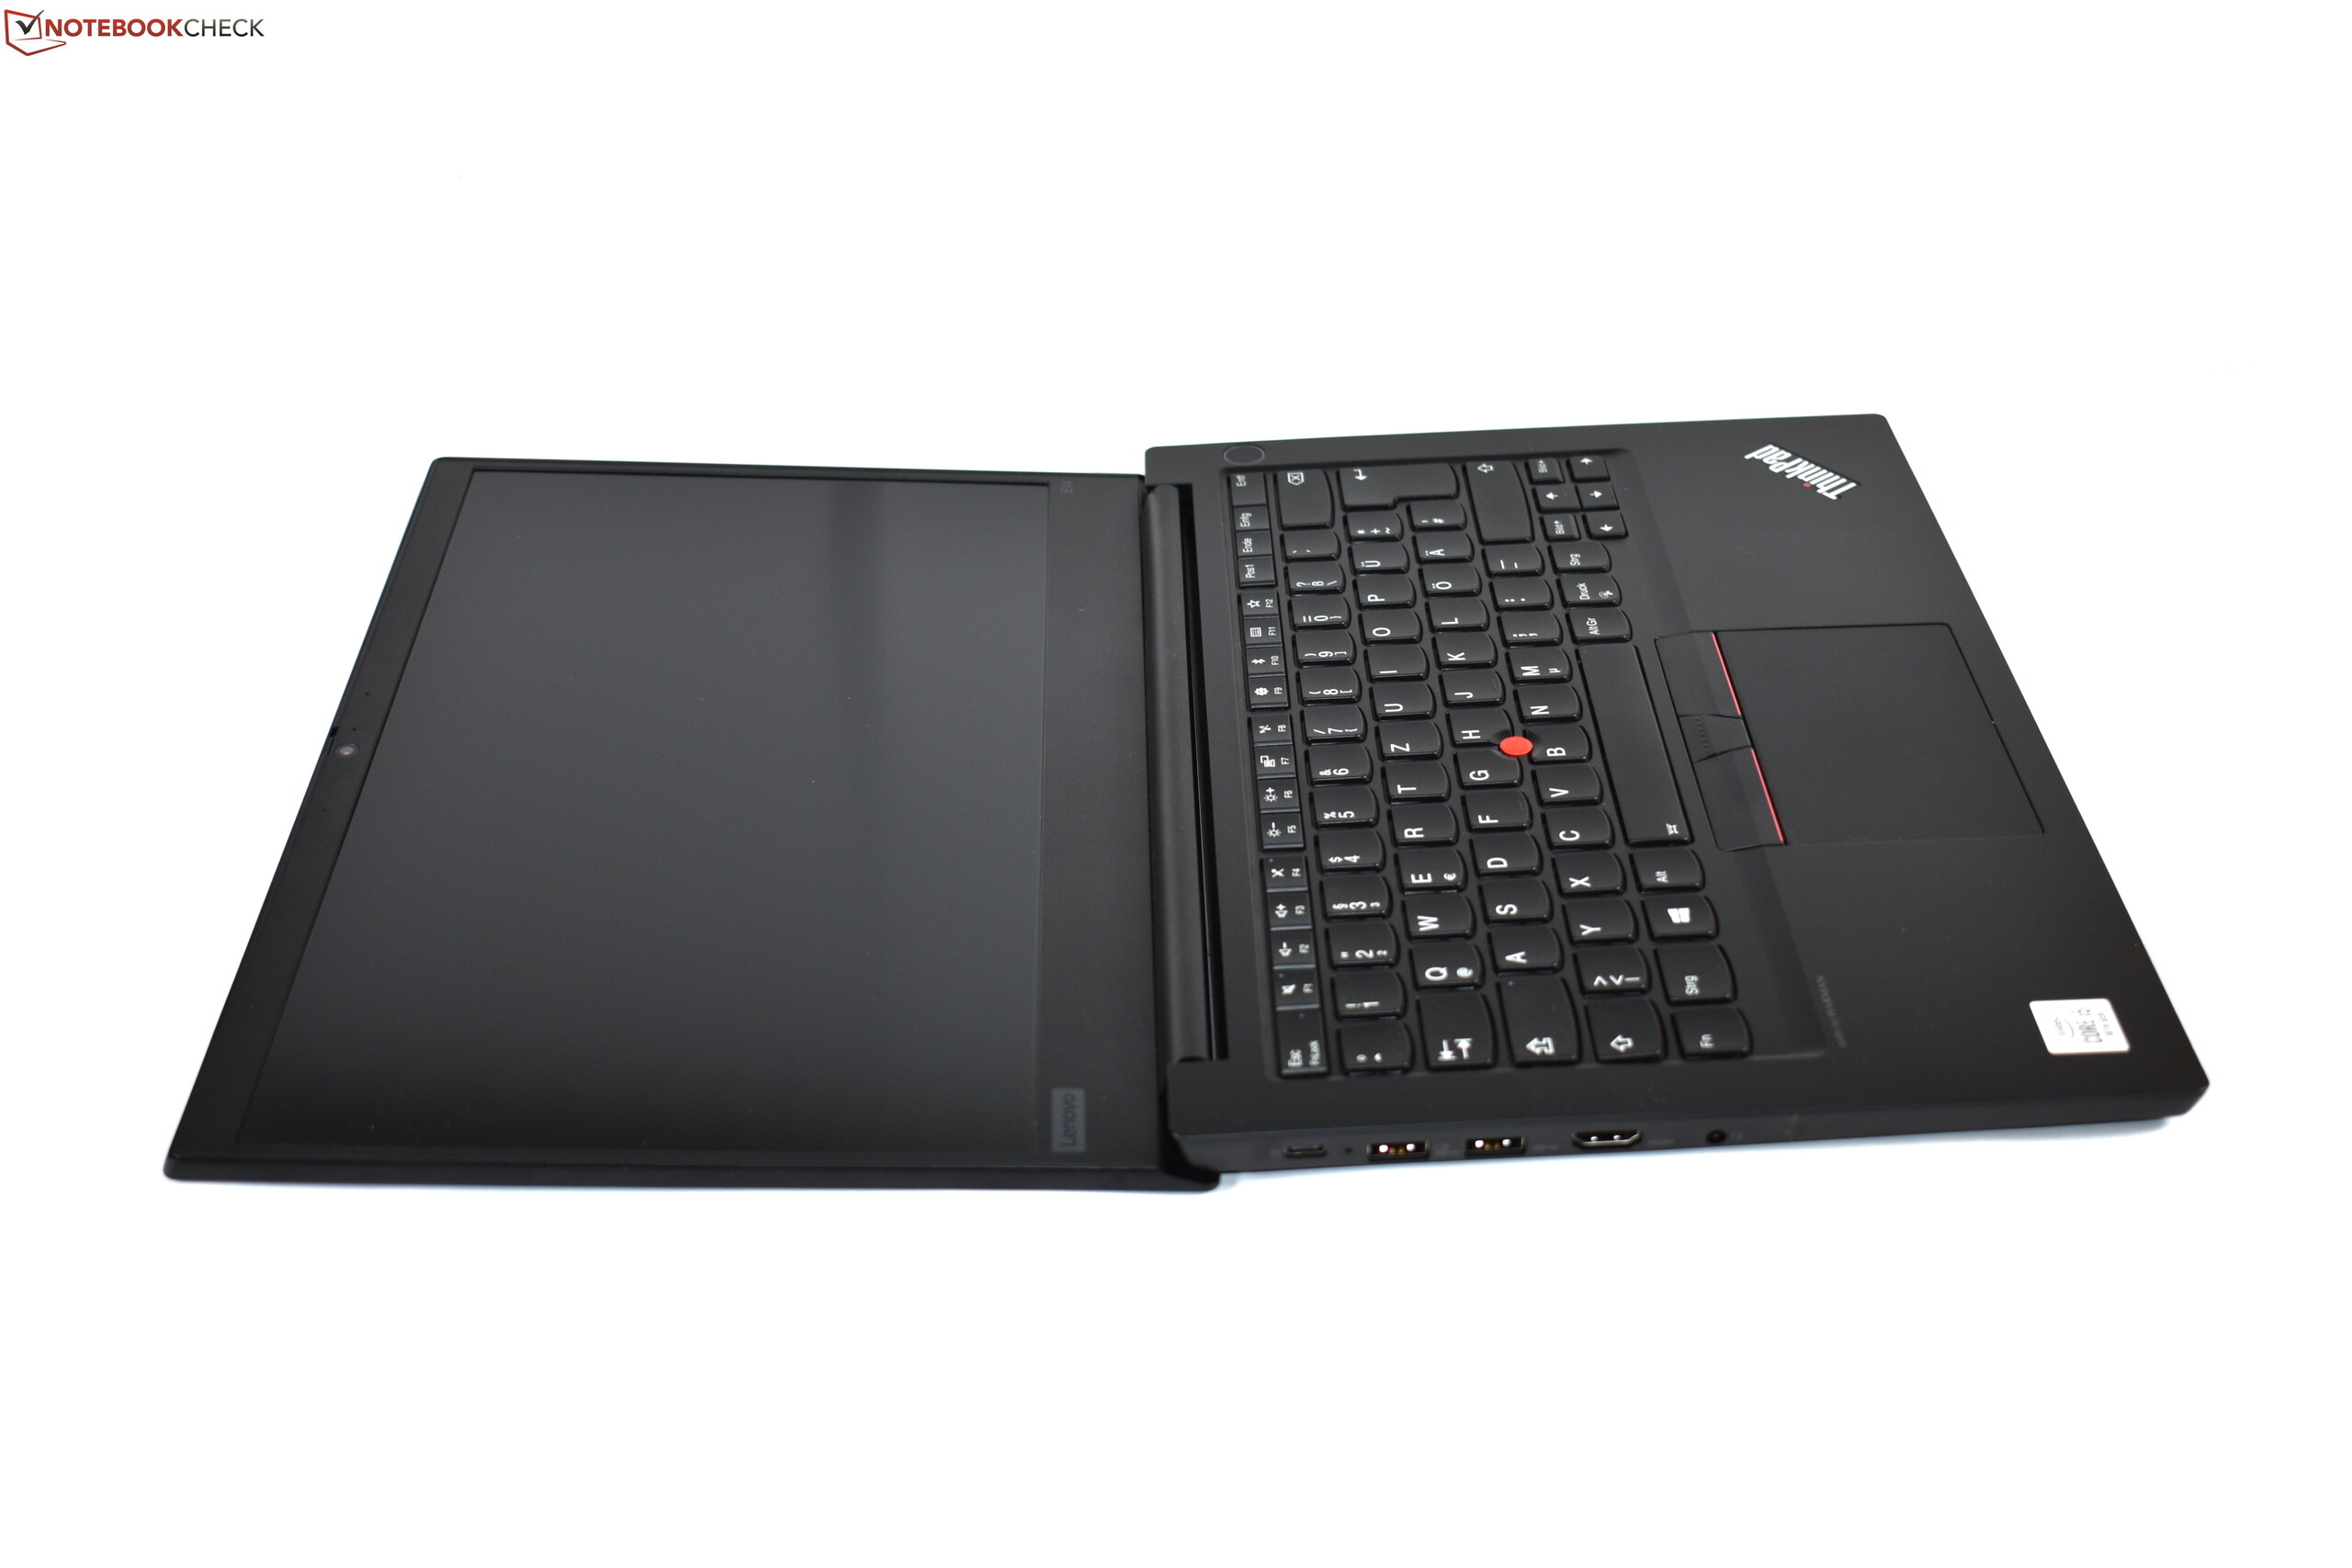
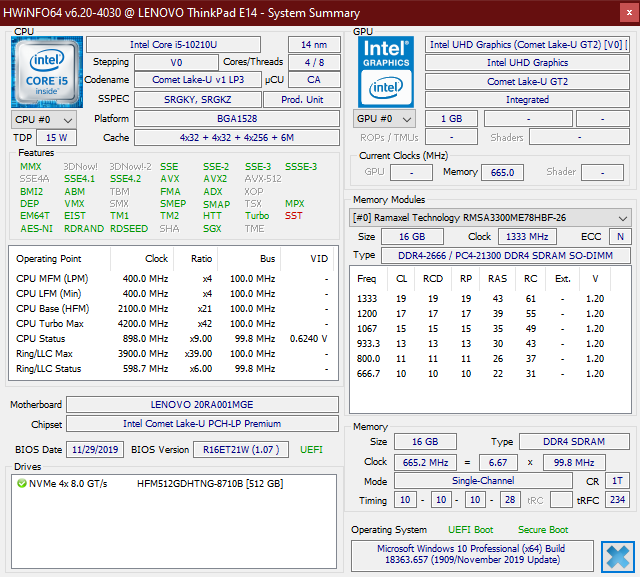
Sajnos néhány hátralépés is történt: A microSD kártyanyílást eltűntették, helyettesítés nélkül. A RAM bővíthetősége szintén korlátozottá vált: Két SO-DIMM nyílás és 64 GB-ig bővíthető, kétcsatornás memória helyett az E14 csak egyetlen RAM nyílást kínál 32 GB-ig terjedő egycsatornás memóriával. Egyéb negatívumok közé tartozik a rövid 12 hónapos memória és a képernyő, amelynek gyenge színskála-lefedettsége van. Némi aggodalomra ad okot a zsanérok körüli nyikorgó hang, amikor lehajtjuk a képernyőt - a kidolgozás egyértelműen nem tökéletes ezen a téren.
Nem igazán jobb, mint az elődje: A Lenovo ThinkPad E14 szükségtelenül eltávolít bizonyos funkciókat.
Összességében, még így is ajánlani tudjuk a Lenovo ThinkPad E14-et mint egy szolid ThinkPad laptopot a takarékosabbak számára, a hiányosságok ellenére - habár szerintünk a funkciók hiánya miatt nem olyan vonzó, mint elődje, a ThinkPad E490.
Lenovo ThinkPad E14 20RA001MGE
- 03/03/2020 v7 (old)
Benjamin Herzig
Price comparison

