Intel NUC 11 Beast Canyon és Core i9 and RTX 3060 - rövid értékelés


| Performance rating - Percent | |
| AMD Ryzen 7 5800X, NVIDIA Titan RTX | |
| AMD Ryzen 9 3950X, NVIDIA Titan RTX | |
| Intel Core i9-11900K, NVIDIA Titan RTX | |
| Intel Core i9-10900K, NVIDIA Titan RTX | |
| Intel Core i9-11900KB, NVIDIA GeForce RTX 3060 | |
| Intel Core i5-11600K, NVIDIA Titan RTX | |
| AMD Ryzen 7 3800XT, NVIDIA Titan RTX | |
| Intel Core i9-9980HK, NVIDIA GeForce RTX 2070 (Desktop) | |
| Intel Core i5-10600K, NVIDIA Titan RTX | |
| Cinebench R15 | |
| CPU Single 64Bit | |
| AMD Ryzen 7 5800X, NVIDIA Titan RTX | |
| Intel Core i9-11900K, NVIDIA Titan RTX | |
| Intel Core i9-11900KB, NVIDIA GeForce RTX 3060 | |
| Intel Core i5-11600K, NVIDIA Titan RTX | |
| Intel Core i9-10900K, NVIDIA Titan RTX | |
| AMD Ryzen 7 3800XT, NVIDIA Titan RTX | |
| Intel Core i9-9980HK, NVIDIA GeForce RTX 2070 (Desktop) | |
| AMD Ryzen 9 3950X, NVIDIA Titan RTX | |
| Intel Core i5-10600K, NVIDIA Titan RTX | |
| CPU Multi 64Bit | |
| AMD Ryzen 9 3950X, NVIDIA Titan RTX | |
| Intel Core i9-10900K, NVIDIA Titan RTX | |
| AMD Ryzen 7 5800X, NVIDIA Titan RTX | |
| Intel Core i9-11900K, NVIDIA Titan RTX | |
| AMD Ryzen 7 3800XT, NVIDIA Titan RTX | |
| Intel Core i9-11900KB, NVIDIA GeForce RTX 3060 | |
| Intel Core i5-11600K, NVIDIA Titan RTX | |
| Intel Core i9-9980HK, NVIDIA GeForce RTX 2070 (Desktop) | |
| Intel Core i5-10600K, NVIDIA Titan RTX | |
| Cinebench R20 | |
| CPU (Single Core) | |
| Intel Core i9-11900K, NVIDIA Titan RTX | |
| Intel Core i9-11900KB, NVIDIA GeForce RTX 3060 | |
| AMD Ryzen 7 5800X, NVIDIA Titan RTX | |
| Intel Core i5-11600K, NVIDIA Titan RTX | |
| AMD Ryzen 7 3800XT, NVIDIA Titan RTX | |
| Intel Core i9-10900K, NVIDIA Titan RTX | |
| AMD Ryzen 9 3950X, NVIDIA Titan RTX | |
| Intel Core i9-9980HK, NVIDIA GeForce RTX 2070 (Desktop) | |
| Intel Core i5-10600K, NVIDIA Titan RTX | |
| CPU (Multi Core) | |
| AMD Ryzen 9 3950X, NVIDIA Titan RTX | |
| Intel Core i9-10900K, NVIDIA Titan RTX | |
| AMD Ryzen 7 5800X, NVIDIA Titan RTX | |
| Intel Core i9-11900K, NVIDIA Titan RTX | |
| AMD Ryzen 7 3800XT, NVIDIA Titan RTX | |
| Intel Core i9-11900KB, NVIDIA GeForce RTX 3060 | |
| Intel Core i5-11600K, NVIDIA Titan RTX | |
| Intel Core i5-10600K, NVIDIA Titan RTX | |
| Intel Core i9-9980HK, NVIDIA GeForce RTX 2070 (Desktop) | |
| Cinebench R11.5 | |
| CPU Single 64Bit | |
| Intel Core i9-11900K, NVIDIA Titan RTX | |
| AMD Ryzen 7 5800X, NVIDIA Titan RTX | |
| Intel Core i5-11600K, NVIDIA Titan RTX | |
| Intel Core i9-11900KB, NVIDIA GeForce RTX 3060 | |
| Intel Core i9-10900K, NVIDIA Titan RTX | |
| Intel Core i9-9980HK, NVIDIA GeForce RTX 2070 (Desktop) | |
| AMD Ryzen 9 3950X, NVIDIA Titan RTX | |
| AMD Ryzen 7 3800XT, NVIDIA Titan RTX | |
| Intel Core i5-10600K, NVIDIA Titan RTX | |
| CPU Multi 64Bit | |
| AMD Ryzen 9 3950X, NVIDIA Titan RTX | |
| AMD Ryzen 7 5800X, NVIDIA Titan RTX | |
| Intel Core i9-10900K, NVIDIA Titan RTX | |
| Intel Core i9-11900K, NVIDIA Titan RTX | |
| AMD Ryzen 7 3800XT, NVIDIA Titan RTX | |
| Intel Core i9-11900KB, NVIDIA GeForce RTX 3060 | |
| Intel Core i5-11600K, NVIDIA Titan RTX | |
| Intel Core i9-9980HK, NVIDIA GeForce RTX 2070 (Desktop) | |
| Intel Core i5-10600K, NVIDIA Titan RTX | |
| Cinebench R10 | |
| Rendering Single CPUs 64Bit | |
| Intel Core i9-11900K, NVIDIA Titan RTX | |
| AMD Ryzen 7 5800X, NVIDIA Titan RTX | |
| Intel Core i5-11600K, NVIDIA Titan RTX | |
| Intel Core i9-11900KB, NVIDIA GeForce RTX 3060 | |
| Intel Core i9-10900K, NVIDIA Titan RTX | |
| AMD Ryzen 9 3950X, NVIDIA Titan RTX | |
| AMD Ryzen 7 3800XT, NVIDIA Titan RTX | |
| Intel Core i9-9980HK, NVIDIA GeForce RTX 2070 (Desktop) | |
| Intel Core i5-10600K, NVIDIA Titan RTX | |
| Rendering Multiple CPUs 64Bit | |
| AMD Ryzen 9 3950X, NVIDIA Titan RTX | |
| AMD Ryzen 7 5800X, NVIDIA Titan RTX | |
| Intel Core i9-11900K, NVIDIA Titan RTX | |
| Intel Core i9-10900K, NVIDIA Titan RTX | |
| AMD Ryzen 7 3800XT, NVIDIA Titan RTX | |
| Intel Core i9-11900KB, NVIDIA GeForce RTX 3060 | |
| Intel Core i5-11600K, NVIDIA Titan RTX | |
| Intel Core i9-9980HK, NVIDIA GeForce RTX 2070 (Desktop) | |
| Intel Core i5-10600K, NVIDIA Titan RTX | |
| Blender - v2.79 BMW27 CPU | |
| Intel Core i9-9980HK, NVIDIA GeForce RTX 2070 (Desktop) | |
| Intel Core i5-10600K, NVIDIA Titan RTX | |
| Intel Core i5-11600K, NVIDIA Titan RTX | |
| Intel Core i9-11900KB, NVIDIA GeForce RTX 3060 | |
| AMD Ryzen 7 3800XT, NVIDIA Titan RTX | |
| AMD Ryzen 7 5800X, NVIDIA Titan RTX | |
| Intel Core i9-11900K, NVIDIA Titan RTX | |
| Intel Core i9-10900K, NVIDIA Titan RTX | |
| AMD Ryzen 9 3950X, NVIDIA Titan RTX | |
| wPrime 2.10 | |
| 32m | |
| Intel Core i5-11600K, NVIDIA Titan RTX | |
| Intel Core i5-10600K, NVIDIA Titan RTX | |
| AMD Ryzen 9 3950X, NVIDIA Titan RTX | |
| Intel Core i9-11900K, NVIDIA Titan RTX | |
| Intel Core i9-9980HK, NVIDIA GeForce RTX 2070 (Desktop) | |
| AMD Ryzen 7 3800XT, NVIDIA Titan RTX | |
| Intel Core i9-10900K, NVIDIA Titan RTX | |
| Intel Core i9-11900KB, NVIDIA GeForce RTX 3060 | |
| AMD Ryzen 7 5800X, NVIDIA Titan RTX | |
| 1024m | |
| Intel Core i9-9980HK, NVIDIA GeForce RTX 2070 (Desktop) | |
| Intel Core i5-10600K, NVIDIA Titan RTX | |
| Intel Core i5-11600K, NVIDIA Titan RTX | |
| Intel Core i9-11900KB, NVIDIA GeForce RTX 3060 | |
| AMD Ryzen 7 5800X, NVIDIA Titan RTX | |
| AMD Ryzen 7 3800XT, NVIDIA Titan RTX | |
| Intel Core i9-11900K, NVIDIA Titan RTX | |
| Intel Core i9-10900K, NVIDIA Titan RTX | |
| AMD Ryzen 9 3950X, NVIDIA Titan RTX | |
| X264 HD Benchmark 4.0 | |
| Pass 1 | |
| AMD Ryzen 7 5800X, NVIDIA Titan RTX | |
| Intel Core i9-11900K, NVIDIA Titan RTX | |
| Intel Core i5-11600K, NVIDIA Titan RTX | |
| Intel Core i9-10900K, NVIDIA Titan RTX | |
| Intel Core i9-11900KB, NVIDIA GeForce RTX 3060 | |
| AMD Ryzen 7 3800XT, NVIDIA Titan RTX | |
| AMD Ryzen 9 3950X, NVIDIA Titan RTX | |
| Intel Core i5-10600K, NVIDIA Titan RTX | |
| Intel Core i9-9980HK, NVIDIA GeForce RTX 2070 (Desktop) | |
| Pass 2 | |
| AMD Ryzen 9 3950X, NVIDIA Titan RTX | |
| AMD Ryzen 7 5800X, NVIDIA Titan RTX | |
| Intel Core i9-10900K, NVIDIA Titan RTX | |
| Intel Core i9-11900K, NVIDIA Titan RTX | |
| AMD Ryzen 7 3800XT, NVIDIA Titan RTX | |
| Intel Core i9-11900KB, NVIDIA GeForce RTX 3060 | |
| Intel Core i5-11600K, NVIDIA Titan RTX | |
| Intel Core i9-9980HK, NVIDIA GeForce RTX 2070 (Desktop) | |
| Intel Core i5-10600K, NVIDIA Titan RTX | |
| WinRAR - Result | |
| AMD Ryzen 7 5800X, NVIDIA Titan RTX | |
| Intel Core i9-10900K, NVIDIA Titan RTX | |
| Intel Core i9-11900KB, NVIDIA GeForce RTX 3060 | |
| Intel Core i9-11900K, NVIDIA Titan RTX | |
| Intel Core i5-11600K, NVIDIA Titan RTX | |
| AMD Ryzen 7 3800XT, NVIDIA Titan RTX | |
| AMD Ryzen 9 3950X, NVIDIA Titan RTX | |
| Intel Core i9-9980HK, NVIDIA GeForce RTX 2070 (Desktop) | |
| Intel Core i5-10600K, NVIDIA Titan RTX | |
| TrueCrypt | |
| AES Mean 100MB | |
| AMD Ryzen 7 5800X, NVIDIA Titan RTX | |
| Intel Core i9-10900K, NVIDIA Titan RTX | |
| Intel Core i9-11900K, NVIDIA Titan RTX | |
| Intel Core i9-11900KB, NVIDIA GeForce RTX 3060 | |
| AMD Ryzen 7 3800XT, NVIDIA Titan RTX | |
| AMD Ryzen 9 3950X, NVIDIA Titan RTX | |
| Intel Core i9-9980HK, NVIDIA GeForce RTX 2070 (Desktop) | |
| Intel Core i5-11600K, NVIDIA Titan RTX | |
| Intel Core i5-10600K, NVIDIA Titan RTX | |
| Twofish Mean 100MB | |
| AMD Ryzen 9 3950X, NVIDIA Titan RTX | |
| Intel Core i9-10900K, NVIDIA Titan RTX | |
| AMD Ryzen 7 3800XT, NVIDIA Titan RTX | |
| AMD Ryzen 7 5800X, NVIDIA Titan RTX | |
| Intel Core i9-11900K, NVIDIA Titan RTX | |
| Intel Core i9-9980HK, NVIDIA GeForce RTX 2070 (Desktop) | |
| Intel Core i9-11900KB, NVIDIA GeForce RTX 3060 | |
| Intel Core i5-11600K, NVIDIA Titan RTX | |
| Intel Core i5-10600K, NVIDIA Titan RTX | |
| Serpent Mean 100MB | |
| AMD Ryzen 9 3950X, NVIDIA Titan RTX | |
| Intel Core i9-10900K, NVIDIA Titan RTX | |
| AMD Ryzen 7 5800X, NVIDIA Titan RTX | |
| AMD Ryzen 7 3800XT, NVIDIA Titan RTX | |
| Intel Core i9-11900K, NVIDIA Titan RTX | |
| Intel Core i9-11900KB, NVIDIA GeForce RTX 3060 | |
| Intel Core i9-9980HK, NVIDIA GeForce RTX 2070 (Desktop) | |
| Intel Core i5-11600K, NVIDIA Titan RTX | |
| Intel Core i5-10600K, NVIDIA Titan RTX | |
| Geekbench 5.5 | |
| Multi-Core | |
| AMD Ryzen 9 3950X, NVIDIA Titan RTX | |
| Intel Core i9-10900K, NVIDIA Titan RTX | |
| AMD Ryzen 7 5800X, NVIDIA Titan RTX | |
| Intel Core i9-11900K, NVIDIA Titan RTX | |
| AMD Ryzen 7 3800XT, NVIDIA Titan RTX | |
| Intel Core i9-11900KB, NVIDIA GeForce RTX 3060 | |
| Intel Core i5-11600K, NVIDIA Titan RTX | |
| Intel Core i9-9980HK, NVIDIA GeForce RTX 2070 (Desktop) | |
| Intel Core i5-10600K, NVIDIA Titan RTX | |
| Single-Core | |
| Intel Core i9-11900K, NVIDIA Titan RTX | |
| Intel Core i5-11600K, NVIDIA Titan RTX | |
| AMD Ryzen 7 5800X, NVIDIA Titan RTX | |
| Intel Core i9-11900KB, NVIDIA GeForce RTX 3060 | |
| Intel Core i9-10900K, NVIDIA Titan RTX | |
| Intel Core i9-9980HK, NVIDIA GeForce RTX 2070 (Desktop) | |
| AMD Ryzen 7 3800XT, NVIDIA Titan RTX | |
| AMD Ryzen 9 3950X, NVIDIA Titan RTX | |
| Intel Core i5-10600K, NVIDIA Titan RTX | |
| Geekbench 5.0 | |
| 5.0 Multi-Core | |
| AMD Ryzen 9 3950X, NVIDIA Titan RTX | |
| Intel Core i9-10900K, NVIDIA Titan RTX | |
| AMD Ryzen 7 5800X, NVIDIA Titan RTX | |
| Intel Core i9-11900K, NVIDIA Titan RTX | |
| AMD Ryzen 7 3800XT, NVIDIA Titan RTX | |
| Intel Core i9-11900KB, NVIDIA GeForce RTX 3060 | |
| Intel Core i5-11600K, NVIDIA Titan RTX | |
| Intel Core i9-9980HK, NVIDIA GeForce RTX 2070 (Desktop) | |
| Intel Core i5-10600K, NVIDIA Titan RTX | |
| 5.0 Single-Core | |
| Intel Core i9-11900K, NVIDIA Titan RTX | |
| Intel Core i5-11600K, NVIDIA Titan RTX | |
| AMD Ryzen 7 5800X, NVIDIA Titan RTX | |
| Intel Core i9-11900KB, NVIDIA GeForce RTX 3060 | |
| Intel Core i9-10900K, NVIDIA Titan RTX | |
| AMD Ryzen 7 3800XT, NVIDIA Titan RTX | |
| Intel Core i9-9980HK, NVIDIA GeForce RTX 2070 (Desktop) | |
| AMD Ryzen 9 3950X, NVIDIA Titan RTX | |
| Intel Core i5-10600K, NVIDIA Titan RTX | |
| Geekbench 4.4 | |
| 64 Bit Single-Core Score | |
| Intel Core i9-11900K, NVIDIA Titan RTX | |
| Intel Core i5-11600K, NVIDIA Titan RTX | |
| AMD Ryzen 7 5800X, NVIDIA Titan RTX | |
| Intel Core i9-11900KB, NVIDIA GeForce RTX 3060 | |
| Intel Core i9-10900K, NVIDIA Titan RTX | |
| Intel Core i9-9980HK, NVIDIA GeForce RTX 2070 (Desktop) | |
| AMD Ryzen 7 3800XT, NVIDIA Titan RTX | |
| Intel Core i5-10600K, NVIDIA Titan RTX | |
| AMD Ryzen 9 3950X, NVIDIA Titan RTX | |
| 64 Bit Multi-Core Score | |
| AMD Ryzen 9 3950X, NVIDIA Titan RTX | |
| AMD Ryzen 7 5800X, NVIDIA Titan RTX | |
| Intel Core i9-10900K, NVIDIA Titan RTX | |
| Intel Core i9-11900K, NVIDIA Titan RTX | |
| Intel Core i9-11900KB, NVIDIA GeForce RTX 3060 | |
| AMD Ryzen 7 3800XT, NVIDIA Titan RTX | |
| Intel Core i5-11600K, NVIDIA Titan RTX | |
| Intel Core i9-9980HK, NVIDIA GeForce RTX 2070 (Desktop) | |
| Intel Core i5-10600K, NVIDIA Titan RTX | |
| 3DMark 11 - 1280x720 Performance Physics | |
| AMD Ryzen 7 5800X, NVIDIA Titan RTX | |
| Intel Core i9-10900K, NVIDIA Titan RTX | |
| Intel Core i9-11900K, NVIDIA Titan RTX | |
| AMD Ryzen 9 3950X, NVIDIA Titan RTX | |
| AMD Ryzen 7 3800XT, NVIDIA Titan RTX | |
| Intel Core i9-11900KB, NVIDIA GeForce RTX 3060 | |
| Intel Core i5-11600K, NVIDIA Titan RTX | |
| Intel Core i9-9980HK, NVIDIA GeForce RTX 2070 (Desktop) | |
| Intel Core i5-10600K, NVIDIA Titan RTX | |
| 7-Zip 18.03 | |
| 7z b 4 | |
| AMD Ryzen 9 3950X, NVIDIA Titan RTX | |
| AMD Ryzen 7 5800X, NVIDIA Titan RTX | |
| Intel Core i9-10900K, NVIDIA Titan RTX | |
| Intel Core i9-11900K, NVIDIA Titan RTX | |
| AMD Ryzen 7 3800XT, NVIDIA Titan RTX | |
| Intel Core i9-11900KB, NVIDIA GeForce RTX 3060 | |
| Intel Core i5-11600K, NVIDIA Titan RTX | |
| Intel Core i9-9980HK, NVIDIA GeForce RTX 2070 (Desktop) | |
| Intel Core i5-10600K, NVIDIA Titan RTX | |
| 7z b 4 -mmt1 | |
| AMD Ryzen 7 5800X, NVIDIA Titan RTX | |
| Intel Core i9-11900K, NVIDIA Titan RTX | |
| Intel Core i5-11600K, NVIDIA Titan RTX | |
| Intel Core i9-11900KB, NVIDIA GeForce RTX 3060 | |
| Intel Core i9-10900K, NVIDIA Titan RTX | |
| Intel Core i9-9980HK, NVIDIA GeForce RTX 2070 (Desktop) | |
| AMD Ryzen 7 3800XT, NVIDIA Titan RTX | |
| AMD Ryzen 9 3950X, NVIDIA Titan RTX | |
| Intel Core i5-10600K, NVIDIA Titan RTX | |
| HWBOT x265 Benchmark v2.2 - 4k Preset | |
| Intel Core i9-10900K, NVIDIA Titan RTX | |
| AMD Ryzen 7 5800X, NVIDIA Titan RTX | |
| Intel Core i9-11900K, NVIDIA Titan RTX | |
| AMD Ryzen 7 3800XT, NVIDIA Titan RTX | |
| AMD Ryzen 9 3950X, NVIDIA Titan RTX | |
| Intel Core i5-11600K, NVIDIA Titan RTX | |
| Intel Core i9-11900KB, NVIDIA GeForce RTX 3060 | |
| Intel Core i5-10600K, NVIDIA Titan RTX | |
| Intel Core i9-9980HK, NVIDIA GeForce RTX 2070 (Desktop) | |
| R Benchmark 2.5 - Overall mean | |
| Intel Core i5-10600K, NVIDIA Titan RTX | |
| Intel Core i9-9980HK, NVIDIA GeForce RTX 2070 (Desktop) | |
| Intel Core i9-11900KB, NVIDIA GeForce RTX 3060 | |
| Intel Core i9-10900K, NVIDIA Titan RTX | |
| AMD Ryzen 9 3950X, NVIDIA Titan RTX | |
| AMD Ryzen 7 3800XT, NVIDIA Titan RTX | |
| Intel Core i5-11600K, NVIDIA Titan RTX | |
| Intel Core i9-11900K, NVIDIA Titan RTX | |
| AMD Ryzen 7 5800X, NVIDIA Titan RTX | |
| LibreOffice - 20 Documents To PDF | |
| Intel Core i9-10900K, NVIDIA Titan RTX | |
| Intel Core i9-11900K, NVIDIA Titan RTX | |
| AMD Ryzen 9 3950X, NVIDIA Titan RTX | |
| Intel Core i5-10600K, NVIDIA Titan RTX | |
| Intel Core i9-9980HK, NVIDIA GeForce RTX 2070 (Desktop) | |
| Intel Core i9-11900KB, NVIDIA GeForce RTX 3060 | |
| AMD Ryzen 7 3800XT, NVIDIA Titan RTX | |
| AMD Ryzen 7 5800X, NVIDIA Titan RTX | |
| Intel Core i5-11600K, NVIDIA Titan RTX | |
| WebXPRT 3 - Overall | |
| AMD Ryzen 7 5800X, NVIDIA Titan RTX | |
| Intel Core i5-11600K, NVIDIA Titan RTX | |
| Intel Core i9-11900KB, NVIDIA GeForce RTX 3060 | |
| Intel Core i9-10900K, NVIDIA Titan RTX | |
| AMD Ryzen 7 3800XT, NVIDIA Titan RTX | |
| AMD Ryzen 9 3950X, NVIDIA Titan RTX | |
| Intel Core i5-10600K, NVIDIA Titan RTX | |
| Intel Core i9-9980HK, NVIDIA GeForce RTX 2070 (Desktop) | |
| Intel Core i9-11900K, NVIDIA Titan RTX | |
| Mozilla Kraken 1.1 - Total | |
| Intel Core i5-10600K, NVIDIA Titan RTX | |
| Intel Core i9-9980HK, NVIDIA GeForce RTX 2070 (Desktop) | |
| Intel Core i9-10900K, NVIDIA Titan RTX | |
| AMD Ryzen 9 3950X, NVIDIA Titan RTX | |
| AMD Ryzen 7 3800XT, NVIDIA Titan RTX | |
| Intel Core i9-11900KB, NVIDIA GeForce RTX 3060 | |
| Intel Core i5-11600K, NVIDIA Titan RTX | |
| AMD Ryzen 7 5800X, NVIDIA Titan RTX | |
| Intel Core i9-11900K, NVIDIA Titan RTX | |
| 3DMark | |
| 3840x2160 Fire Strike Ultra Physics | |
| AMD Ryzen 9 3950X, NVIDIA Titan RTX | |
| AMD Ryzen 7 5800X, NVIDIA Titan RTX | |
| Intel Core i9-10900K, NVIDIA Titan RTX | |
| Intel Core i9-11900K, NVIDIA Titan RTX | |
| AMD Ryzen 7 3800XT, NVIDIA Titan RTX | |
| Intel Core i9-11900KB, NVIDIA GeForce RTX 3060 | |
| Intel Core i5-11600K, NVIDIA Titan RTX | |
| Intel Core i9-9980HK, NVIDIA GeForce RTX 2070 (Desktop) | |
| Intel Core i5-10600K, NVIDIA Titan RTX | |
| 1920x1080 Fire Strike Physics | |
| AMD Ryzen 9 3950X, NVIDIA Titan RTX | |
| AMD Ryzen 7 5800X, NVIDIA Titan RTX | |
| Intel Core i9-10900K, NVIDIA Titan RTX | |
| Intel Core i9-11900K, NVIDIA Titan RTX | |
| AMD Ryzen 7 3800XT, NVIDIA Titan RTX | |
| Intel Core i9-11900KB, NVIDIA GeForce RTX 3060 | |
| Intel Core i5-11600K, NVIDIA Titan RTX | |
| Intel Core i9-9980HK, NVIDIA GeForce RTX 2070 (Desktop) | |
| Intel Core i5-10600K, NVIDIA Titan RTX | |
| 2560x1440 Time Spy CPU | |
| Intel Core i9-10900K, NVIDIA Titan RTX | |
| Intel Core i9-11900K, NVIDIA Titan RTX | |
| AMD Ryzen 9 3950X, NVIDIA Titan RTX | |
| AMD Ryzen 7 5800X, NVIDIA Titan RTX | |
| AMD Ryzen 7 3800XT, NVIDIA Titan RTX | |
| Intel Core i9-11900KB, NVIDIA GeForce RTX 3060 | |
| Intel Core i5-11600K, NVIDIA Titan RTX | |
| Intel Core i9-9980HK, NVIDIA GeForce RTX 2070 (Desktop) | |
| Intel Core i5-10600K, NVIDIA Titan RTX | |
* ... a kisebb jobb
| Performance rating - Percent | |
| Intel Core i9-11900K, Intel Core i9-11900K | |
| Intel Core i5-11600K, Intel Core i5-11600K | |
| Intel Core i9-10900K, Intel Core i9-10900K | |
| Intel Core i5-10600K, Intel Core i5-10600K | |
| AMD Ryzen 9 3950X, AMD Ryzen 9 3950X | |
| Corsair One i160, Intel Core i9-9900K | |
| Intel Beast Canyon NUC, Intel Core i9-11900KB | |
| Intel Ghost Canyon NUC (RTX 2070), Intel Core i9-9980HK | |
| PCMark 10 - Score | |
| AMD Ryzen 9 3950X, AMD Ryzen 9 3950X | |
| Intel Core i9-11900K, Intel Core i9-11900K | |
| Intel Core i5-11600K, Intel Core i5-11600K | |
| Intel Core i9-10900K, Intel Core i9-10900K | |
| Corsair One i160, Intel Core i9-9900K | |
| Intel Beast Canyon NUC, Intel Core i9-11900KB | |
| Intel Core i5-10600K, Intel Core i5-10600K | |
| Intel Ghost Canyon NUC (RTX 2070), Intel Core i9-9980HK | |
| SPECviewperf 12 | |
| 1900x1060 Solidworks (sw-03) | |
| Intel Core i9-11900K, Intel Core i9-11900K | |
| Intel Core i9-10900K, Intel Core i9-10900K | |
| Intel Core i5-11600K, Intel Core i5-11600K | |
| Intel Core i5-10600K, Intel Core i5-10600K | |
| AMD Ryzen 9 3950X, AMD Ryzen 9 3950X | |
| Corsair One i160, Intel Core i9-9900K | |
| Intel Beast Canyon NUC, Intel Core i9-11900KB | |
| Intel Ghost Canyon NUC (RTX 2070), Intel Core i9-9980HK | |
| 1900x1060 Siemens NX (snx-02) | |
| Intel Core i9-10900K, Intel Core i9-10900K | |
| Intel Core i5-10600K, Intel Core i5-10600K | |
| AMD Ryzen 9 3950X, AMD Ryzen 9 3950X | |
| Intel Core i5-11600K, Intel Core i5-11600K | |
| Intel Core i9-11900K, Intel Core i9-11900K | |
| Corsair One i160, Intel Core i9-9900K | |
| Intel Ghost Canyon NUC (RTX 2070), Intel Core i9-9980HK | |
| Intel Beast Canyon NUC, Intel Core i9-11900KB | |
| 1900x1060 Showcase (showcase-01) | |
| Intel Core i9-11900K, Intel Core i9-11900K | |
| Intel Core i5-11600K, Intel Core i5-11600K | |
| Intel Core i5-10600K, Intel Core i5-10600K | |
| Intel Core i9-10900K, Intel Core i9-10900K | |
| AMD Ryzen 9 3950X, AMD Ryzen 9 3950X | |
| Corsair One i160, Intel Core i9-9900K | |
| Intel Ghost Canyon NUC (RTX 2070), Intel Core i9-9980HK | |
| Intel Beast Canyon NUC, Intel Core i9-11900KB | |
| 1900x1060 Medical (medical-01) | |
| Intel Core i5-10600K, Intel Core i5-10600K | |
| Intel Core i9-10900K, Intel Core i9-10900K | |
| Intel Core i5-11600K, Intel Core i5-11600K | |
| AMD Ryzen 9 3950X, AMD Ryzen 9 3950X | |
| Intel Core i9-11900K, Intel Core i9-11900K | |
| Corsair One i160, Intel Core i9-9900K | |
| Intel Beast Canyon NUC, Intel Core i9-11900KB | |
| Intel Ghost Canyon NUC (RTX 2070), Intel Core i9-9980HK | |
| 1900x1060 Maya (maya-04) | |
| Intel Core i9-11900K, Intel Core i9-11900K | |
| Intel Beast Canyon NUC, Intel Core i9-11900KB | |
| Corsair One i160, Intel Core i9-9900K | |
| Intel Core i9-10900K, Intel Core i9-10900K | |
| Intel Core i5-11600K, Intel Core i5-11600K | |
| AMD Ryzen 9 3950X, AMD Ryzen 9 3950X | |
| Intel Ghost Canyon NUC (RTX 2070), Intel Core i9-9980HK | |
| Intel Core i5-10600K, Intel Core i5-10600K | |
| 1900x1060 Energy (energy-01) | |
| Intel Core i5-10600K, Intel Core i5-10600K | |
| Intel Core i9-10900K, Intel Core i9-10900K | |
| Intel Core i5-11600K, Intel Core i5-11600K | |
| Intel Core i9-11900K, Intel Core i9-11900K | |
| AMD Ryzen 9 3950X, AMD Ryzen 9 3950X | |
| Corsair One i160, Intel Core i9-9900K | |
| Intel Ghost Canyon NUC (RTX 2070), Intel Core i9-9980HK | |
| Intel Beast Canyon NUC, Intel Core i9-11900KB | |
| 1900x1060 Creo (creo-01) | |
| Intel Core i9-11900K, Intel Core i9-11900K | |
| Intel Core i5-11600K, Intel Core i5-11600K | |
| Intel Core i9-10900K, Intel Core i9-10900K | |
| Intel Core i5-10600K, Intel Core i5-10600K | |
| AMD Ryzen 9 3950X, AMD Ryzen 9 3950X | |
| Corsair One i160, Intel Core i9-9900K | |
| Intel Ghost Canyon NUC (RTX 2070), Intel Core i9-9980HK | |
| Intel Beast Canyon NUC, Intel Core i9-11900KB | |
| 1900x1060 Catia (catia-04) | |
| Intel Core i9-11900K, Intel Core i9-11900K | |
| Intel Core i5-11600K, Intel Core i5-11600K | |
| Intel Core i9-10900K, Intel Core i9-10900K | |
| AMD Ryzen 9 3950X, AMD Ryzen 9 3950X | |
| Intel Core i5-10600K, Intel Core i5-10600K | |
| Corsair One i160, Intel Core i9-9900K | |
| Intel Ghost Canyon NUC (RTX 2070), Intel Core i9-9980HK | |
| Intel Beast Canyon NUC, Intel Core i9-11900KB | |
| 1900x1060 3ds Max (3dsmax-05) | |
| Intel Core i9-10900K, Intel Core i9-10900K | |
| Intel Core i5-10600K, Intel Core i5-10600K | |
| Intel Core i9-11900K, Intel Core i9-11900K | |
| Intel Core i5-11600K, Intel Core i5-11600K | |
| AMD Ryzen 9 3950X, AMD Ryzen 9 3950X | |
| Corsair One i160, Intel Core i9-9900K | |
| Intel Beast Canyon NUC, Intel Core i9-11900KB | |
| Intel Ghost Canyon NUC (RTX 2070), Intel Core i9-9980HK | |
| SPECviewperf 13 | |
| Solidworks (sw-04) | |
| Intel Core i9-11900K, Intel Core i9-11900K | |
| Intel Core i5-11600K, Intel Core i5-11600K | |
| Intel Core i9-10900K, Intel Core i9-10900K | |
| Intel Core i5-10600K, Intel Core i5-10600K | |
| AMD Ryzen 9 3950X, AMD Ryzen 9 3950X | |
| Corsair One i160, Intel Core i9-9900K | |
| Intel Beast Canyon NUC, Intel Core i9-11900KB | |
| Intel Ghost Canyon NUC (RTX 2070), Intel Core i9-9980HK | |
| Siemens NX (snx-03) | |
| Intel Core i9-10900K, Intel Core i9-10900K | |
| Intel Core i5-10600K, Intel Core i5-10600K | |
| AMD Ryzen 9 3950X, AMD Ryzen 9 3950X | |
| Intel Core i5-11600K, Intel Core i5-11600K | |
| Intel Core i9-11900K, Intel Core i9-11900K | |
| Corsair One i160, Intel Core i9-9900K | |
| Intel Ghost Canyon NUC (RTX 2070), Intel Core i9-9980HK | |
| Intel Beast Canyon NUC, Intel Core i9-11900KB | |
| Showcase (showcase-02) | |
| Intel Core i5-10600K, Intel Core i5-10600K | |
| Intel Core i9-10900K, Intel Core i9-10900K | |
| Intel Core i9-11900K, Intel Core i9-11900K | |
| Intel Core i5-11600K, Intel Core i5-11600K | |
| AMD Ryzen 9 3950X, AMD Ryzen 9 3950X | |
| Corsair One i160, Intel Core i9-9900K | |
| Intel Ghost Canyon NUC (RTX 2070), Intel Core i9-9980HK | |
| Intel Beast Canyon NUC, Intel Core i9-11900KB | |
| Medical (medical-02) | |
| AMD Ryzen 9 3950X, AMD Ryzen 9 3950X | |
| Intel Core i9-11900K, Intel Core i9-11900K | |
| Intel Core i5-11600K, Intel Core i5-11600K | |
| Intel Core i5-10600K, Intel Core i5-10600K | |
| Intel Core i9-10900K, Intel Core i9-10900K | |
| Corsair One i160, Intel Core i9-9900K | |
| Intel Ghost Canyon NUC (RTX 2070), Intel Core i9-9980HK | |
| Intel Beast Canyon NUC, Intel Core i9-11900KB | |
| Maya (maya-05) | |
| Intel Core i9-11900K, Intel Core i9-11900K | |
| Intel Core i5-11600K, Intel Core i5-11600K | |
| Intel Core i9-10900K, Intel Core i9-10900K | |
| Corsair One i160, Intel Core i9-9900K | |
| AMD Ryzen 9 3950X, AMD Ryzen 9 3950X | |
| Intel Core i5-10600K, Intel Core i5-10600K | |
| Intel Ghost Canyon NUC (RTX 2070), Intel Core i9-9980HK | |
| Intel Beast Canyon NUC, Intel Core i9-11900KB | |
| Energy (energy-02) | |
| Intel Core i5-11600K, Intel Core i5-11600K | |
| Intel Core i9-11900K, Intel Core i9-11900K | |
| Intel Core i5-10600K, Intel Core i5-10600K | |
| Intel Core i9-10900K, Intel Core i9-10900K | |
| AMD Ryzen 9 3950X, AMD Ryzen 9 3950X | |
| Corsair One i160, Intel Core i9-9900K | |
| Intel Ghost Canyon NUC (RTX 2070), Intel Core i9-9980HK | |
| Intel Beast Canyon NUC, Intel Core i9-11900KB | |
| Creo (creo-02) | |
| Intel Core i9-11900K, Intel Core i9-11900K | |
| Intel Core i5-11600K, Intel Core i5-11600K | |
| Intel Core i9-10900K, Intel Core i9-10900K | |
| Intel Core i5-10600K, Intel Core i5-10600K | |
| AMD Ryzen 9 3950X, AMD Ryzen 9 3950X | |
| Corsair One i160, Intel Core i9-9900K | |
| Intel Ghost Canyon NUC (RTX 2070), Intel Core i9-9980HK | |
| Intel Beast Canyon NUC, Intel Core i9-11900KB | |
| Catia (catia-05) | |
| Intel Core i9-11900K, Intel Core i9-11900K | |
| Intel Core i5-11600K, Intel Core i5-11600K | |
| Intel Core i9-10900K, Intel Core i9-10900K | |
| AMD Ryzen 9 3950X, AMD Ryzen 9 3950X | |
| Intel Core i5-10600K, Intel Core i5-10600K | |
| Corsair One i160, Intel Core i9-9900K | |
| Intel Ghost Canyon NUC (RTX 2070), Intel Core i9-9980HK | |
| Intel Beast Canyon NUC, Intel Core i9-11900KB | |
| 3ds Max (3dsmax-06) | |
| Intel Core i5-10600K, Intel Core i5-10600K | |
| Intel Core i9-10900K, Intel Core i9-10900K | |
| Intel Core i5-11600K, Intel Core i5-11600K | |
| Intel Core i9-11900K, Intel Core i9-11900K | |
| AMD Ryzen 9 3950X, AMD Ryzen 9 3950X | |
| Corsair One i160, Intel Core i9-9900K | |
| Intel Beast Canyon NUC, Intel Core i9-11900KB | |
| Intel Ghost Canyon NUC (RTX 2070), Intel Core i9-9980HK | |
| Performance rating - Percent | |
| Zotac Magnus One (ECM73070C) | |
| Inno3D GeForce RTX 3060 Twin X2 | |
| Intel Beast Canyon NUC -2! | |
| Intel Ghost Canyon NUC (RTX 2070) | |
| Borderlands 3 | |
| 1280x720 Very Low Overall Quality (DX11) | |
| Inno3D GeForce RTX 3060 Twin X2 | |
| Intel Beast Canyon NUC | |
| Intel Ghost Canyon NUC (RTX 2070) | |
| Zotac Magnus One (ECM73070C) | |
| 1920x1080 Badass Overall Quality (DX11) | |
| Intel Beast Canyon NUC | |
| Zotac Magnus One (ECM73070C) | |
| Inno3D GeForce RTX 3060 Twin X2 | |
| Intel Ghost Canyon NUC (RTX 2070) | |
| Metro Exodus | |
| 1280x720 Low Quality AF:4x | |
| Inno3D GeForce RTX 3060 Twin X2 | |
| Intel Beast Canyon NUC | |
| Intel Ghost Canyon NUC (RTX 2070) | |
| Zotac Magnus One (ECM73070C) | |
| 1920x1080 Ultra Quality AF:16x | |
| Zotac Magnus One (ECM73070C) | |
| Intel Ghost Canyon NUC (RTX 2070) | |
| Intel Beast Canyon NUC | |
| Inno3D GeForce RTX 3060 Twin X2 | |
| Far Cry New Dawn | |
| 1280x720 Low Preset | |
| Inno3D GeForce RTX 3060 Twin X2 | |
| Intel Beast Canyon NUC | |
| Intel Ghost Canyon NUC (RTX 2070) | |
| Zotac Magnus One (ECM73070C) | |
| 1920x1080 Ultra Preset | |
| Inno3D GeForce RTX 3060 Twin X2 | |
| Intel Beast Canyon NUC | |
| Zotac Magnus One (ECM73070C) | |
| Intel Ghost Canyon NUC (RTX 2070) | |
| Far Cry 5 | |
| 1280x720 Low Preset AA:T | |
| Inno3D GeForce RTX 3060 Twin X2 | |
| Intel Beast Canyon NUC | |
| Zotac Magnus One (ECM73070C) | |
| Intel Ghost Canyon NUC (RTX 2070) | |
| 1920x1080 Ultra Preset AA:T | |
| Inno3D GeForce RTX 3060 Twin X2 | |
| Intel Beast Canyon NUC | |
| Zotac Magnus One (ECM73070C) | |
| Intel Ghost Canyon NUC (RTX 2070) | |
| X-Plane 11.11 | |
| 1280x720 low (fps_test=1) | |
| Inno3D GeForce RTX 3060 Twin X2 | |
| Intel Beast Canyon NUC | |
| Intel Ghost Canyon NUC (RTX 2070) | |
| Zotac Magnus One (ECM73070C) | |
| 1920x1080 high (fps_test=3) | |
| Inno3D GeForce RTX 3060 Twin X2 | |
| Intel Beast Canyon NUC | |
| Intel Ghost Canyon NUC (RTX 2070) | |
| Zotac Magnus One (ECM73070C) | |
| Final Fantasy XV Benchmark | |
| 1280x720 Lite Quality | |
| Inno3D GeForce RTX 3060 Twin X2 | |
| Intel Beast Canyon NUC | |
| Intel Ghost Canyon NUC (RTX 2070) | |
| Zotac Magnus One (ECM73070C) | |
| 1920x1080 High Quality | |
| Zotac Magnus One (ECM73070C) | |
| Intel Ghost Canyon NUC (RTX 2070) | |
| Inno3D GeForce RTX 3060 Twin X2 | |
| Intel Beast Canyon NUC | |
| Dota 2 Reborn | |
| 1280x720 min (0/3) fastest | |
| Inno3D GeForce RTX 3060 Twin X2 | |
| Intel Beast Canyon NUC | |
| Zotac Magnus One (ECM73070C) | |
| Intel Ghost Canyon NUC (RTX 2070) | |
| 1920x1080 ultra (3/3) best looking | |
| Inno3D GeForce RTX 3060 Twin X2 | |
| Intel Beast Canyon NUC | |
| Intel Ghost Canyon NUC (RTX 2070) | |
| Zotac Magnus One (ECM73070C) | |
| The Witcher 3 | |
| 1024x768 Low Graphics & Postprocessing | |
| Inno3D GeForce RTX 3060 Twin X2 | |
| Zotac Magnus One (ECM73070C) | |
| Intel Ghost Canyon NUC (RTX 2070) | |
| 1920x1080 Ultra Graphics & Postprocessing (HBAO+) | |
| Zotac Magnus One (ECM73070C) | |
| Intel Ghost Canyon NUC (RTX 2070) | |
| Inno3D GeForce RTX 3060 Twin X2 | |
| 3DMark | |
| Fire Strike Extreme Graphics | |
| Zotac Magnus One (ECM73070C) | |
| Inno3D GeForce RTX 3060 Twin X2 | |
| Intel Beast Canyon NUC | |
| Intel Ghost Canyon NUC (RTX 2070) | |
| 1920x1080 Fire Strike Graphics | |
| Zotac Magnus One (ECM73070C) | |
| Inno3D GeForce RTX 3060 Twin X2 | |
| Intel Beast Canyon NUC | |
| Intel Ghost Canyon NUC (RTX 2070) | |
| 2560x1440 Time Spy Graphics | |
| Zotac Magnus One (ECM73070C) | |
| Intel Ghost Canyon NUC (RTX 2070) | |
| Inno3D GeForce RTX 3060 Twin X2 | |
| Intel Beast Canyon NUC | |
| alacsony | közepes | magas | ultra | QHD DLSS | QHD | 4K DLSS | 4K | |
|---|---|---|---|---|---|---|---|---|
| GTA V (2015) | 186 | 181 | 177 | 104 | 81.4 | 82.3 | ||
| Dota 2 Reborn (2015) | 178.3 | 161.7 | 155.6 | 147.1 | 116.1 | |||
| Final Fantasy XV Benchmark (2018) | 196 | 123 | 88.6 | 64.8 | 38 | |||
| X-Plane 11.11 (2018) | 151 | 133 | 105 | 88.5 | ||||
| Far Cry 5 (2018) | 170 | 140 | 131 | 122 | 94 | 49 | ||
| Strange Brigade (2018) | 491 | 230 | 180 | 154 | 116 | 66.8 | ||
| Far Cry New Dawn (2019) | 144 | 120 | 115 | 102 | 88 | 50 | ||
| Metro Exodus (2019) | 198 | 105 | 77.4 | 59.8 | 48.6 | 31.3 | ||
| Borderlands 3 (2019) | 156 | 152 | 133 | 100 | 70.2 | 36.8 | ||
| F1 2020 (2020) | 355 | 259 | 208 | 142 | 106 | 60.2 | ||
| F1 2021 (2021) | 419 | 261 | 206 | 96.9 | 72 | 40.9 | ||
| Far Cry 6 (2021) | 136 | 116 | 103 | 90.8 | 68.8 | 38.8 | ||
| Baldur's Gate 3 (2023) | 131 | 100 | 86.7 | 86 | 59 | 30.8 | ||
| Kingdom Come Deliverance 2 (2025) | 81.7 | 66.5 | 46.8 | |||||
| F1 25 (2025) | 209 | 174.7 | 131.4 | 11.5 | 12 | 6.63 | 5.61 | 3.08 |
| Borderlands 4 (2025) | 42.5 | 34.6 | 26.8 | 19.6 |
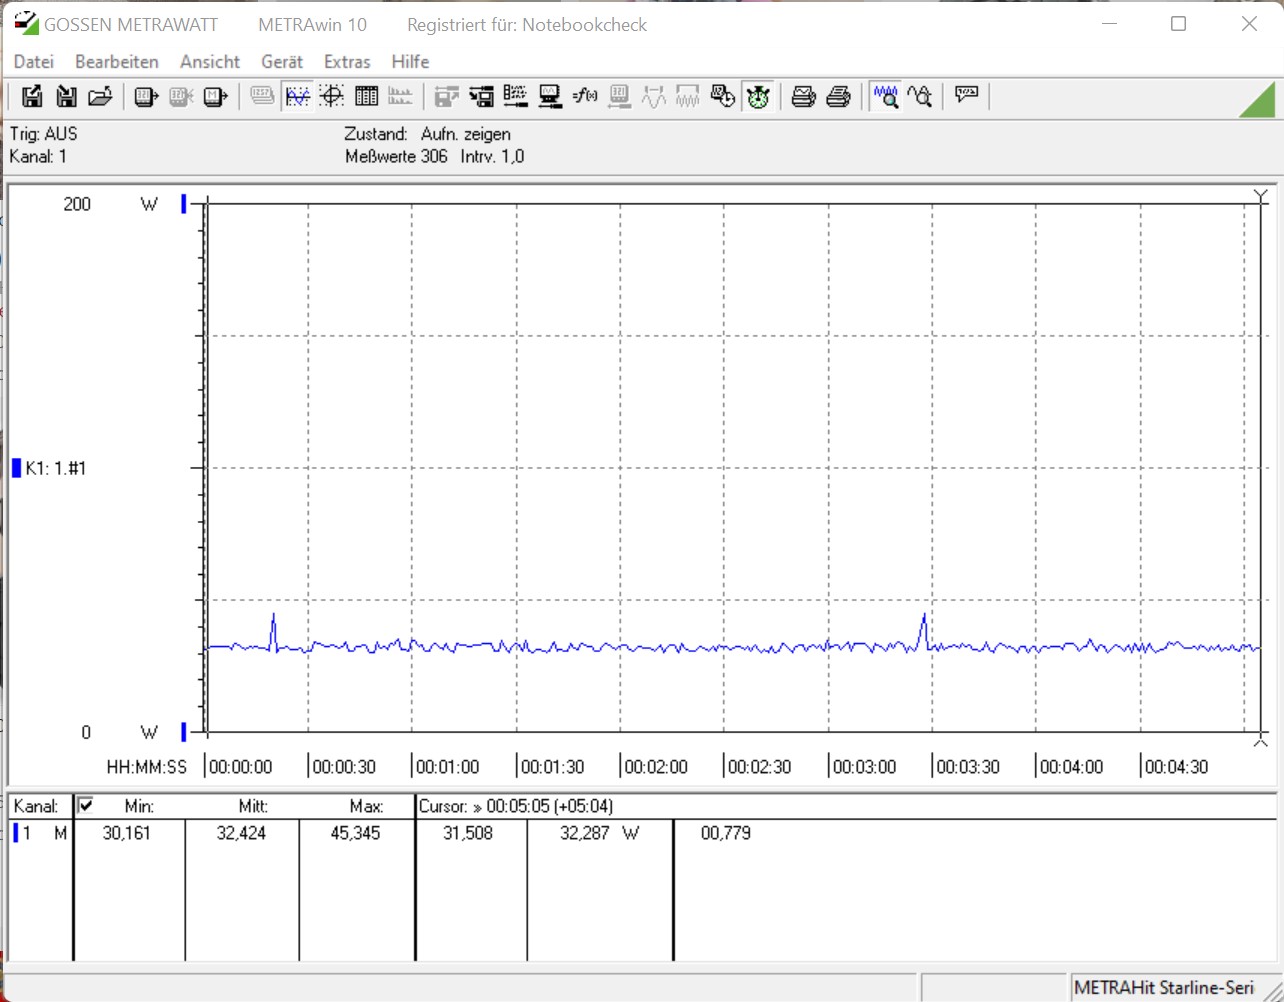
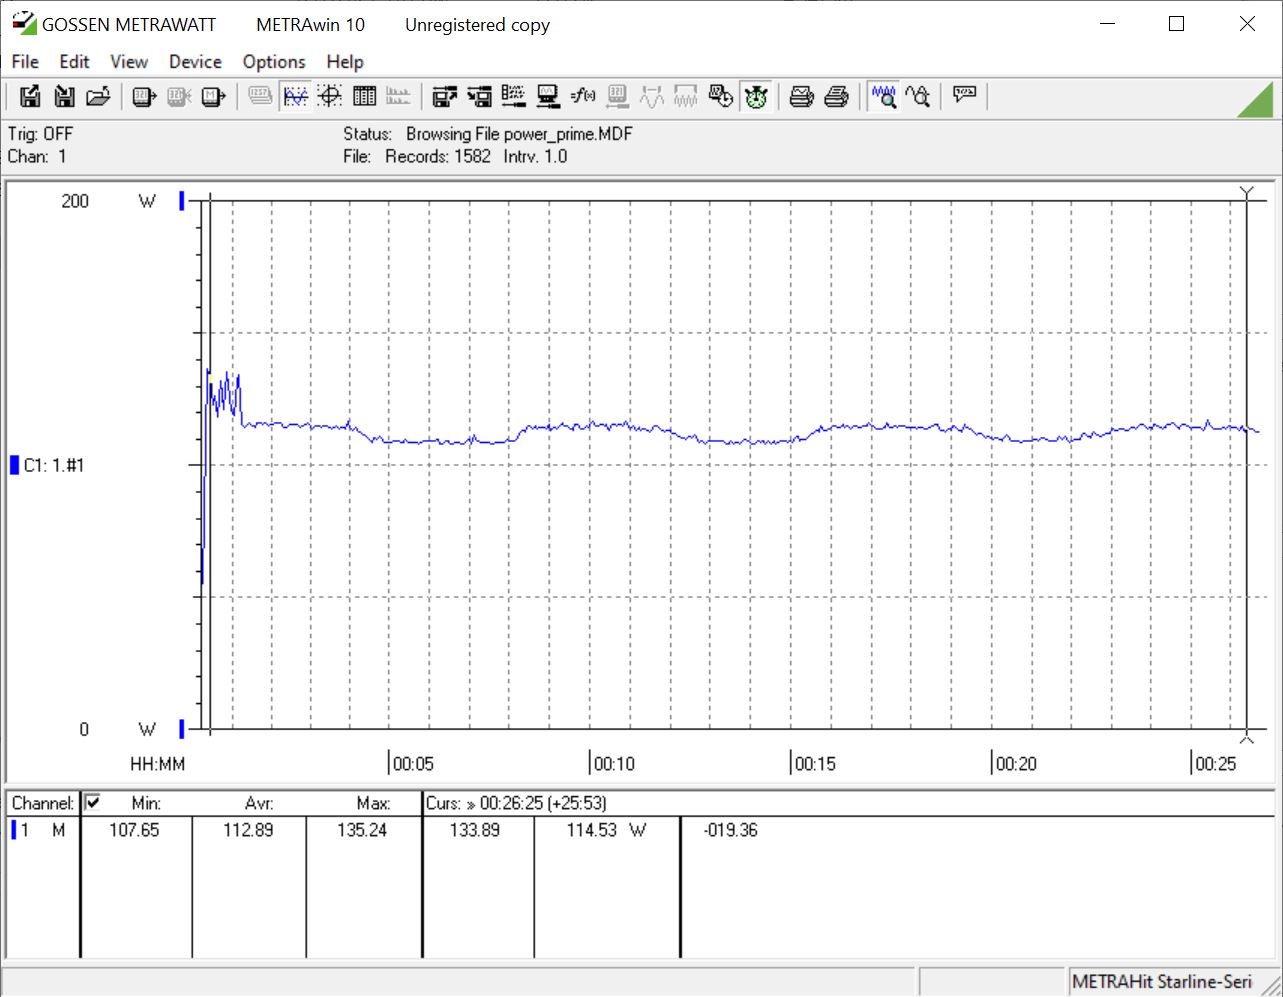
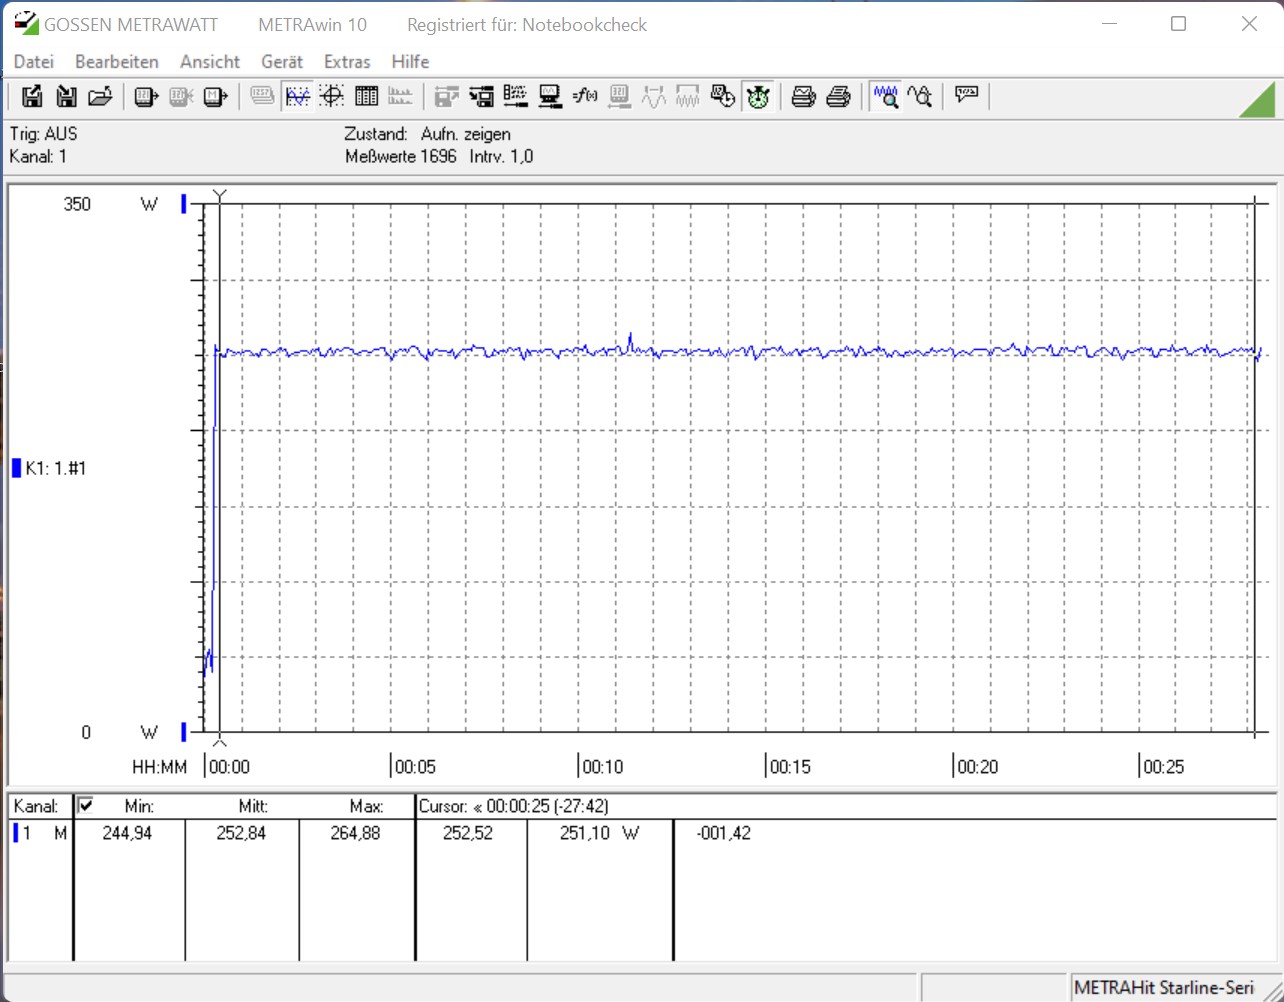
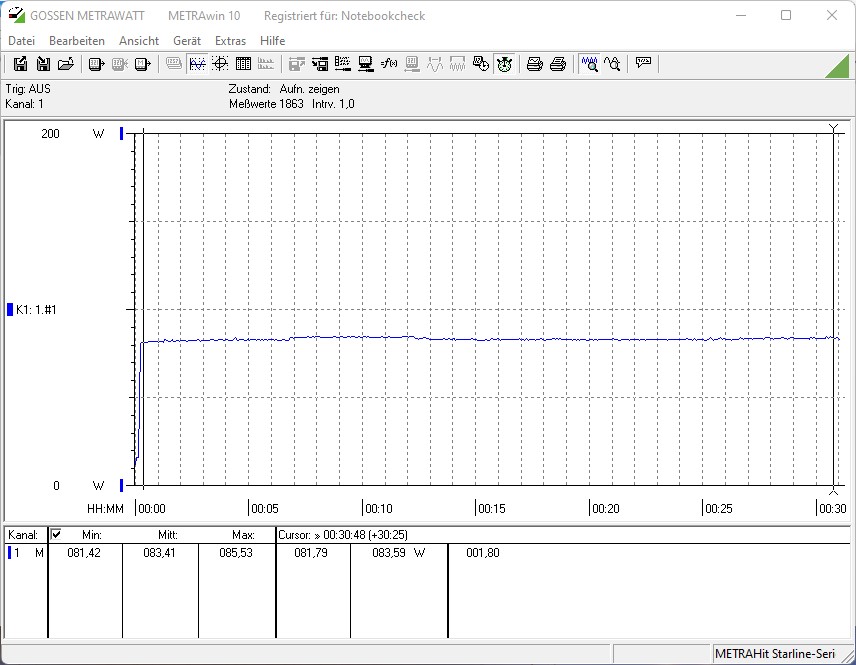
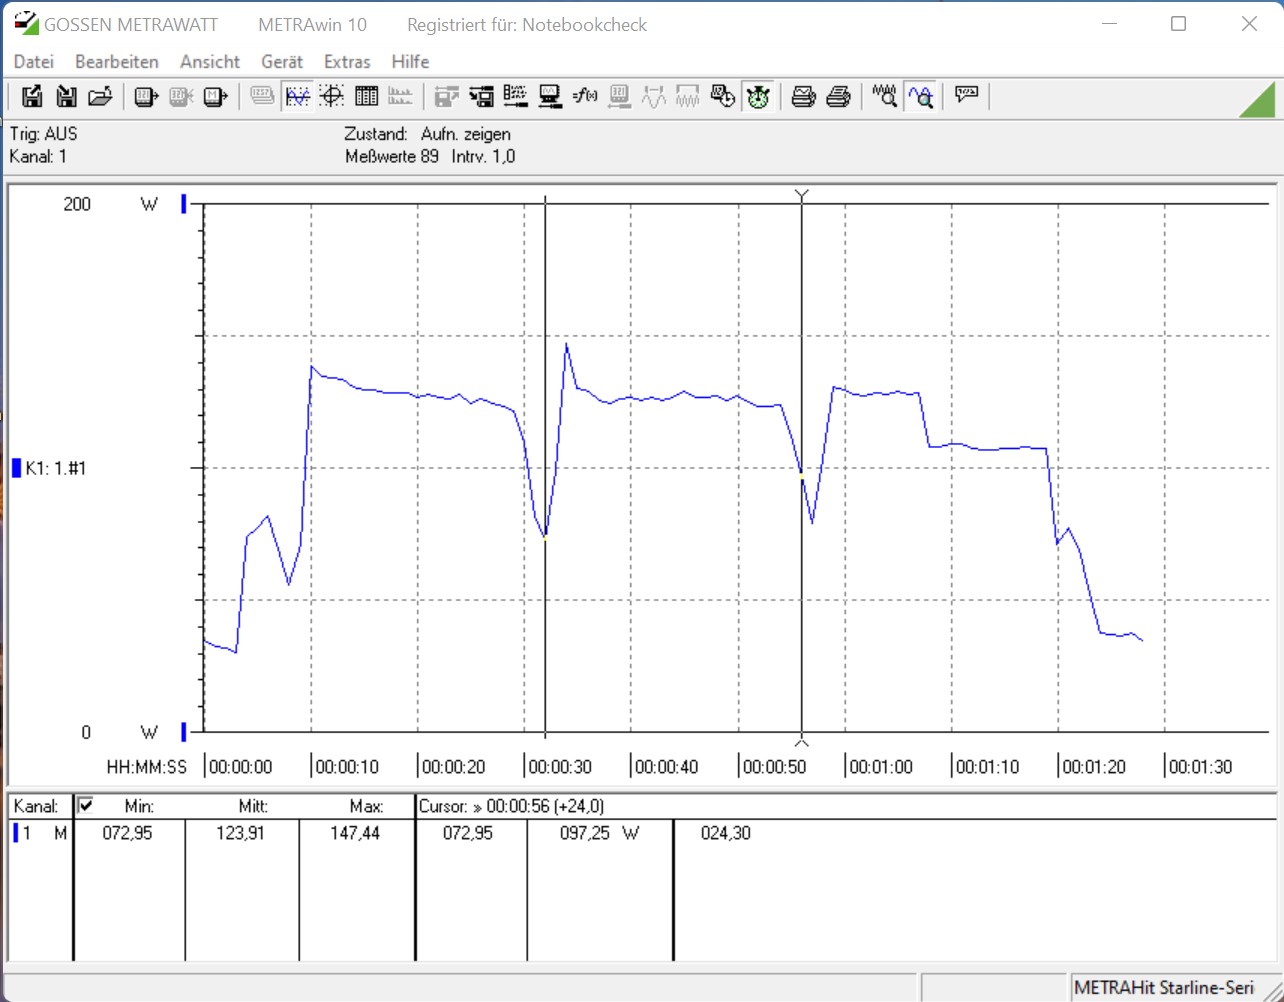
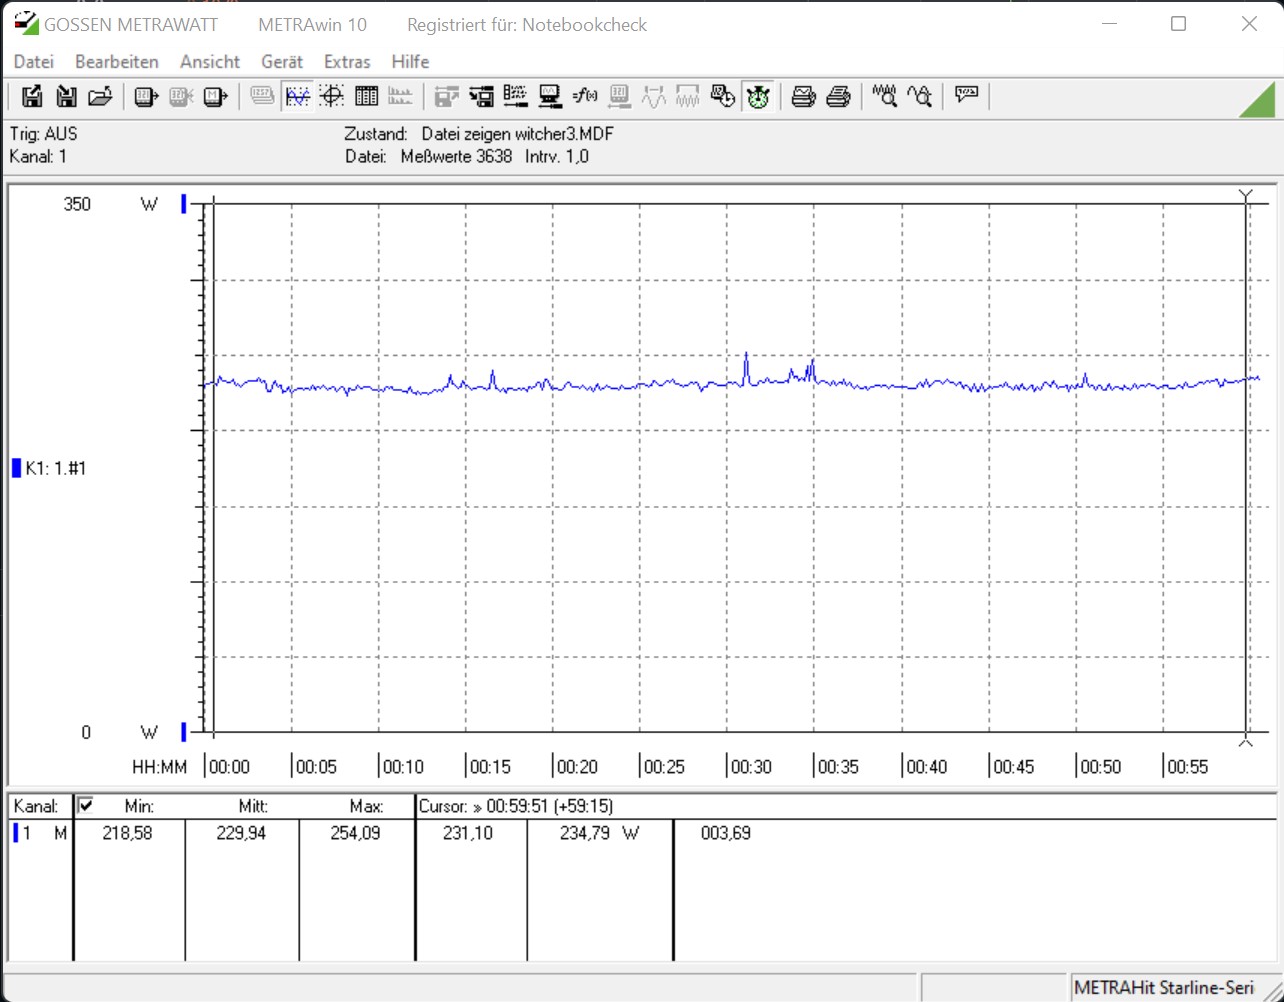
| Power Consumption | |
| 1920x1080 The Witcher 3 ultra (external Monitor) | |
| AMD Ryzen 9 3950X (Idle: 95 W) | |
| Intel Core i9-10900K (Idle: 52.3 W) | |
| Intel Core i5-10600K (Idle: 52.2 W) | |
| Corsair One i160 (Idle: 51.5 W) | |
| Intel Ghost Canyon NUC (RTX 2070) (Idle: 33.1 W) | |
| Intel Beast Canyon NUC (Idle: 32 W) | |
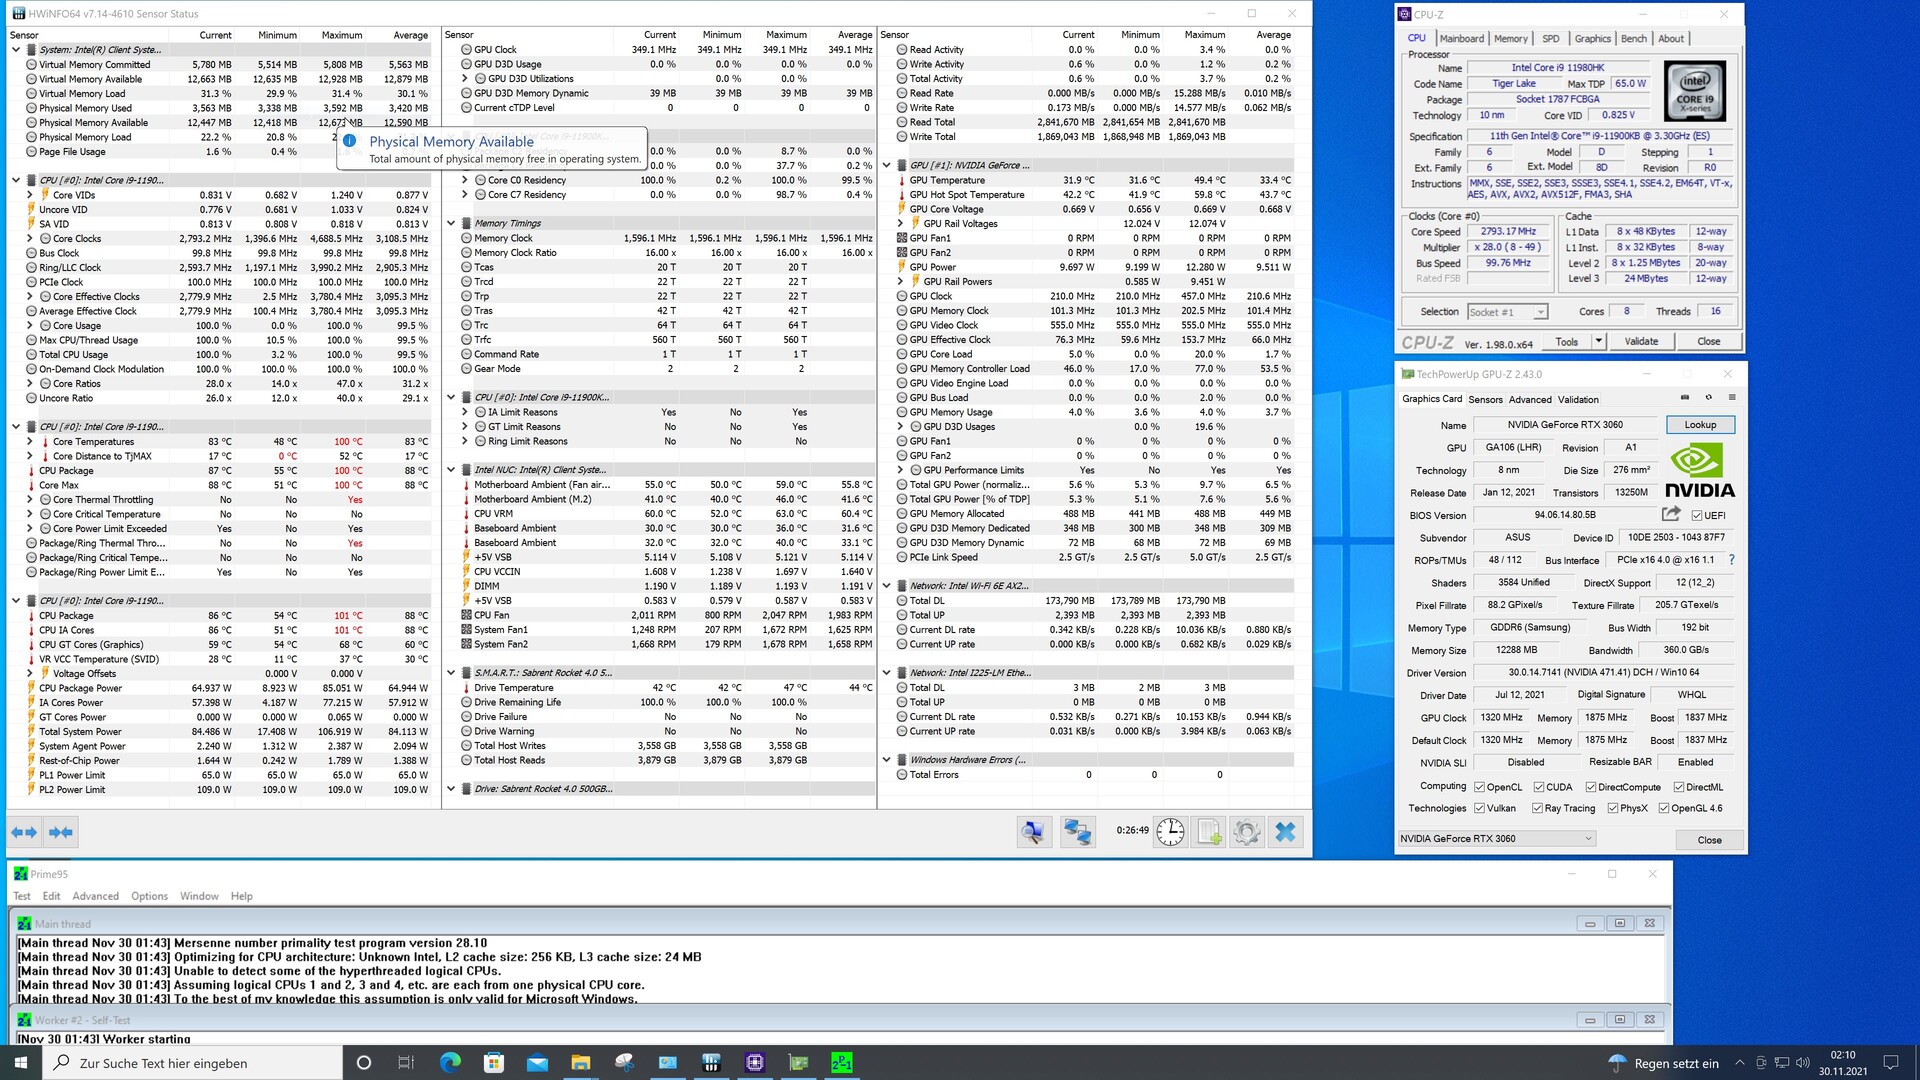
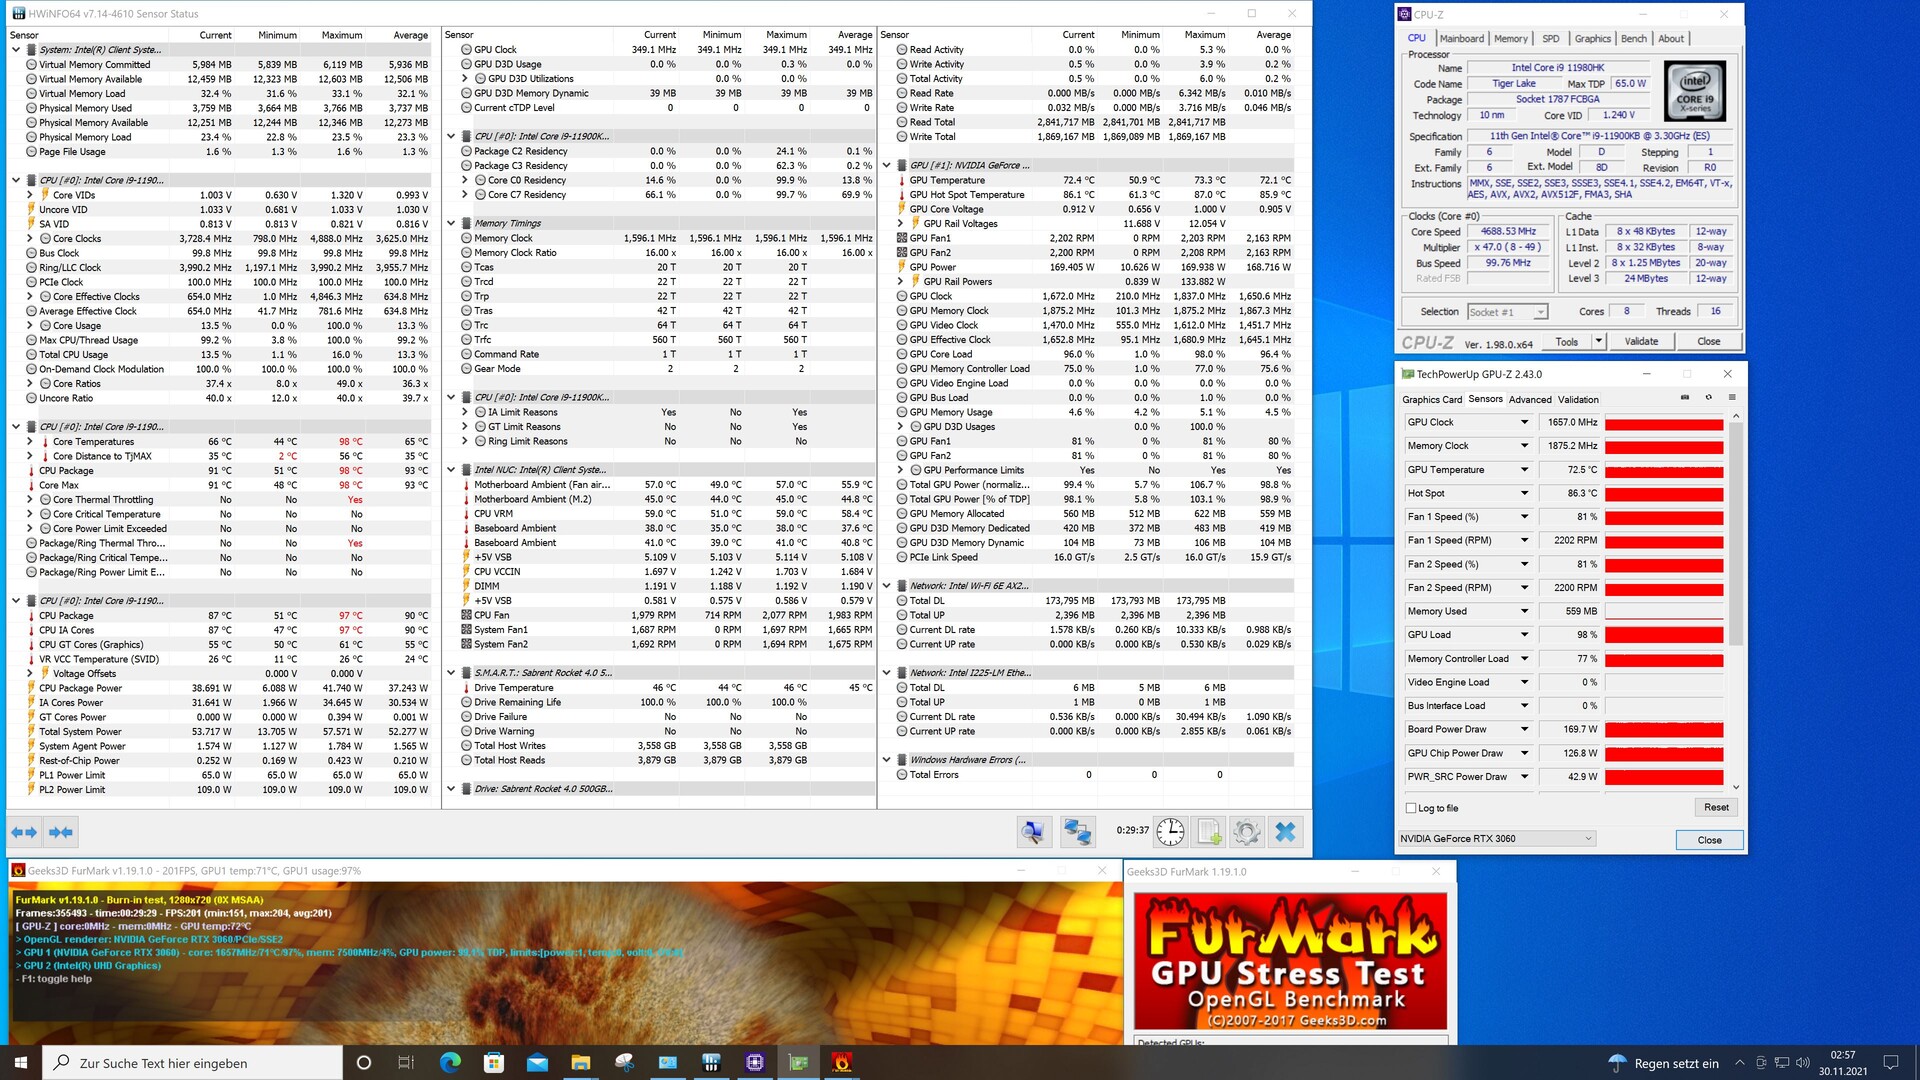
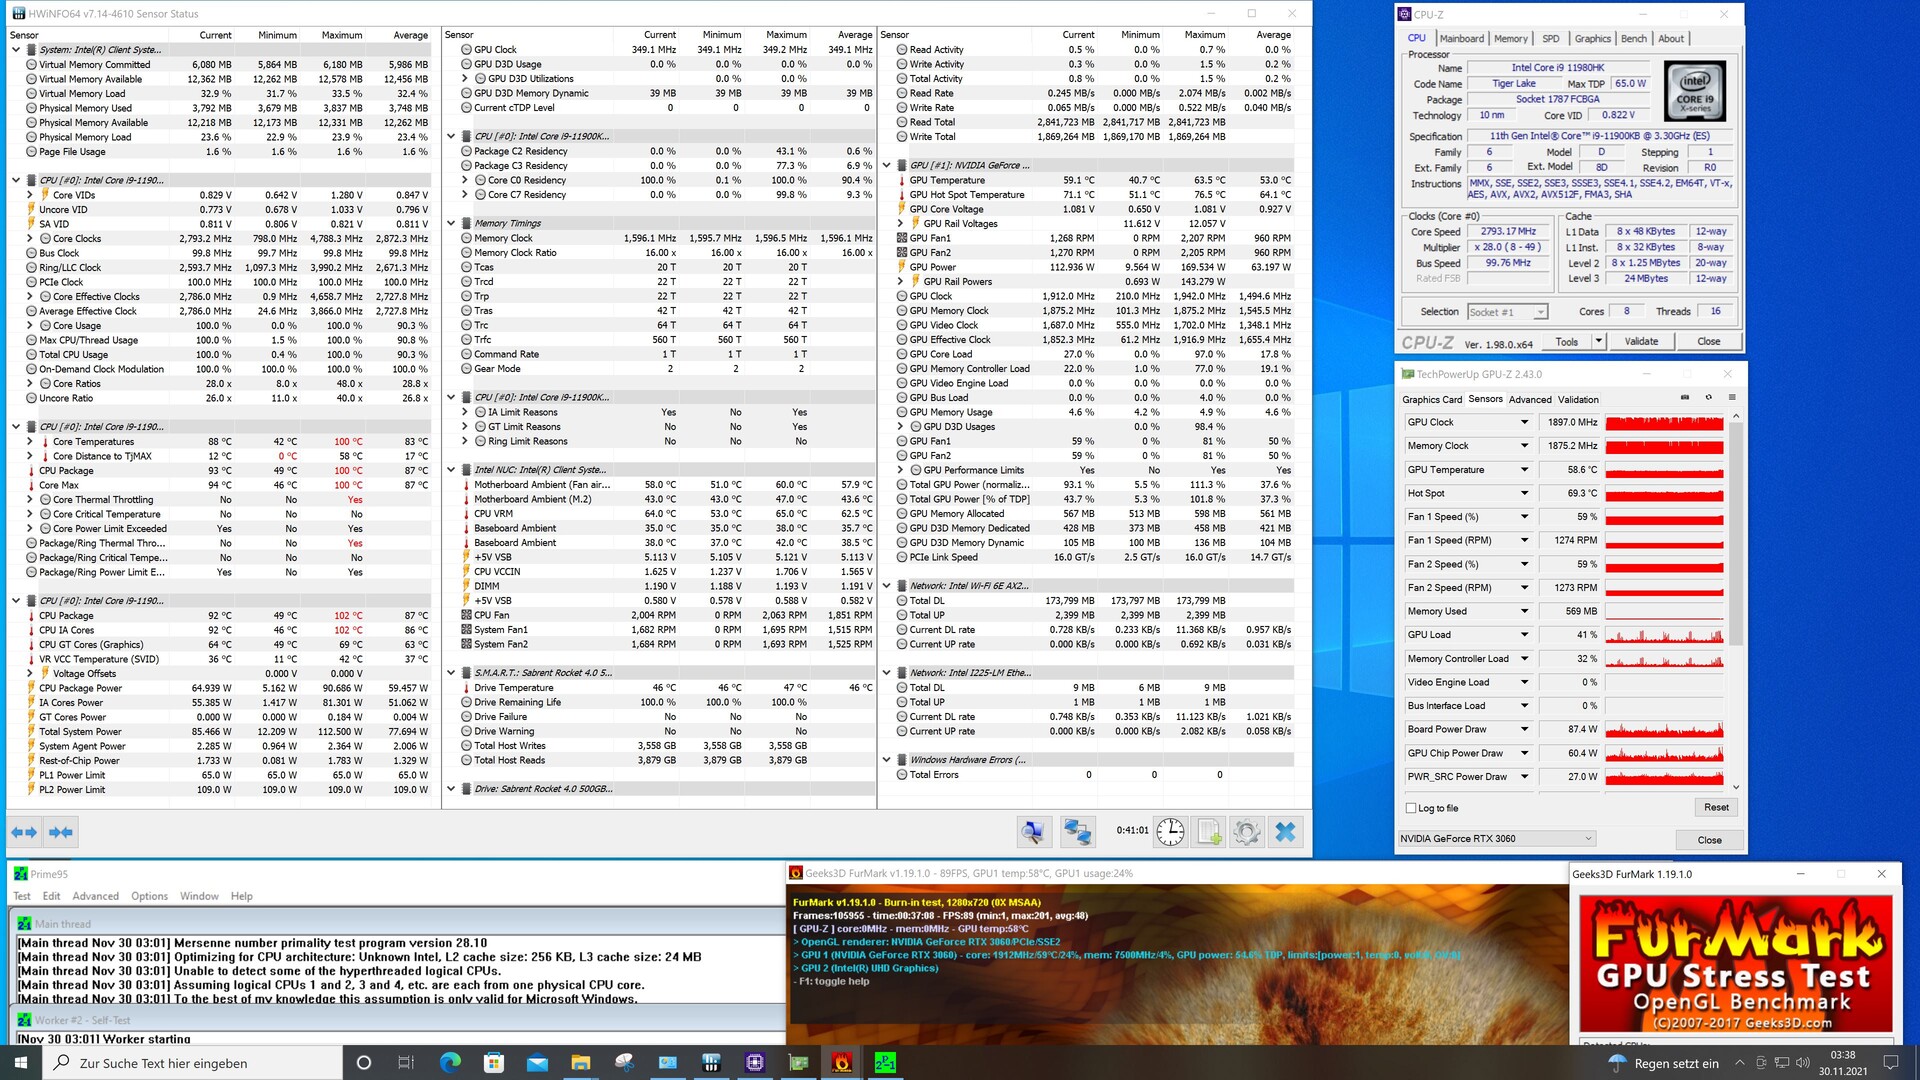
| Prime95 V2810 Stress (external Monitor) | |
| Intel Core i9-10900K (Idle: 52.3 W) | |
| Intel Core i5-10600K (Idle: 52.2 W) | |
| AMD Ryzen 9 3950X (Idle: 95 W) | |
| Intel Beast Canyon NUC (Idle: 34 W) | |
| Intel Ghost Canyon NUC (RTX 2070) (Idle: 33.1 W) | |
| Cinebench R15 Multi (external Monitor) | |
| Intel Core i9-10900K (Idle: 52.3 W) | |
| AMD Ryzen 9 3950X (Idle: 95 W) | |
| Intel Core i5-10600K (Idle: 52.2 W) | |
| Intel Beast Canyon NUC (Idle: 32 W) | |
| Temperatures - CPU Temperature Prime95 | |
| Intel Core i9-10900K | |
| AMD Ryzen 9 3950X | |
| Intel Core i5-10600K | |
* ... a kisebb jobb
Pro
Kontra
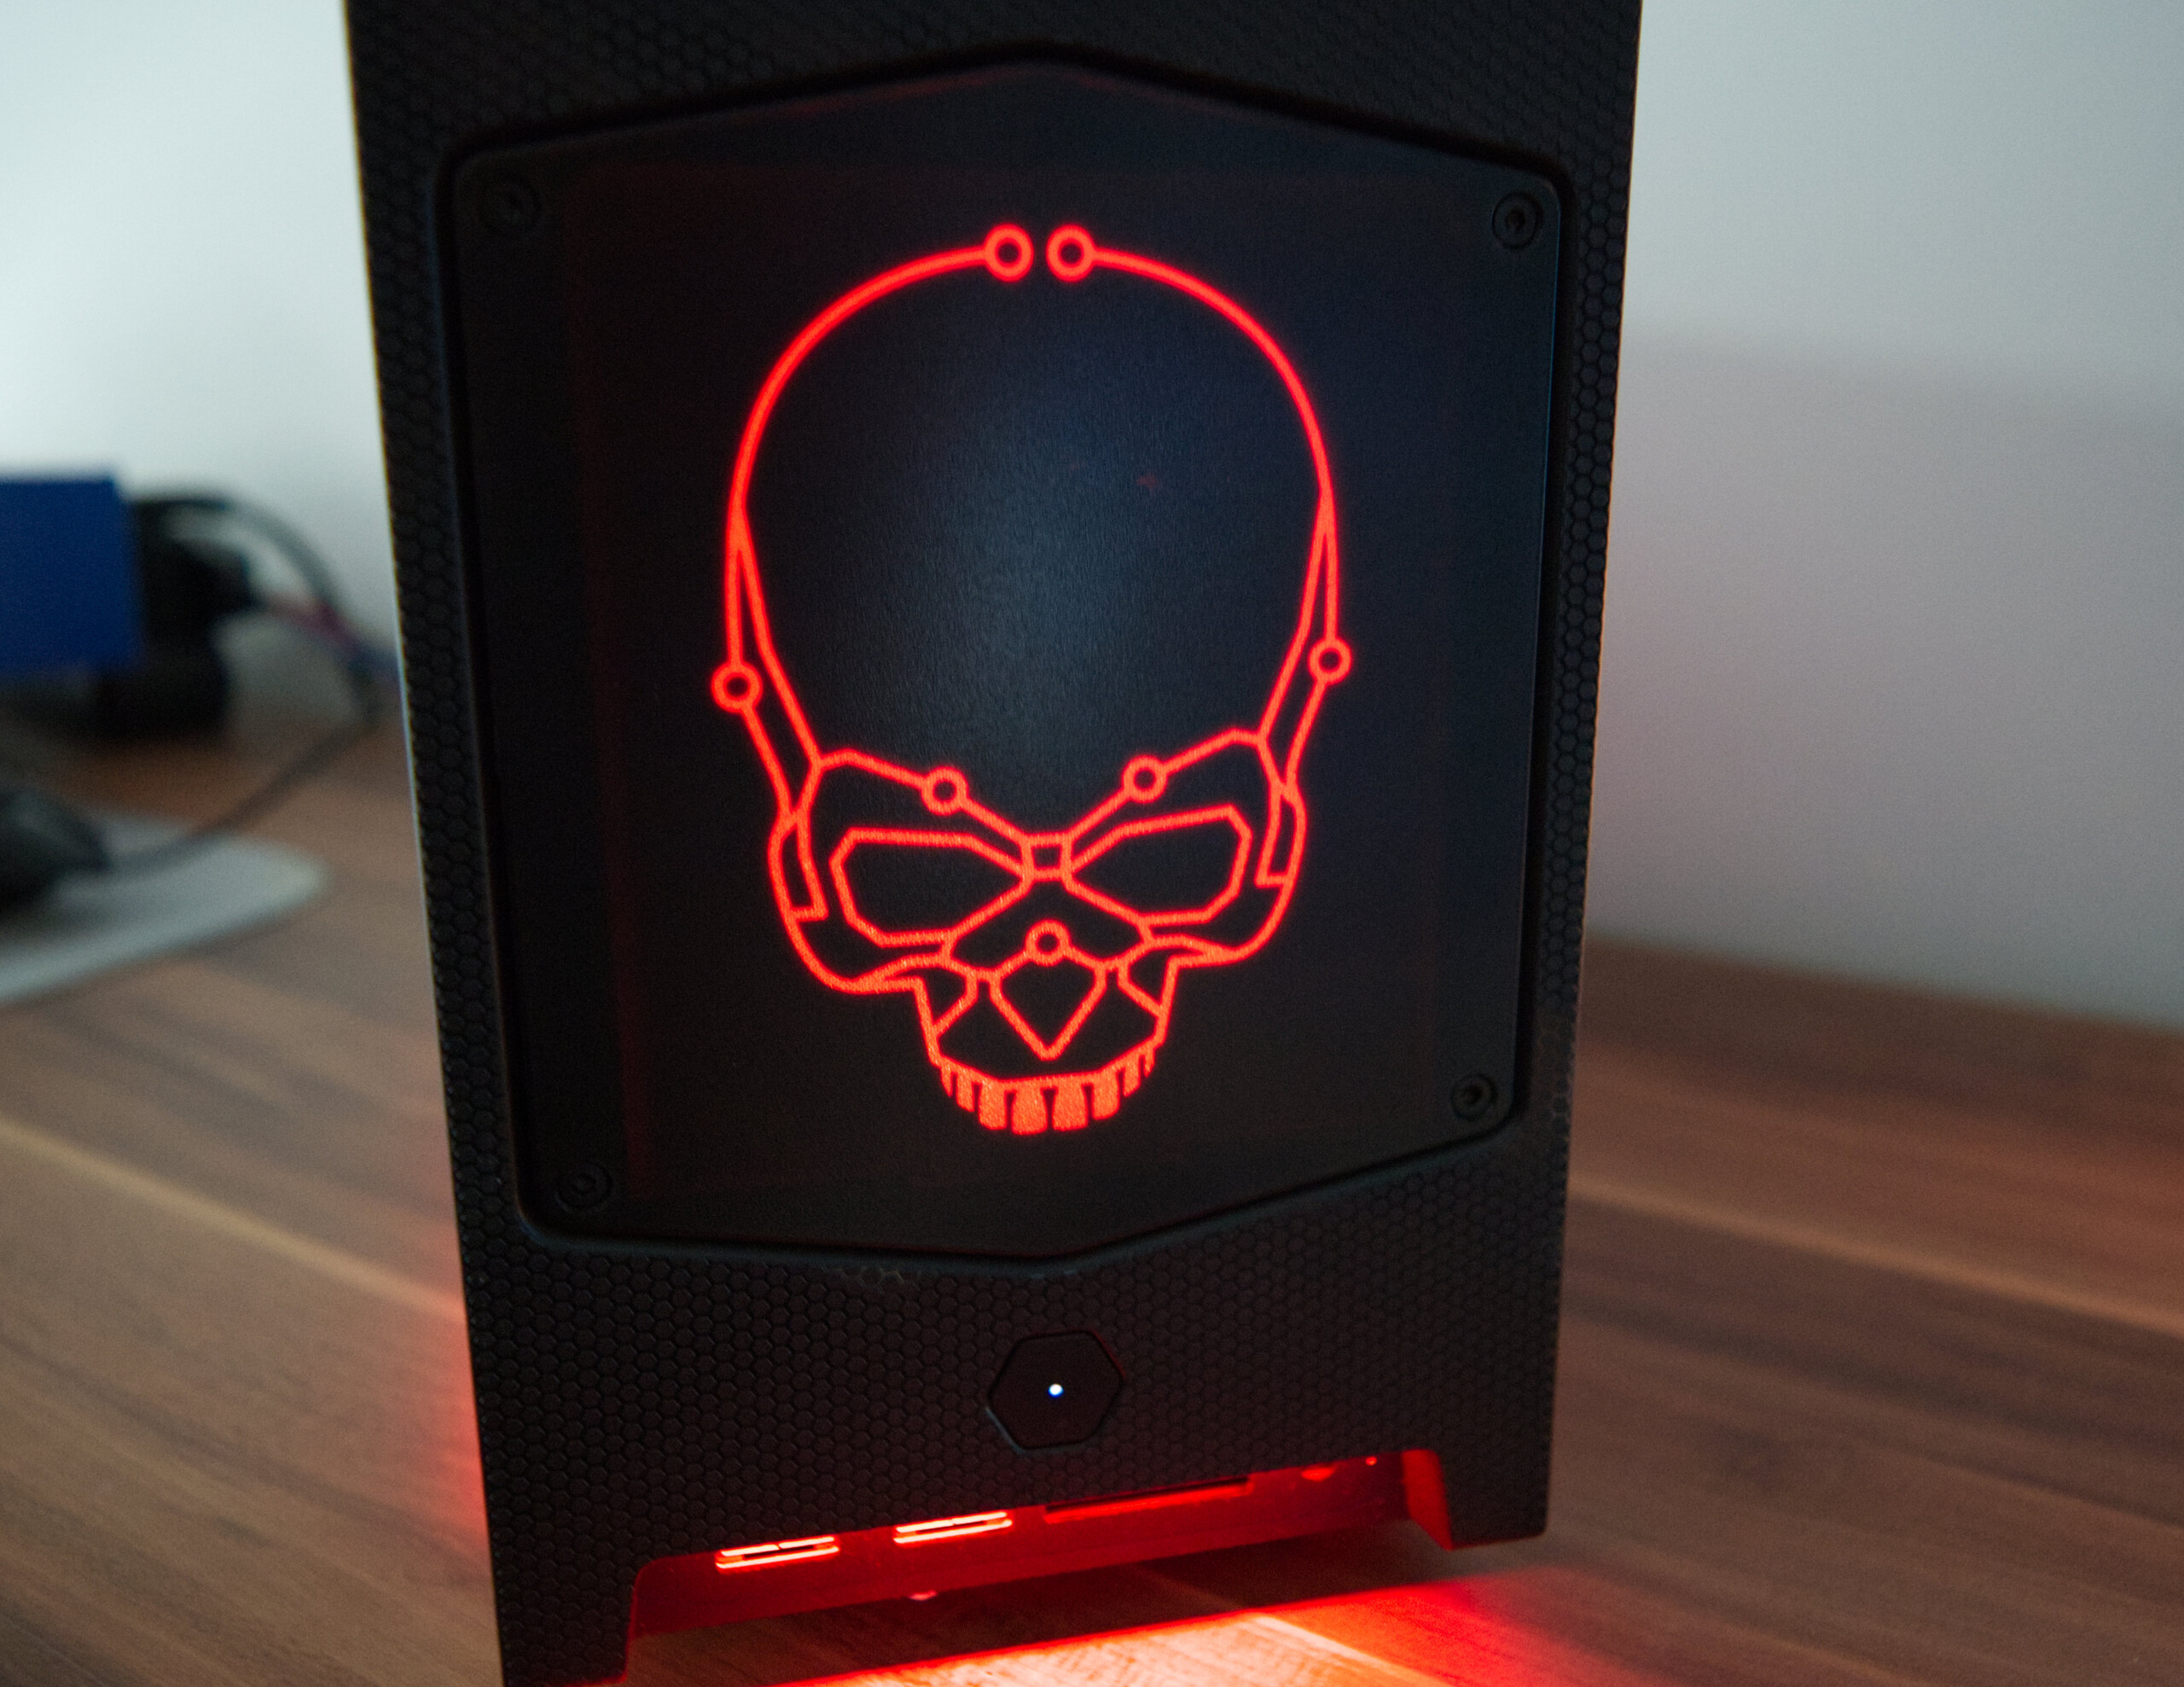
Összegzés - Kompakt, modern és gyors
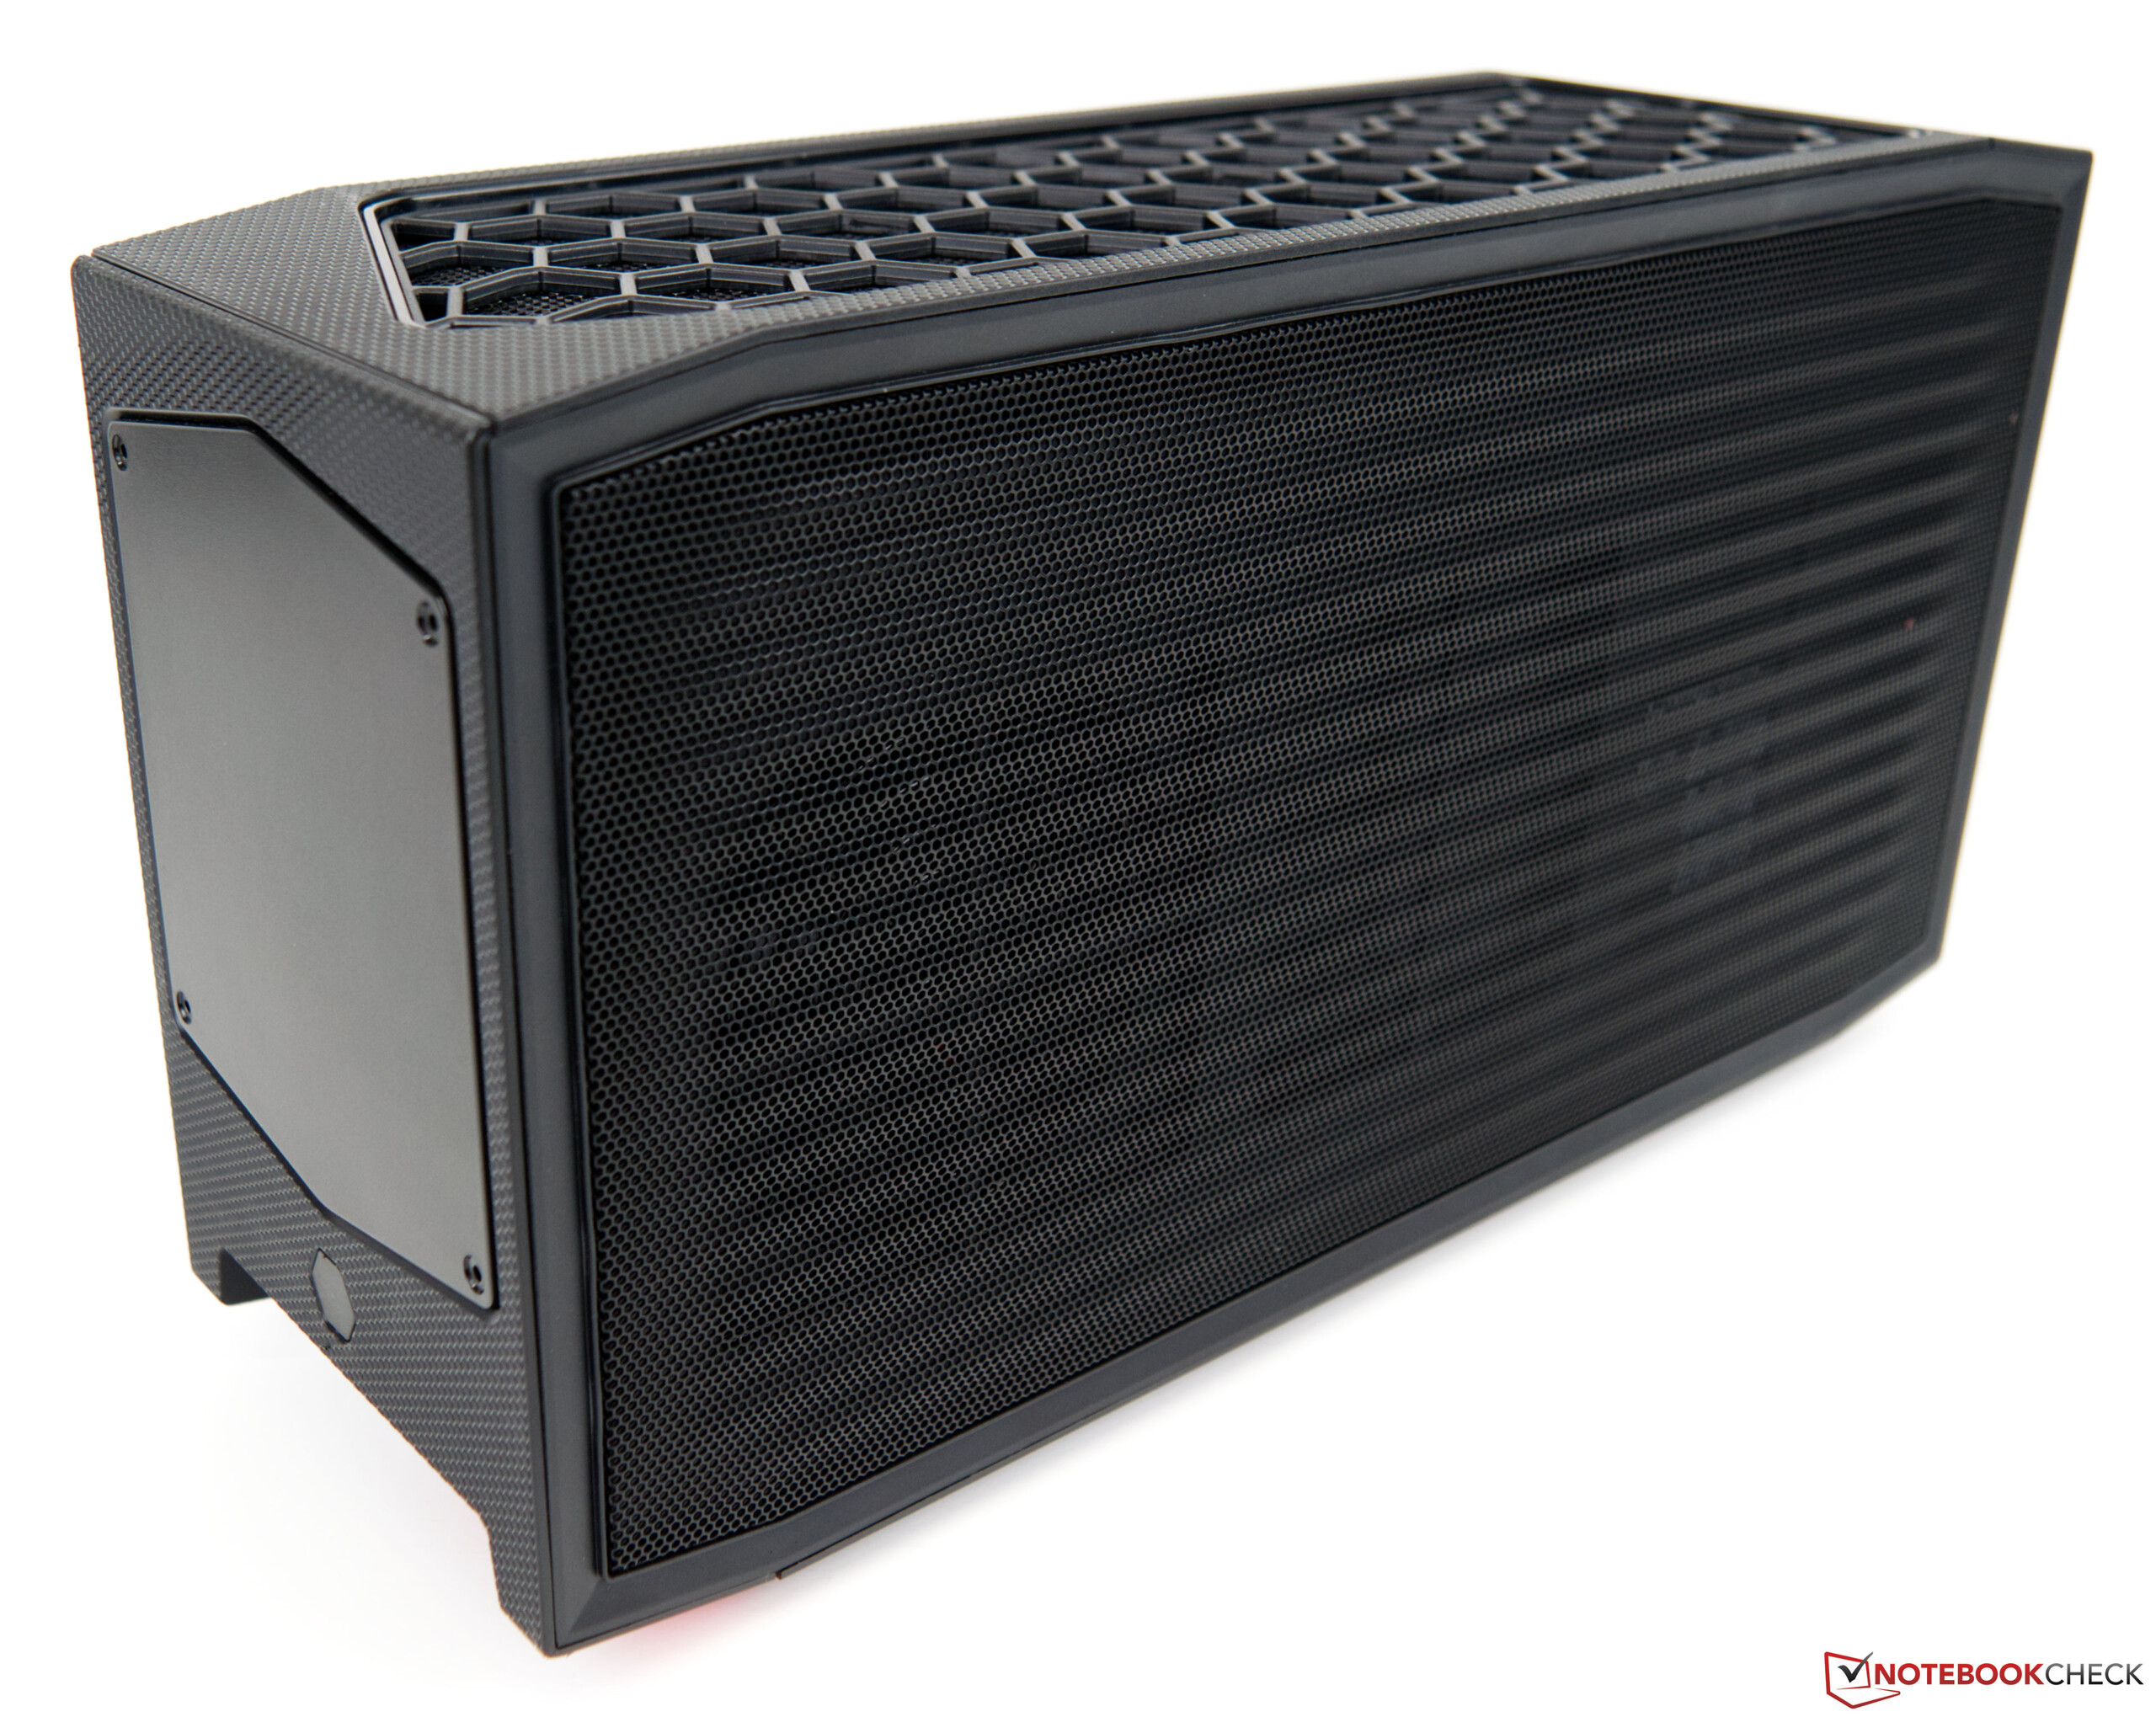
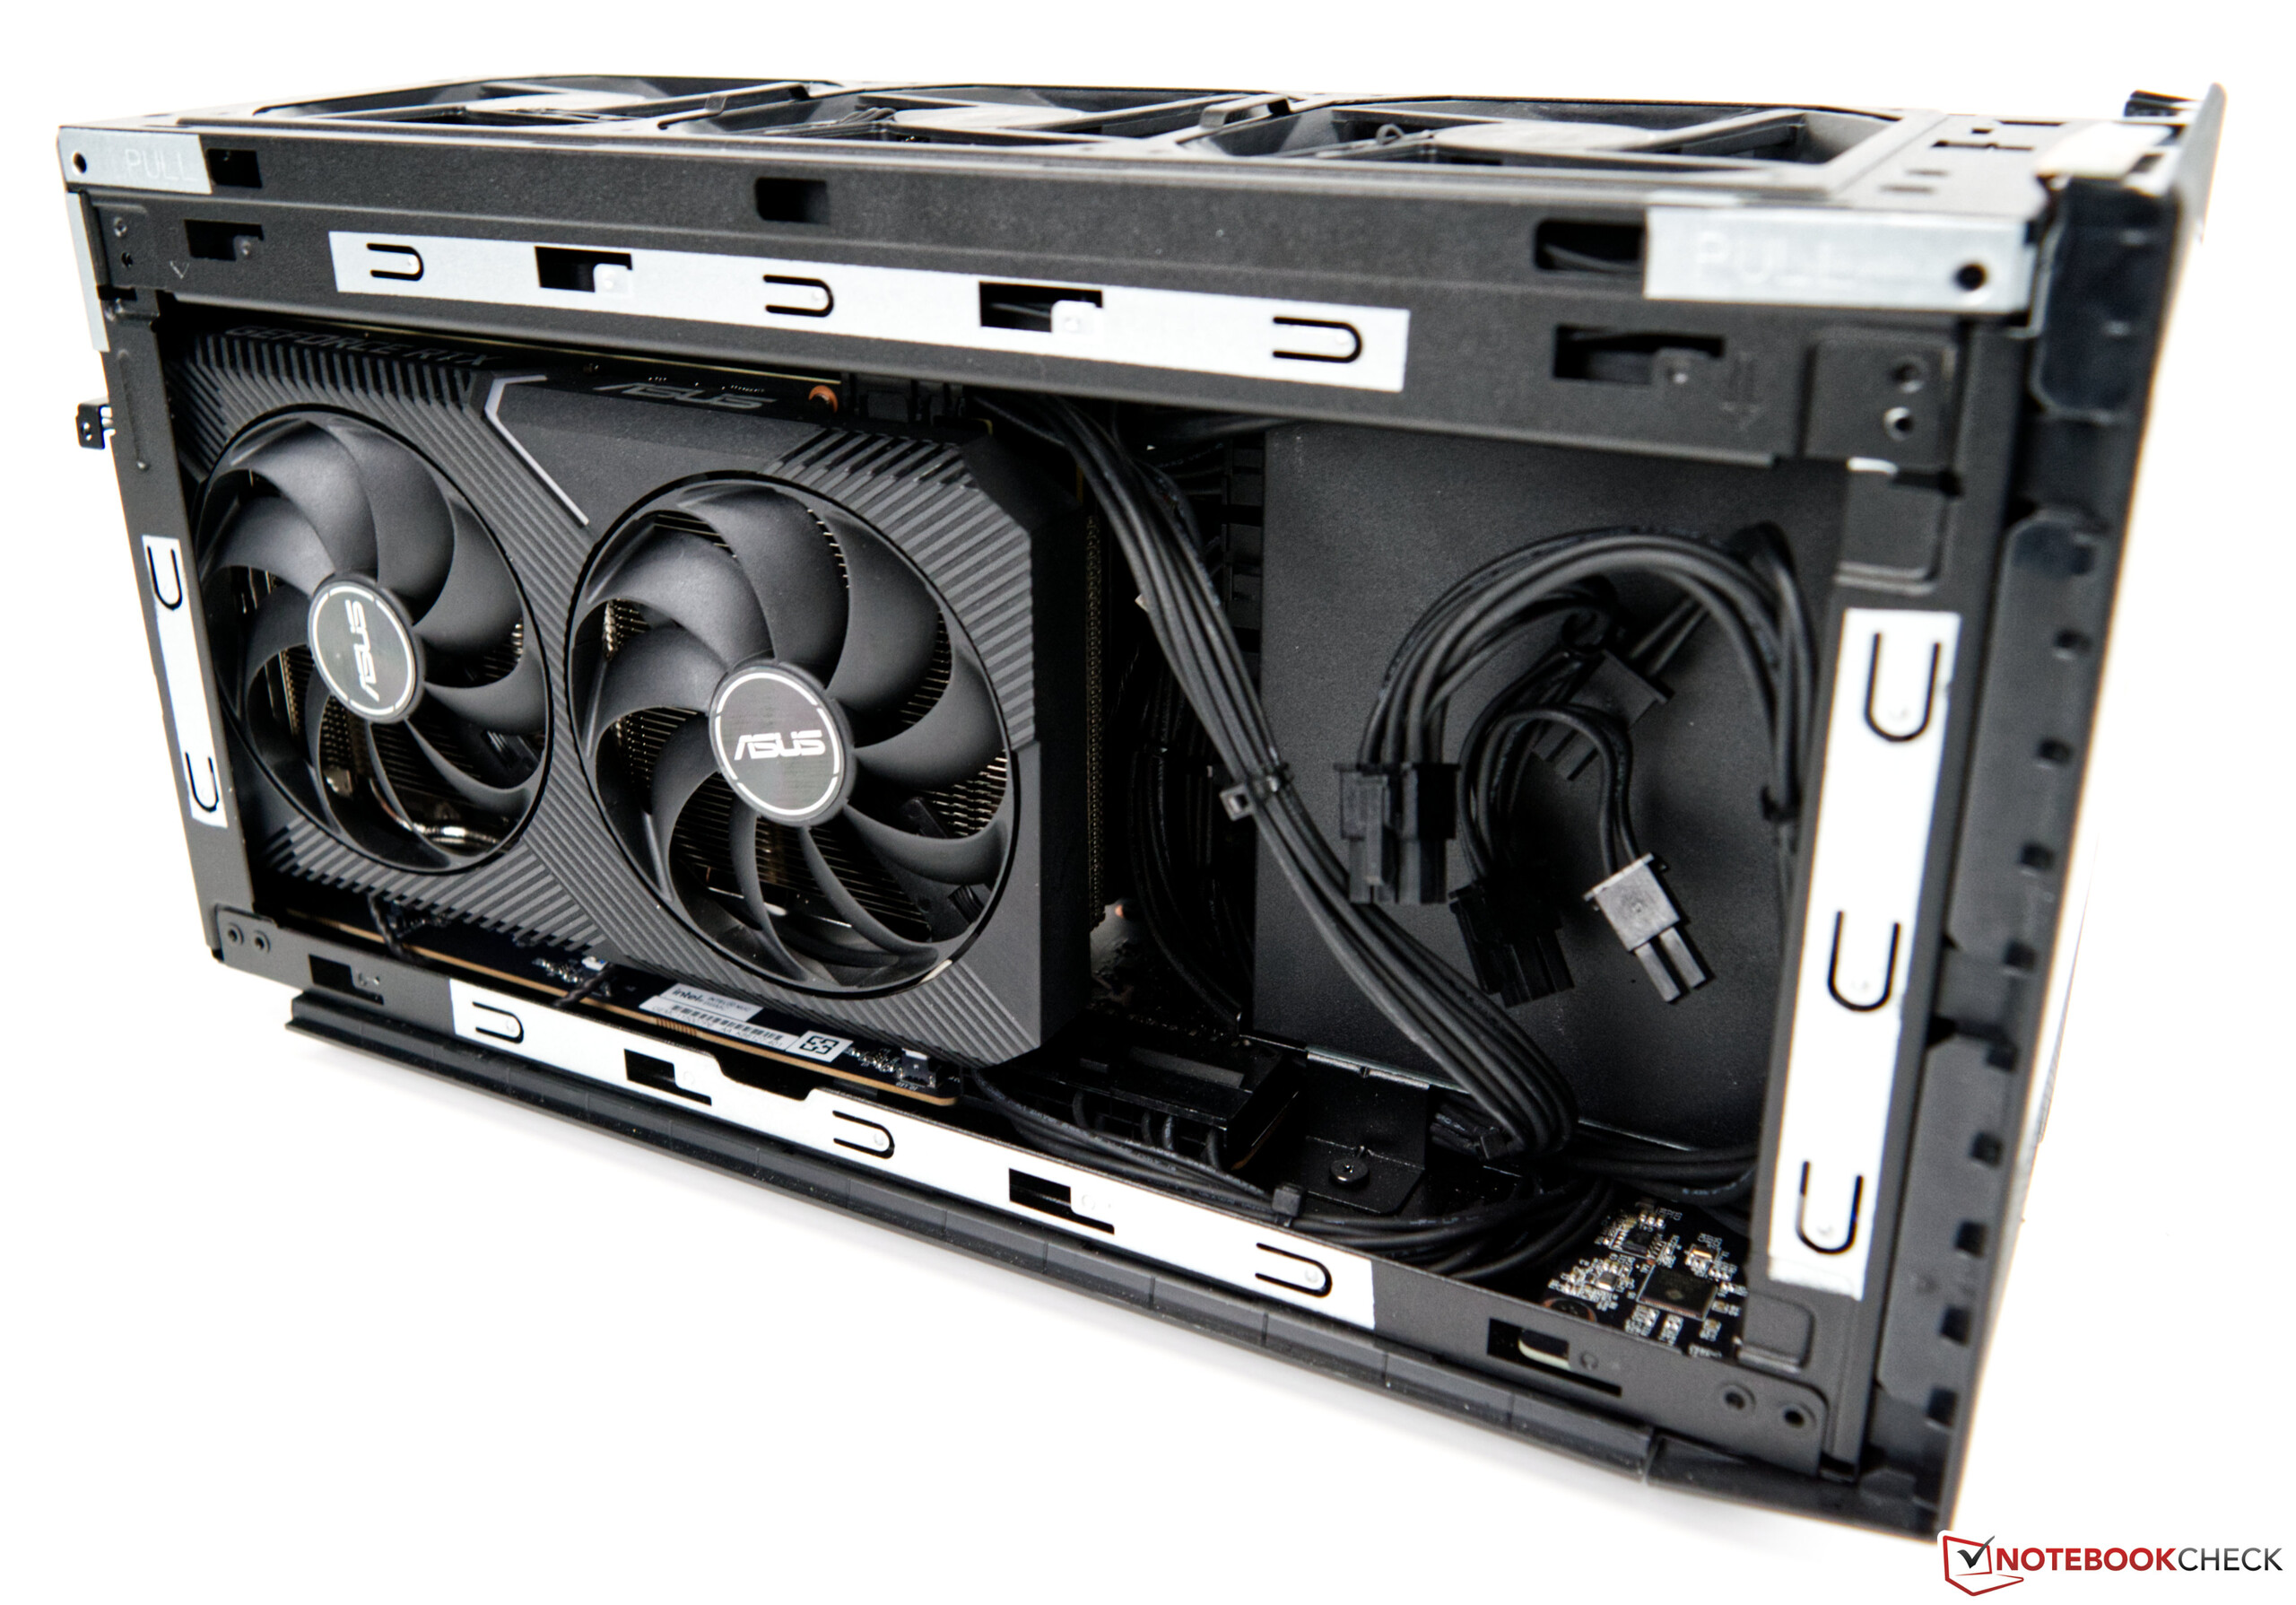
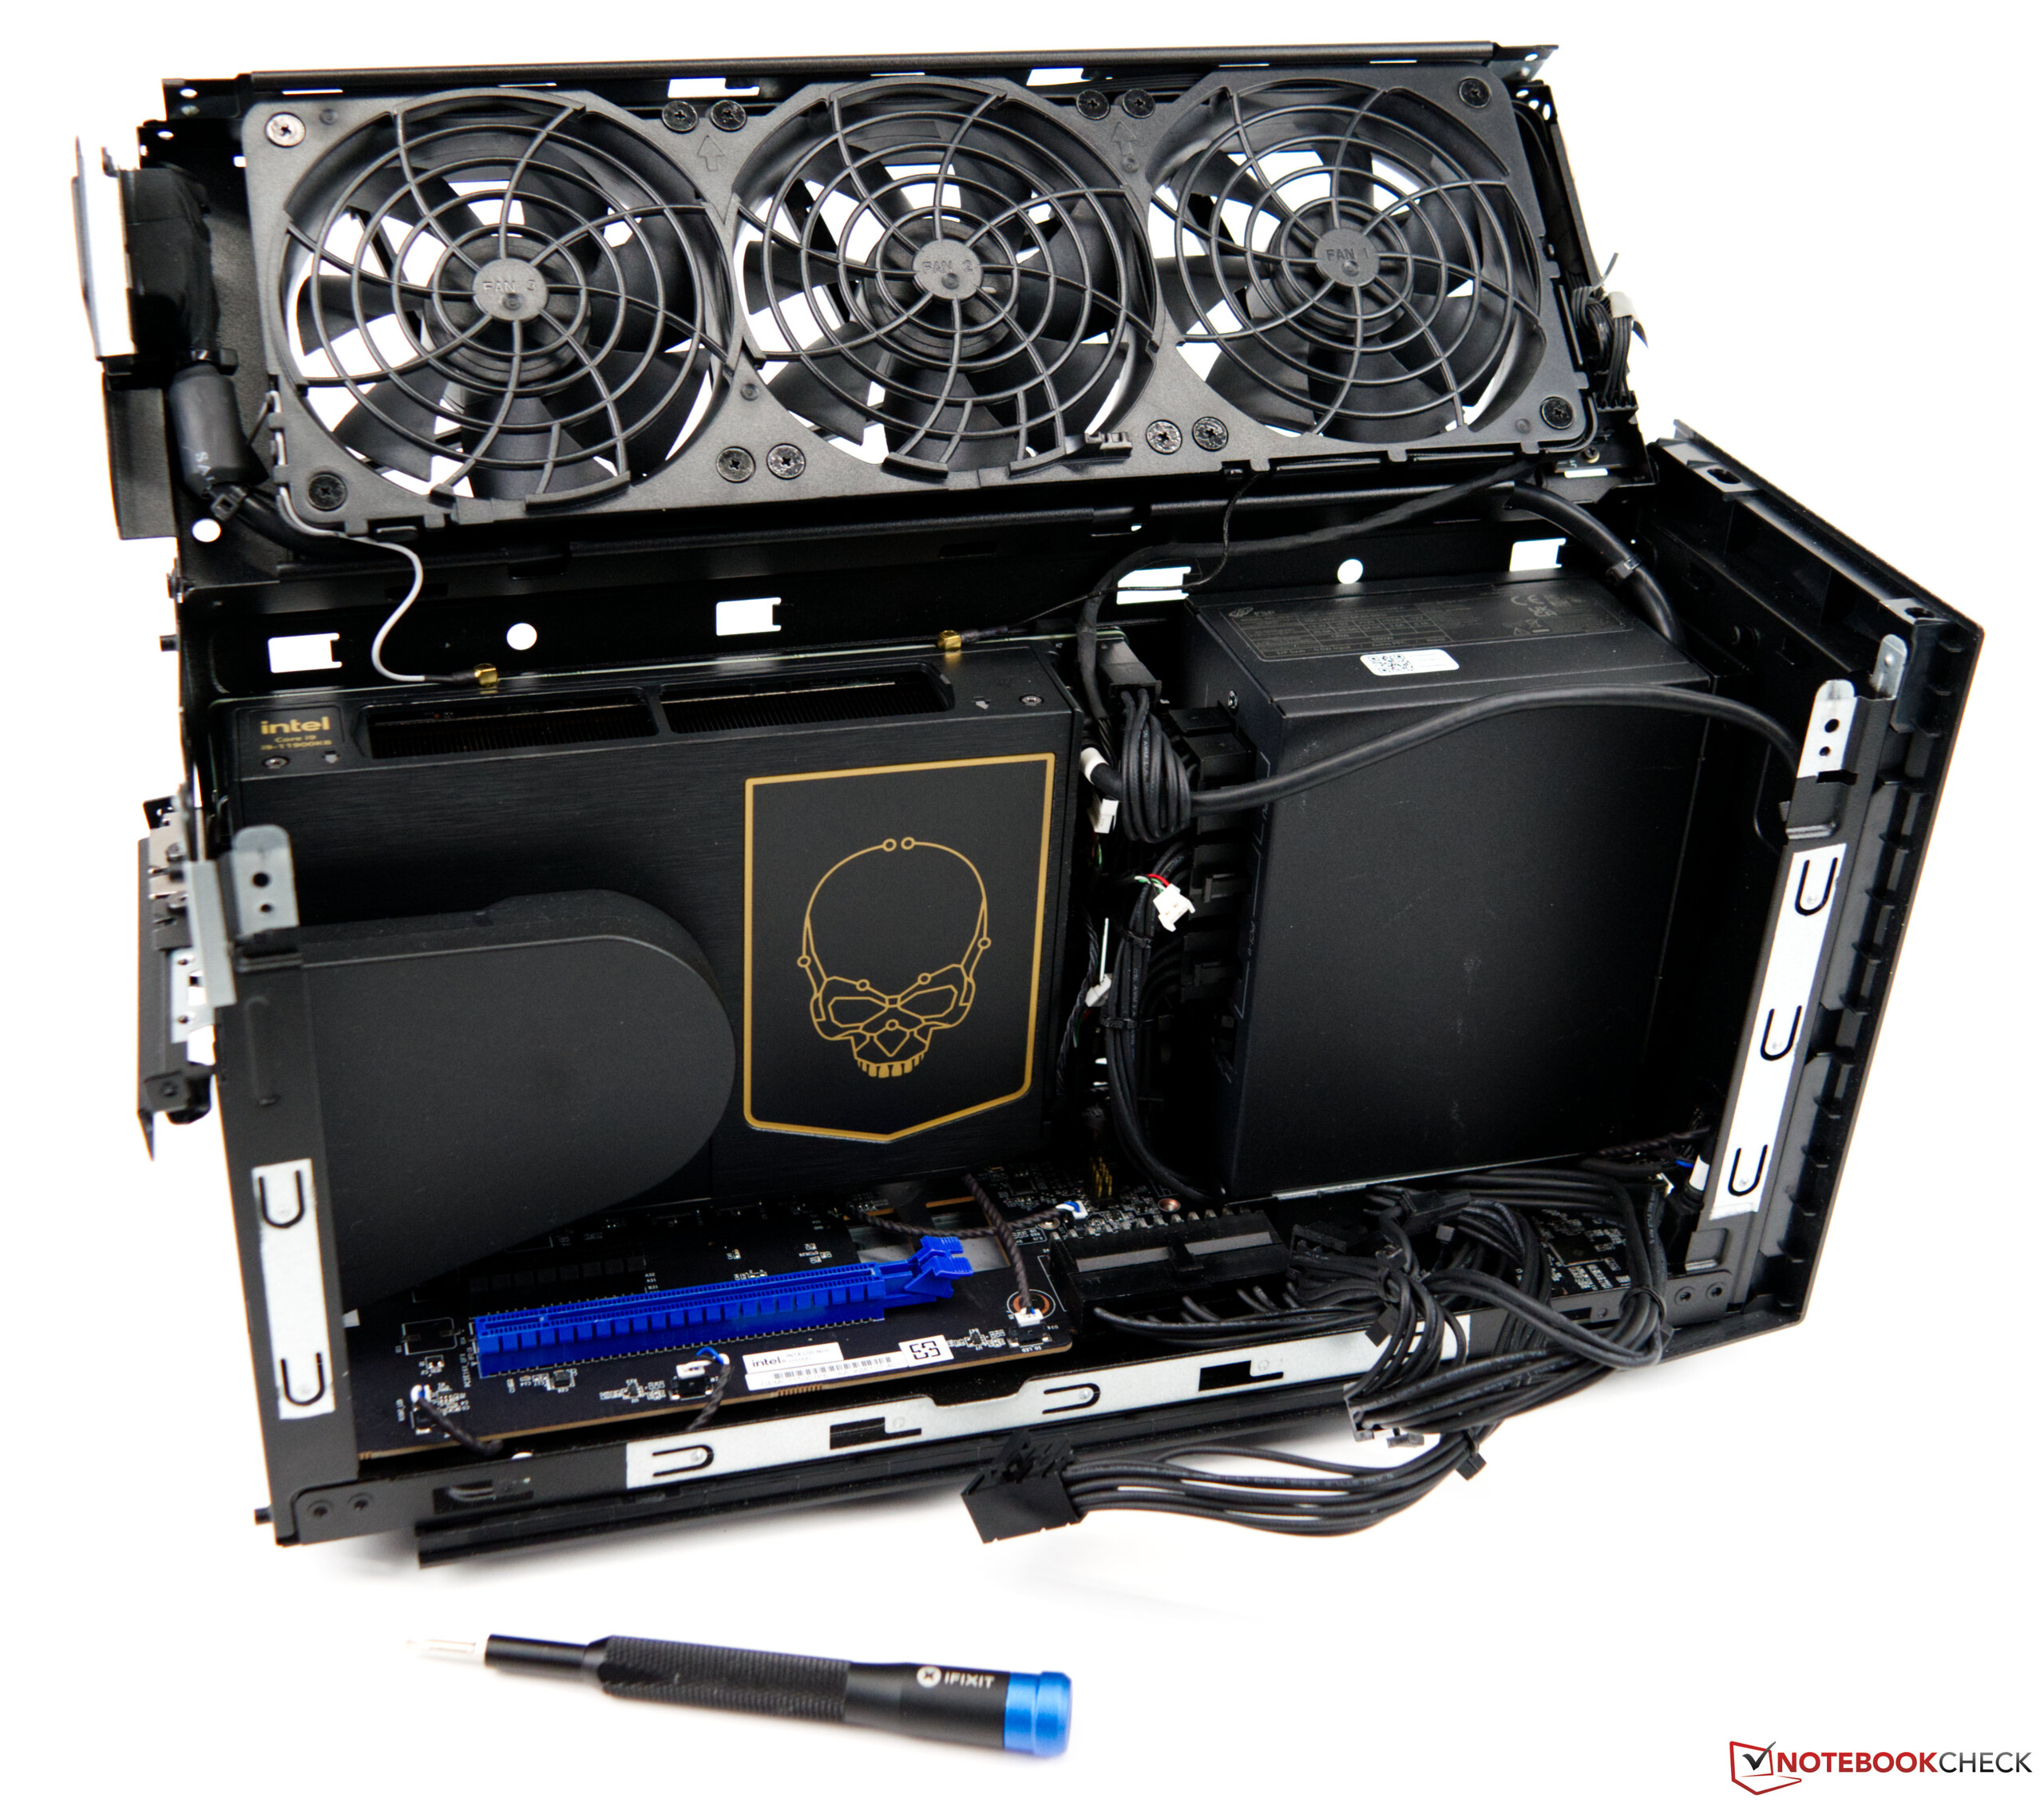
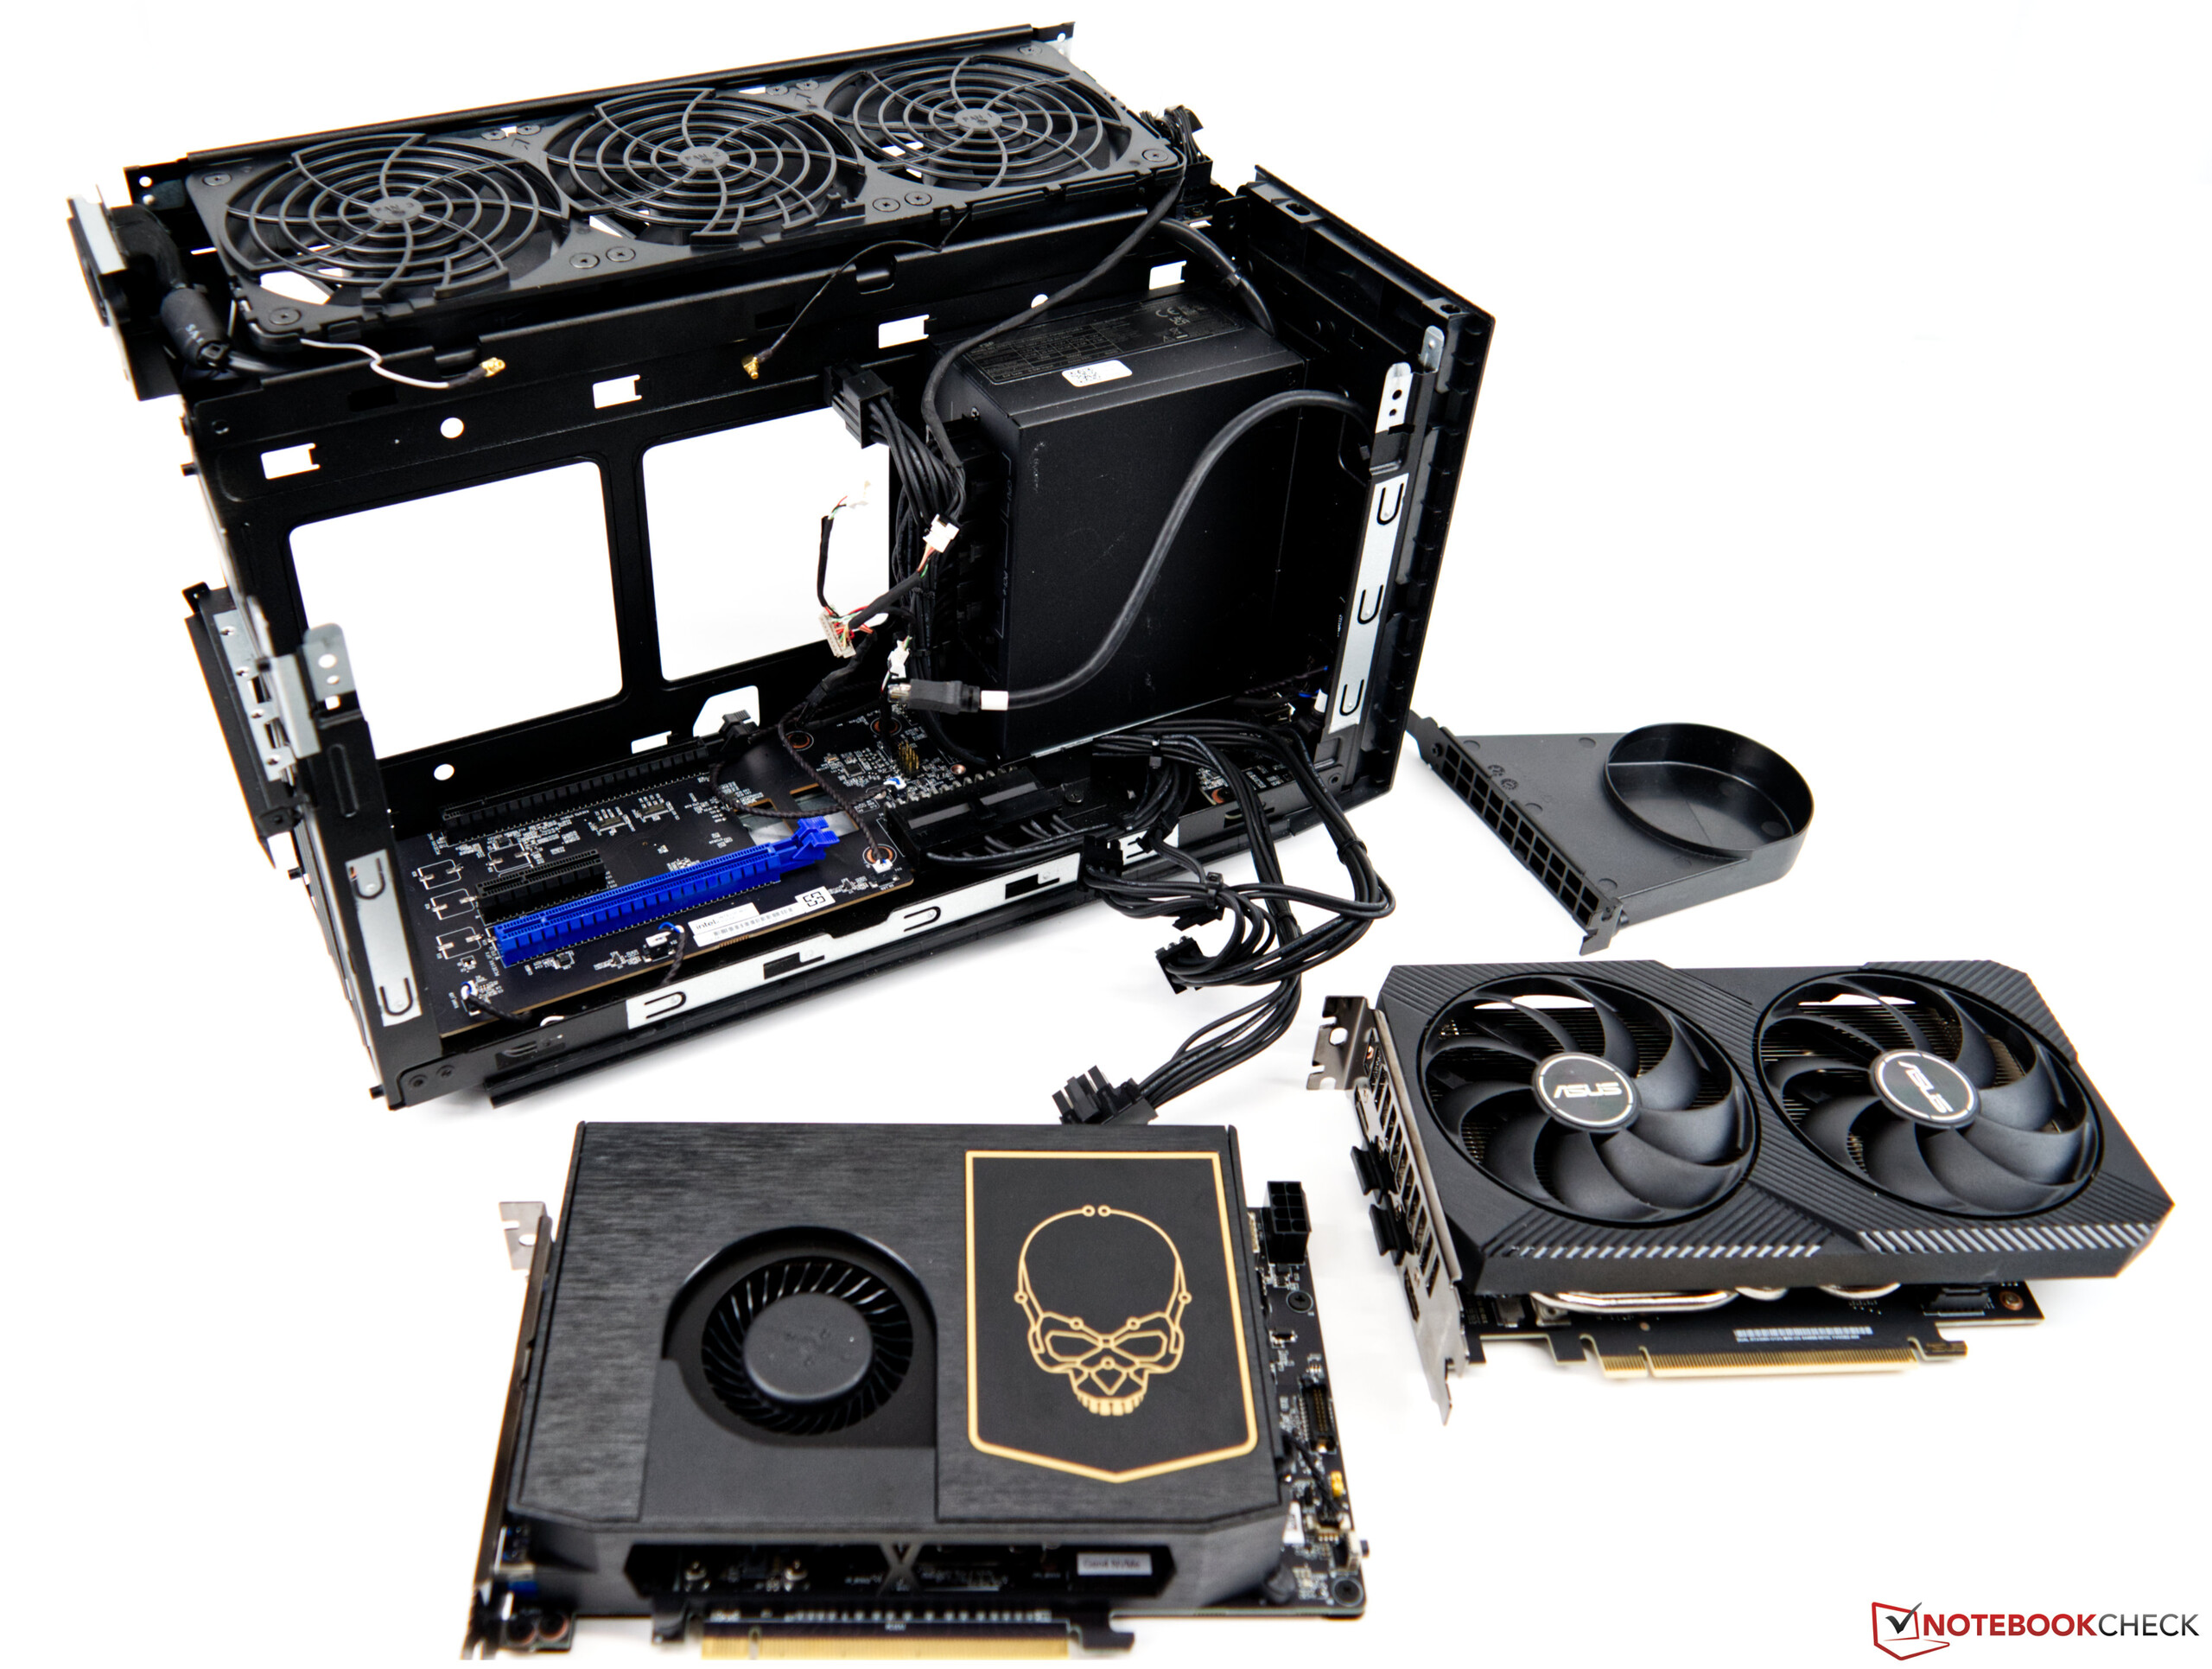
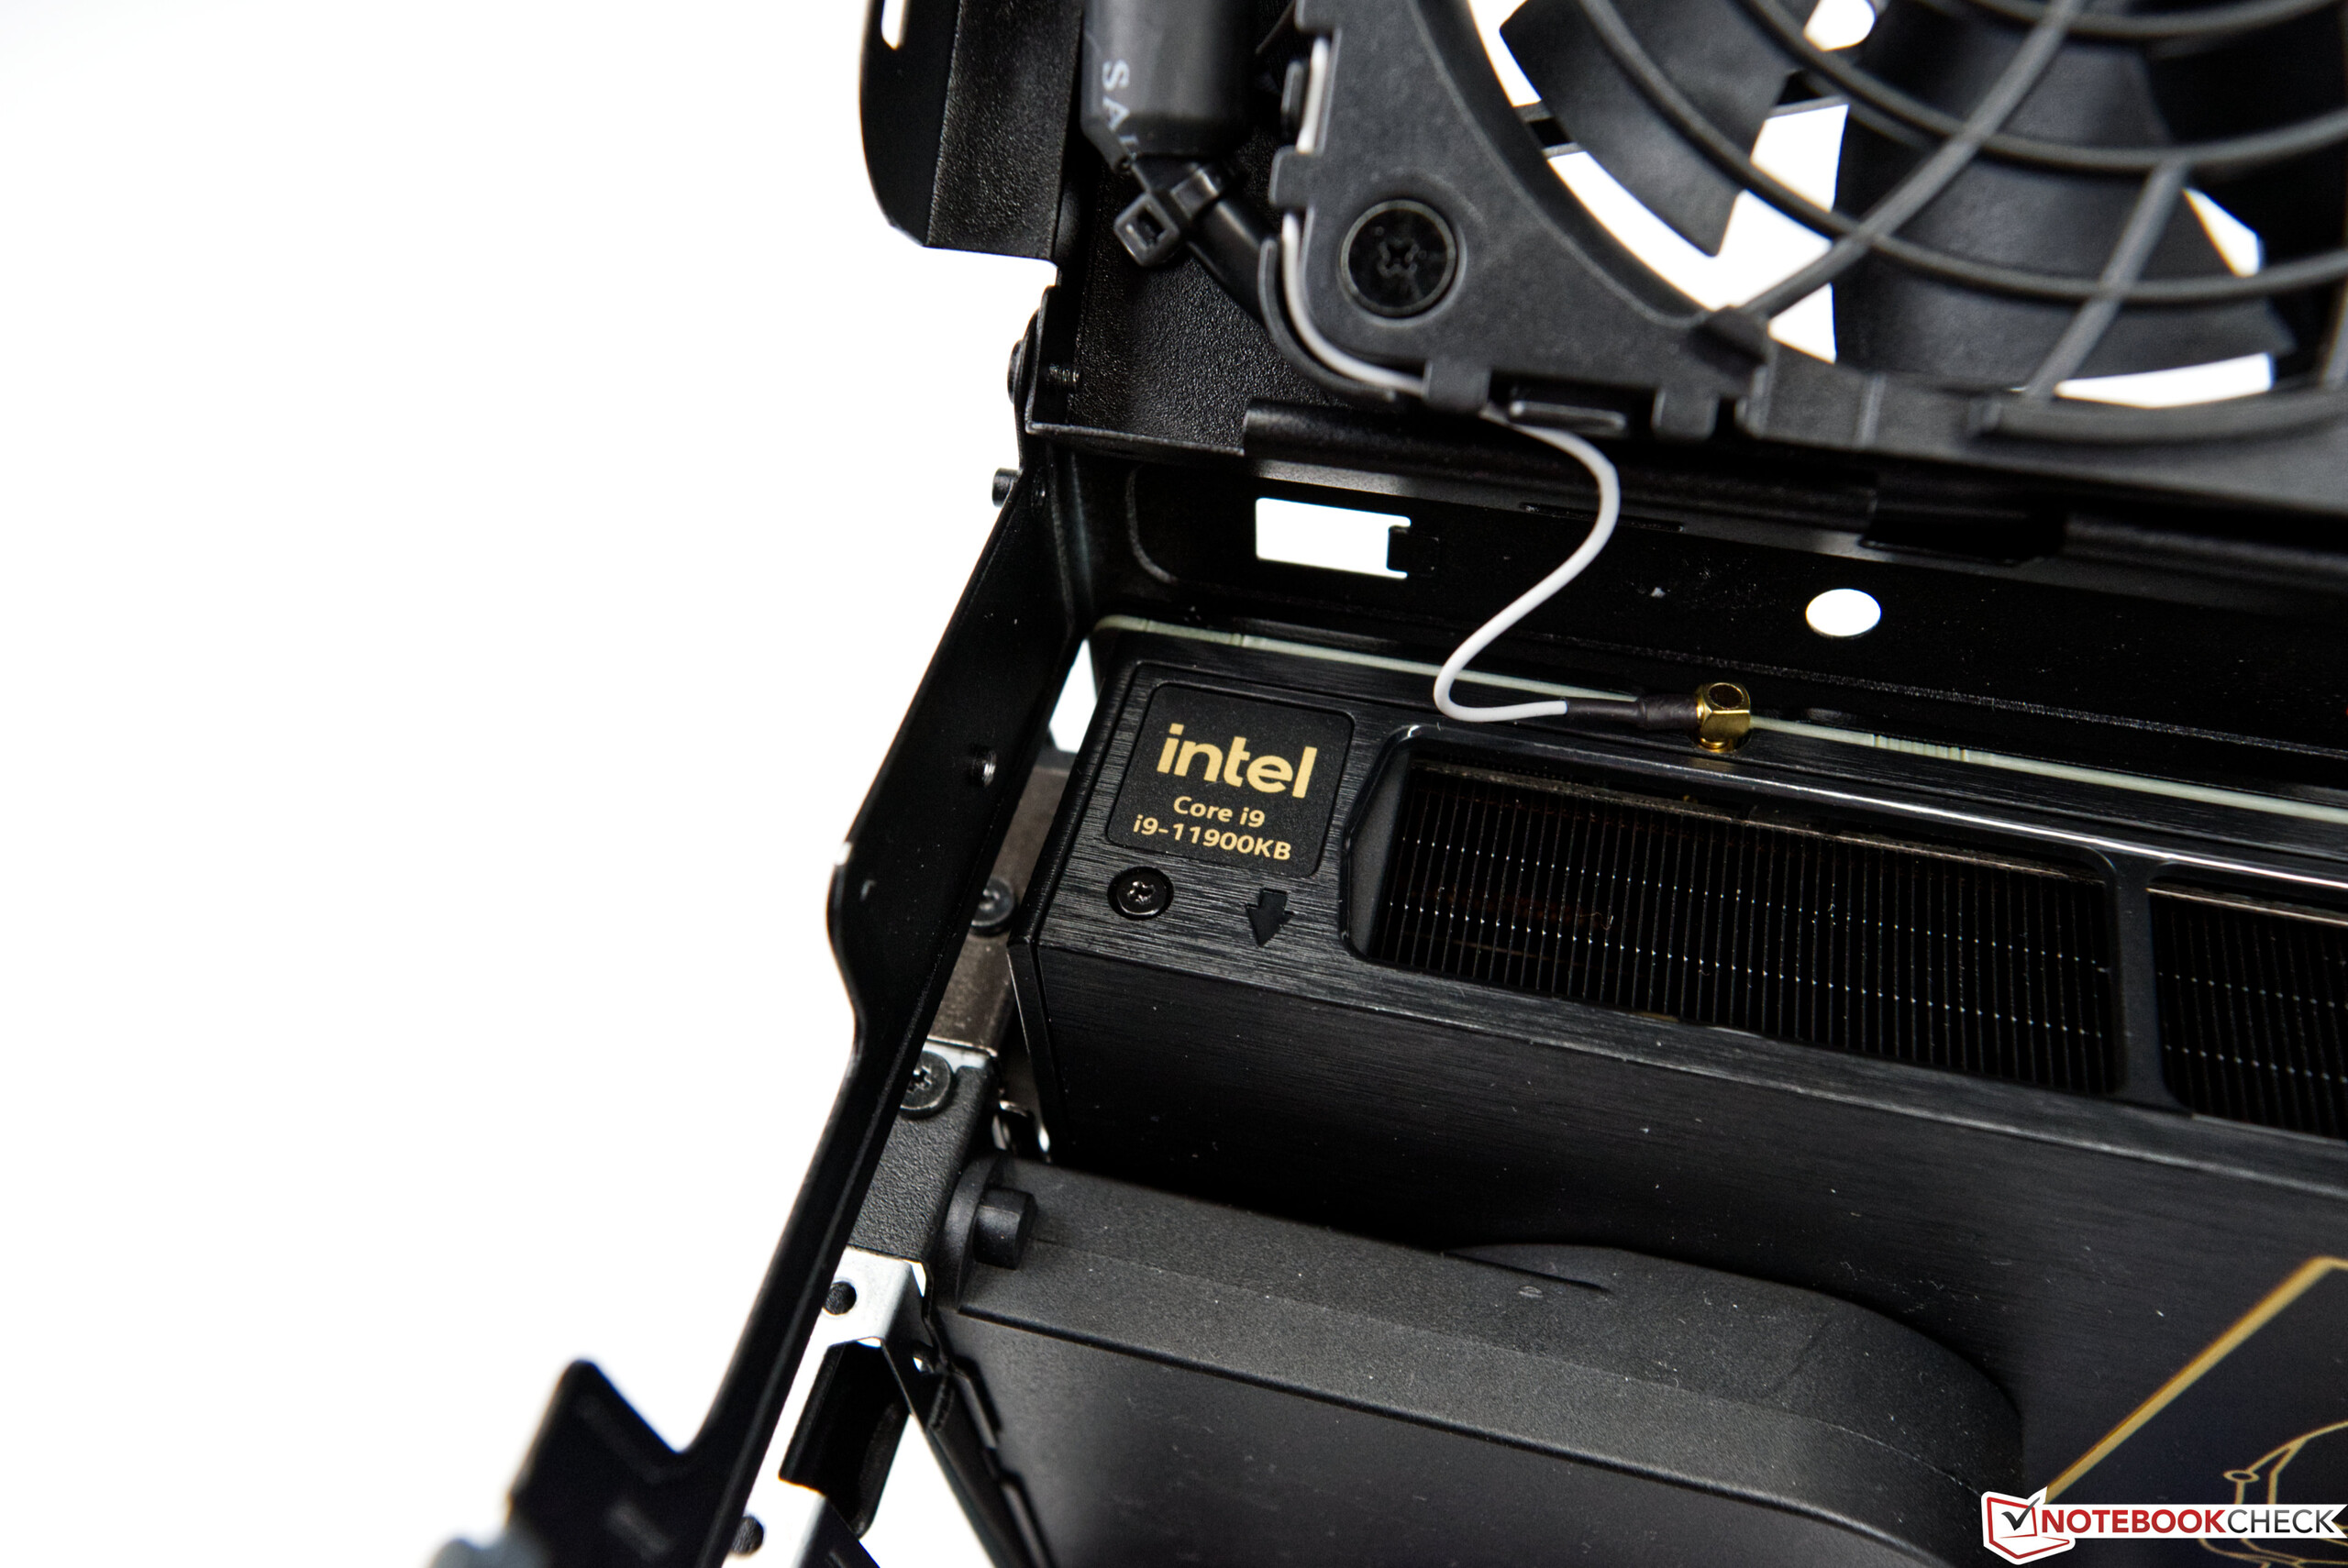
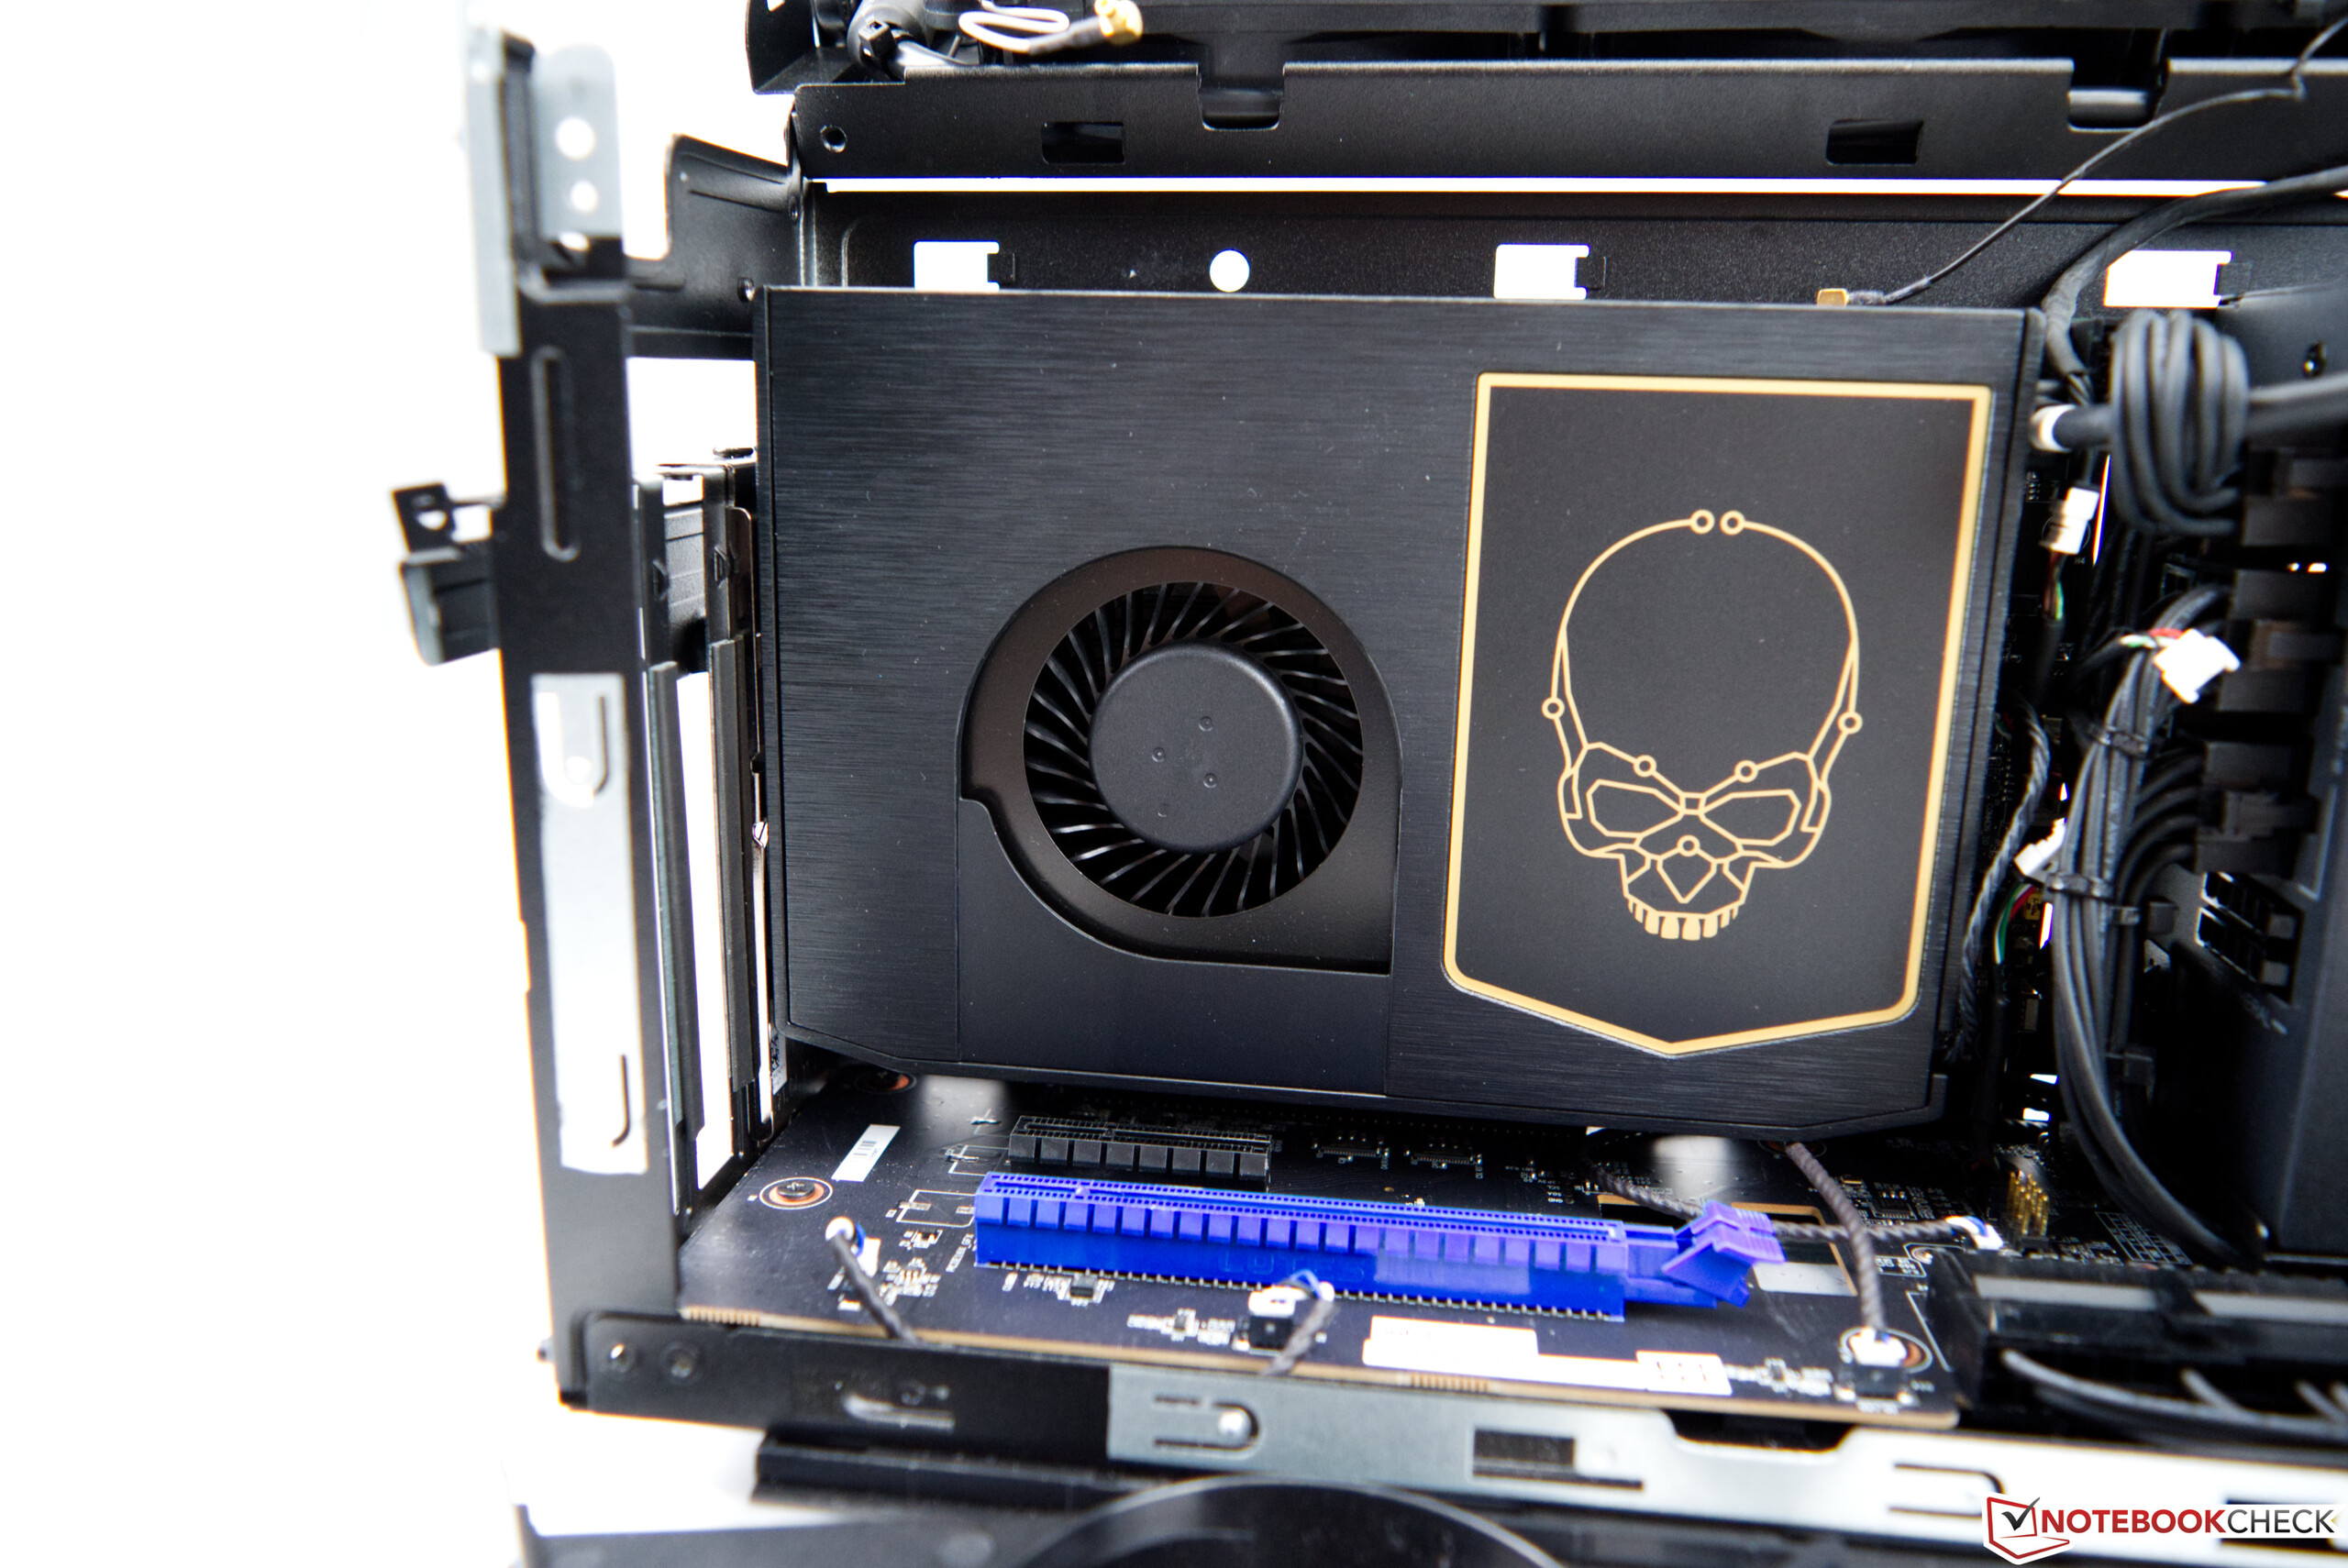
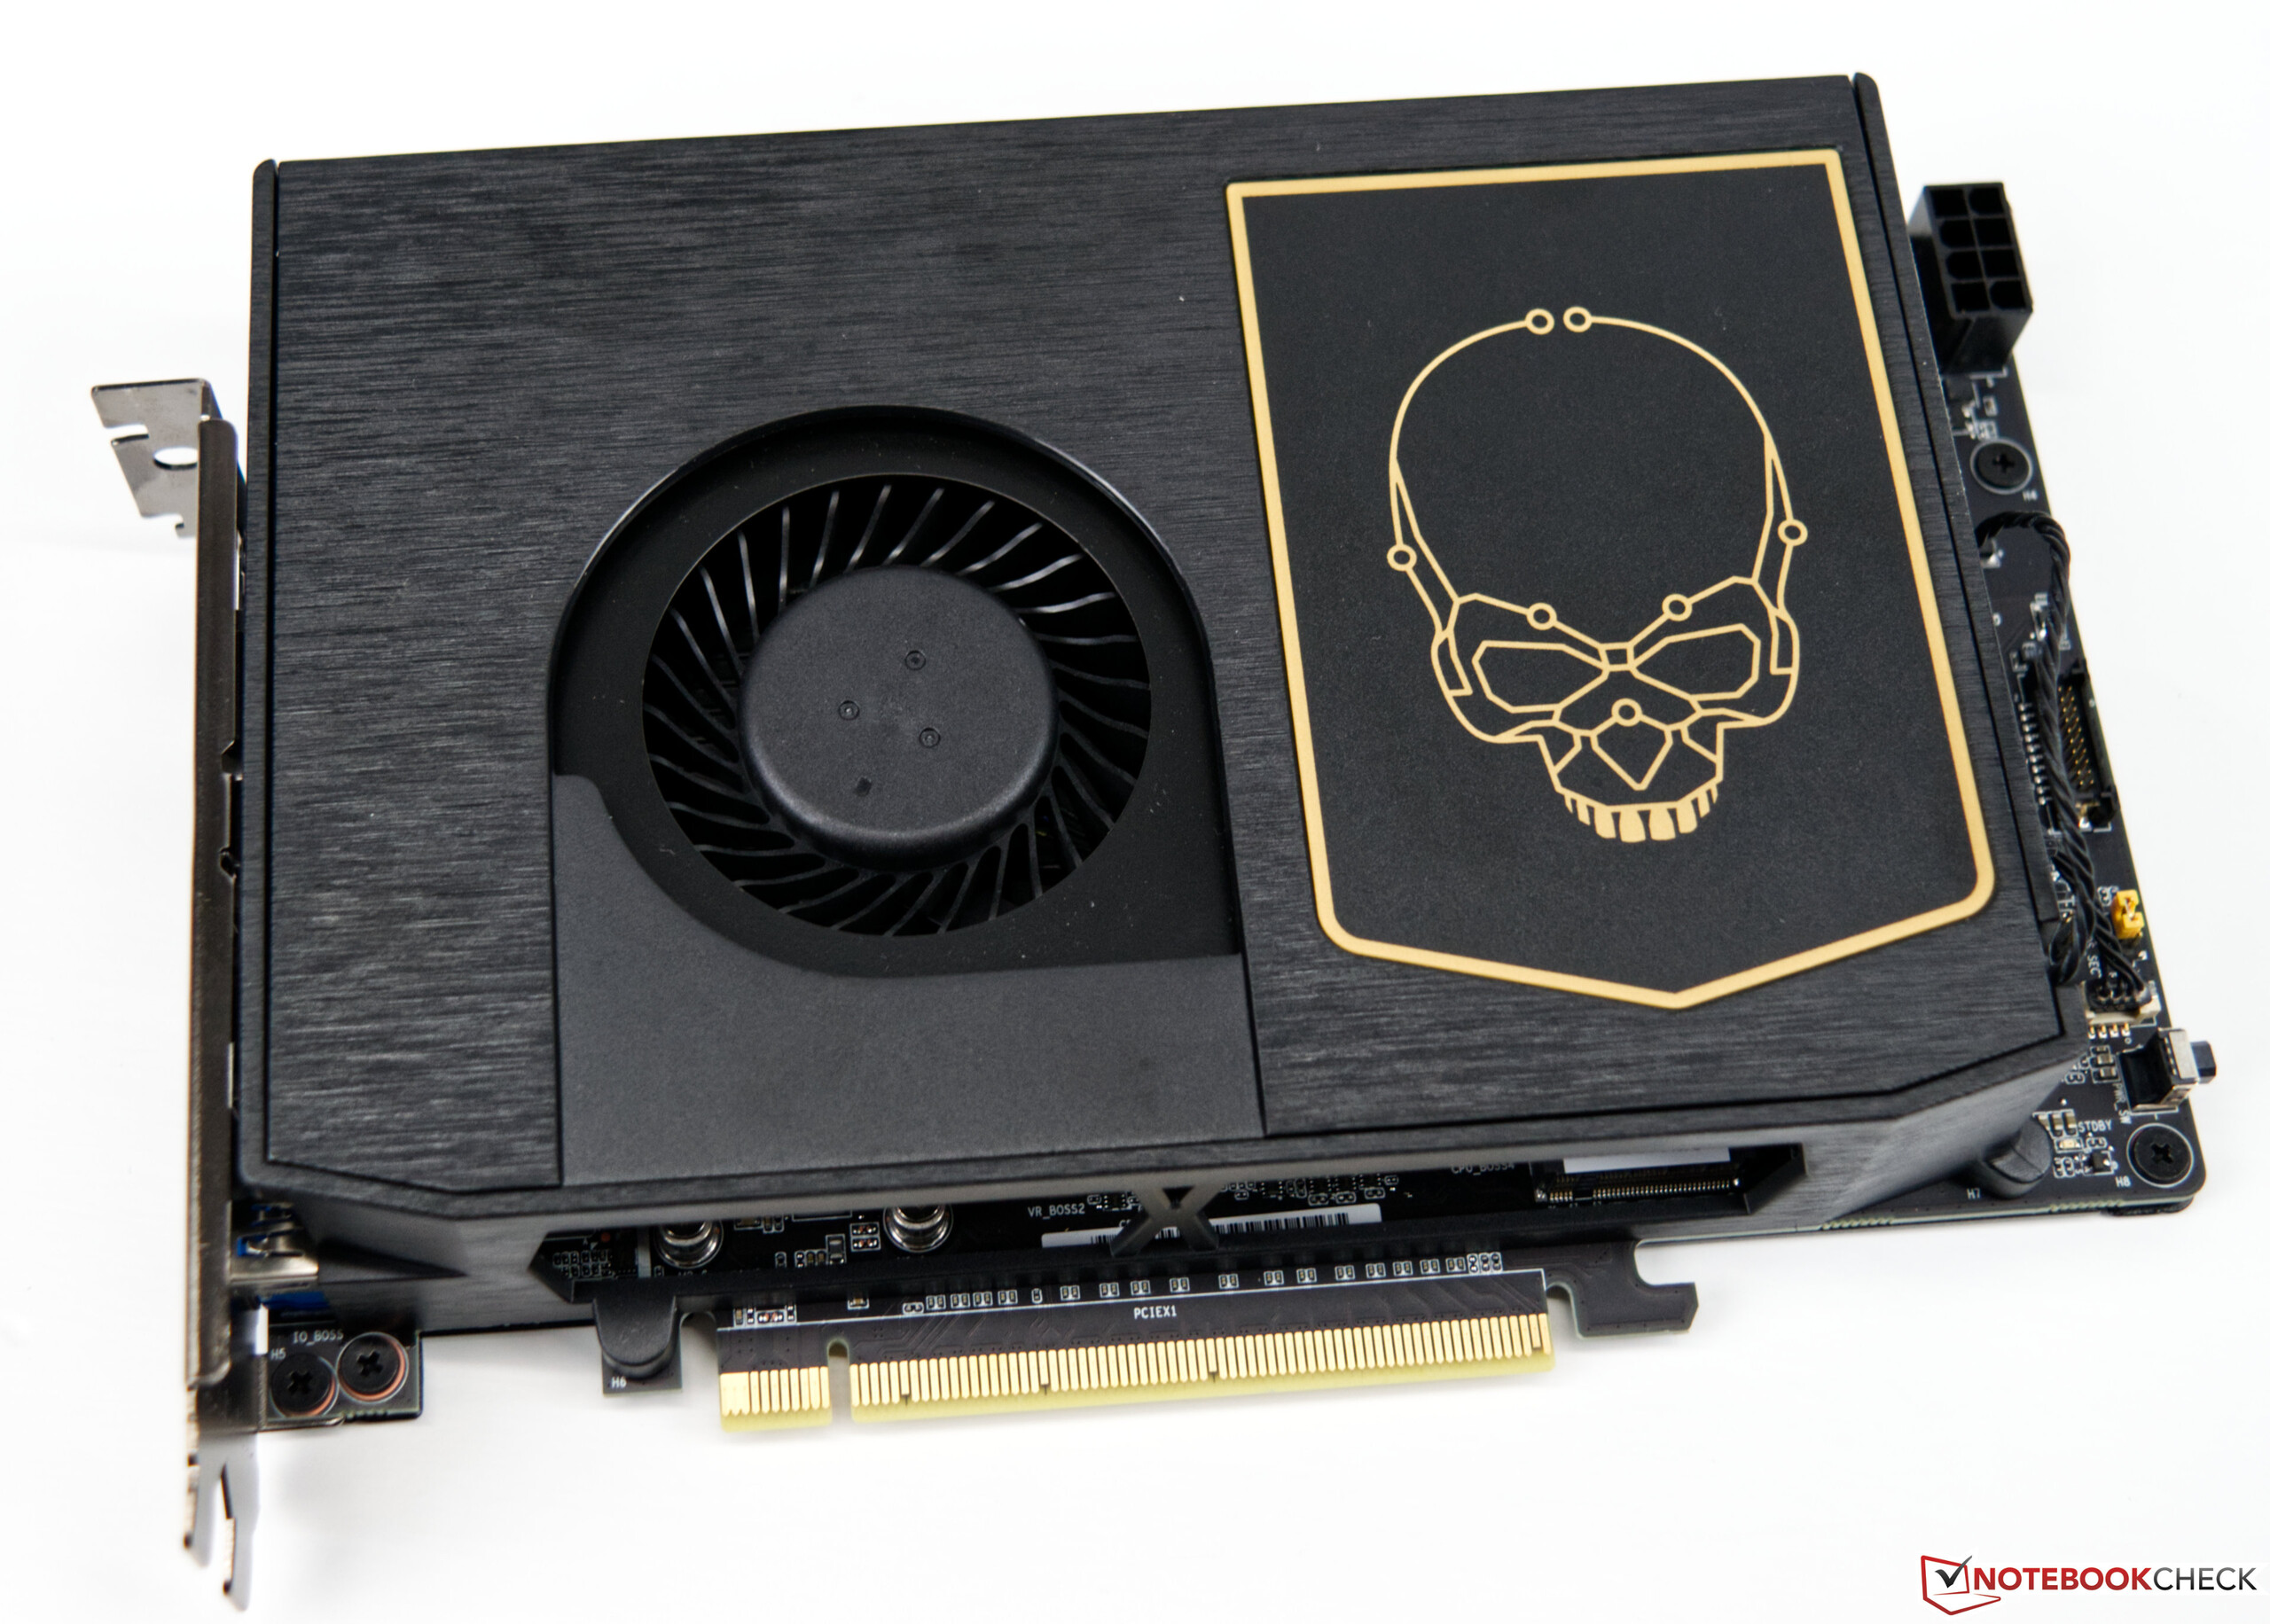
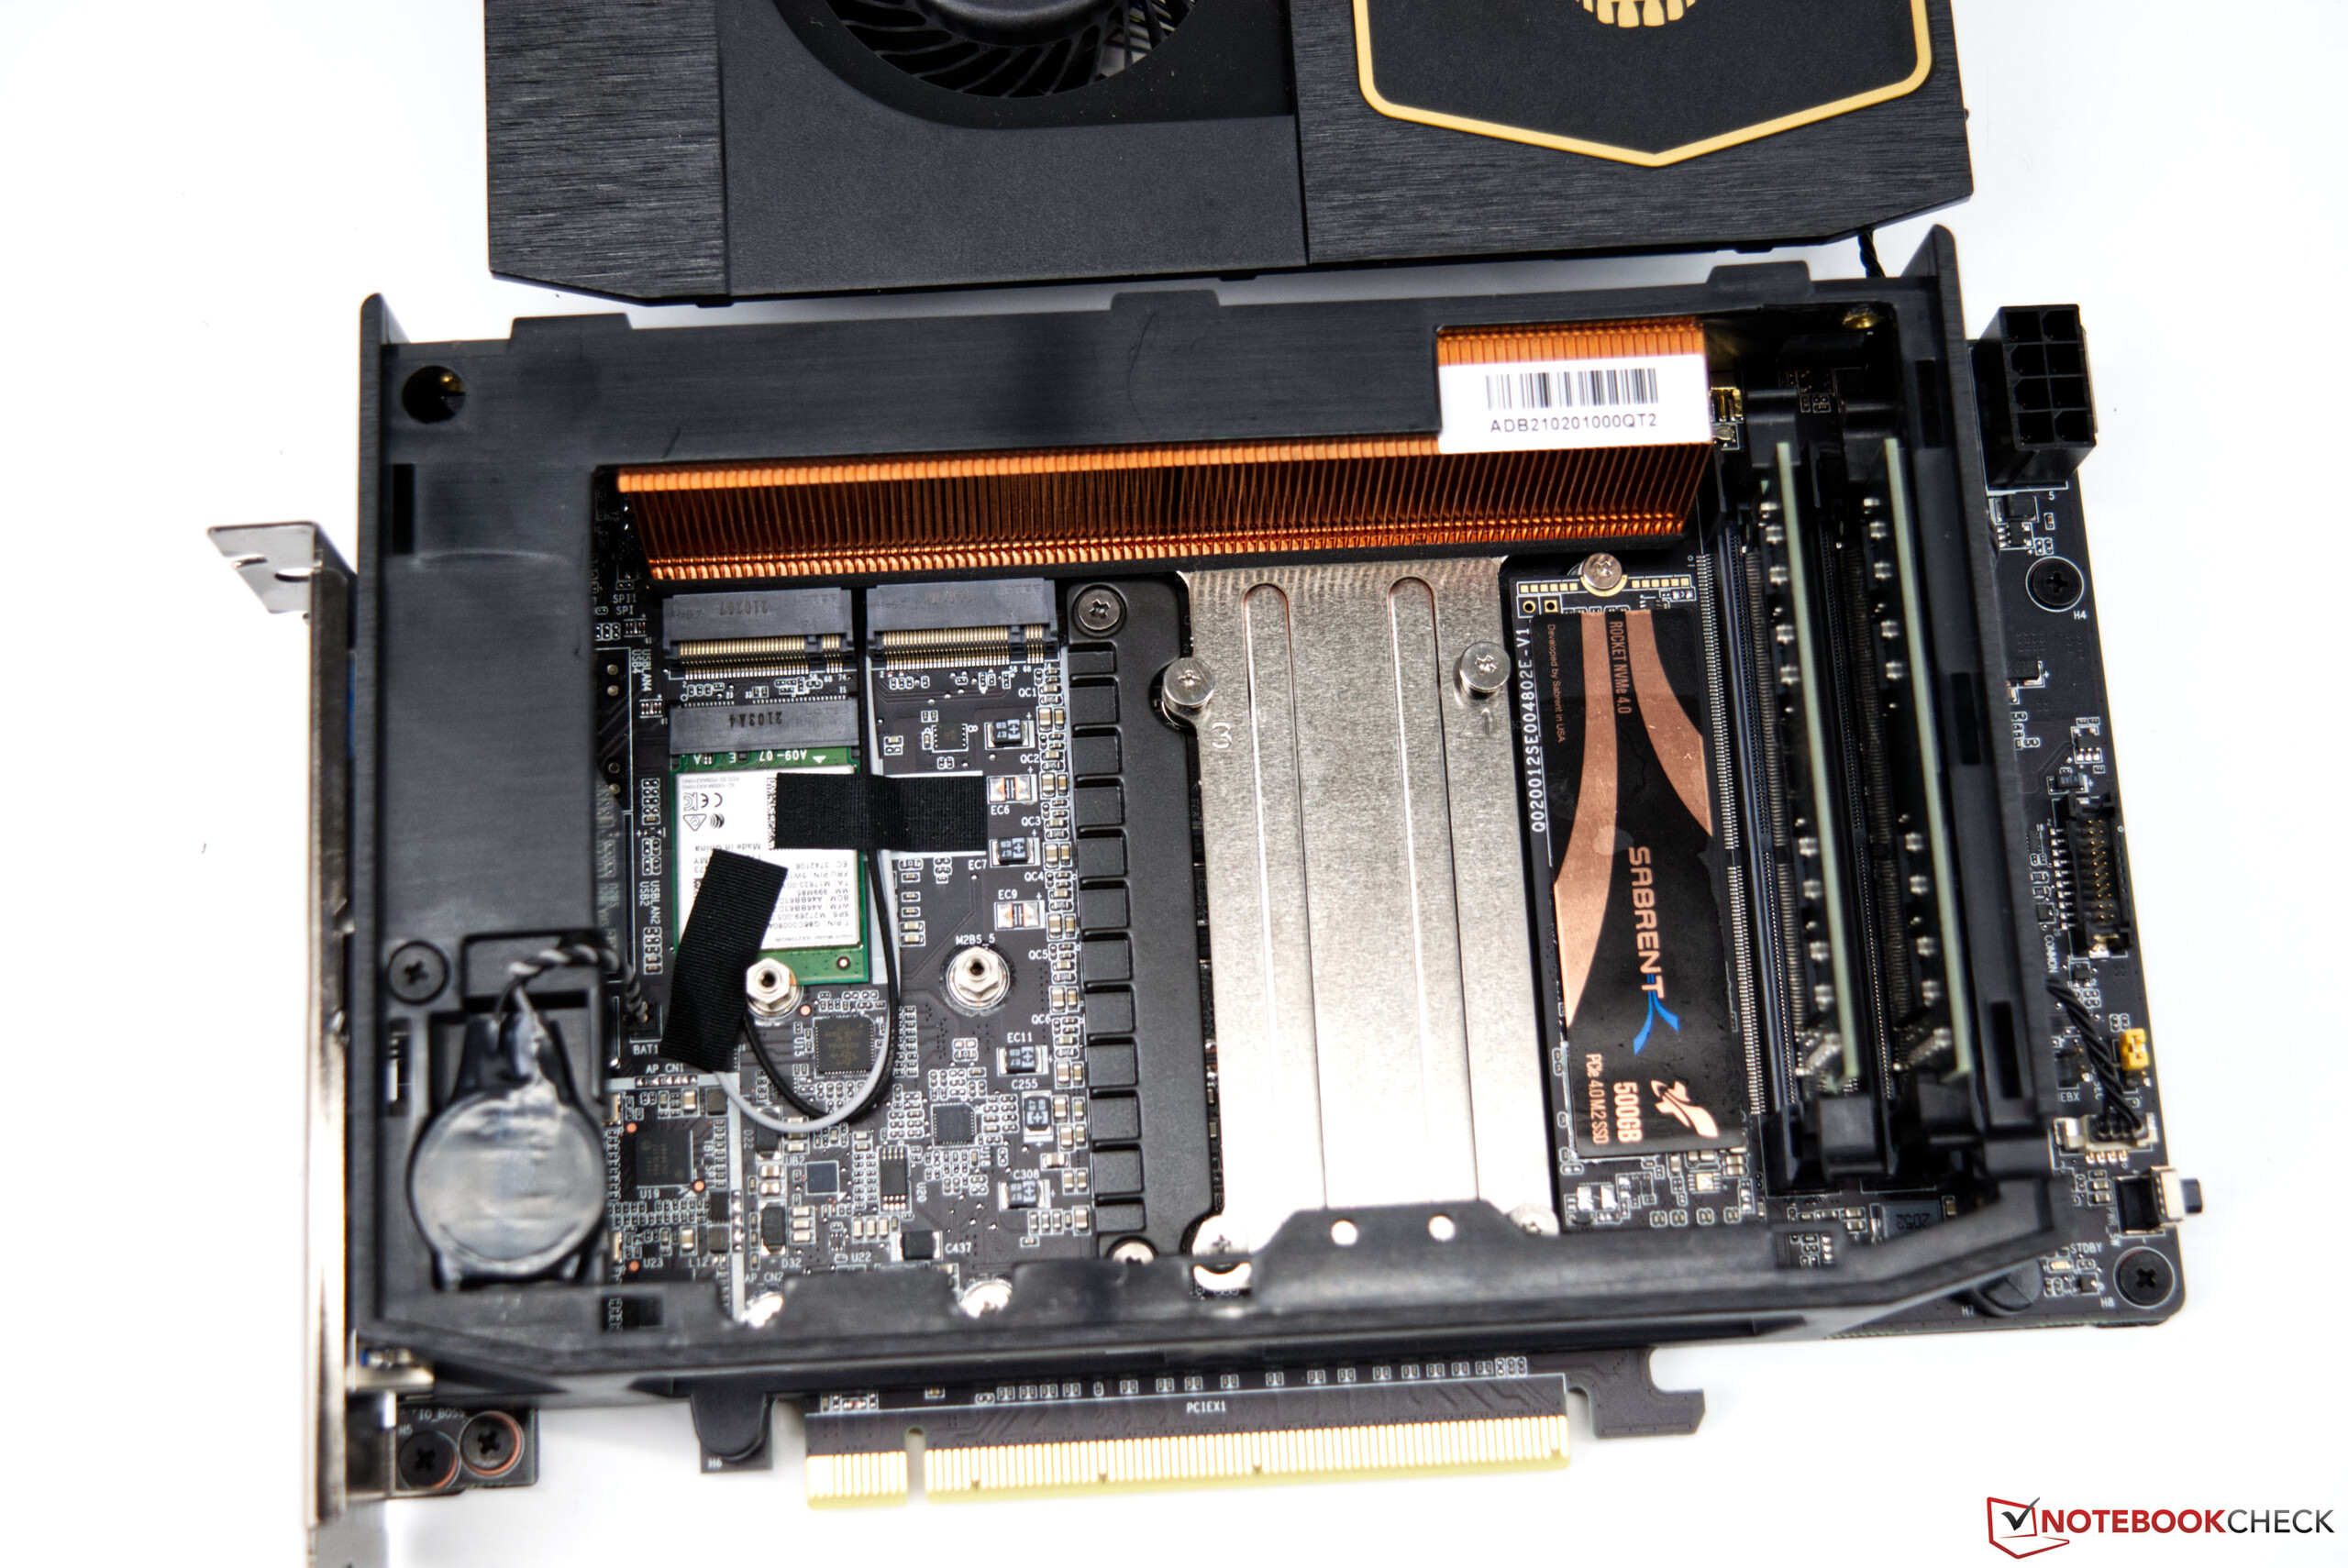
Az Intel NUC 11 Extreme Kit - Beast Canyon nagyon jó teljesítményt kínál egy kis házban. Az új, Intel Core i9-11900KB alapú Compute Element-tel egy, a laptopok szegmenséből érkező gazdaságos SoC-t kapunk. A 8 mag és 16 szál nagyon jó teljesítményt nyújt a játékokban és a produktivitásban a magas IPC-nek köszönhetően. A legkevesebb 1200 dolláros ár miatt azonban nem egy jó fogás. Ehhez még hozzá kell adni a dedikált grafikus kártyát, a munkamemóriát, a tömegtárolót és az operációs rendszert, így gyorsan 2000 dollár fölé kerülünk. Az összehasonlítható asztali rendszerek jelenleg hasonlóan drágák, így mindenképpen érdemes megfontolni az Intel NUC 11 Extreme Kit - Beast Canyon megvásárlását.
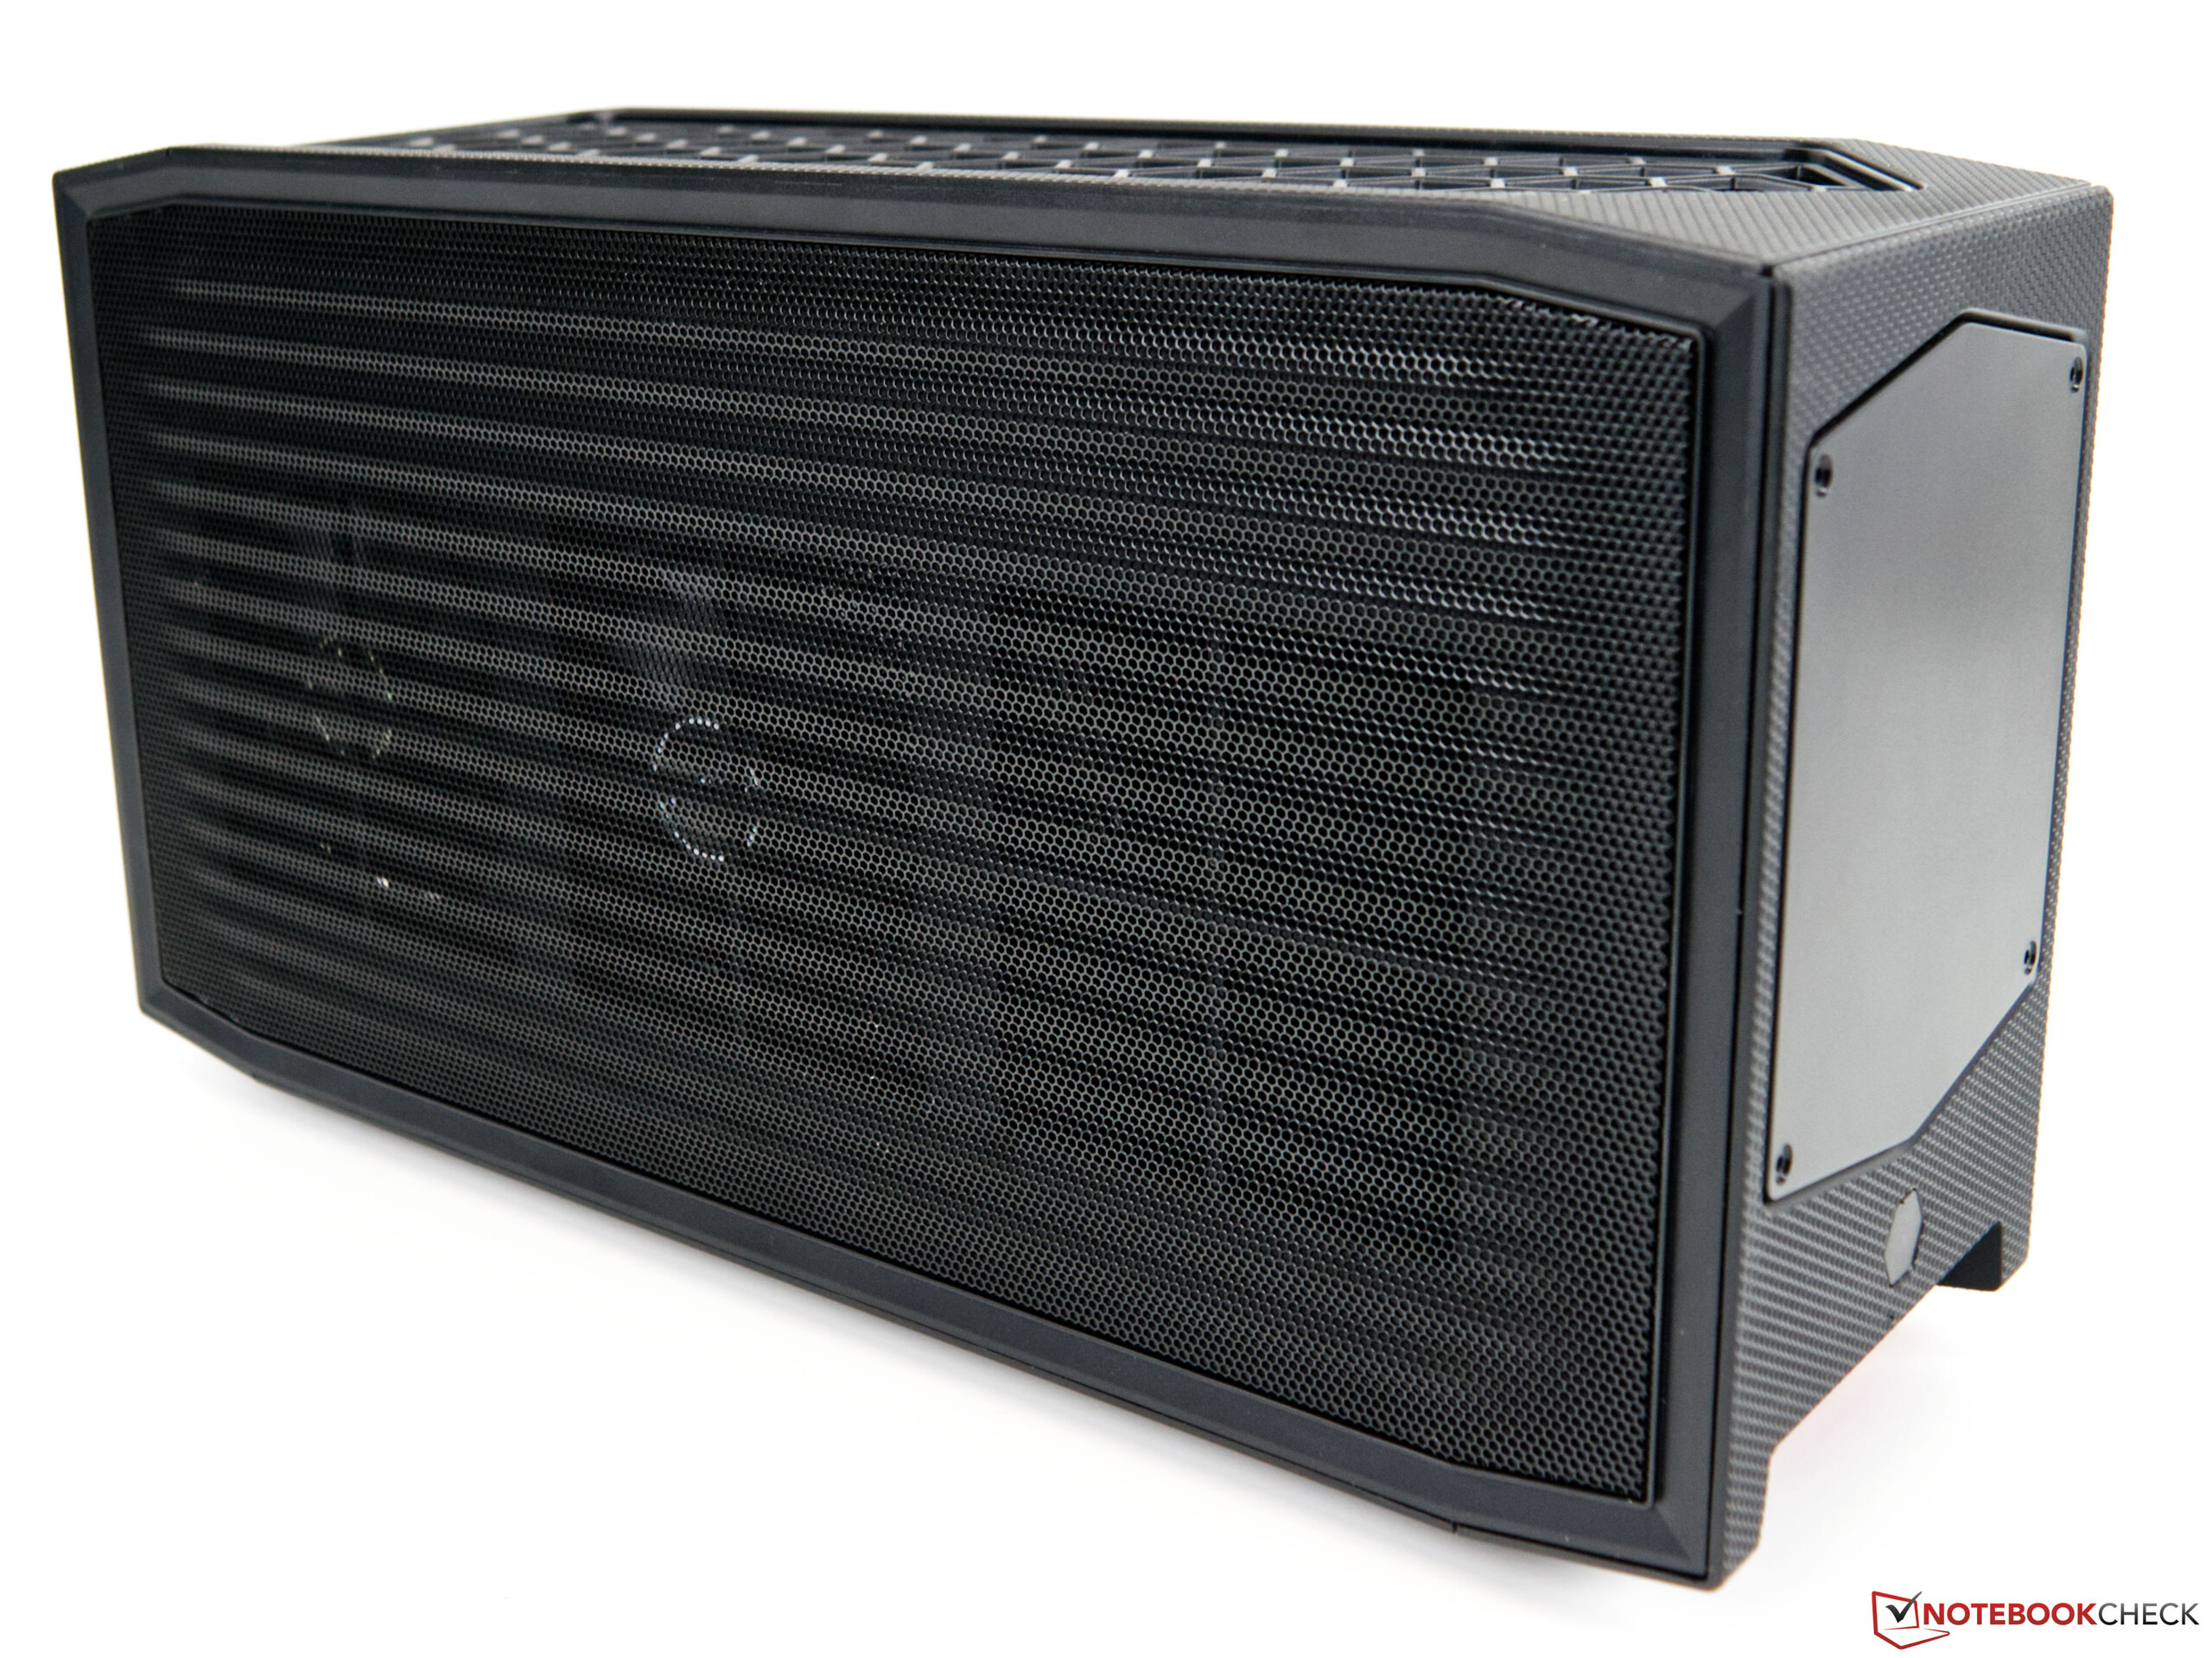
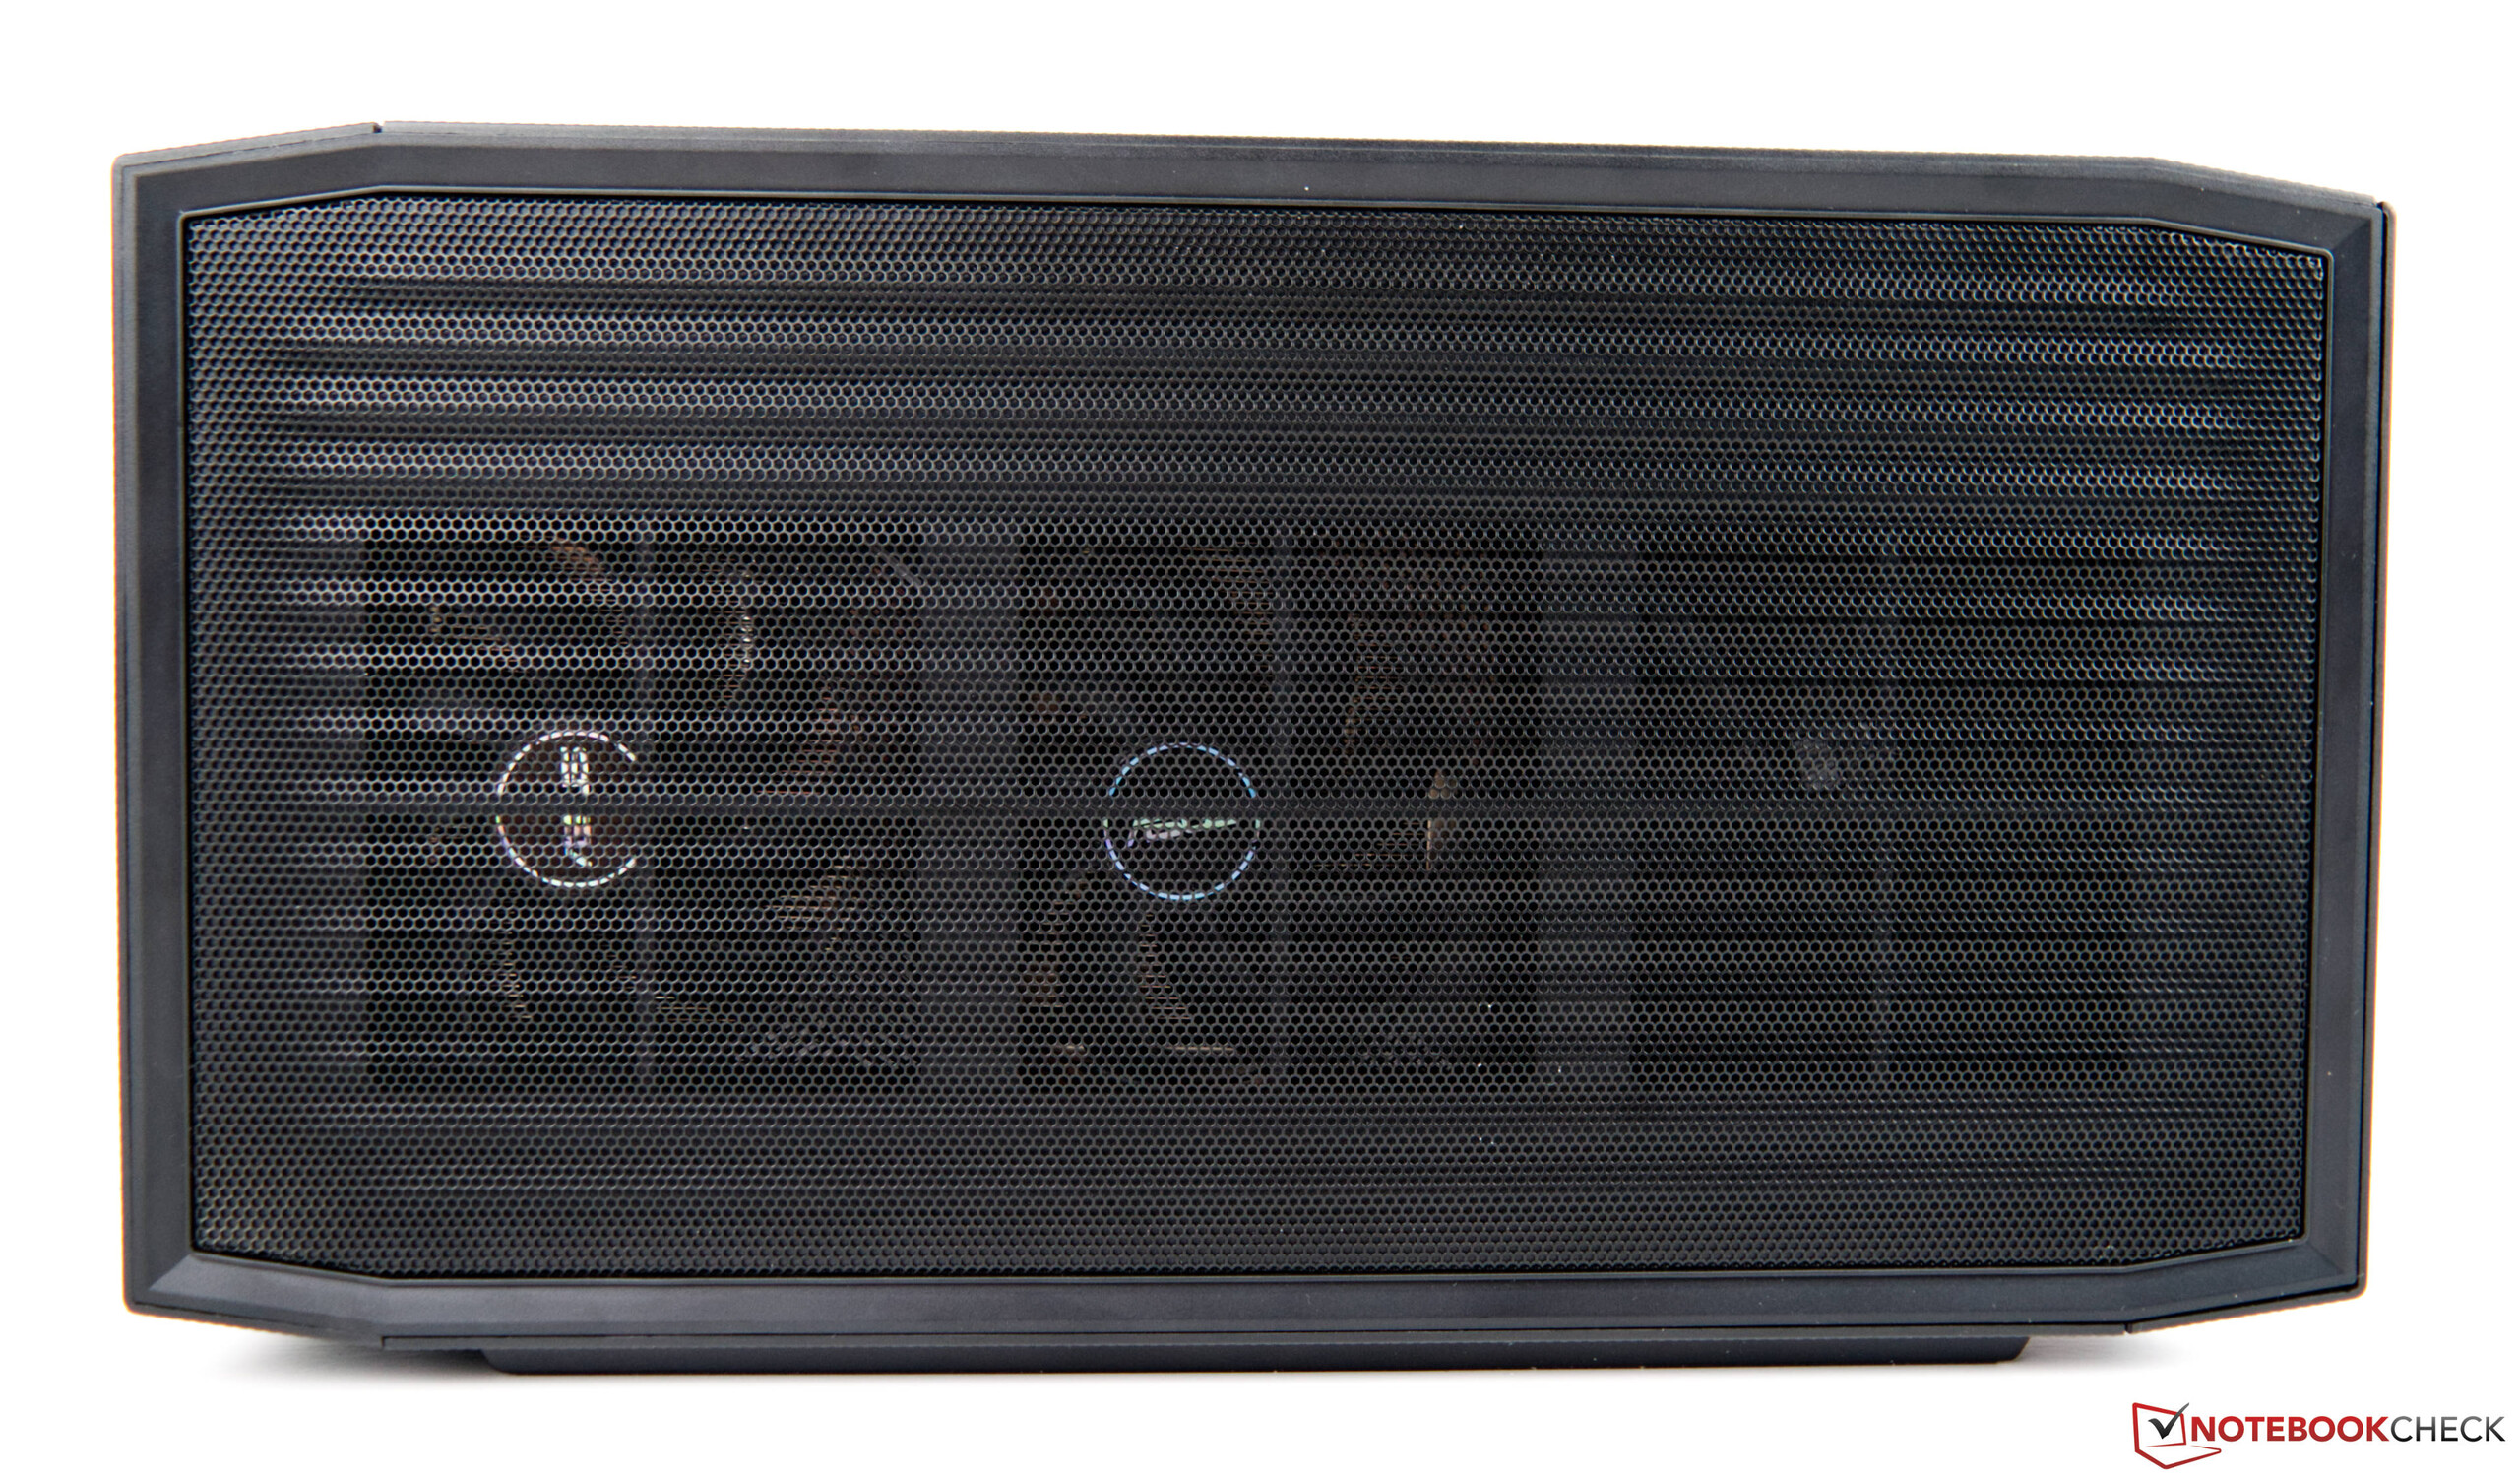
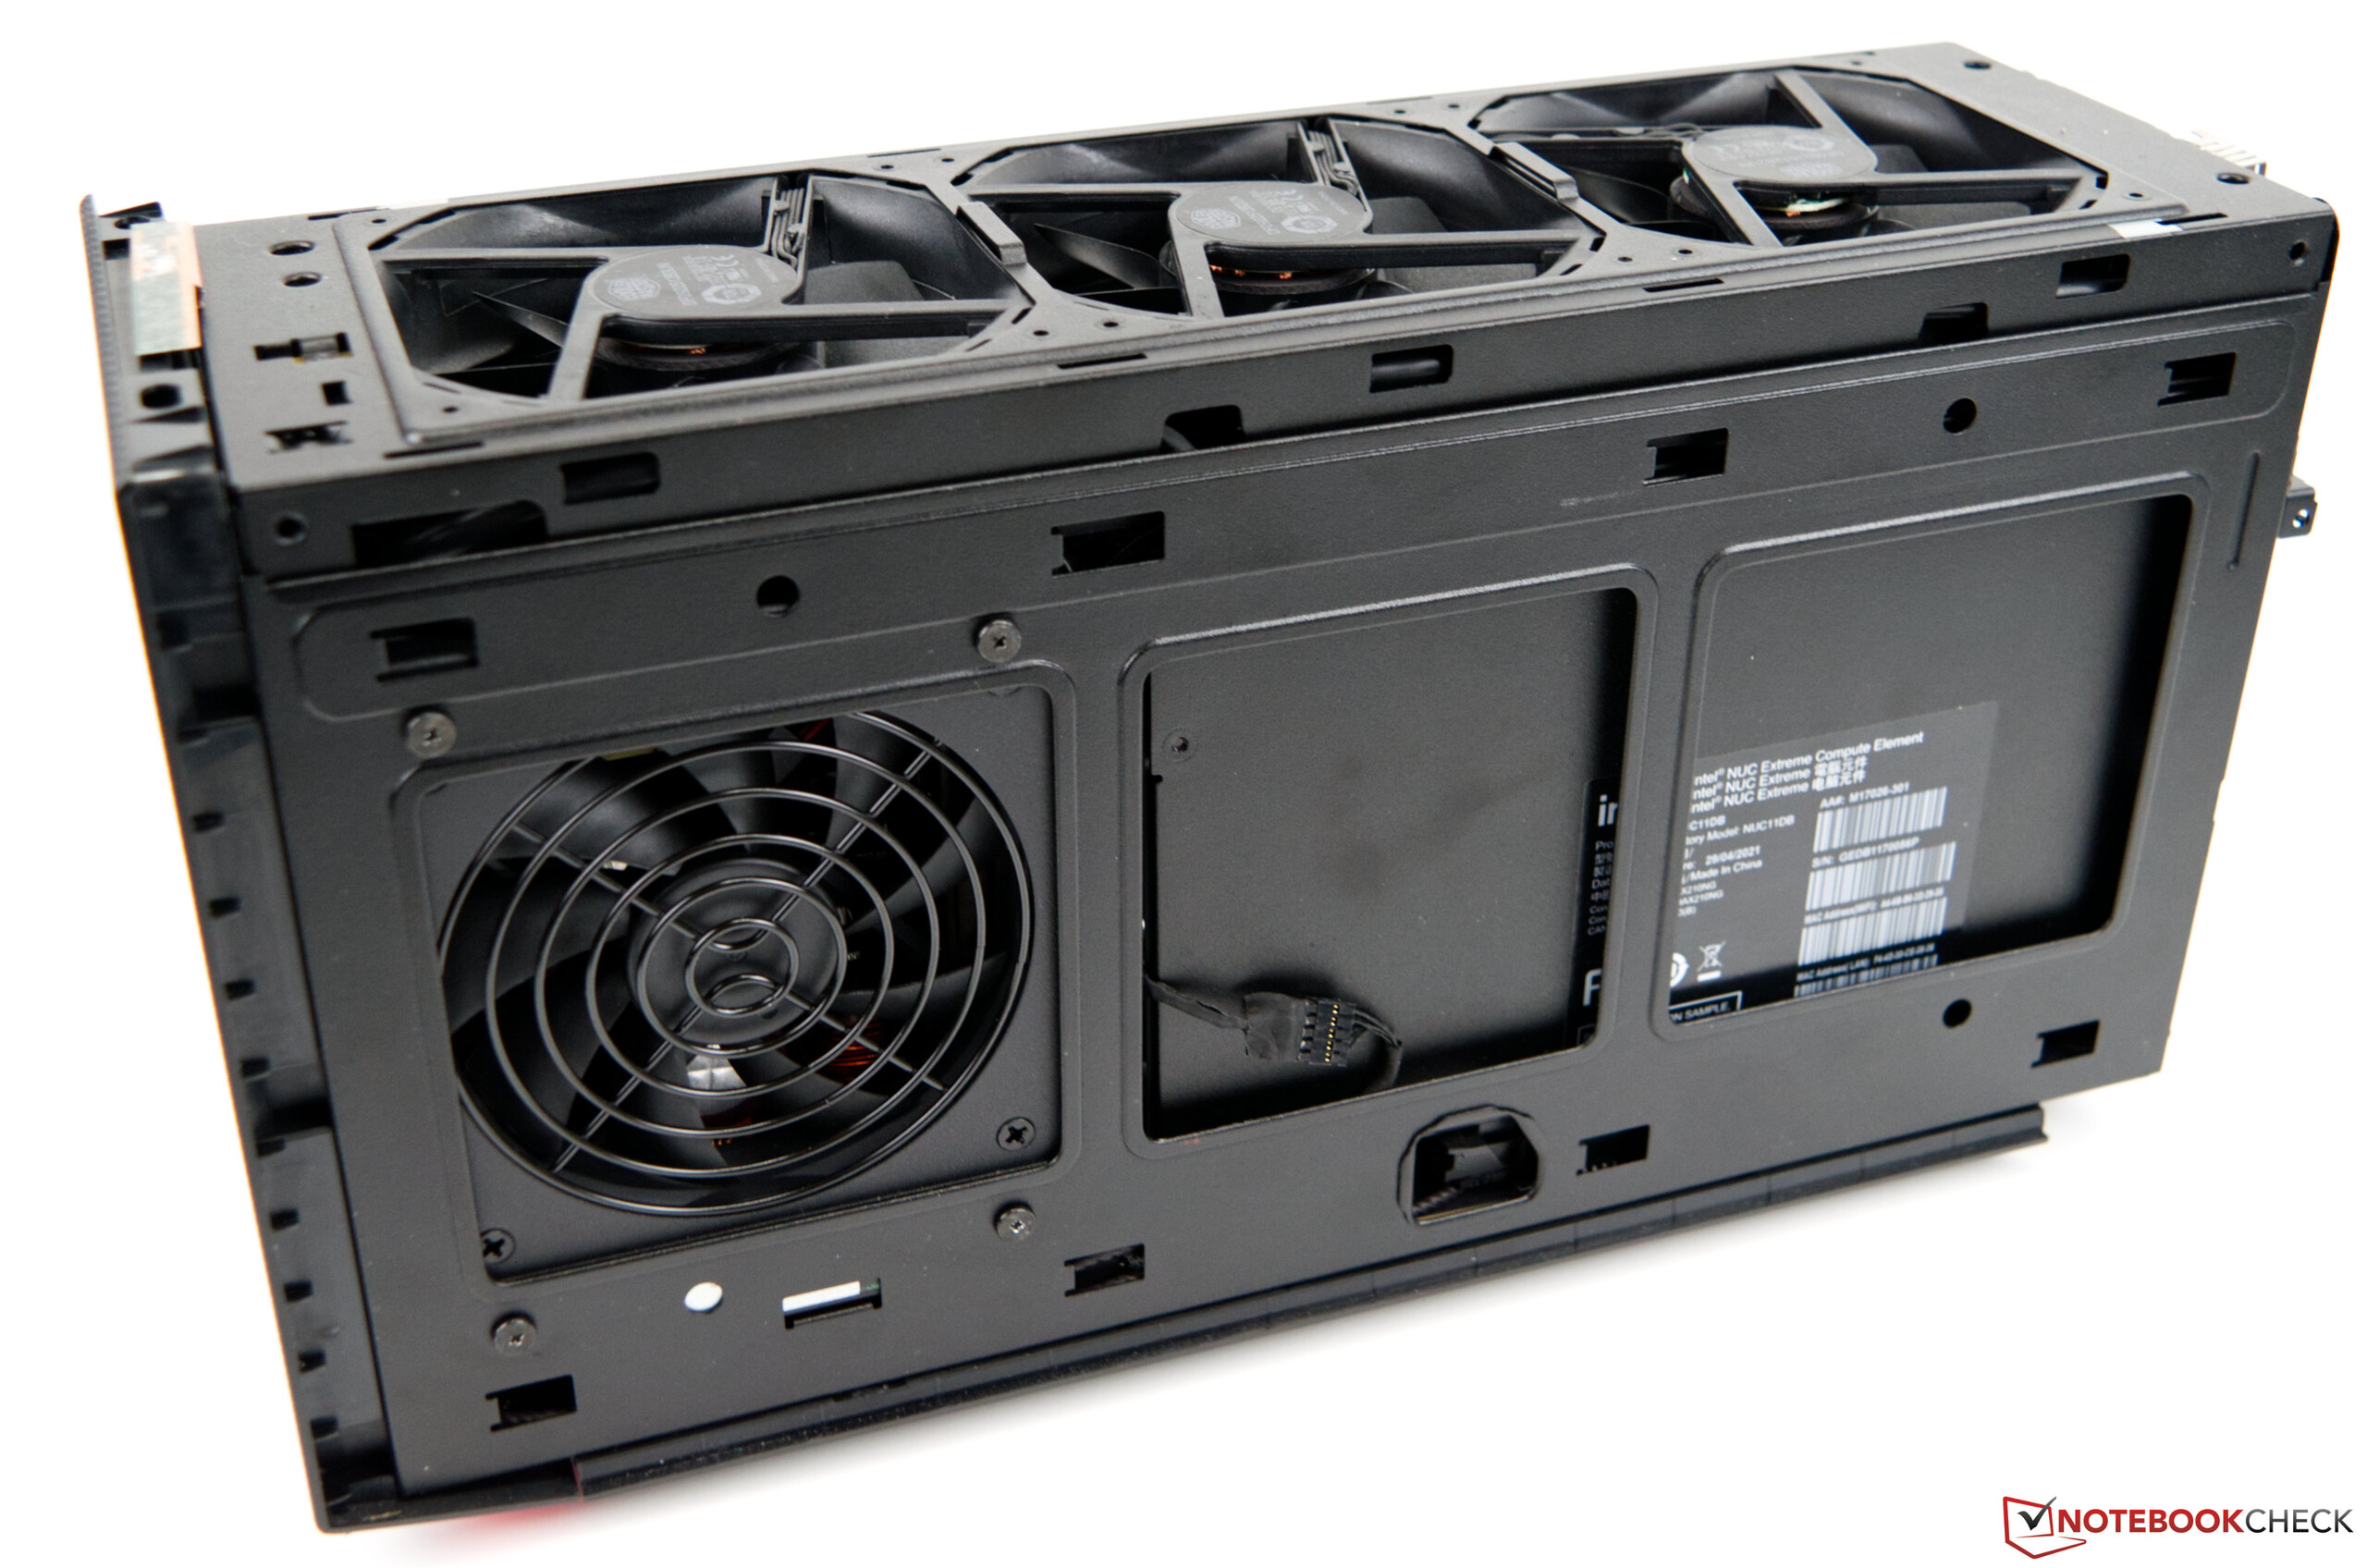
A legnagyobb hátrányt talán a magas zajszint jelenti, ami terhelés alatt egyértelműen hallható. Aki együtt tud élni a rendszer hátrányaival, és nem a legnagyobb grafikus kártyát akarja beszerelni, az Intel NUC 11 Extreme Kit - Beast Canyon-nal egy ritkaságszámba menő, kompakt rendszert fog kapni. A külön nem kapható tok külseje felhívja magára a figyelmet.
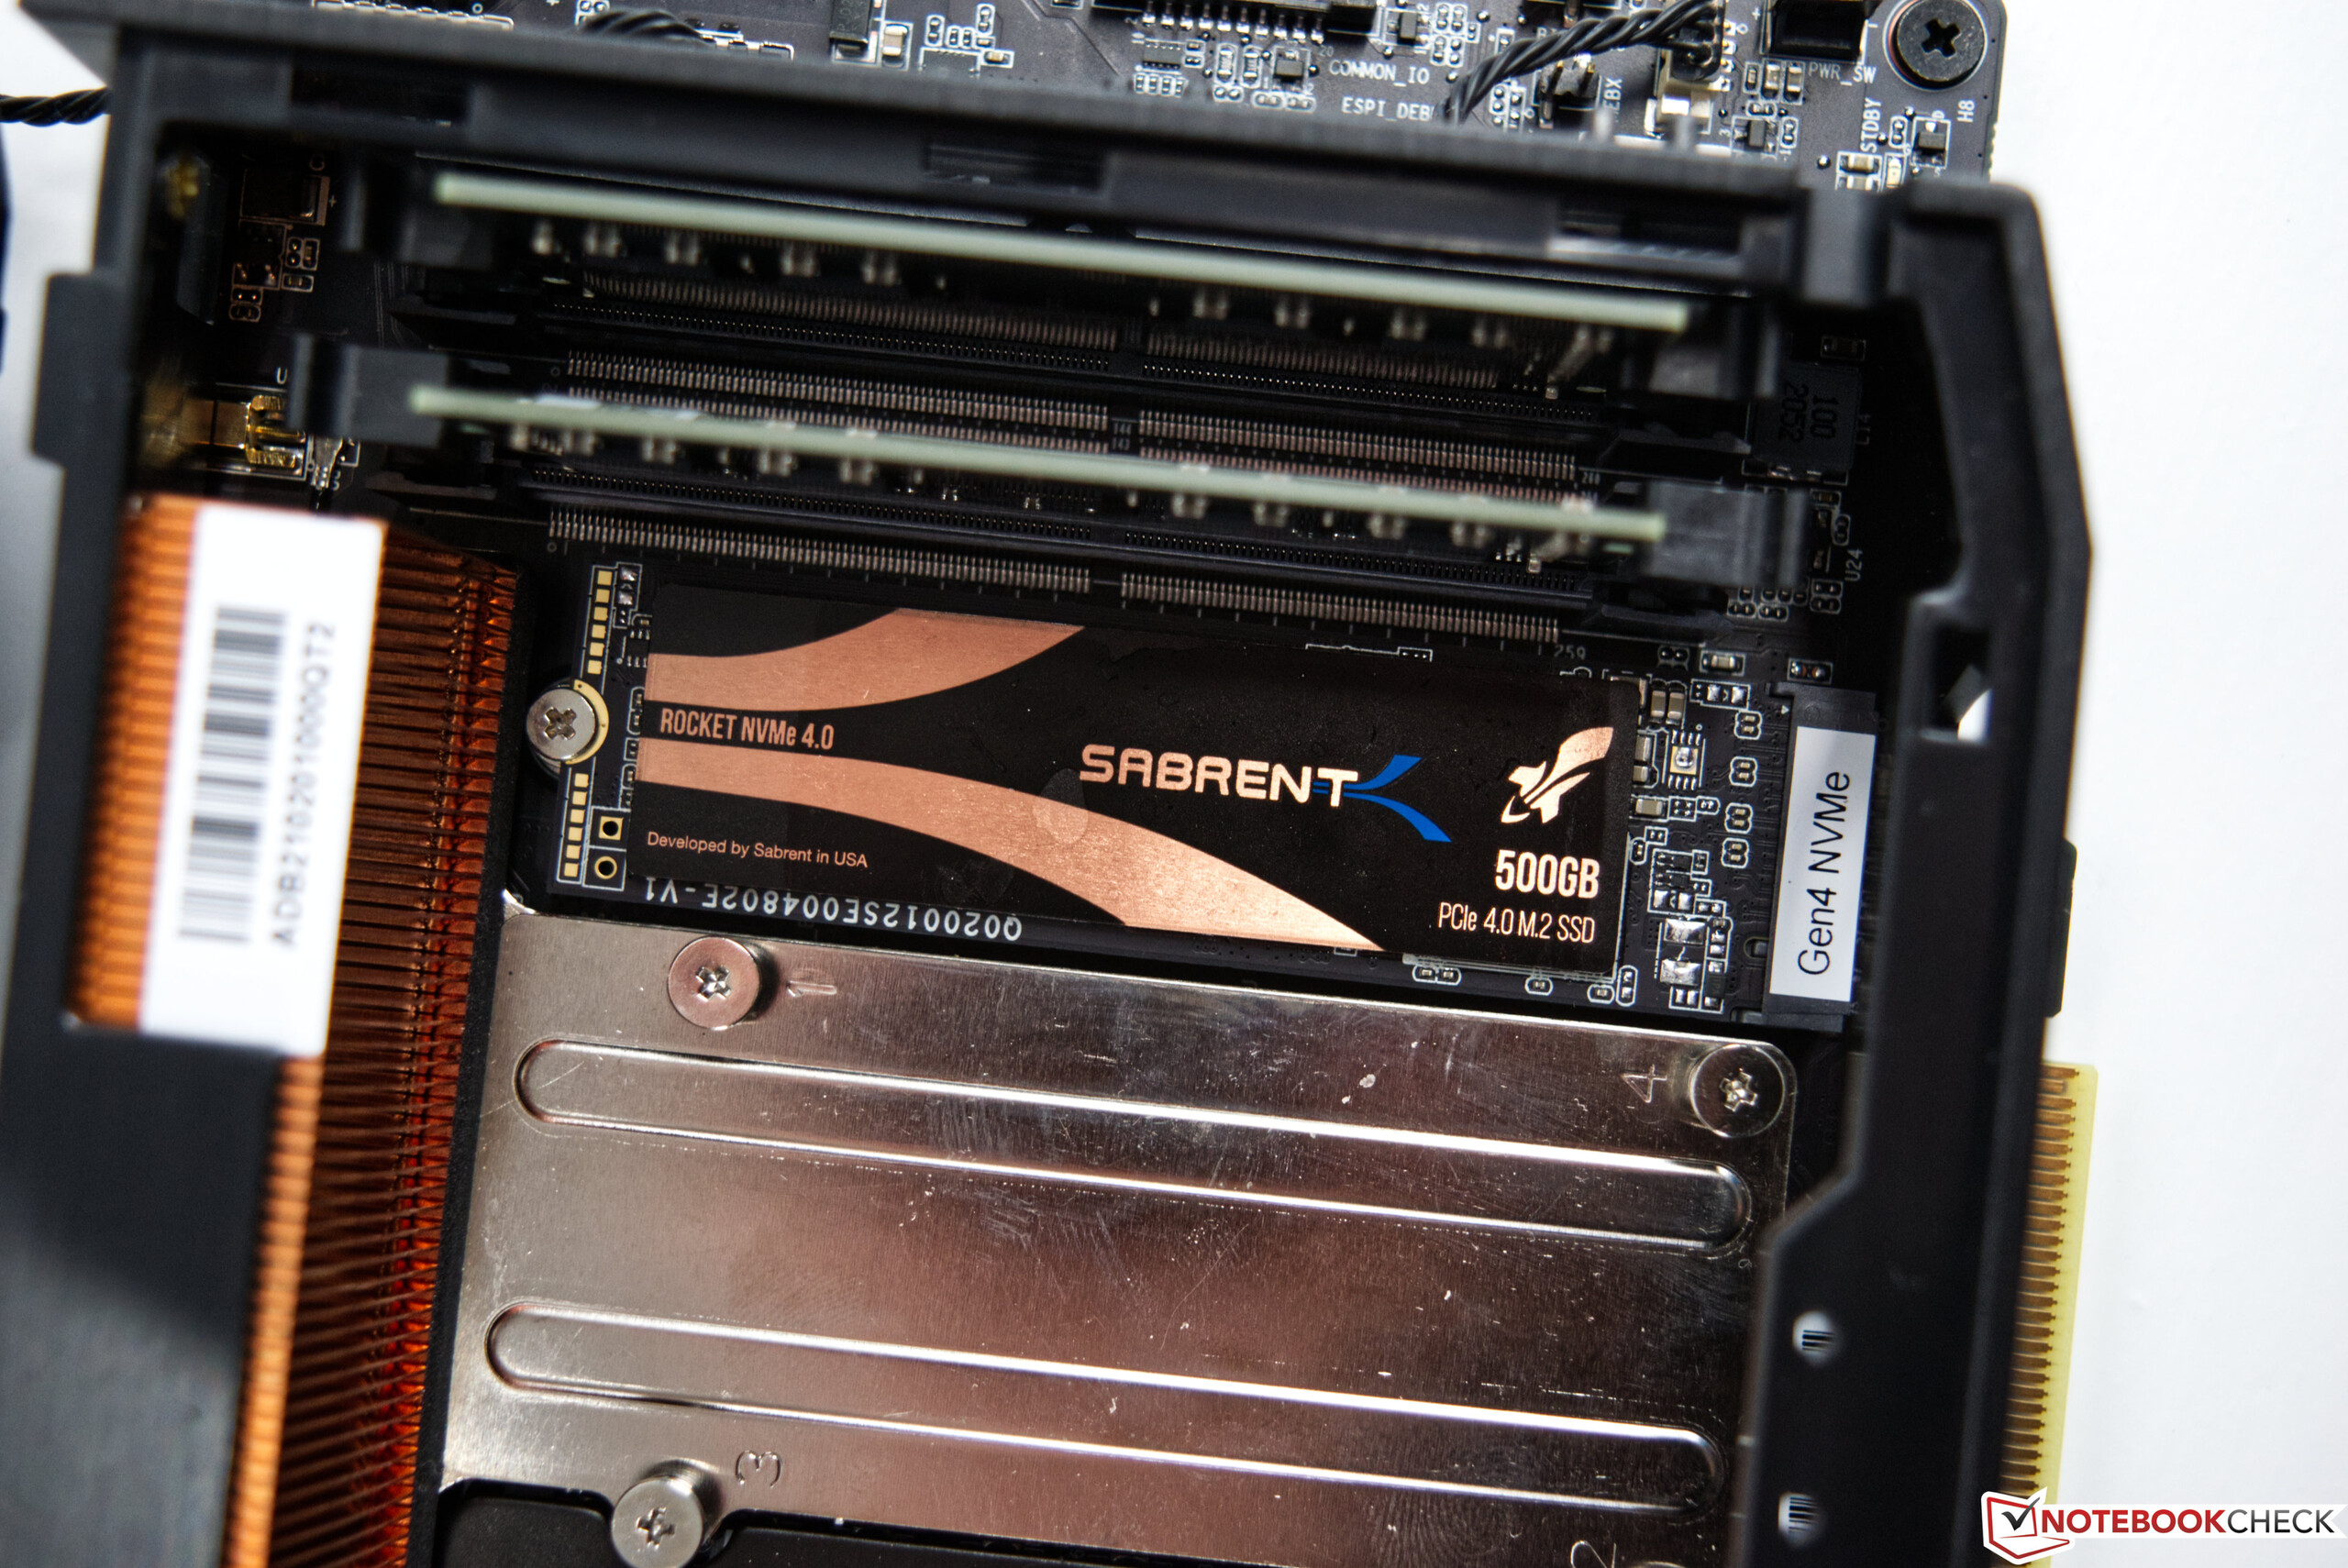
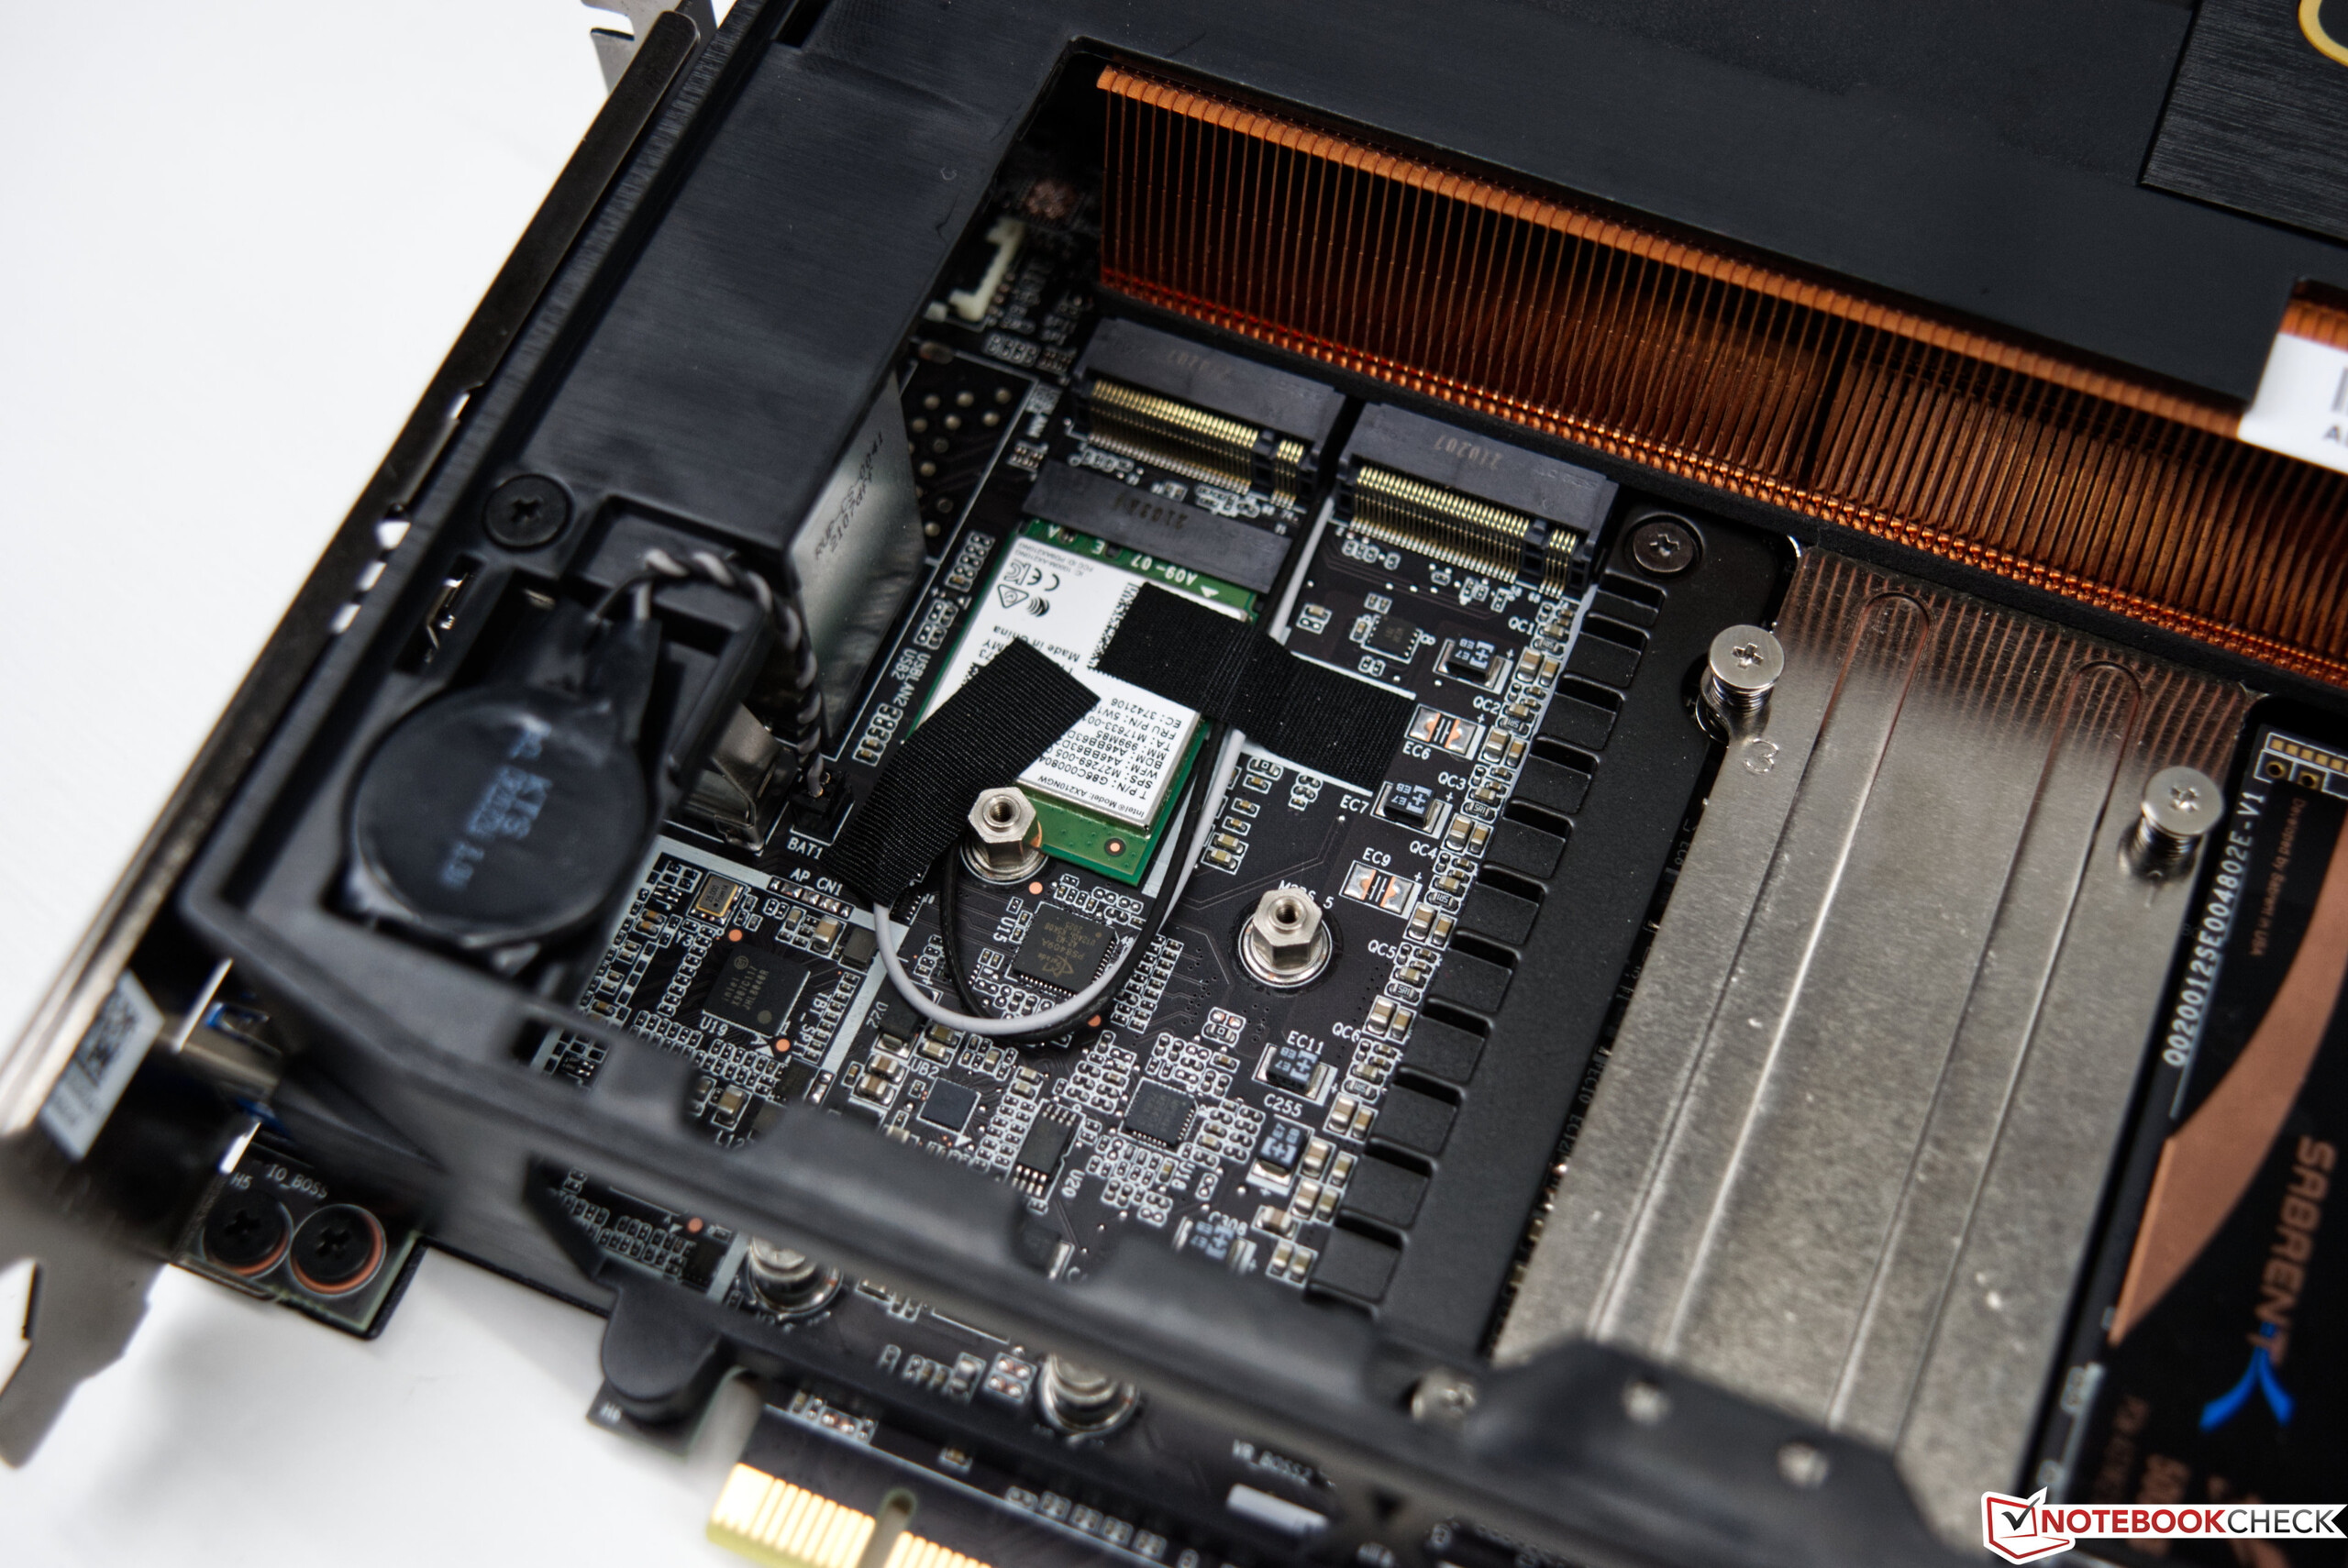
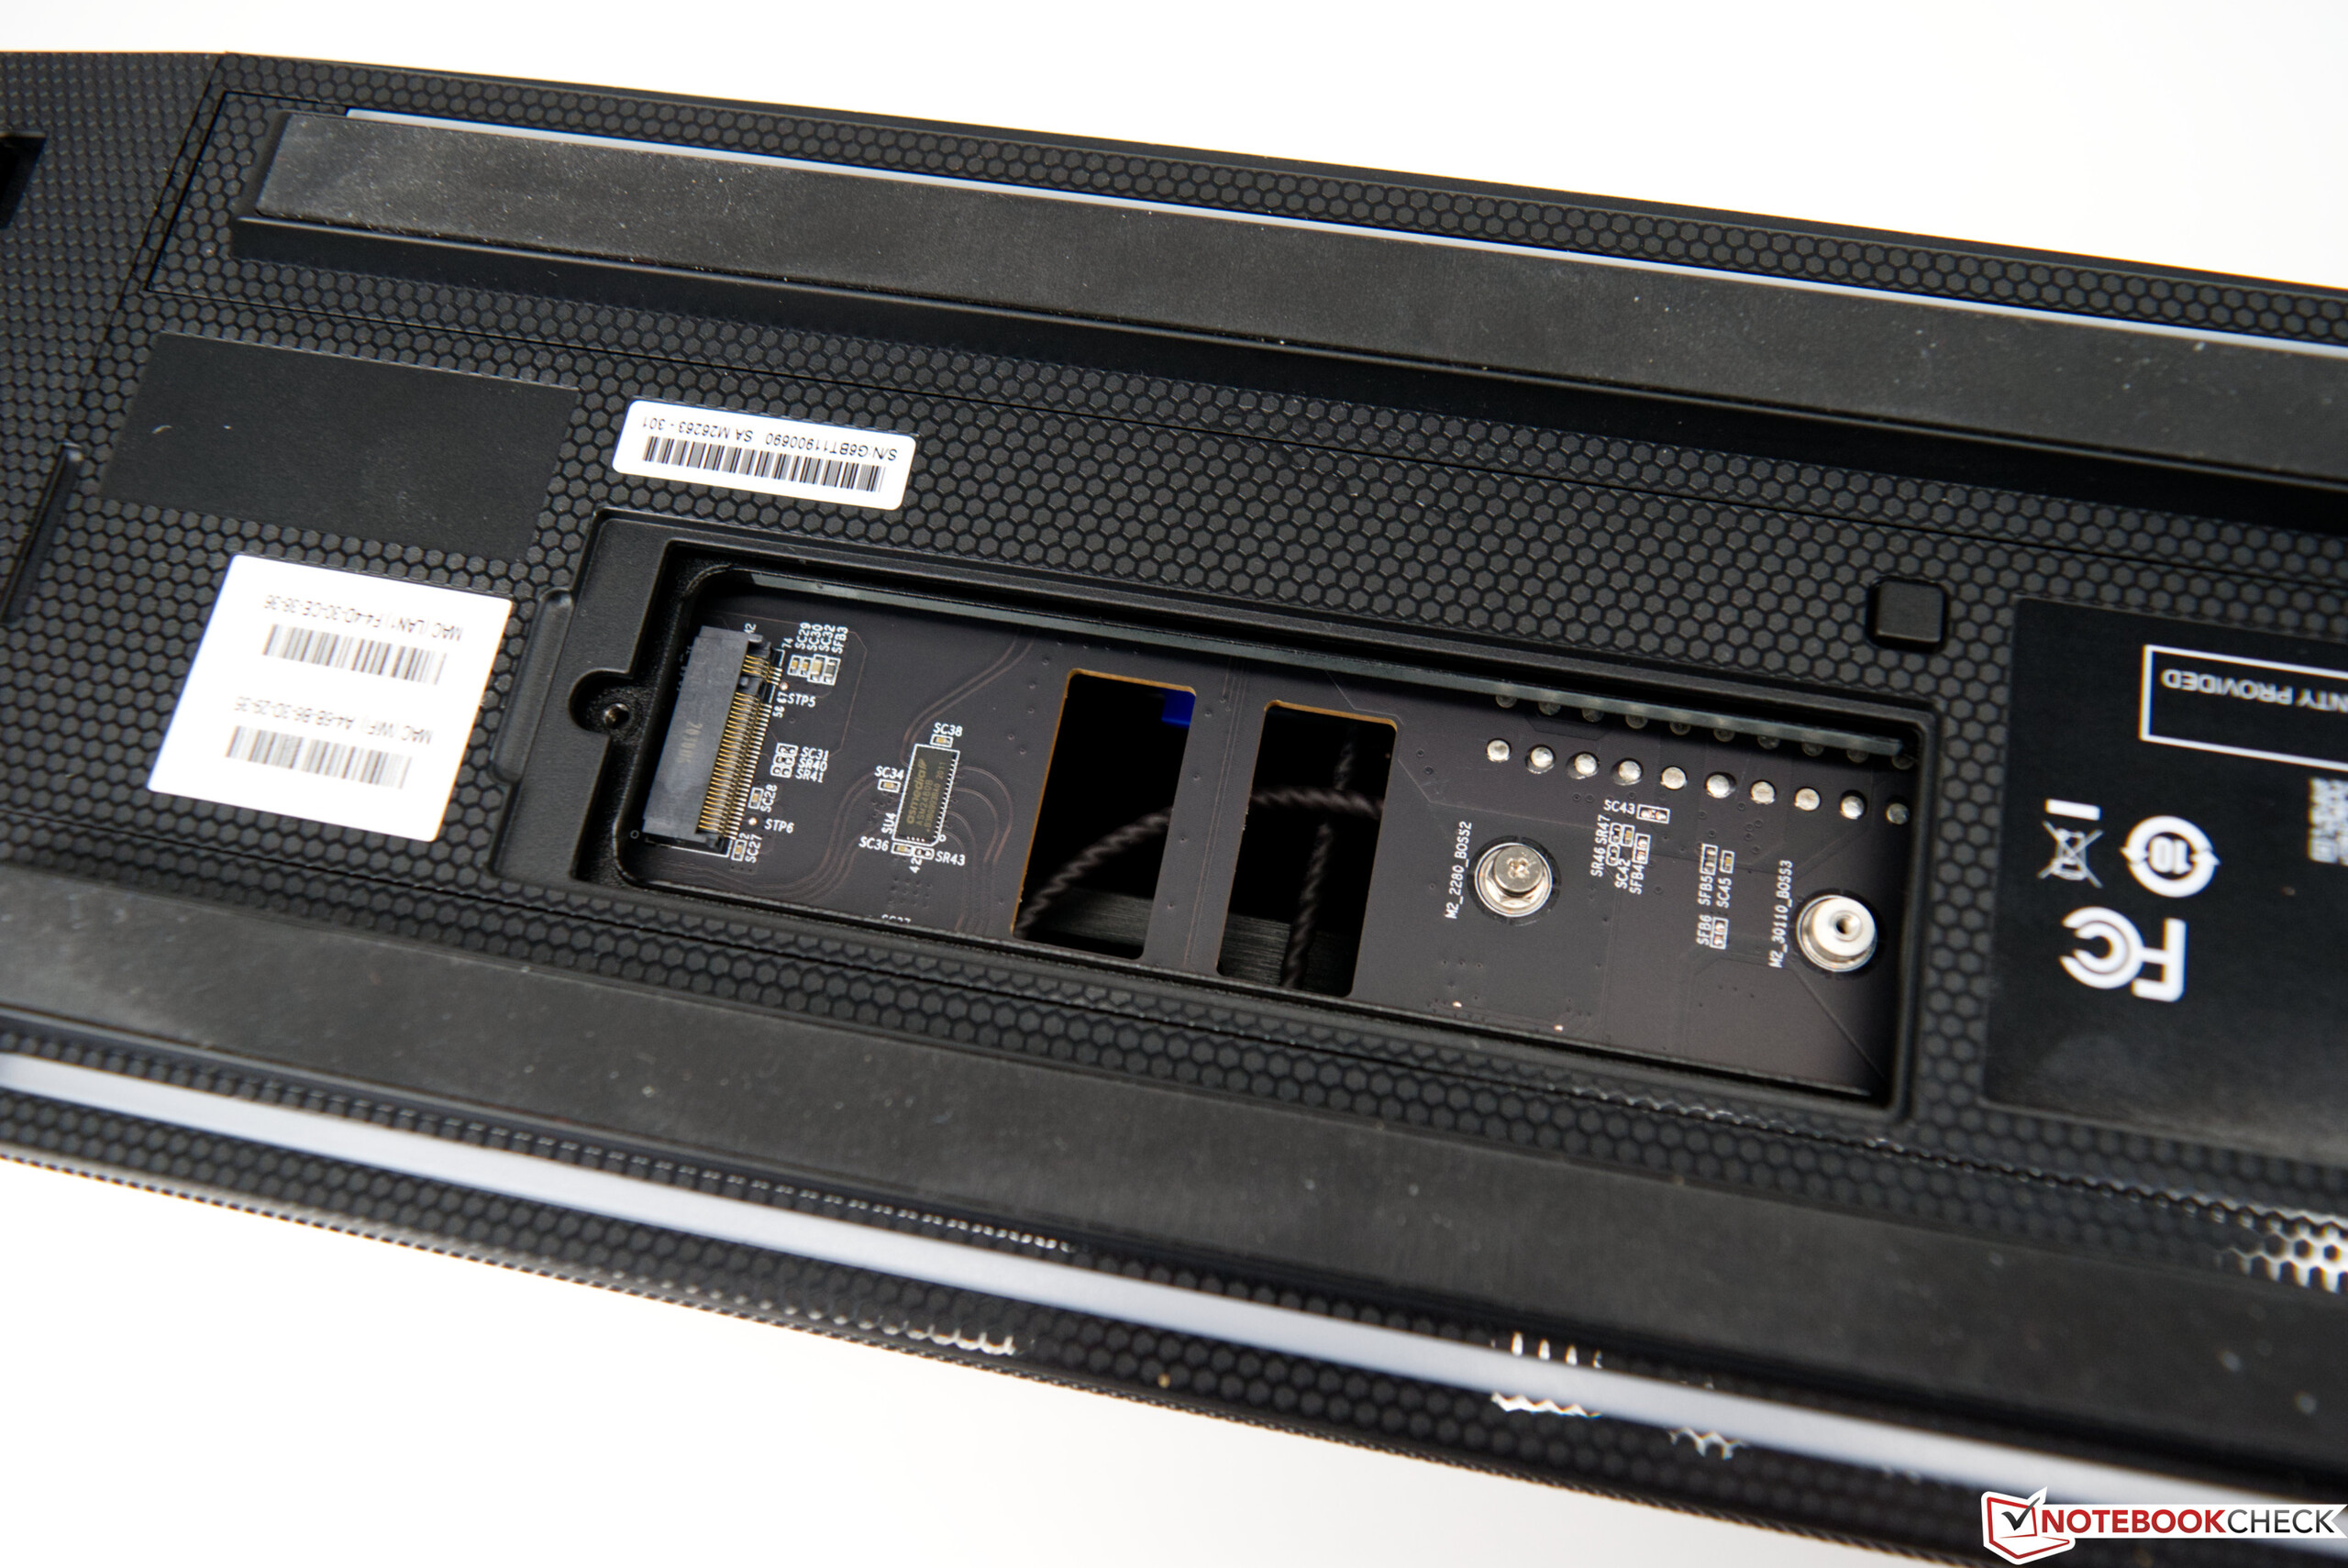
Az Intel NUC 11 Extreme Kit - Beast Canyon modellel az Intel cég még tovább fokozza kompakt eszközeinek a teljesítményét.
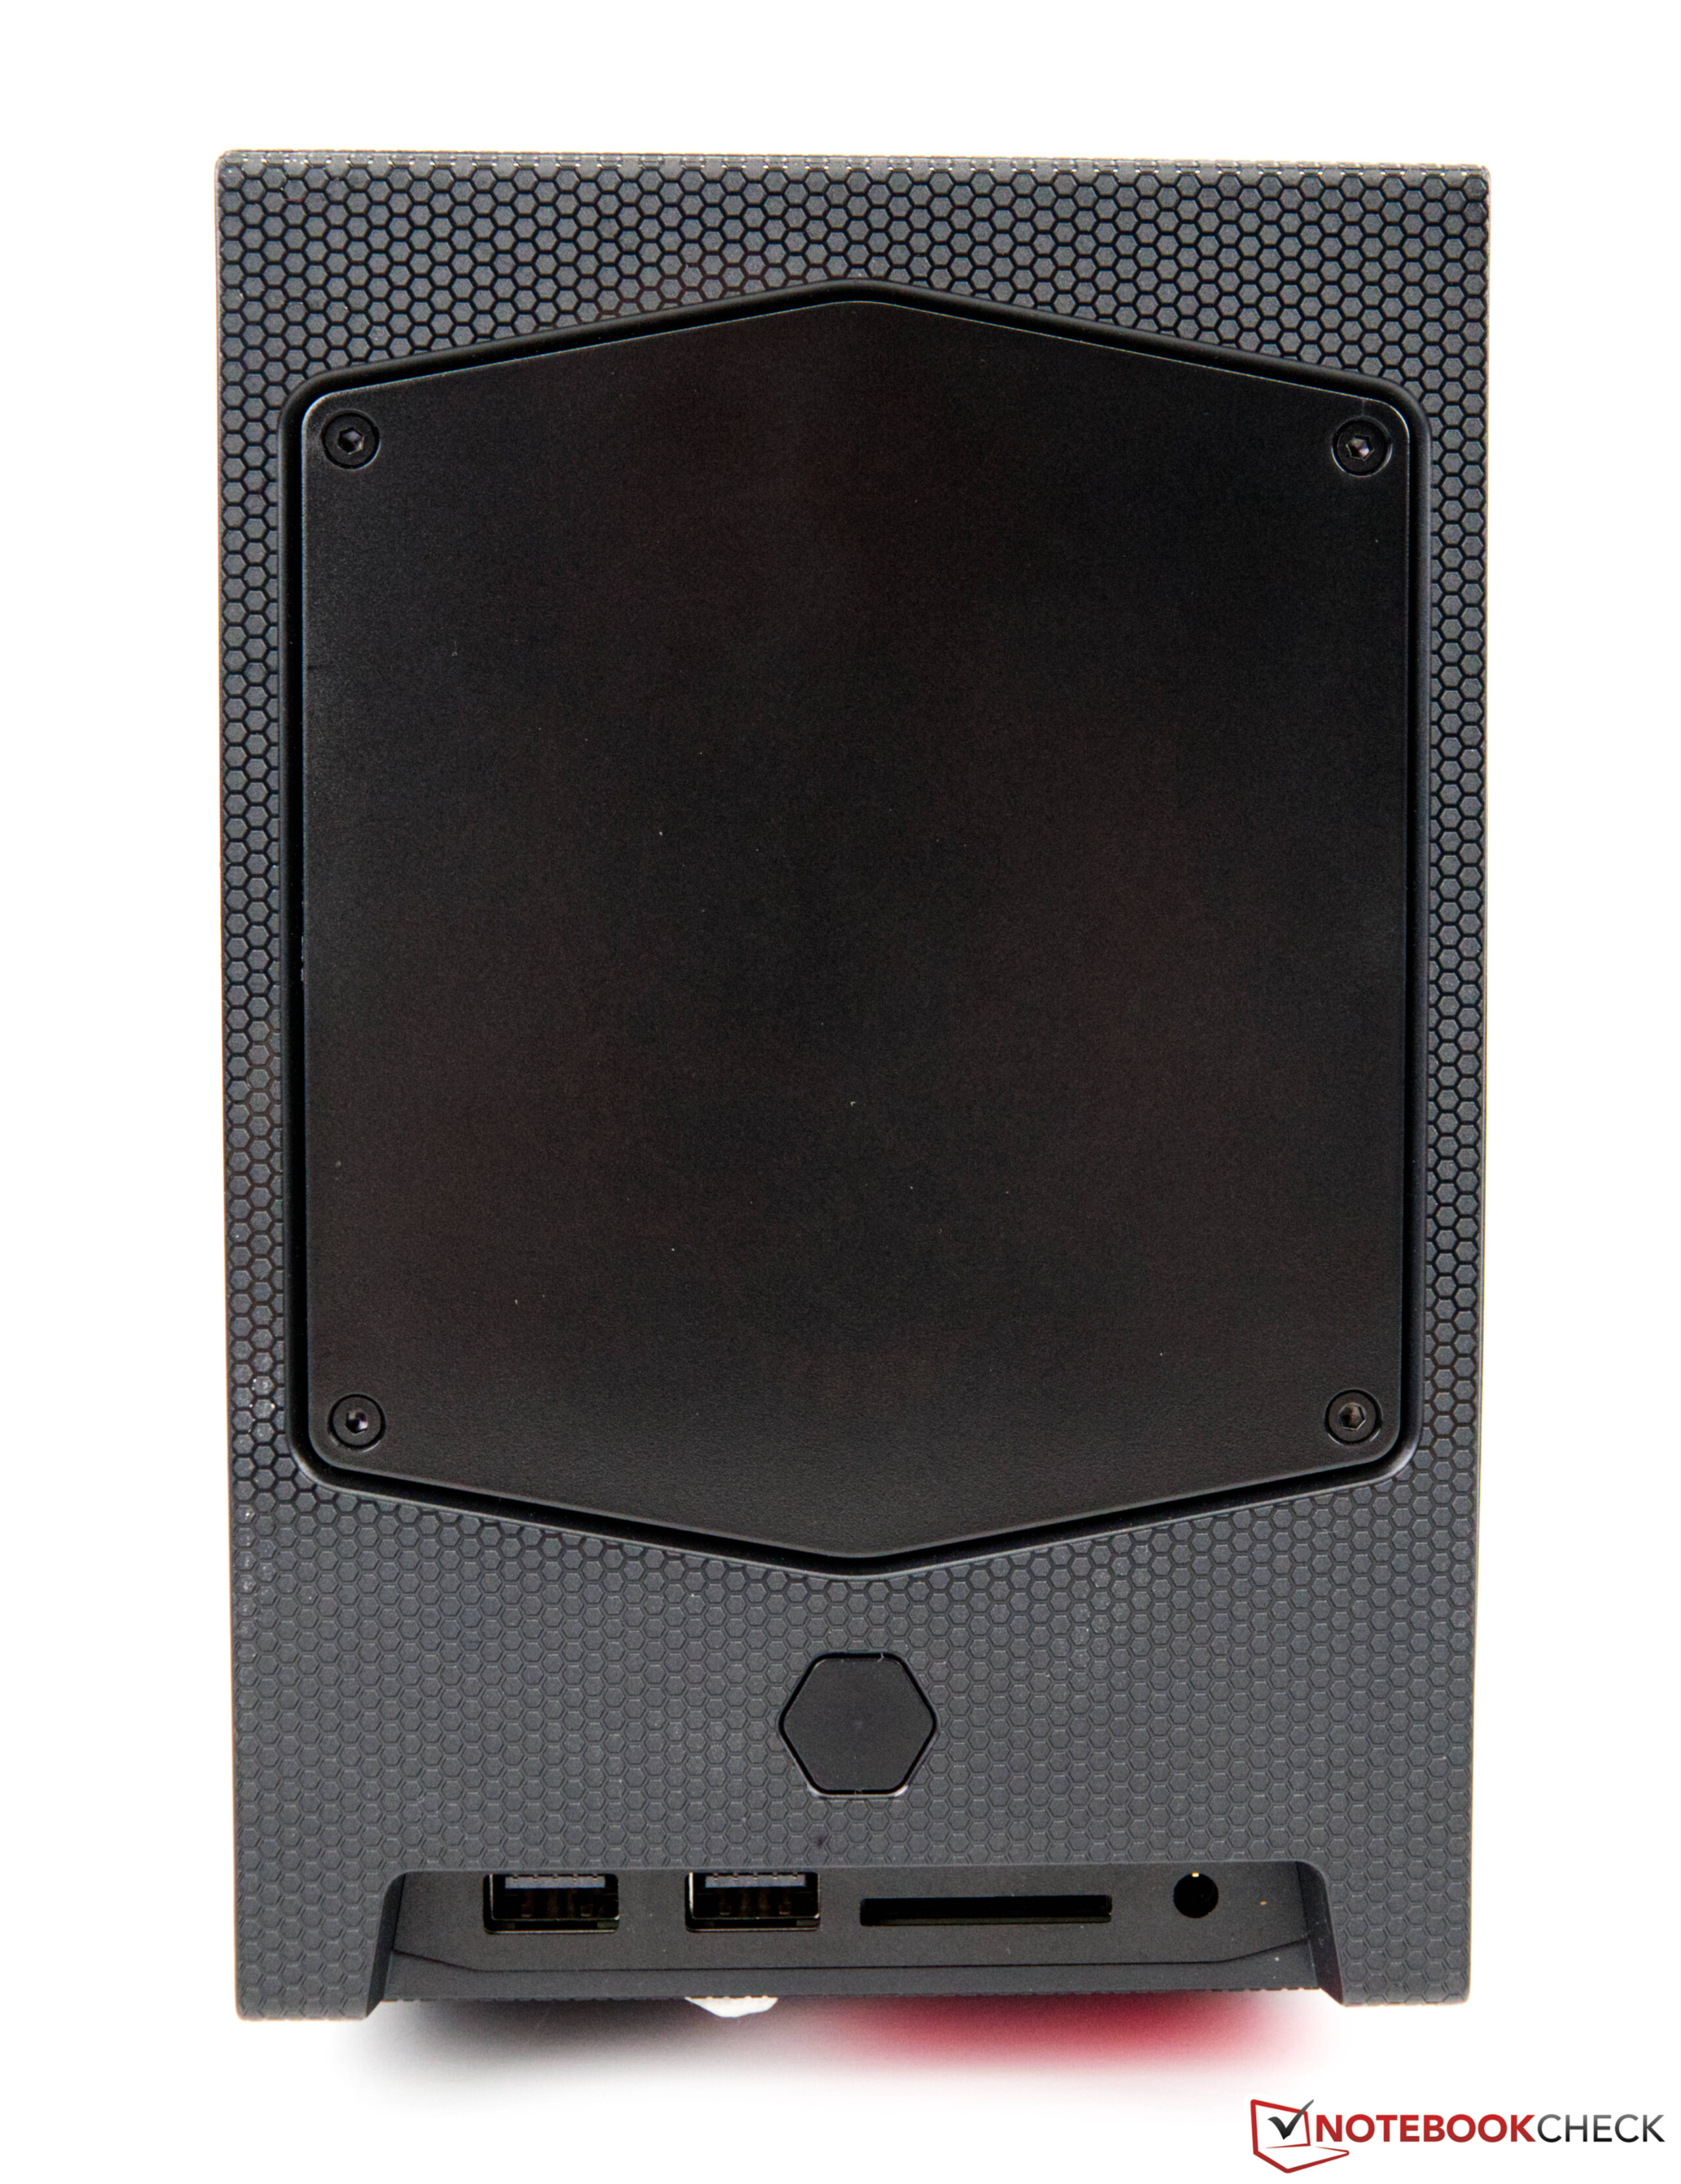
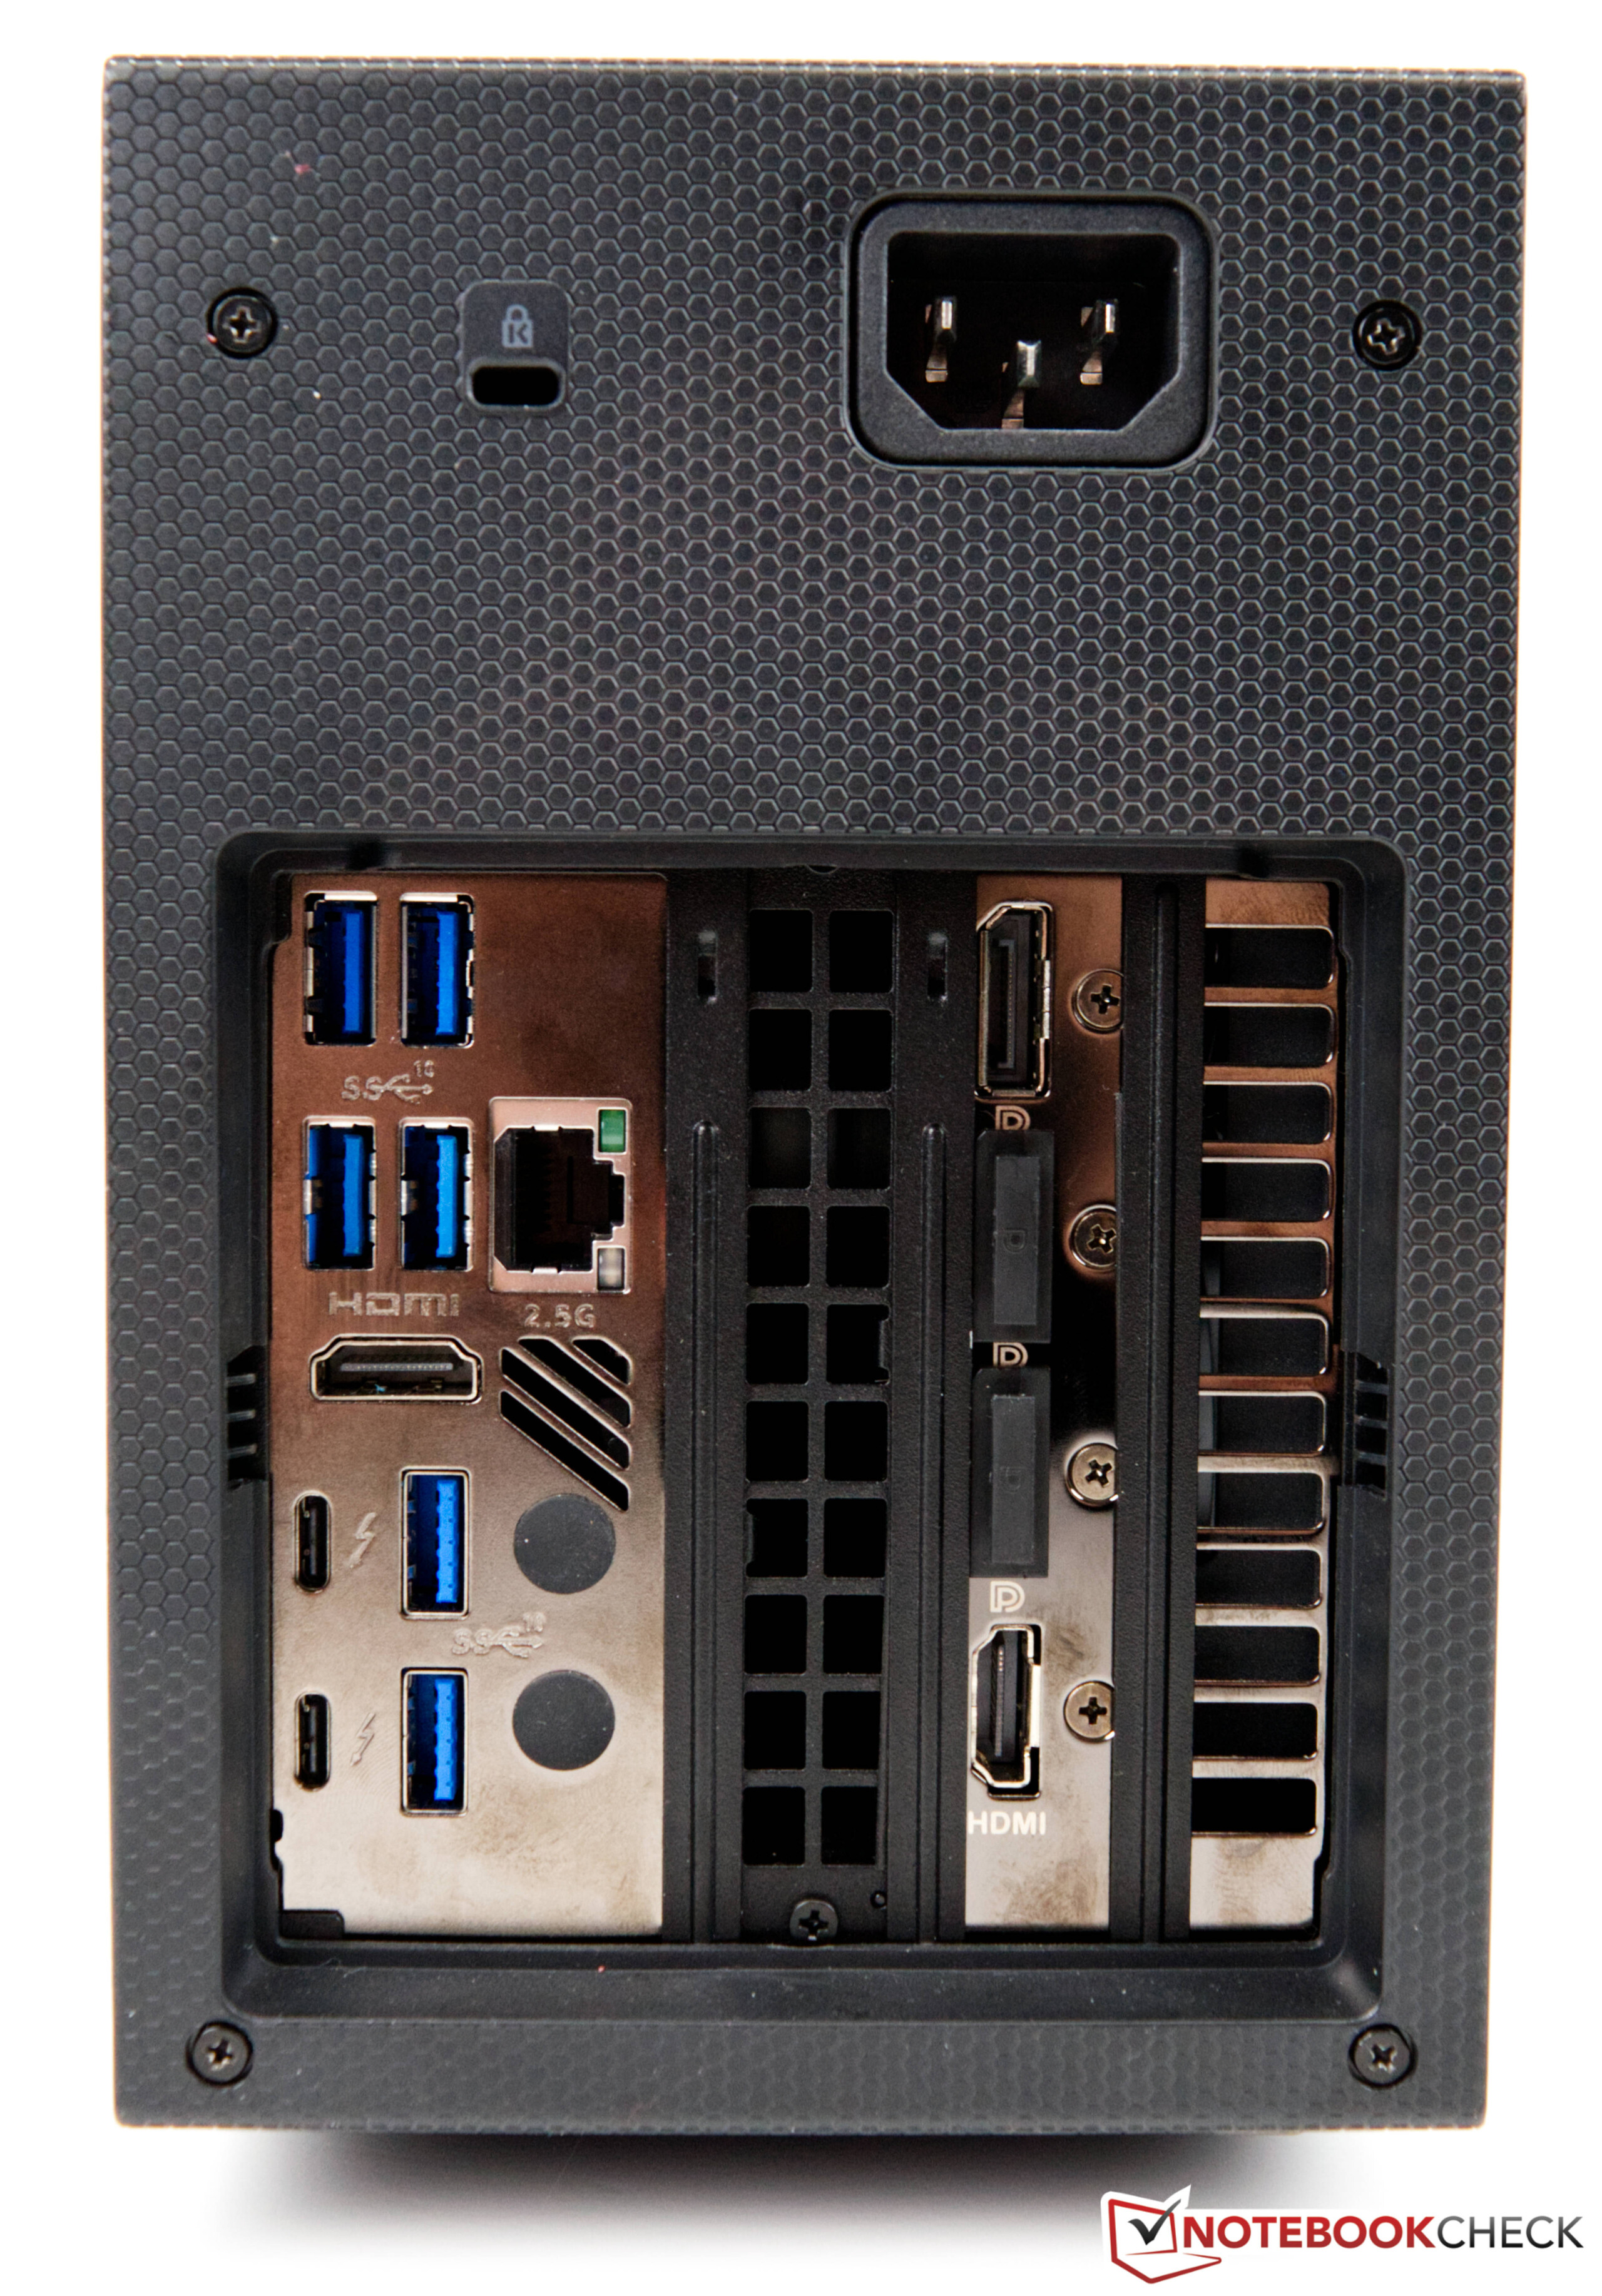
Az interfészek választéka és száma nagyon jó. A két Thunderbolt 4 porttal még a leggyorsabb és legmodernebb, jövőbiztos szabványt is megkapta. Emellett számos USB port is rendelkezésre áll a perifériák csatlakoztatásához, sőt, még egy gyors, UHS-II szabványú SD kártyaolvasó is rendelkezésre áll. Egyedül a második Ethernet port hiányát lehetne kritizálni, bár ez már magas szintű panaszkodásnak számítana.
Az Intel NUC 11 Extreme Kit - Beast Canyon alternatívája az lenne, ha saját magunk állítanánk össze egy ilyen rendszert, ami valószínűleg ugyanennyibe kerülne. A Zotac Magnus One szintén jó választás, ha nagyon kompakt gamer PC-kről van szó.
