Intel Alder Lake-S rövid értékelés: Már megint az Intel gamer CPU-ja a leggyorsabb?

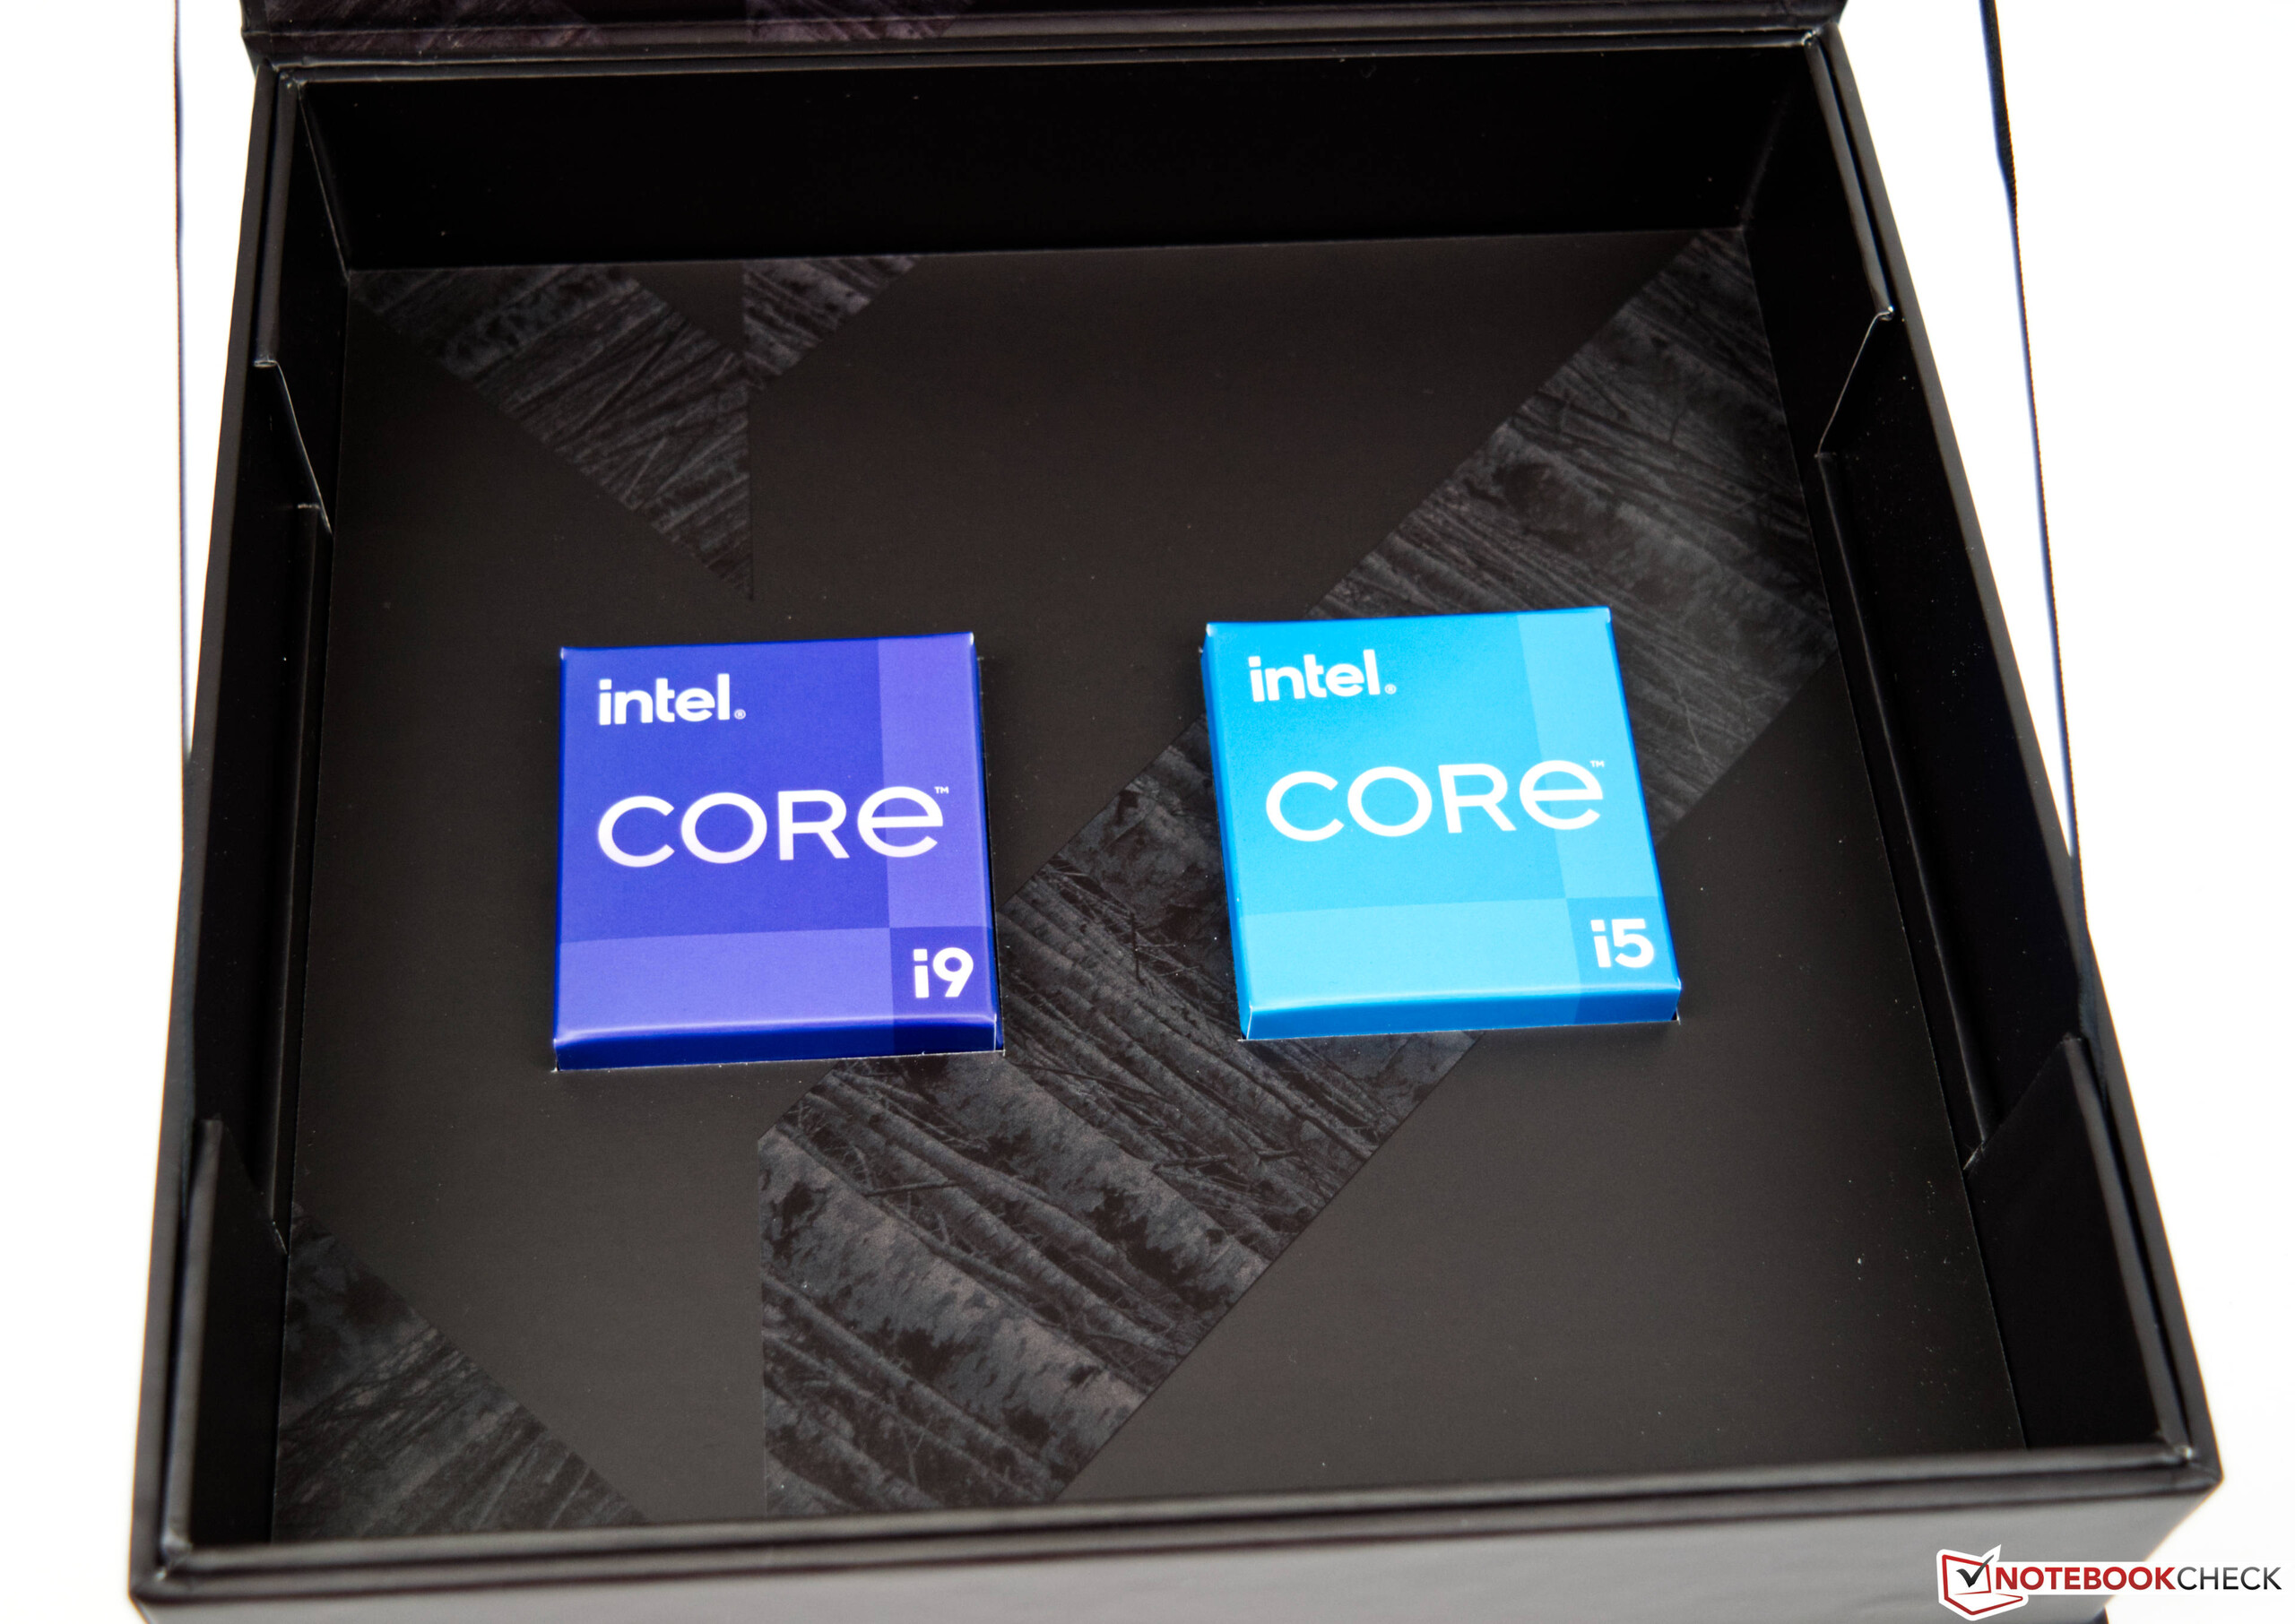
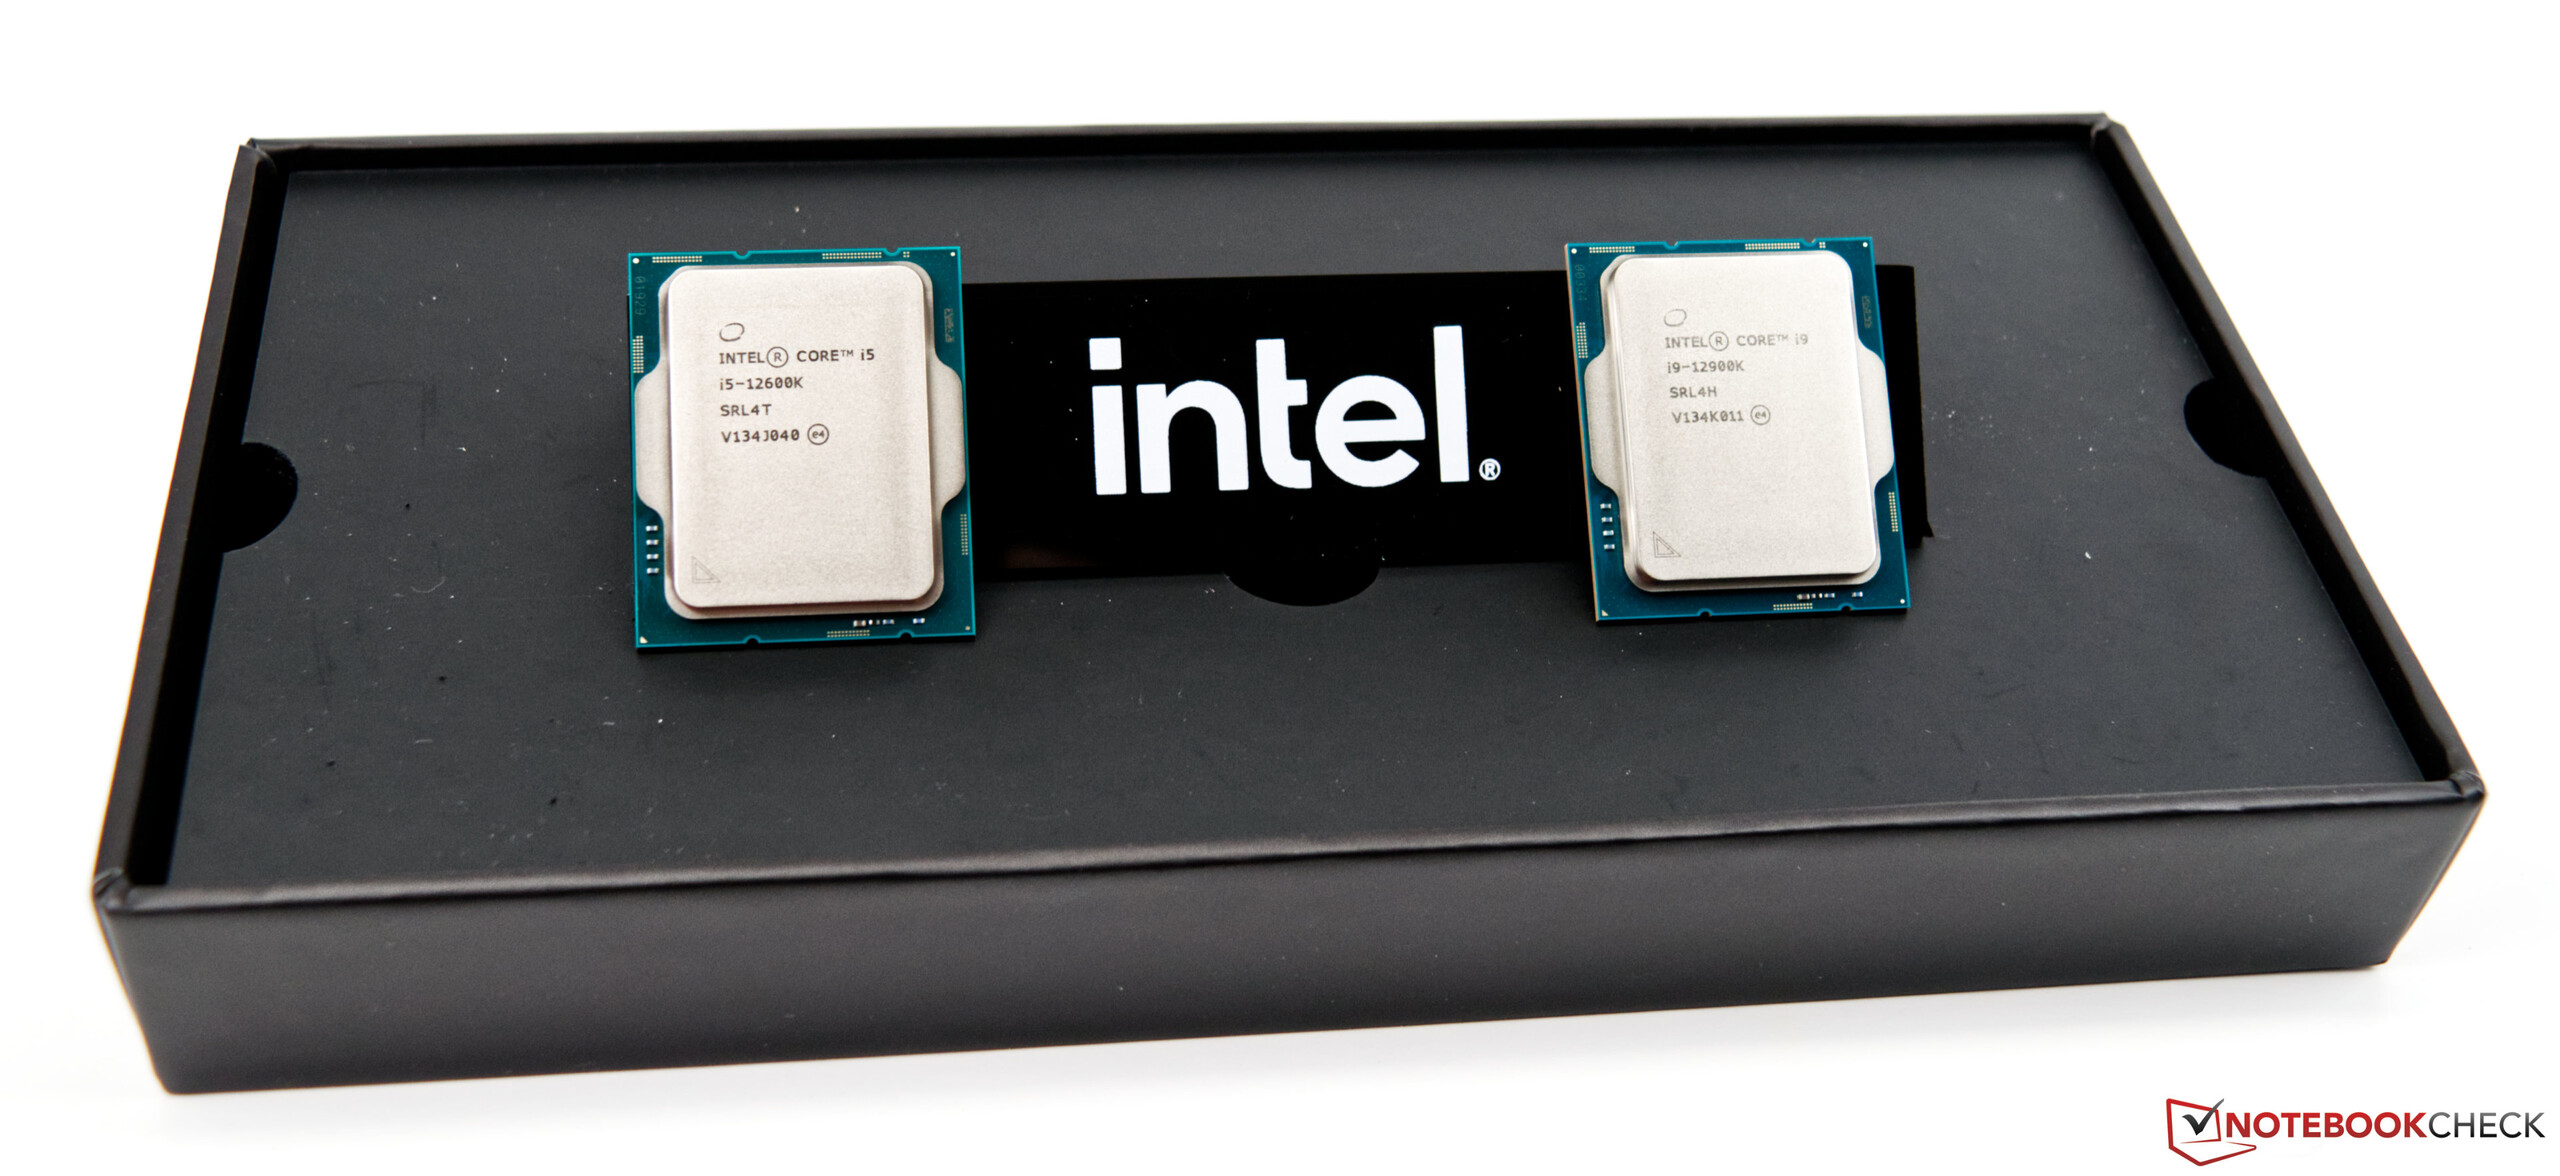
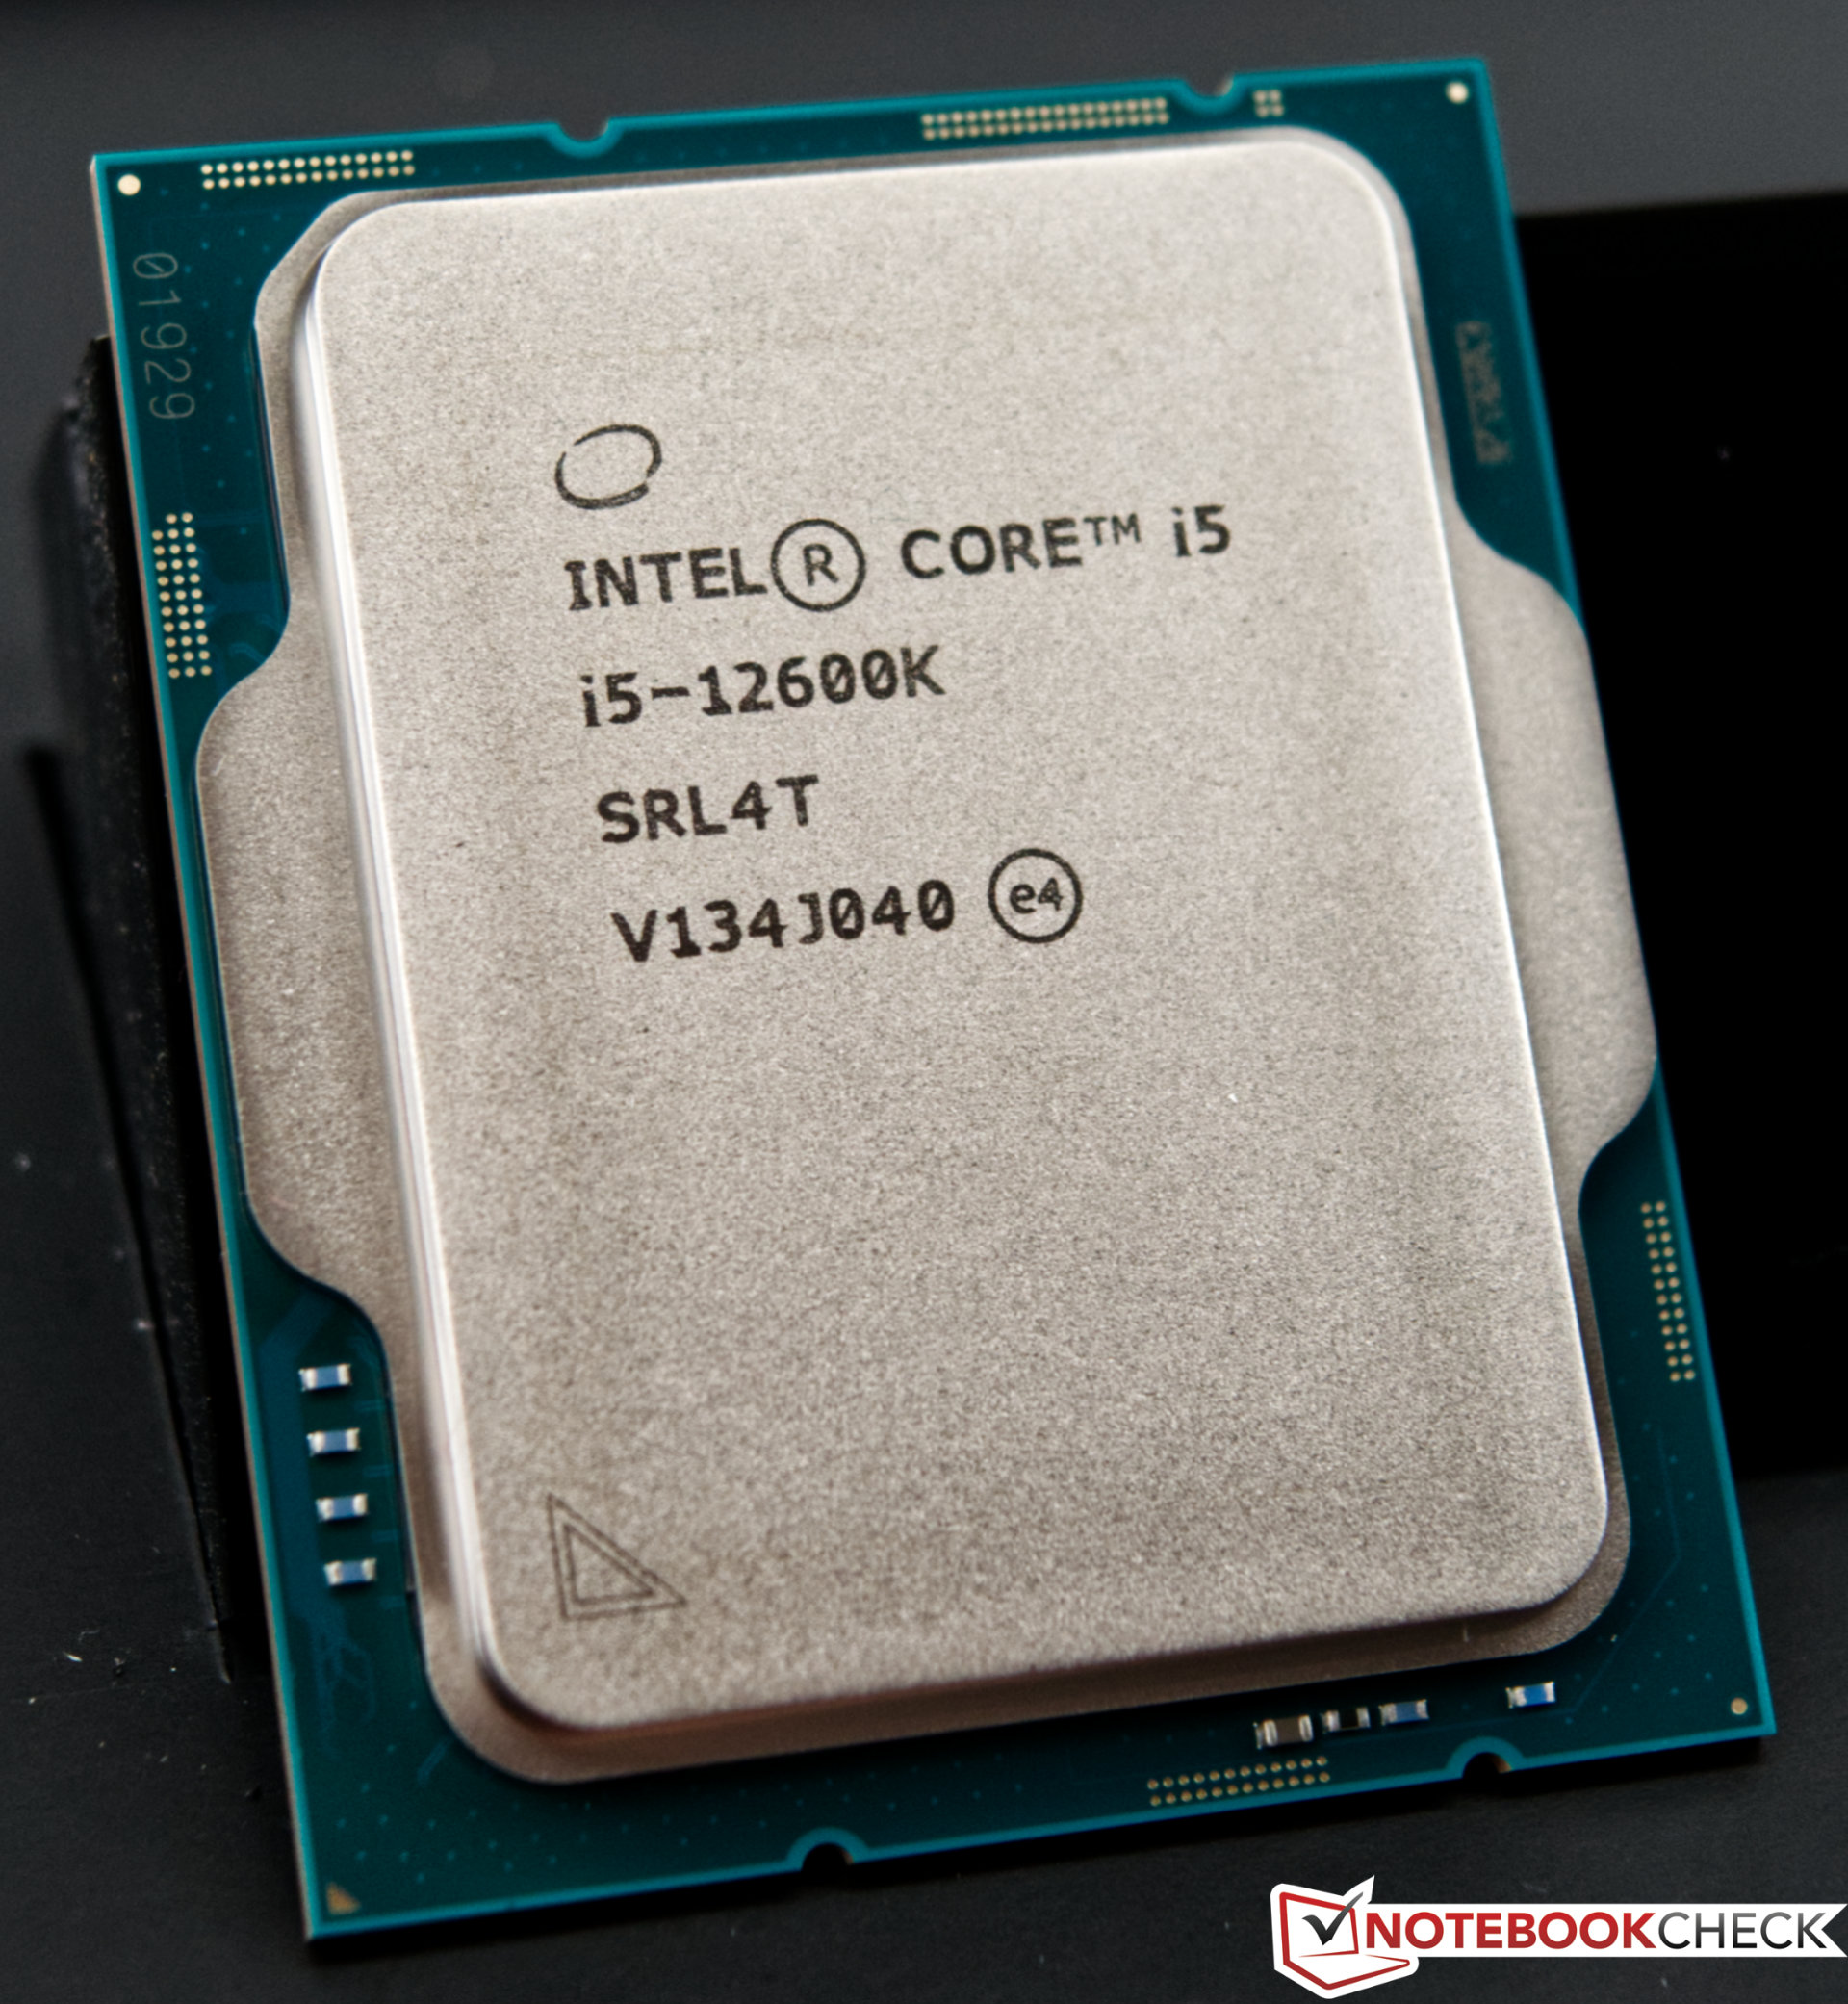

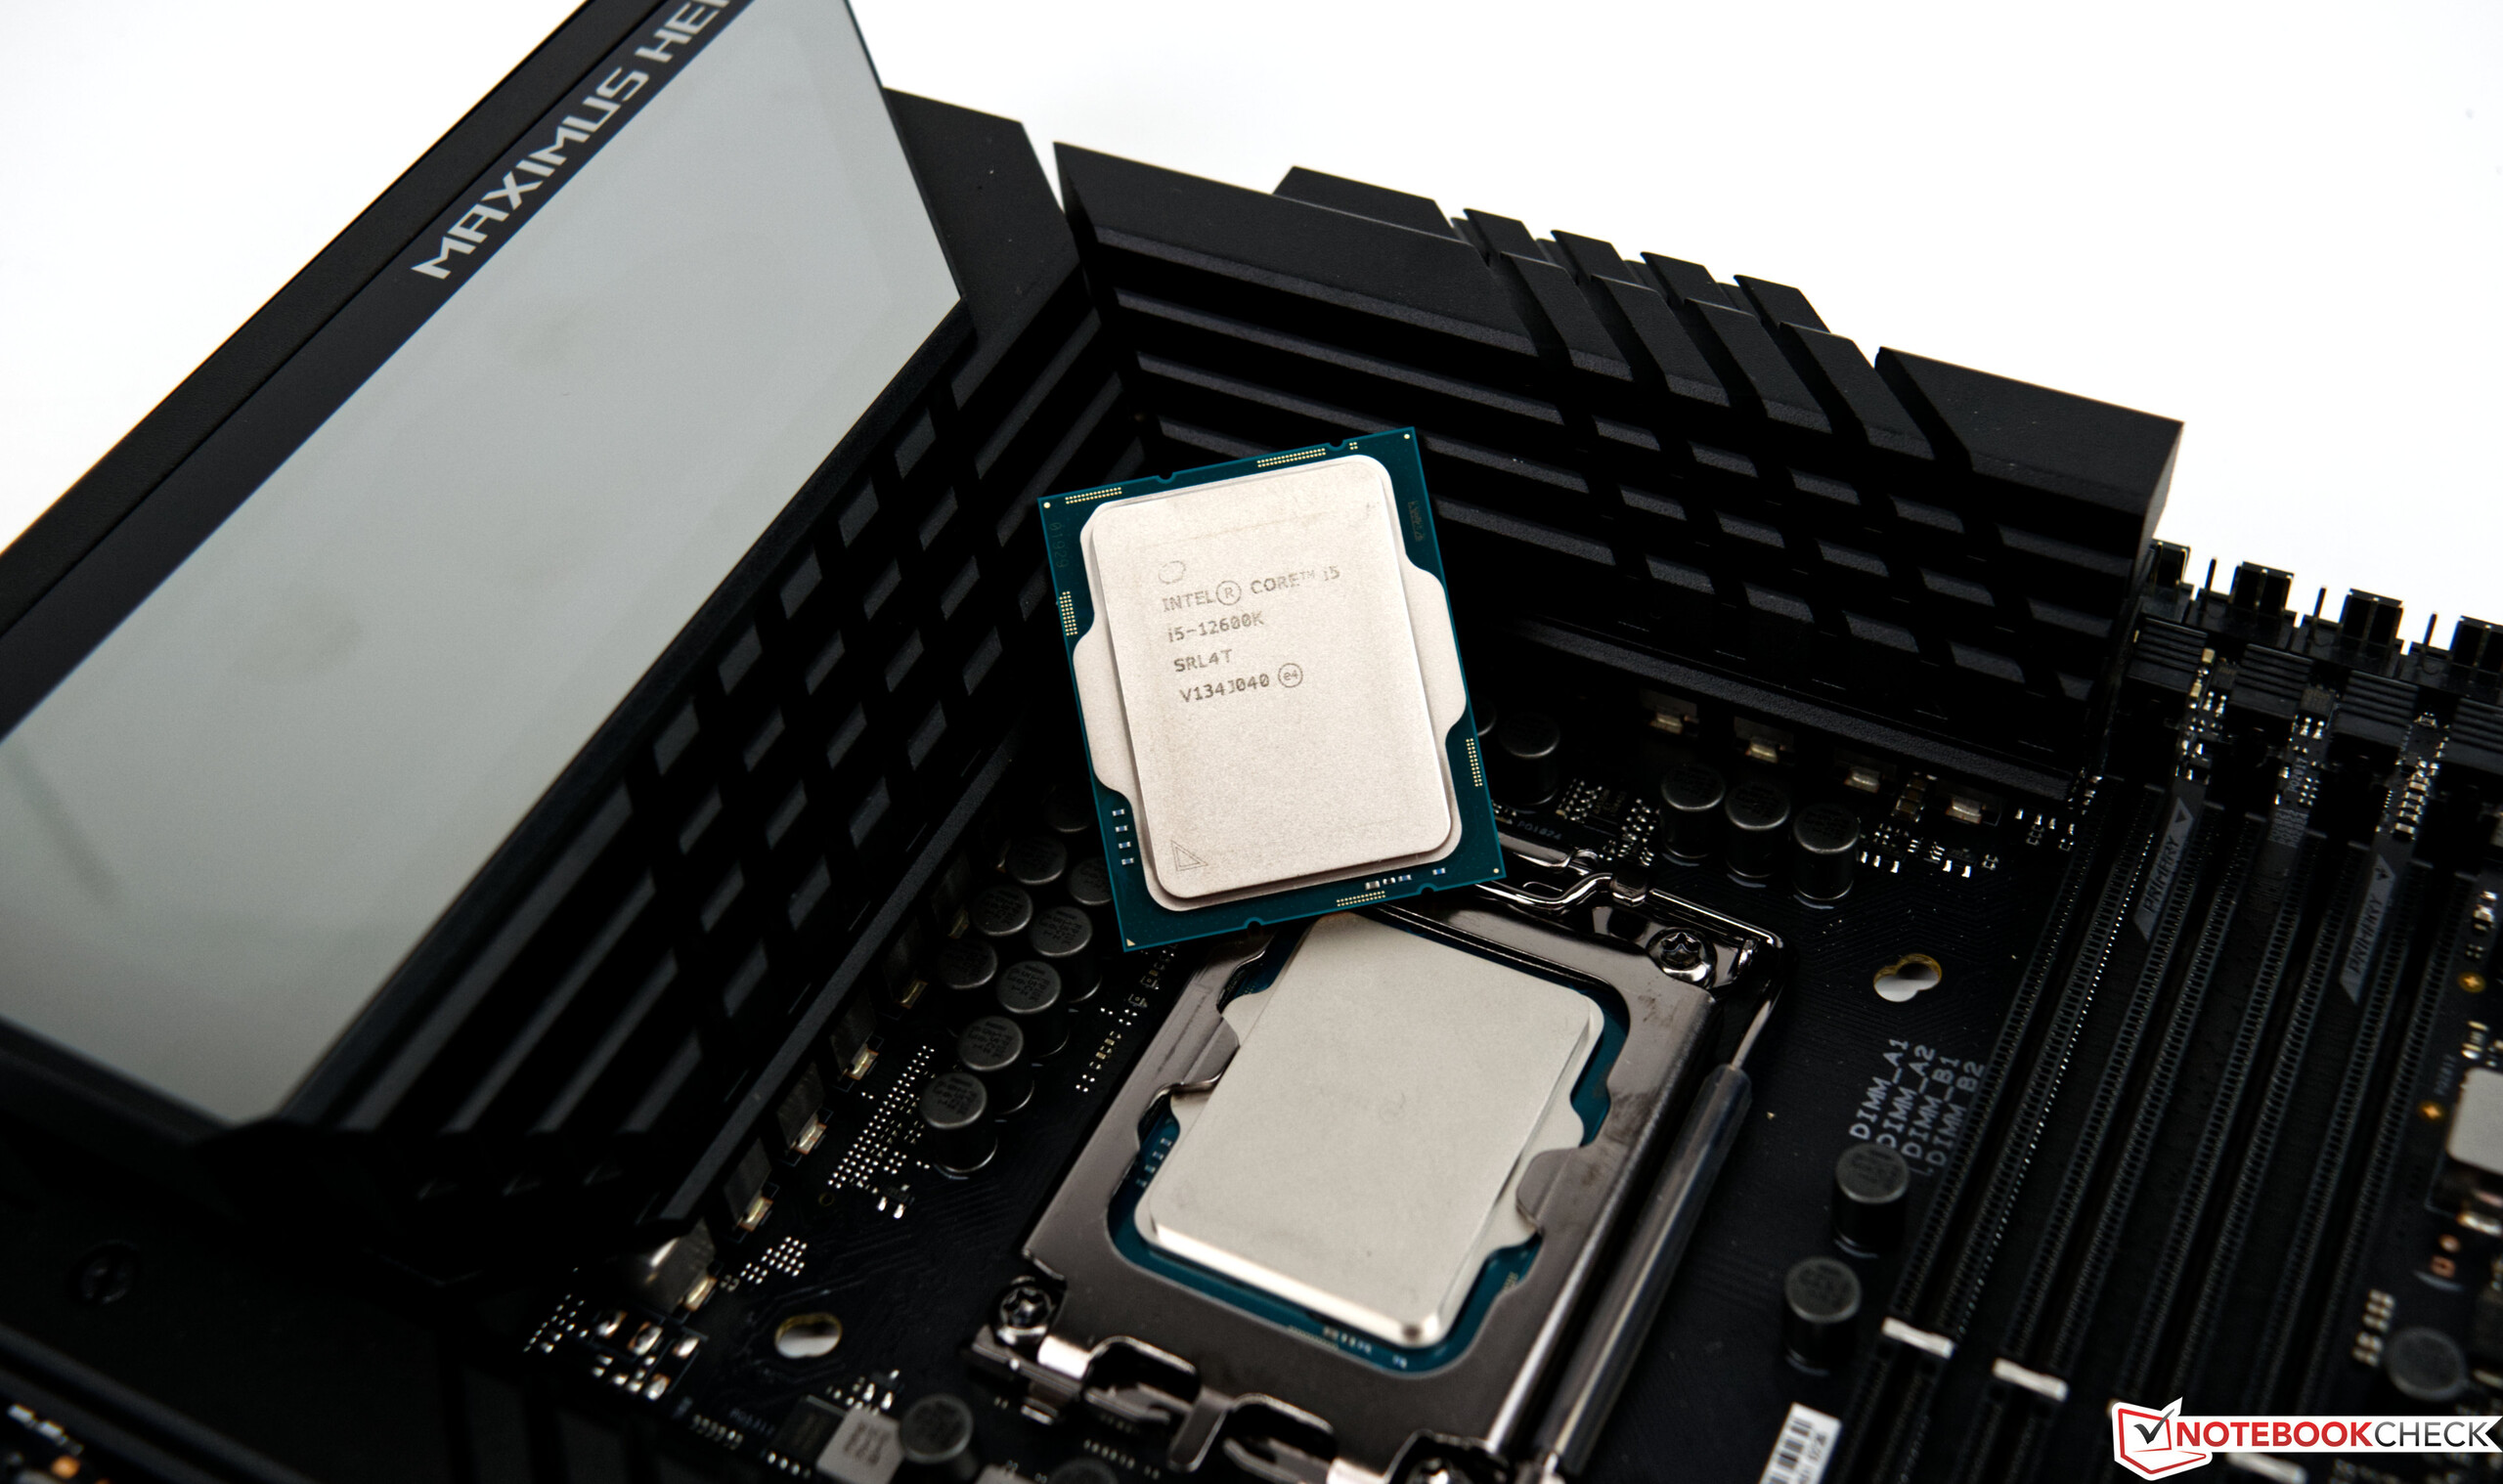
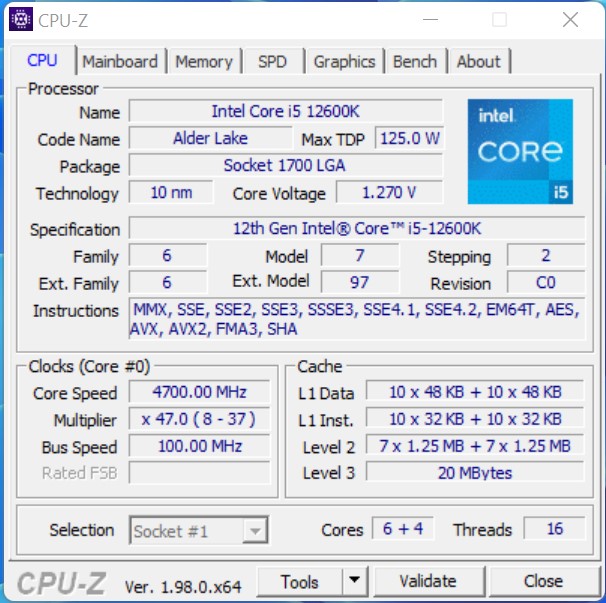
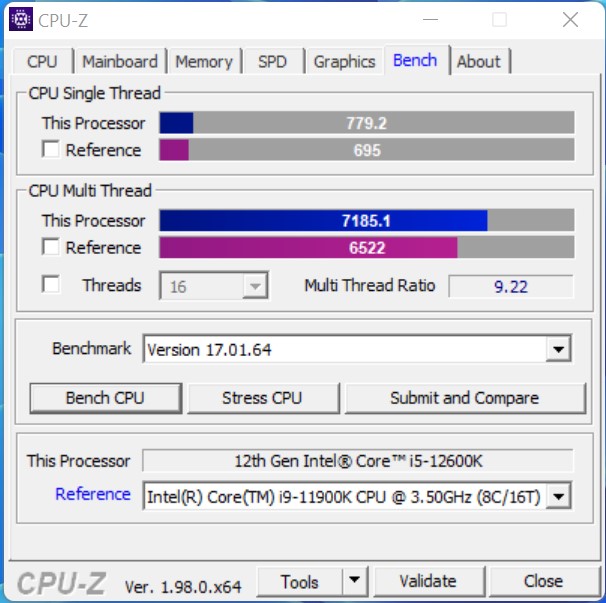
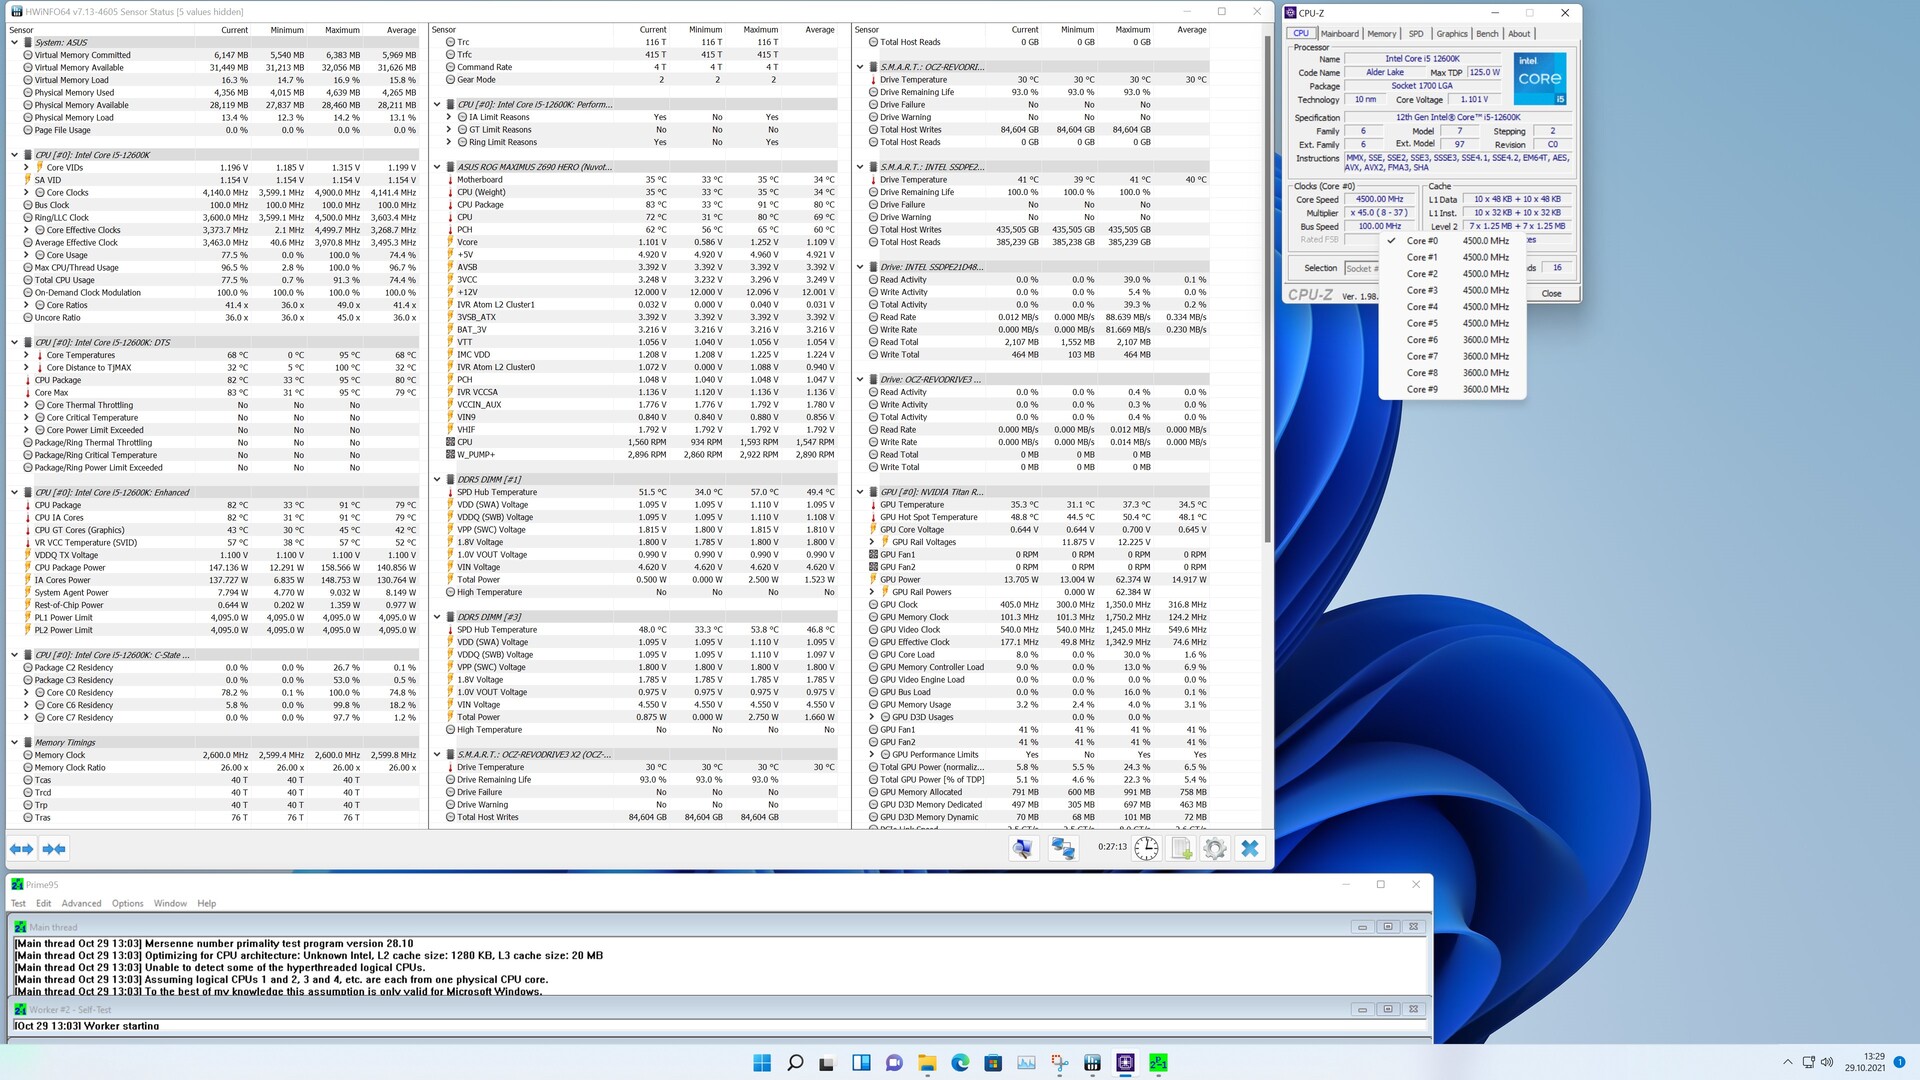
Intel Core i5-12600K


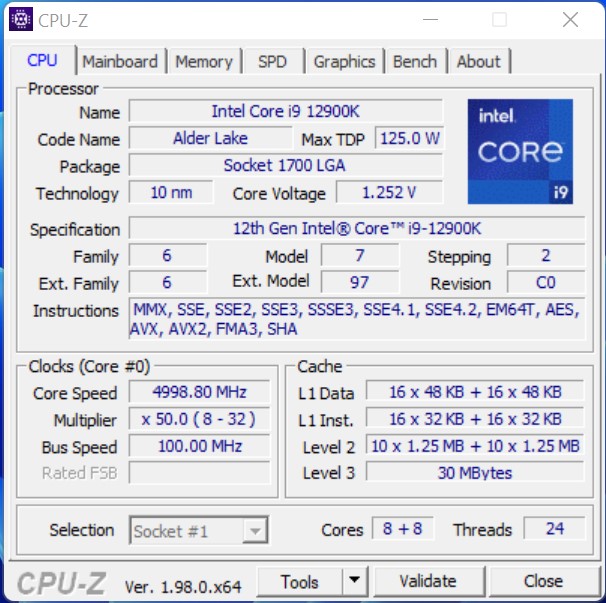
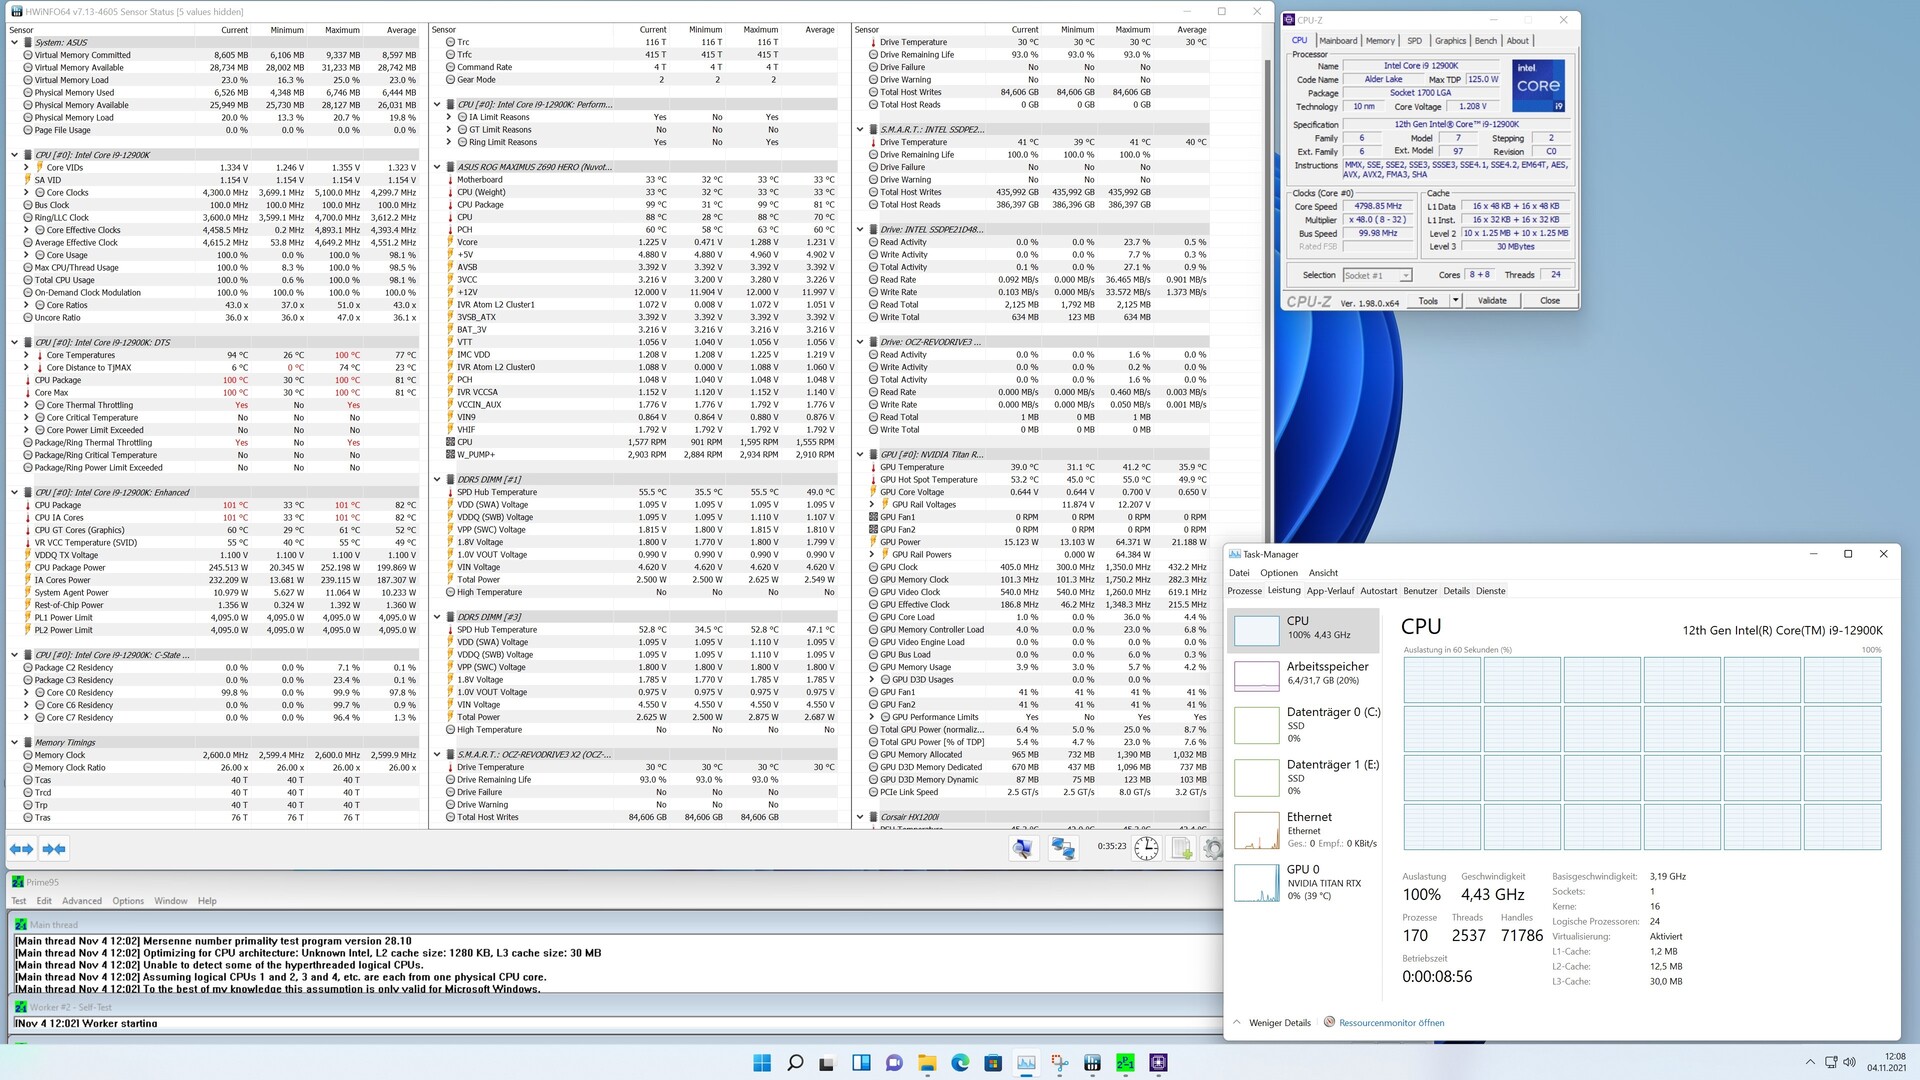
Intel Core i9-12900K

| Performance rating - Percent | |
| Intel Core i9-12900K | |
| AMD Ryzen 9 5950X | |
| Intel Core i5-12600K | |
| AMD Ryzen 9 5900X -2! | |
| AMD Ryzen 7 5800X | |
| Intel Core i9-11900K | |
| Intel Core i9-10900K | |
| AMD Ryzen 5 5600X | |
| Intel Core i5-11600K | |
| Intel Core i5-10600K | |
| Cinebench R15 | |
| CPU Single 64Bit | |
| Intel Core i9-12900K | |
| Intel Core i5-12600K | |
| AMD Ryzen 9 5950X | |
| AMD Ryzen 9 5900X | |
| AMD Ryzen 7 5800X | |
| Intel Core i9-11900K | |
| AMD Ryzen 5 5600X | |
| Intel Core i5-11600K | |
| Intel Core i9-10900K | |
| Intel Core i5-10600K | |
| CPU Multi 64Bit | |
| AMD Ryzen 9 5950X | |
| Intel Core i9-12900K | |
| AMD Ryzen 9 5900X | |
| Intel Core i9-10900K | |
| AMD Ryzen 7 5800X | |
| Intel Core i5-12600K | |
| Intel Core i9-11900K | |
| AMD Ryzen 5 5600X | |
| Intel Core i5-11600K | |
| Intel Core i5-10600K | |
| Cinebench R20 | |
| CPU (Single Core) | |
| Intel Core i9-12900K | |
| Intel Core i5-12600K | |
| Intel Core i9-11900K | |
| AMD Ryzen 9 5950X | |
| AMD Ryzen 9 5900X | |
| AMD Ryzen 7 5800X | |
| AMD Ryzen 5 5600X | |
| Intel Core i5-11600K | |
| Intel Core i9-10900K | |
| Intel Core i5-10600K | |
| CPU (Multi Core) | |
| AMD Ryzen 9 5950X | |
| Intel Core i9-12900K | |
| AMD Ryzen 9 5900X | |
| Intel Core i5-12600K | |
| Intel Core i9-10900K | |
| AMD Ryzen 7 5800X | |
| Intel Core i9-11900K | |
| AMD Ryzen 5 5600X | |
| Intel Core i5-11600K | |
| Intel Core i5-10600K | |
| Cinebench R23 | |
| Single Core | |
| Intel Core i9-12900K | |
| Intel Core i5-12600K | |
| Intel Core i9-11900K | |
| AMD Ryzen 9 5950X | |
| AMD Ryzen 9 5900X | |
| Intel Core i5-11600K | |
| AMD Ryzen 7 5800X | |
| AMD Ryzen 5 5600X | |
| Intel Core i5-10600K | |
| Intel Core i9-10900K | |
| Multi Core | |
| AMD Ryzen 9 5950X | |
| Intel Core i9-12900K | |
| AMD Ryzen 9 5900X | |
| Intel Core i5-12600K | |
| Intel Core i9-10900K | |
| Intel Core i9-11900K | |
| AMD Ryzen 7 5800X | |
| AMD Ryzen 5 5600X | |
| Intel Core i5-11600K | |
| Intel Core i5-10600K | |
| Cinebench R11.5 | |
| CPU Single 64Bit | |
| Intel Core i9-12900K | |
| Intel Core i5-12600K | |
| AMD Ryzen 9 5900X | |
| AMD Ryzen 9 5950X | |
| Intel Core i9-11900K | |
| AMD Ryzen 7 5800X | |
| AMD Ryzen 5 5600X | |
| Intel Core i5-11600K | |
| Intel Core i9-10900K | |
| Intel Core i5-10600K | |
| CPU Multi 64Bit | |
| AMD Ryzen 9 5950X | |
| Intel Core i9-12900K | |
| AMD Ryzen 9 5900X | |
| Intel Core i5-12600K | |
| AMD Ryzen 7 5800X | |
| Intel Core i9-10900K | |
| Intel Core i9-11900K | |
| AMD Ryzen 5 5600X | |
| Intel Core i5-11600K | |
| Intel Core i5-10600K | |
| Cinebench R10 | |
| Rendering Single CPUs 64Bit | |
| Intel Core i9-12900K | |
| Intel Core i5-12600K | |
| Intel Core i9-11900K | |
| AMD Ryzen 9 5950X | |
| AMD Ryzen 7 5800X | |
| Intel Core i5-11600K | |
| AMD Ryzen 9 5900X | |
| AMD Ryzen 5 5600X | |
| Intel Core i9-10900K | |
| Intel Core i5-10600K | |
| Rendering Multiple CPUs 64Bit | |
| Intel Core i9-12900K | |
| AMD Ryzen 9 5950X | |
| AMD Ryzen 9 5900X | |
| Intel Core i5-12600K | |
| AMD Ryzen 7 5800X | |
| Intel Core i9-11900K | |
| Intel Core i9-10900K | |
| AMD Ryzen 5 5600X | |
| Intel Core i5-11600K | |
| Intel Core i5-10600K | |
| Blender - v2.79 BMW27 CPU | |
| Intel Core i5-10600K | |
| Intel Core i5-11600K | |
| AMD Ryzen 5 5600X | |
| AMD Ryzen 7 5800X | |
| Intel Core i9-11900K | |
| Intel Core i5-12600K | |
| Intel Core i9-10900K | |
| AMD Ryzen 9 5900X | |
| Intel Core i9-12900K | |
| AMD Ryzen 9 5950X | |
| wPrime 2.10 | |
| 32m | |
| Intel Core i9-12900K | |
| Intel Core i5-11600K | |
| Intel Core i5-12600K | |
| Intel Core i5-10600K | |
| Intel Core i9-11900K | |
| AMD Ryzen 5 5600X | |
| Intel Core i9-10900K | |
| AMD Ryzen 7 5800X | |
| AMD Ryzen 9 5950X | |
| 1024m | |
| Intel Core i5-12600K | |
| Intel Core i9-12900K | |
| AMD Ryzen 5 5600X | |
| Intel Core i5-10600K | |
| Intel Core i5-11600K | |
| AMD Ryzen 7 5800X | |
| Intel Core i9-11900K | |
| Intel Core i9-10900K | |
| AMD Ryzen 9 5950X | |
| X264 HD Benchmark 4.0 | |
| Pass 1 | |
| Intel Core i9-12900K | |
| AMD Ryzen 7 5800X | |
| AMD Ryzen 9 5950X | |
| AMD Ryzen 9 5900X | |
| Intel Core i5-12600K | |
| AMD Ryzen 5 5600X | |
| Intel Core i9-11900K | |
| Intel Core i5-11600K | |
| Intel Core i9-10900K | |
| Intel Core i5-10600K | |
| Pass 2 | |
| AMD Ryzen 9 5950X | |
| Intel Core i9-12900K | |
| AMD Ryzen 9 5900X | |
| AMD Ryzen 7 5800X | |
| Intel Core i9-10900K | |
| Intel Core i5-12600K | |
| Intel Core i9-11900K | |
| AMD Ryzen 5 5600X | |
| Intel Core i5-11600K | |
| Intel Core i5-10600K | |
| WinRAR - Result | |
| AMD Ryzen 7 5800X | |
| AMD Ryzen 9 5900X | |
| AMD Ryzen 5 5600X | |
| AMD Ryzen 9 5950X | |
| Intel Core i9-12900K | |
| Intel Core i9-10900K | |
| Intel Core i9-11900K | |
| Intel Core i5-11600K | |
| Intel Core i5-10600K | |
| Intel Core i5-12600K | |
| TrueCrypt | |
| AES Mean 100MB | |
| AMD Ryzen 9 5950X | |
| AMD Ryzen 9 5900X | |
| Intel Core i9-12900K | |
| AMD Ryzen 7 5800X | |
| Intel Core i9-10900K | |
| Intel Core i9-11900K | |
| Intel Core i5-12600K | |
| AMD Ryzen 5 5600X | |
| Intel Core i5-11600K | |
| Intel Core i5-10600K | |
| Twofish Mean 100MB | |
| AMD Ryzen 9 5950X | |
| Intel Core i9-12900K | |
| AMD Ryzen 9 5900X | |
| Intel Core i9-10900K | |
| Intel Core i5-12600K | |
| AMD Ryzen 7 5800X | |
| Intel Core i9-11900K | |
| AMD Ryzen 5 5600X | |
| Intel Core i5-11600K | |
| Intel Core i5-10600K | |
| Serpent Mean 100MB | |
| AMD Ryzen 9 5950X | |
| Intel Core i9-12900K | |
| AMD Ryzen 9 5900X | |
| Intel Core i9-10900K | |
| AMD Ryzen 7 5800X | |
| Intel Core i5-12600K | |
| Intel Core i9-11900K | |
| AMD Ryzen 5 5600X | |
| Intel Core i5-11600K | |
| Intel Core i5-10600K | |
| Geekbench 5.5 | |
| Multi-Core | |
| Intel Core i9-12900K | |
| AMD Ryzen 9 5950X | |
| AMD Ryzen 9 5900X | |
| Intel Core i5-12600K | |
| Intel Core i9-10900K | |
| AMD Ryzen 7 5800X | |
| Intel Core i9-11900K | |
| AMD Ryzen 5 5600X | |
| Intel Core i5-11600K | |
| Intel Core i5-10600K | |
| Single-Core | |
| Intel Core i9-12900K | |
| Intel Core i5-12600K | |
| Intel Core i9-11900K | |
| Intel Core i5-11600K | |
| AMD Ryzen 9 5950X | |
| AMD Ryzen 9 5900X | |
| AMD Ryzen 7 5800X | |
| AMD Ryzen 5 5600X | |
| Intel Core i9-10900K | |
| Intel Core i5-10600K | |
| Geekbench 5.0 | |
| 5.0 Multi-Core | |
| Intel Core i9-12900K | |
| AMD Ryzen 9 5950X | |
| AMD Ryzen 9 5900X | |
| Intel Core i5-12600K | |
| Intel Core i9-10900K | |
| AMD Ryzen 7 5800X | |
| Intel Core i9-11900K | |
| AMD Ryzen 5 5600X | |
| Intel Core i5-11600K | |
| Intel Core i5-10600K | |
| 5.0 Single-Core | |
| Intel Core i9-12900K | |
| Intel Core i9-11900K | |
| Intel Core i5-12600K | |
| Intel Core i5-11600K | |
| AMD Ryzen 9 5950X | |
| AMD Ryzen 7 5800X | |
| AMD Ryzen 9 5900X | |
| AMD Ryzen 5 5600X | |
| Intel Core i9-10900K | |
| Intel Core i5-10600K | |
| Geekbench 4.4 | |
| 64 Bit Single-Core Score | |
| Intel Core i9-12900K | |
| Intel Core i5-12600K | |
| Intel Core i9-11900K | |
| Intel Core i5-11600K | |
| AMD Ryzen 7 5800X | |
| AMD Ryzen 9 5900X | |
| AMD Ryzen 9 5950X | |
| AMD Ryzen 5 5600X | |
| Intel Core i9-10900K | |
| Intel Core i5-10600K | |
| 64 Bit Multi-Core Score | |
| Intel Core i9-12900K | |
| AMD Ryzen 9 5950X | |
| AMD Ryzen 9 5900X | |
| Intel Core i5-12600K | |
| AMD Ryzen 7 5800X | |
| Intel Core i9-10900K | |
| Intel Core i9-11900K | |
| AMD Ryzen 5 5600X | |
| Intel Core i5-11600K | |
| Intel Core i5-10600K | |
| 3DMark 11 - 1280x720 Performance Physics | |
| Intel Core i9-12900K | |
| AMD Ryzen 9 5950X | |
| Intel Core i5-12600K | |
| AMD Ryzen 9 5900X | |
| AMD Ryzen 7 5800X | |
| Intel Core i9-10900K | |
| Intel Core i9-11900K | |
| AMD Ryzen 5 5600X | |
| Intel Core i5-11600K | |
| Intel Core i5-10600K | |
| 7-Zip 18.03 | |
| 7z b 4 | |
| AMD Ryzen 9 5950X | |
| Intel Core i9-12900K | |
| AMD Ryzen 9 5900X | |
| AMD Ryzen 7 5800X | |
| Intel Core i9-10900K | |
| Intel Core i5-12600K | |
| Intel Core i9-11900K | |
| AMD Ryzen 5 5600X | |
| Intel Core i5-11600K | |
| Intel Core i5-10600K | |
| 7z b 4 -mmt1 | |
| AMD Ryzen 9 5950X | |
| AMD Ryzen 7 5800X | |
| AMD Ryzen 9 5900X | |
| Intel Core i9-11900K | |
| AMD Ryzen 5 5600X | |
| Intel Core i9-12900K | |
| Intel Core i5-11600K | |
| Intel Core i9-10900K | |
| Intel Core i5-12600K | |
| Intel Core i5-10600K | |
| HWBOT x265 Benchmark v2.2 - 4k Preset | |
| AMD Ryzen 9 5950X | |
| Intel Core i5-12600K | |
| Intel Core i9-12900K | |
| AMD Ryzen 9 5900X | |
| Intel Core i9-10900K | |
| AMD Ryzen 7 5800X | |
| Intel Core i9-11900K | |
| AMD Ryzen 5 5600X | |
| Intel Core i5-11600K | |
| Intel Core i5-10600K | |
| R Benchmark 2.5 - Overall mean | |
| Intel Core i5-10600K | |
| Intel Core i9-10900K | |
| Intel Core i5-11600K | |
| AMD Ryzen 5 5600X | |
| Intel Core i9-11900K | |
| AMD Ryzen 9 5950X | |
| AMD Ryzen 9 5900X | |
| AMD Ryzen 7 5800X | |
| Intel Core i5-12600K | |
| Intel Core i9-12900K | |
| LibreOffice - 20 Documents To PDF | |
| Intel Core i9-10900K | |
| Intel Core i9-11900K | |
| Intel Core i5-12600K | |
| AMD Ryzen 9 5900X | |
| Intel Core i5-10600K | |
| AMD Ryzen 9 5950X | |
| AMD Ryzen 5 5600X | |
| AMD Ryzen 7 5800X | |
| Intel Core i9-12900K | |
| Intel Core i5-11600K | |
| WebXPRT 3 - Overall | |
| Intel Core i9-12900K | |
| AMD Ryzen 7 5800X | |
| Intel Core i5-12600K | |
| AMD Ryzen 9 5950X | |
| AMD Ryzen 5 5600X | |
| AMD Ryzen 9 5900X | |
| Intel Core i5-11600K | |
| Intel Core i9-10900K | |
| Intel Core i5-10600K | |
| Intel Core i9-11900K | |
| Mozilla Kraken 1.1 - Total | |
| Intel Core i5-10600K | |
| Intel Core i9-10900K | |
| Intel Core i5-11600K | |
| AMD Ryzen 5 5600X | |
| AMD Ryzen 9 5900X | |
| AMD Ryzen 7 5800X | |
| AMD Ryzen 9 5950X | |
| Intel Core i9-11900K | |
| Intel Core i5-12600K | |
| Intel Core i9-12900K | |
| 3DMark | |
| 3840x2160 Fire Strike Ultra Physics | |
| Intel Core i9-12900K | |
| AMD Ryzen 9 5950X | |
| AMD Ryzen 9 5900X | |
| AMD Ryzen 7 5800X | |
| Intel Core i5-12600K | |
| Intel Core i9-10900K | |
| Intel Core i9-11900K | |
| AMD Ryzen 5 5600X | |
| Intel Core i5-11600K | |
| Intel Core i5-10600K | |
| 1920x1080 Fire Strike Physics | |
| AMD Ryzen 9 5950X | |
| Intel Core i9-12900K | |
| AMD Ryzen 9 5900X | |
| AMD Ryzen 7 5800X | |
| Intel Core i9-10900K | |
| Intel Core i5-12600K | |
| Intel Core i9-11900K | |
| AMD Ryzen 5 5600X | |
| Intel Core i5-11600K | |
| Intel Core i5-10600K | |
| 2560x1440 Time Spy CPU | |
| Intel Core i9-12900K | |
| Intel Core i9-10900K | |
| Intel Core i5-12600K | |
| AMD Ryzen 9 5950X | |
| Intel Core i9-11900K | |
| AMD Ryzen 9 5900X | |
| AMD Ryzen 7 5800X | |
| Intel Core i5-11600K | |
| AMD Ryzen 5 5600X | |
| Intel Core i5-10600K | |
* ... a kisebb jobb
| Performance rating - Percent | |
| Intel Core i9-12900K | |
| Intel Core i5-12600K | |
| AMD Ryzen 7 5800X | |
| AMD Ryzen 9 5950X | |
| AMD Ryzen 5 5600X | |
| AMD Ryzen 9 5900X | |
| Intel Core i9-11900K | |
| Intel Core i9-10900K | |
| Intel Core i5-11600K | |
| Intel Core i7-10700K | |
| Intel Core i5-10600K | |
| 3DMark | |
| 1920x1080 Fire Strike Physics | |
| AMD Ryzen 9 5950X | |
| Intel Core i9-12900K | |
| AMD Ryzen 9 5900X | |
| AMD Ryzen 7 5800X | |
| Intel Core i9-10900K | |
| Intel Core i5-12600K | |
| Intel Core i9-11900K | |
| AMD Ryzen 5 5600X | |
| Intel Core i7-10700K | |
| Intel Core i5-11600K | |
| Intel Core i5-10600K | |
| 1920x1080 Fire Strike Graphics | |
| Intel Core i5-12600K | |
| Intel Core i9-12900K | |
| Intel Core i7-10700K | |
| Intel Core i5-11600K | |
| AMD Ryzen 7 5800X | |
| Intel Core i9-10900K | |
| Intel Core i9-11900K | |
| AMD Ryzen 9 5950X | |
| AMD Ryzen 5 5600X | |
| Intel Core i5-10600K | |
| AMD Ryzen 9 5900X | |
| Fire Strike Extreme Graphics | |
| Intel Core i5-12600K | |
| Intel Core i9-12900K | |
| Intel Core i5-11600K | |
| AMD Ryzen 5 5600X | |
| Intel Core i7-10700K | |
| Intel Core i9-11900K | |
| AMD Ryzen 9 5950X | |
| AMD Ryzen 7 5800X | |
| Intel Core i9-10900K | |
| AMD Ryzen 9 5900X | |
| Intel Core i5-10600K | |
| 3840x2160 Fire Strike Ultra Graphics | |
| Intel Core i5-12600K | |
| Intel Core i9-12900K | |
| Intel Core i5-11600K | |
| Intel Core i9-11900K | |
| AMD Ryzen 7 5800X | |
| AMD Ryzen 5 5600X | |
| Intel Core i7-10700K | |
| AMD Ryzen 9 5950X | |
| Intel Core i9-10900K | |
| AMD Ryzen 9 5900X | |
| Intel Core i5-10600K | |
| 3DMark 11 | |
| 1280x720 Performance GPU | |
| Intel Core i7-10700K | |
| Intel Core i5-12600K | |
| Intel Core i9-10900K | |
| AMD Ryzen 9 5950X | |
| AMD Ryzen 7 5800X | |
| Intel Core i9-12900K | |
| AMD Ryzen 5 5600X | |
| Intel Core i9-11900K | |
| Intel Core i5-10600K | |
| Intel Core i5-11600K | |
| AMD Ryzen 9 5900X | |
| 1280x720 Performance Physics | |
| Intel Core i9-12900K | |
| AMD Ryzen 9 5950X | |
| Intel Core i5-12600K | |
| AMD Ryzen 9 5900X | |
| AMD Ryzen 7 5800X | |
| Intel Core i9-10900K | |
| Intel Core i9-11900K | |
| AMD Ryzen 5 5600X | |
| Intel Core i7-10700K | |
| Intel Core i5-11600K | |
| Intel Core i5-10600K | |
| PCMark 10 - Score | |
| AMD Ryzen 9 5950X | |
| Intel Core i9-12900K | |
| AMD Ryzen 9 5900X | |
| AMD Ryzen 5 5600X | |
| Intel Core i5-12600K | |
| AMD Ryzen 7 5800X | |
| Intel Core i9-11900K | |
| Intel Core i5-11600K | |
| Intel Core i9-10900K | |
| Intel Core i7-10700K | |
| Intel Core i5-10600K | |
| SPECviewperf 12 | |
| 1900x1060 Solidworks (sw-03) | |
| AMD Ryzen 7 5800X | |
| AMD Ryzen 9 5950X | |
| AMD Ryzen 5 5600X | |
| Intel Core i9-11900K | |
| AMD Ryzen 9 5900X | |
| Intel Core i9-12900K | |
| Intel Core i9-10900K | |
| Intel Core i5-11600K | |
| Intel Core i7-10700K | |
| Intel Core i5-12600K | |
| Intel Core i5-10600K | |
| 1900x1060 Siemens NX (snx-02) | |
| Intel Core i9-12900K | |
| Intel Core i5-12600K | |
| Intel Core i7-10700K | |
| AMD Ryzen 9 5900X | |
| AMD Ryzen 7 5800X | |
| AMD Ryzen 5 5600X | |
| AMD Ryzen 9 5950X | |
| Intel Core i9-10900K | |
| Intel Core i5-10600K | |
| Intel Core i5-11600K | |
| Intel Core i9-11900K | |
| 1900x1060 Showcase (showcase-01) | |
| Intel Core i9-11900K | |
| Intel Core i5-11600K | |
| Intel Core i9-12900K | |
| Intel Core i5-12600K | |
| Intel Core i5-10600K | |
| Intel Core i7-10700K | |
| Intel Core i9-10900K | |
| AMD Ryzen 5 5600X | |
| AMD Ryzen 9 5900X | |
| AMD Ryzen 9 5950X | |
| AMD Ryzen 7 5800X | |
| 1900x1060 Medical (medical-01) | |
| Intel Core i9-12900K | |
| Intel Core i5-12600K | |
| Intel Core i5-10600K | |
| Intel Core i9-10900K | |
| Intel Core i7-10700K | |
| AMD Ryzen 9 5900X | |
| Intel Core i5-11600K | |
| AMD Ryzen 7 5800X | |
| AMD Ryzen 5 5600X | |
| AMD Ryzen 9 5950X | |
| Intel Core i9-11900K | |
| 1900x1060 Maya (maya-04) | |
| AMD Ryzen 7 5800X | |
| AMD Ryzen 5 5600X | |
| Intel Core i9-12900K | |
| Intel Core i9-11900K | |
| Intel Core i5-12600K | |
| AMD Ryzen 9 5950X | |
| Intel Core i9-10900K | |
| AMD Ryzen 9 5900X | |
| Intel Core i5-11600K | |
| Intel Core i7-10700K | |
| Intel Core i5-10600K | |
| 1900x1060 Energy (energy-01) | |
| Intel Core i9-12900K | |
| Intel Core i5-12600K | |
| Intel Core i5-10600K | |
| Intel Core i9-10900K | |
| Intel Core i7-10700K | |
| AMD Ryzen 9 5900X | |
| Intel Core i5-11600K | |
| Intel Core i9-11900K | |
| AMD Ryzen 9 5950X | |
| AMD Ryzen 7 5800X | |
| AMD Ryzen 5 5600X | |
| 1900x1060 Creo (creo-01) | |
| Intel Core i9-12900K | |
| Intel Core i5-12600K | |
| AMD Ryzen 7 5800X | |
| AMD Ryzen 9 5900X | |
| Intel Core i9-11900K | |
| AMD Ryzen 5 5600X | |
| Intel Core i5-11600K | |
| Intel Core i9-10900K | |
| Intel Core i7-10700K | |
| Intel Core i5-10600K | |
| AMD Ryzen 9 5950X | |
| 1900x1060 Catia (catia-04) | |
| Intel Core i9-12900K | |
| Intel Core i5-12600K | |
| Intel Core i9-11900K | |
| AMD Ryzen 7 5800X | |
| AMD Ryzen 5 5600X | |
| AMD Ryzen 9 5900X | |
| Intel Core i5-11600K | |
| AMD Ryzen 9 5950X | |
| Intel Core i9-10900K | |
| Intel Core i5-10600K | |
| Intel Core i7-10700K | |
| 1900x1060 3ds Max (3dsmax-05) | |
| AMD Ryzen 5 5600X | |
| Intel Core i9-10900K | |
| Intel Core i5-10600K | |
| AMD Ryzen 7 5800X | |
| Intel Core i7-10700K | |
| AMD Ryzen 9 5900X | |
| AMD Ryzen 9 5950X | |
| Intel Core i9-11900K | |
| Intel Core i5-11600K | |
| Intel Core i5-12600K | |
| Intel Core i9-12900K | |
| SPECviewperf 13 | |
| Solidworks (sw-04) | |
| AMD Ryzen 7 5800X | |
| Intel Core i9-12900K | |
| Intel Core i9-11900K | |
| AMD Ryzen 9 5900X | |
| AMD Ryzen 5 5600X | |
| Intel Core i5-12600K | |
| Intel Core i5-11600K | |
| AMD Ryzen 9 5950X | |
| Intel Core i9-10900K | |
| Intel Core i7-10700K | |
| Intel Core i5-10600K | |
| Siemens NX (snx-03) | |
| Intel Core i9-12900K | |
| Intel Core i5-12600K | |
| Intel Core i7-10700K | |
| AMD Ryzen 9 5900X | |
| AMD Ryzen 7 5800X | |
| AMD Ryzen 5 5600X | |
| AMD Ryzen 9 5950X | |
| Intel Core i9-10900K | |
| Intel Core i5-10600K | |
| Intel Core i5-11600K | |
| Intel Core i9-11900K | |
| Showcase (showcase-02) | |
| Intel Core i9-12900K | |
| Intel Core i5-12600K | |
| Intel Core i5-10600K | |
| Intel Core i7-10700K | |
| Intel Core i9-10900K | |
| Intel Core i9-11900K | |
| Intel Core i5-11600K | |
| AMD Ryzen 7 5800X | |
| AMD Ryzen 9 5950X | |
| AMD Ryzen 5 5600X | |
| AMD Ryzen 9 5900X | |
| Medical (medical-02) | |
| Intel Core i9-12900K | |
| Intel Core i5-12600K | |
| AMD Ryzen 9 5900X | |
| AMD Ryzen 7 5800X | |
| Intel Core i7-10700K | |
| AMD Ryzen 9 5950X | |
| AMD Ryzen 5 5600X | |
| Intel Core i9-11900K | |
| Intel Core i5-11600K | |
| Intel Core i5-10600K | |
| Intel Core i9-10900K | |
| Maya (maya-05) | |
| Intel Core i9-12900K | |
| Intel Core i5-12600K | |
| AMD Ryzen 9 5950X | |
| AMD Ryzen 7 5800X | |
| AMD Ryzen 9 5900X | |
| Intel Core i9-11900K | |
| AMD Ryzen 5 5600X | |
| Intel Core i5-11600K | |
| Intel Core i7-10700K | |
| Intel Core i9-10900K | |
| Intel Core i5-10600K | |
| Energy (energy-02) | |
| Intel Core i5-11600K | |
| Intel Core i5-12600K | |
| Intel Core i9-11900K | |
| Intel Core i5-10600K | |
| Intel Core i9-10900K | |
| Intel Core i9-12900K | |
| Intel Core i7-10700K | |
| AMD Ryzen 7 5800X | |
| AMD Ryzen 5 5600X | |
| AMD Ryzen 9 5900X | |
| AMD Ryzen 9 5950X | |
| Creo (creo-02) | |
| Intel Core i9-12900K | |
| Intel Core i5-12600K | |
| Intel Core i9-11900K | |
| Intel Core i5-11600K | |
| Intel Core i7-10700K | |
| AMD Ryzen 7 5800X | |
| AMD Ryzen 5 5600X | |
| AMD Ryzen 9 5900X | |
| AMD Ryzen 9 5950X | |
| Intel Core i9-10900K | |
| Intel Core i5-10600K | |
| Catia (catia-05) | |
| Intel Core i9-12900K | |
| Intel Core i5-12600K | |
| AMD Ryzen 9 5950X | |
| AMD Ryzen 5 5600X | |
| AMD Ryzen 7 5800X | |
| Intel Core i9-11900K | |
| Intel Core i5-11600K | |
| AMD Ryzen 9 5900X | |
| Intel Core i9-10900K | |
| Intel Core i7-10700K | |
| Intel Core i5-10600K | |
| 3ds Max (3dsmax-06) | |
| AMD Ryzen 5 5600X | |
| AMD Ryzen 7 5800X | |
| Intel Core i5-10600K | |
| Intel Core i9-10900K | |
| AMD Ryzen 9 5900X | |
| Intel Core i7-10700K | |
| AMD Ryzen 9 5950X | |
| Intel Core i5-11600K | |
| Intel Core i9-11900K | |
| Intel Core i9-12900K | |
| Intel Core i5-12600K | |
| Performance rating - Percent | |
| Intel Core i9-12900K | |
| AMD Ryzen 9 5900X -2! | |
| AMD Ryzen 7 5800X -2! | |
| AMD Ryzen 9 5950X -2! | |
| AMD Ryzen 5 5600X -2! | |
| Intel Core i9-11900K | |
| Intel Core i5-12600K | |
| Intel Core i5-11600K | |
| Intel Core i9-10900K | |
| Intel Core i7-10700K -4! | |
| Intel Core i5-10600K | |
| Borderlands 3 | |
| 1280x720 Very Low Overall Quality (DX11) | |
| AMD Ryzen 9 5900X | |
| AMD Ryzen 7 5800X | |
| AMD Ryzen 9 5950X | |
| AMD Ryzen 5 5600X | |
| Intel Core i9-12900K | |
| Intel Core i9-11900K | |
| Intel Core i9-10900K | |
| Intel Core i5-11600K | |
| Intel Core i7-10700K | |
| Intel Core i5-12600K | |
| Intel Core i5-10600K | |
| 1920x1080 Badass Overall Quality (DX11) | |
| Intel Core i9-12900K | |
| Intel Core i5-12600K | |
| AMD Ryzen 9 5900X | |
| Intel Core i9-11900K | |
| Intel Core i9-10900K | |
| Intel Core i7-10700K | |
| AMD Ryzen 9 5950X | |
| Intel Core i5-11600K | |
| AMD Ryzen 7 5800X | |
| AMD Ryzen 5 5600X | |
| Intel Core i5-10600K | |
| Far Cry New Dawn | |
| 1280x720 Low Preset | |
| Intel Core i9-12900K | |
| Intel Core i9-11900K | |
| AMD Ryzen 9 5900X | |
| Intel Core i5-12600K | |
| Intel Core i5-11600K | |
| AMD Ryzen 7 5800X | |
| AMD Ryzen 9 5950X | |
| Intel Core i7-10700K | |
| AMD Ryzen 5 5600X | |
| Intel Core i9-10900K | |
| Intel Core i5-10600K | |
| 1920x1080 Ultra Preset | |
| Intel Core i9-12900K | |
| Intel Core i9-11900K | |
| AMD Ryzen 9 5900X | |
| Intel Core i5-11600K | |
| Intel Core i7-10700K | |
| Intel Core i5-12600K | |
| AMD Ryzen 7 5800X | |
| AMD Ryzen 9 5950X | |
| AMD Ryzen 5 5600X | |
| Intel Core i5-10600K | |
| Intel Core i9-10900K | |
| Forza Horizon 4 | |
| 1280x720 Very Low Preset | |
| Intel Core i9-12900K | |
| Intel Core i5-12600K | |
| Intel Core i9-11900K | |
| Intel Core i9-10900K | |
| Intel Core i5-11600K | |
| Intel Core i5-10600K | |
| 1920x1080 Ultra Preset AA:2xMS | |
| Intel Core i9-10900K | |
| Intel Core i9-11900K | |
| Intel Core i5-11600K | |
| Intel Core i5-10600K | |
| Intel Core i9-12900K | |
| Intel Core i5-12600K | |
| Far Cry 5 | |
| 1280x720 Low Preset AA:T | |
| Intel Core i9-12900K | |
| AMD Ryzen 9 5900X | |
| Intel Core i9-11900K | |
| AMD Ryzen 7 5800X | |
| AMD Ryzen 9 5950X | |
| AMD Ryzen 5 5600X | |
| Intel Core i5-12600K | |
| Intel Core i5-11600K | |
| Intel Core i9-10900K | |
| Intel Core i7-10700K | |
| Intel Core i5-10600K | |
| 1920x1080 Ultra Preset AA:T | |
| Intel Core i9-12900K | |
| Intel Core i9-11900K | |
| AMD Ryzen 9 5900X | |
| AMD Ryzen 7 5800X | |
| Intel Core i5-11600K | |
| AMD Ryzen 9 5950X | |
| Intel Core i5-12600K | |
| AMD Ryzen 5 5600X | |
| Intel Core i7-10700K | |
| Intel Core i9-10900K | |
| Intel Core i5-10600K | |
| X-Plane 11.11 | |
| 1280x720 low (fps_test=1) | |
| Intel Core i9-12900K | |
| AMD Ryzen 7 5800X | |
| AMD Ryzen 9 5900X | |
| AMD Ryzen 5 5600X | |
| Intel Core i5-12600K | |
| Intel Core i9-11900K | |
| AMD Ryzen 9 5950X | |
| Intel Core i5-11600K | |
| Intel Core i9-10900K | |
| Intel Core i7-10700K | |
| Intel Core i5-10600K | |
| 1920x1080 high (fps_test=3) | |
| Intel Core i9-12900K | |
| AMD Ryzen 9 5900X | |
| AMD Ryzen 7 5800X | |
| Intel Core i9-11900K | |
| AMD Ryzen 5 5600X | |
| Intel Core i5-12600K | |
| AMD Ryzen 9 5950X | |
| Intel Core i5-11600K | |
| Intel Core i9-10900K | |
| Intel Core i7-10700K | |
| Intel Core i5-10600K | |
| Final Fantasy XV Benchmark | |
| 1280x720 Lite Quality | |
| Intel Core i9-12900K | |
| AMD Ryzen 9 5900X | |
| AMD Ryzen 7 5800X | |
| AMD Ryzen 9 5950X | |
| AMD Ryzen 5 5600X | |
| Intel Core i9-10900K | |
| Intel Core i9-11900K | |
| Intel Core i5-12600K | |
| Intel Core i5-11600K | |
| Intel Core i5-10600K | |
| Intel Core i7-10700K | |
| 1920x1080 High Quality | |
| Intel Core i9-12900K | |
| Intel Core i9-11900K | |
| Intel Core i9-10900K | |
| AMD Ryzen 9 5950X | |
| Intel Core i5-11600K | |
| Intel Core i5-12600K | |
| Intel Core i5-10600K | |
| AMD Ryzen 7 5800X | |
| AMD Ryzen 9 5900X | |
| AMD Ryzen 5 5600X | |
| Intel Core i7-10700K | |
| Dota 2 Reborn | |
| 1280x720 min (0/3) fastest | |
| AMD Ryzen 7 5800X | |
| AMD Ryzen 9 5900X | |
| AMD Ryzen 5 5600X | |
| AMD Ryzen 9 5950X | |
| Intel Core i9-12900K | |
| Intel Core i9-10900K | |
| Intel Core i9-11900K | |
| Intel Core i7-10700K | |
| Intel Core i5-11600K | |
| Intel Core i5-12600K | |
| Intel Core i5-10600K | |
| 1920x1080 ultra (3/3) best looking | |
| Intel Core i9-12900K | |
| AMD Ryzen 7 5800X | |
| AMD Ryzen 9 5900X | |
| AMD Ryzen 5 5600X | |
| AMD Ryzen 9 5950X | |
| Intel Core i5-12600K | |
| Intel Core i9-10900K | |
| Intel Core i9-11900K | |
| Intel Core i5-11600K | |
| Intel Core i7-10700K | |
| Intel Core i5-10600K | |
| The Witcher 3 | |
| 1024x768 Low Graphics & Postprocessing | |
| AMD Ryzen 9 5900X | |
| AMD Ryzen 7 5800X | |
| AMD Ryzen 9 5950X | |
| Intel Core i9-12900K | |
| AMD Ryzen 5 5600X | |
| Intel Core i9-10900K | |
| Intel Core i9-11900K | |
| Intel Core i5-12600K | |
| Intel Core i7-10700K | |
| Intel Core i5-11600K | |
| Intel Core i5-10600K | |
| 1920x1080 Ultra Graphics & Postprocessing (HBAO+) | |
| Intel Core i5-11600K | |
| Intel Core i5-12600K | |
| Intel Core i7-10700K | |
| AMD Ryzen 9 5900X | |
| AMD Ryzen 9 5950X | |
| Intel Core i5-10600K | |
| Intel Core i9-11900K | |
| Intel Core i9-10900K | |
| AMD Ryzen 7 5800X | |
| AMD Ryzen 5 5600X | |
| Intel Core i9-12900K | |
| Shadow of the Tomb Raider | |
| 1280x720 Lowest Preset | |
| AMD Ryzen 7 5800X | |
| AMD Ryzen 9 5950X | |
| AMD Ryzen 9 5900X | |
| Intel Core i9-12900K | |
| AMD Ryzen 5 5600X | |
| Intel Core i9-10900K | |
| Intel Core i9-11900K | |
| Intel Core i5-12600K | |
| Intel Core i5-11600K | |
| Intel Core i5-10600K | |
| 1920x1080 Highest Preset AA:T | |
| AMD Ryzen 7 5800X | |
| Intel Core i9-12900K | |
| Intel Core i9-11900K | |
| AMD Ryzen 9 5950X | |
| AMD Ryzen 9 5900X | |
| Intel Core i9-10900K | |
| AMD Ryzen 5 5600X | |
| Intel Core i5-12600K | |
| Intel Core i5-11600K | |
| Intel Core i5-10600K | |
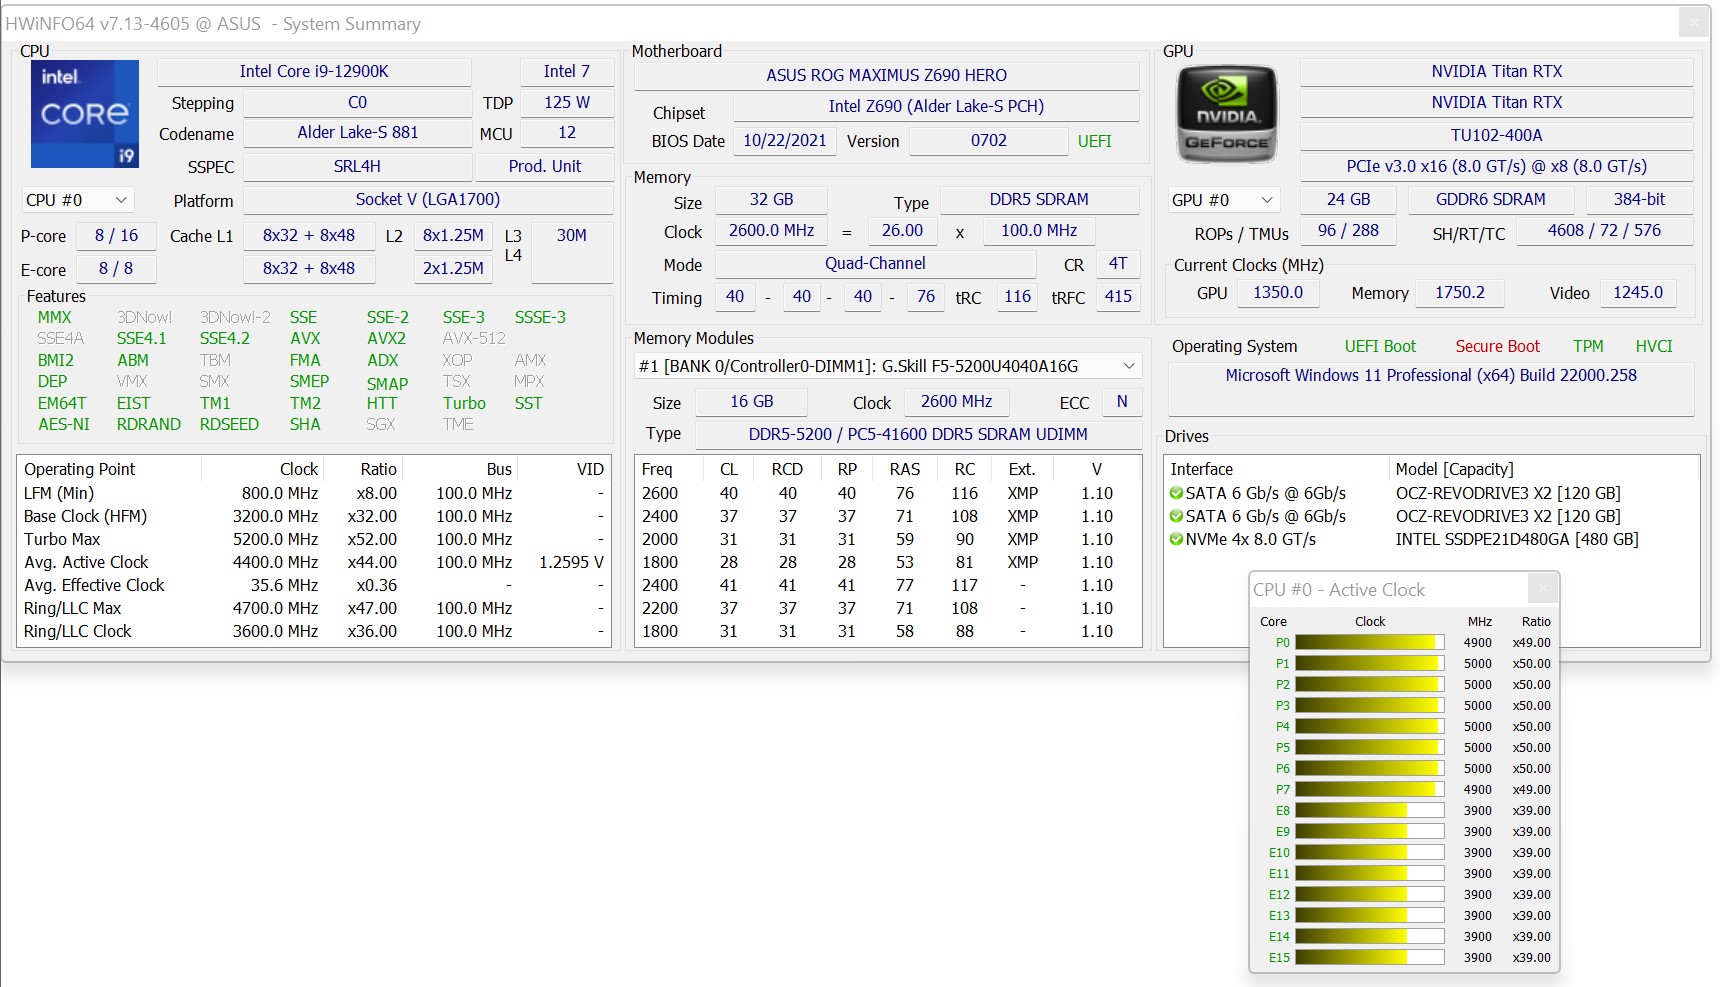
Intel Core i9-12900K + Nvidia Titan RTX
| alacsony | közepes | magas | ultra | QHD | 4K | |
|---|---|---|---|---|---|---|
| GTA V (2015) | 187 | 187 | 185 | 135 | 123 | 138 |
| The Witcher 3 (2015) | 589 | 422 | 271 | 139 | 103 | |
| Dota 2 Reborn (2015) | 203.5 | 208.7 | 201.7 | 189.7 | 178.9 | |
| Final Fantasy XV Benchmark (2018) | 227 | 195 | 144 | 108 | 64.1 | |
| X-Plane 11.11 (2018) | 200 | 176 | 137 | 117 | ||
| Far Cry 5 (2018) | 220 | 191 | 178 | 167 | 145 | 83 |
| Strange Brigade (2018) | 593 | 371 | 308 | 266 | 197 | 115 |
| Shadow of the Tomb Raider (2018) | 221 | 192 | 183 | 169 | 124 | 69.3 |
| Forza Horizon 4 (2018) | 293 | 227 | 216 | 178 | 153 | 111 |
| Far Cry New Dawn (2019) | 188 | 162 | 154 | 140 | 129 | 84 |
| Borderlands 3 (2019) | 202 | 172 | 147 | 124 | 89.9 | 49.2 |
| F1 2020 (2020) | 432 | 343 | 303 | 213 | 167 | 101 |
| F1 2021 (2021) | 491 | 383 | 307 | 160 | 121 | 71.9 |
| Far Cry 6 (2021) | 185 | 157 | 142 | 134 | 109 | 64 |
Intel Core i5-12600K + Nvidia Titan RTX
| alacsony | közepes | magas | ultra | QHD | 4K | |
|---|---|---|---|---|---|---|
| GTA V (2015) | 186 | 185 | 181 | 124 | 115 | 136 |
| The Witcher 3 (2015) | 500 | 406 | 277 | 144 | 107 | |
| Dota 2 Reborn (2015) | 183.7 | 188 | 181.1 | 174.9 | 165.8 | |
| Final Fantasy XV Benchmark (2018) | 218 | 192 | 141 | 107 | 63.6 | |
| X-Plane 11.11 (2018) | 172 | 153 | 119 | 104 | ||
| Far Cry 5 (2018) | 200 | 174 | 165 | 154 | 140 | 81 |
| Strange Brigade (2018) | 489 | 352 | 301 | 262 | 196 | 114 |
| Shadow of the Tomb Raider (2018) | 195 | 176 | 172 | 163 | 124 | 70.1 |
| Forza Horizon 4 (2018) | 263 | 218 | 212 | 178 | 154 | 112 |
| Far Cry New Dawn (2019) | 171 | 147 | 141 | 126 | 121 | 84 |
| Metro Exodus (2019) | 227 | 174 | 135 | 108 | 87.7 | 56.6 |
| Borderlands 3 (2019) | 175 | 155 | 138 | 119 | 90.4 | 49.8 |
| F1 2020 (2020) | 340 | 291 | 288 | 216 | 168 | 103 |
| F1 2021 (2021) | 407 | 367 | 302 | 160 | 122 | 72.6 |
| Far Cry 6 (2021) | 164 | 136 | 129 | 124 | 105 | 64 |
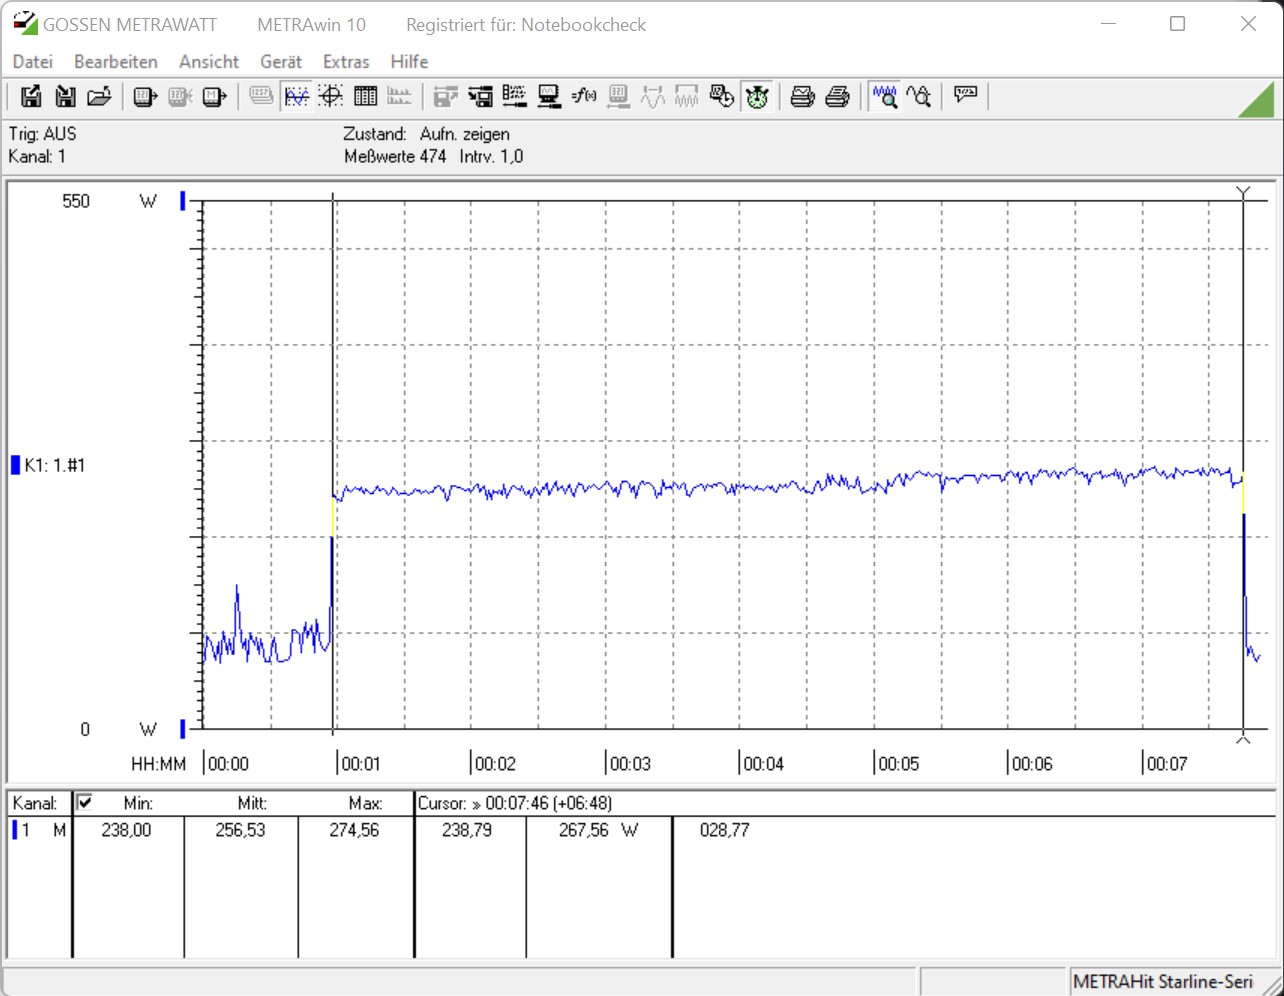
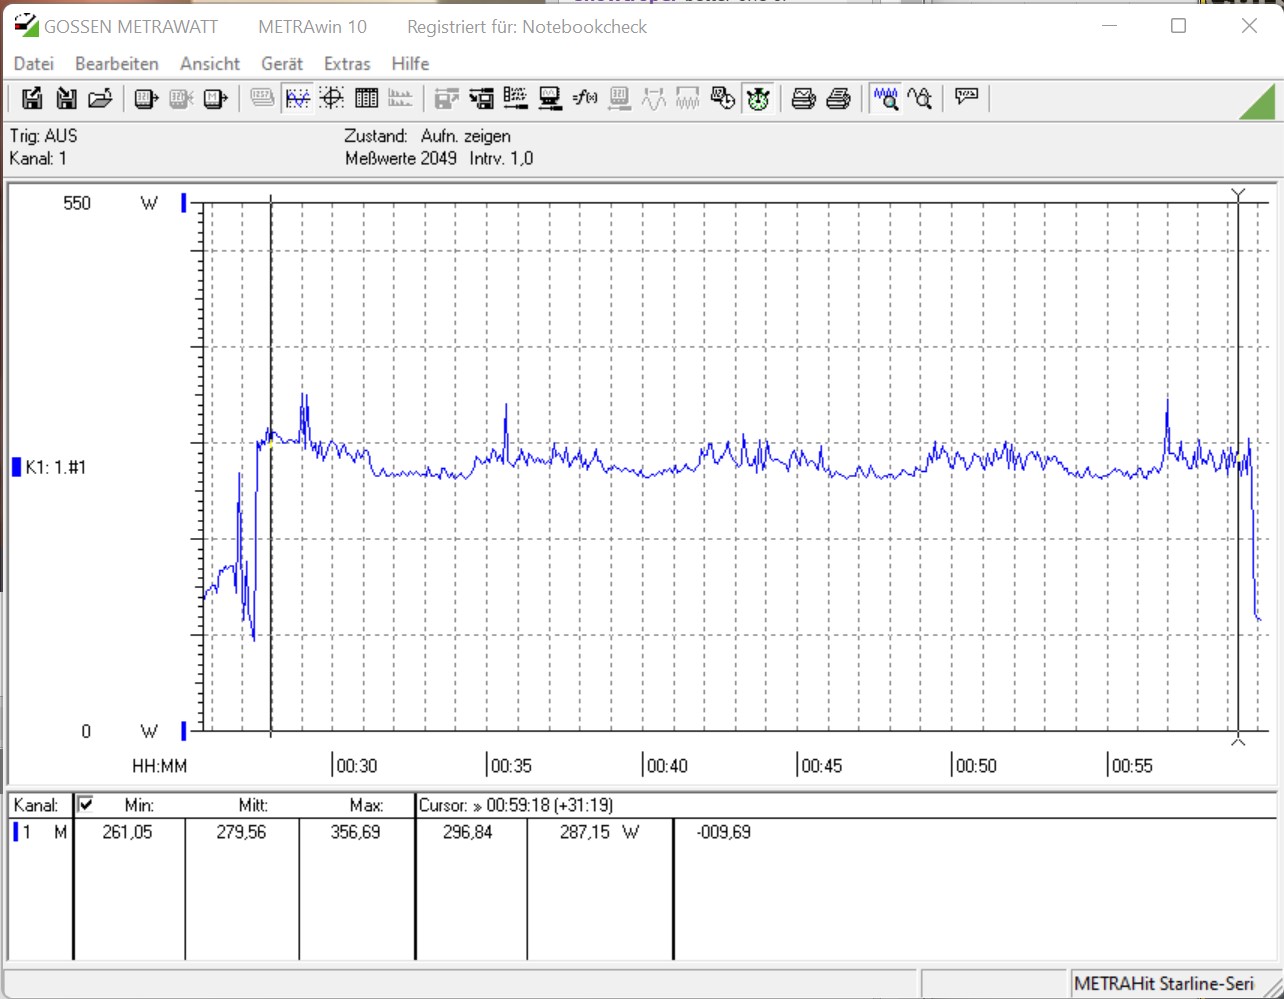
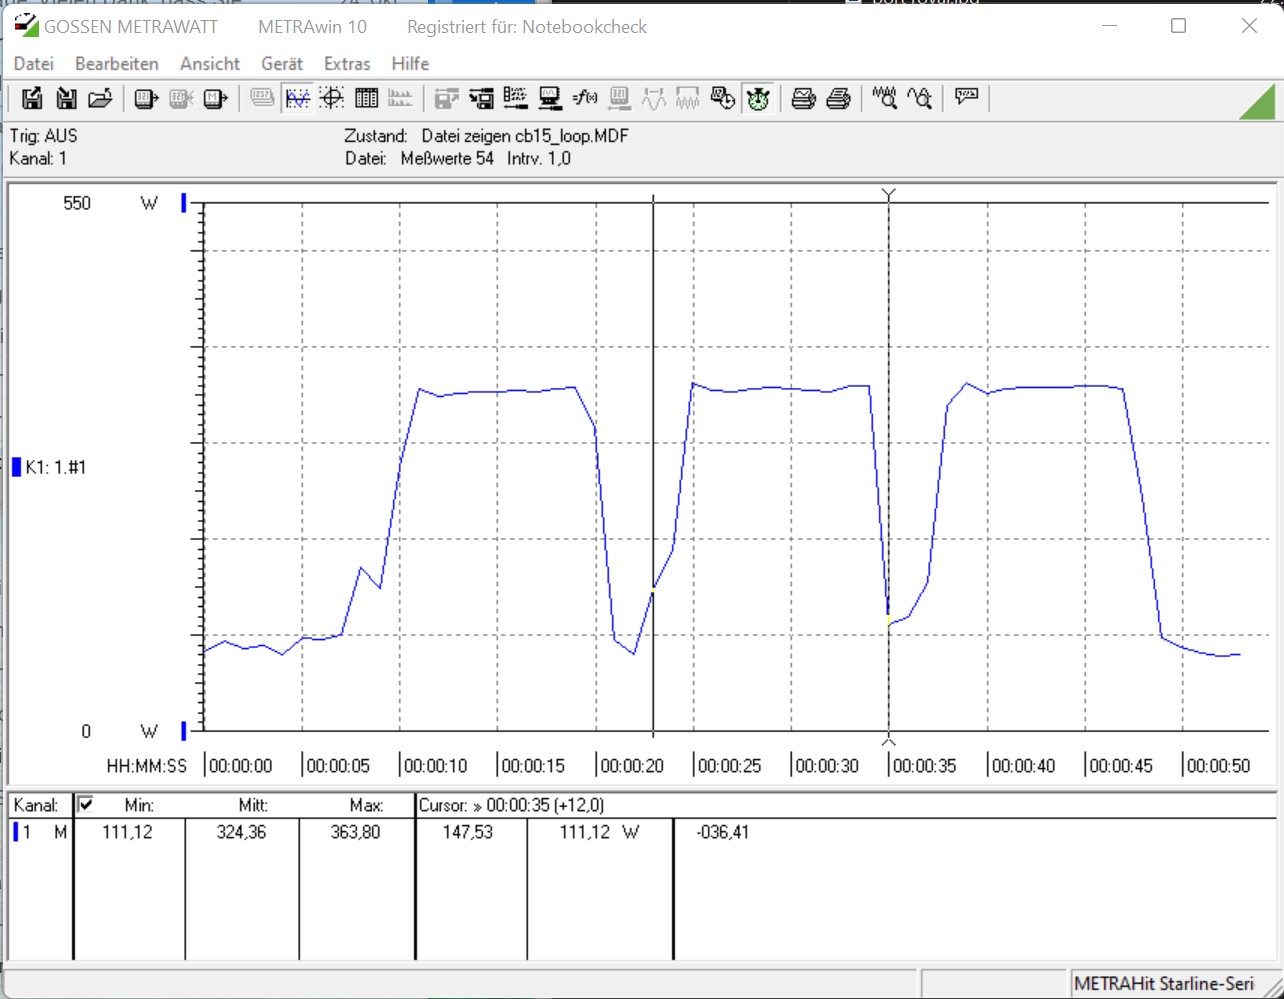
| Power Consumption | |
| 1920x1080 The Witcher 3 ultra (external Monitor) | |
| Intel Core i9-12900K (Idle: 70.5 W) | |
| AMD Ryzen 9 5950X (Idle: 78 W) | |
| AMD Ryzen 9 5900X (Idle: 78.1 W) | |
| Intel Core i5-11600K (Idle: 69.49 W) | |
| AMD Ryzen 7 5800X (Idle: 77.5 W) | |
| AMD Ryzen 5 5600X (Idle: 79.23 W) | |
| Intel Core i5-12600K (Idle: 70.45 W) | |
| Intel Core i7-10700K (Idle: 67.7 W) | |
| Intel Core i9-10900K (Idle: 52.3 W) | |
| Intel Core i9-11900K (Idle: 57.3 W) | |
| Intel Core i5-10600K (Idle: 52.2 W) | |
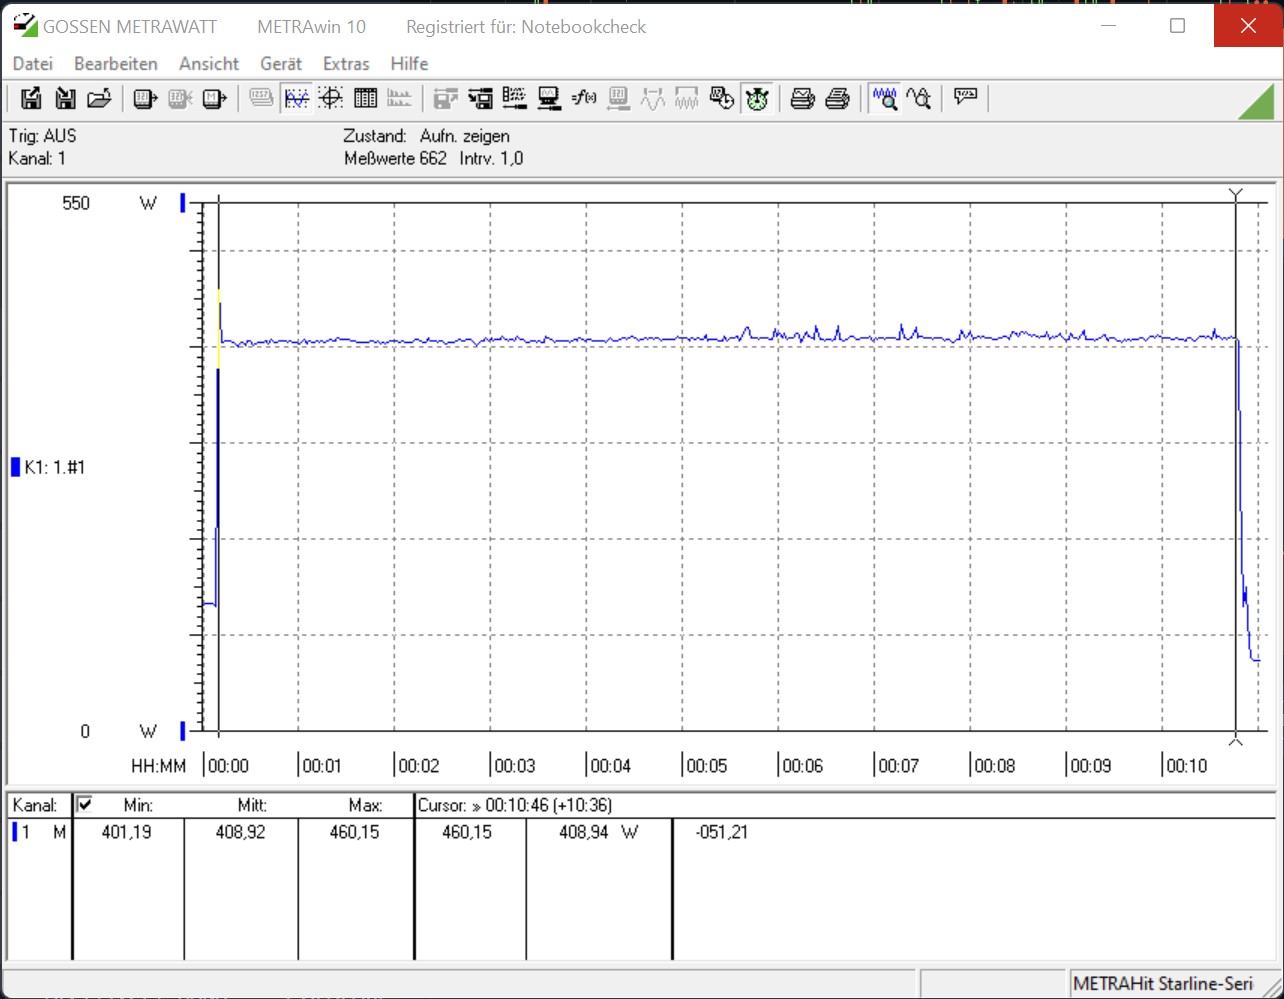
| Prime95 V2810 Stress (external Monitor) | |
| Intel Core i9-11900K (Idle: 57.3 W) | |
| Intel Core i9-12900K (Idle: 70.5 W) | |
| Intel Core i9-10900K (Idle: 52.3 W) | |
| Intel Core i5-12600K (Idle: 70.45 W) | |
| AMD Ryzen 9 5950X (Idle: 78 W) | |
| AMD Ryzen 7 5800X (Idle: 77.5 W) | |
| AMD Ryzen 9 5900X (Idle: 78.1 W) | |
| Intel Core i5-11600K (Idle: 69.49 W) | |
| Intel Core i7-10700K (Idle: 67.7 W) | |
| Intel Core i5-10600K (Idle: 52.2 W) | |
| AMD Ryzen 5 5600X (Idle: 79.23 W) | |
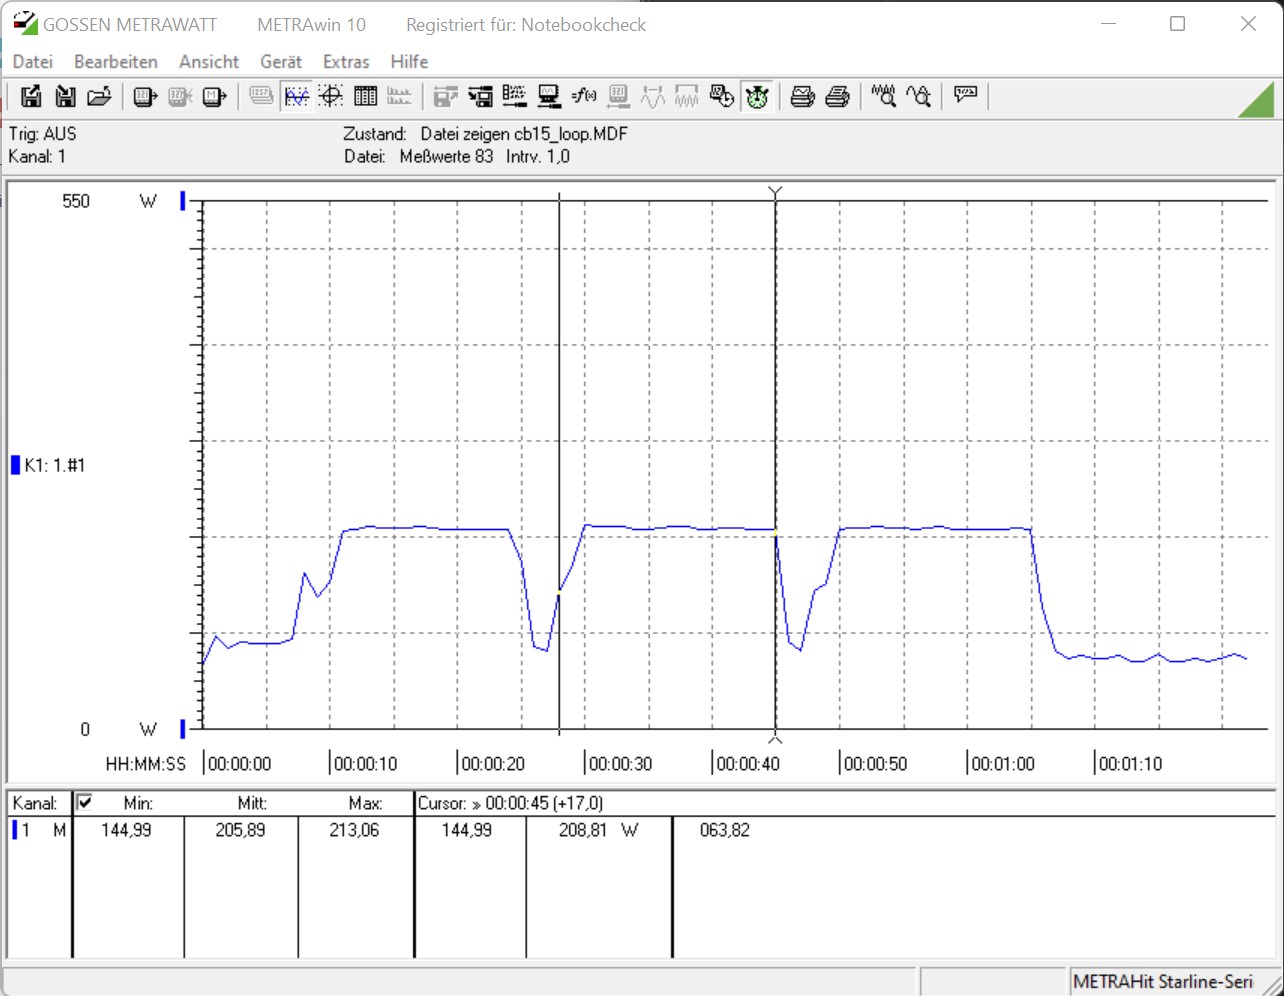
| Cinebench R15 Multi (external Monitor) | |
| Intel Core i9-12900K (Idle: 70.5 W) | |
| Intel Core i9-10900K (Idle: 52.3 W) | |
| Intel Core i9-11900K (Idle: 57.3 W) | |
| AMD Ryzen 9 5900X (Idle: 78.1 W) | |
| AMD Ryzen 9 5950X (Idle: 78 W) | |
| AMD Ryzen 7 5800X (Idle: 77.5 W) | |
| Intel Core i5-11600K (Idle: 69.49 W) | |
| Intel Core i7-10700K (Idle: 67.7 W) | |
| Intel Core i5-12600K (Idle: 70.45 W) | |
| Intel Core i5-10600K (Idle: 52.2 W) | |
| AMD Ryzen 5 5600X (Idle: 79.23 W) | |
| Temperatures - CPU Temperature Prime95 | |
| Intel Core i9-11900K | |
| AMD Ryzen 7 5800X | |
| Intel Core i9-10900K | |
| Intel Core i5-11600K | |
| AMD Ryzen 9 5900X | |
| Intel Core i5-10600K | |
| AMD Ryzen 9 5950X | |
* ... a kisebb jobb


Pro
Kontra
Összegzés - Újra a csúcson, összesen 24 szállal
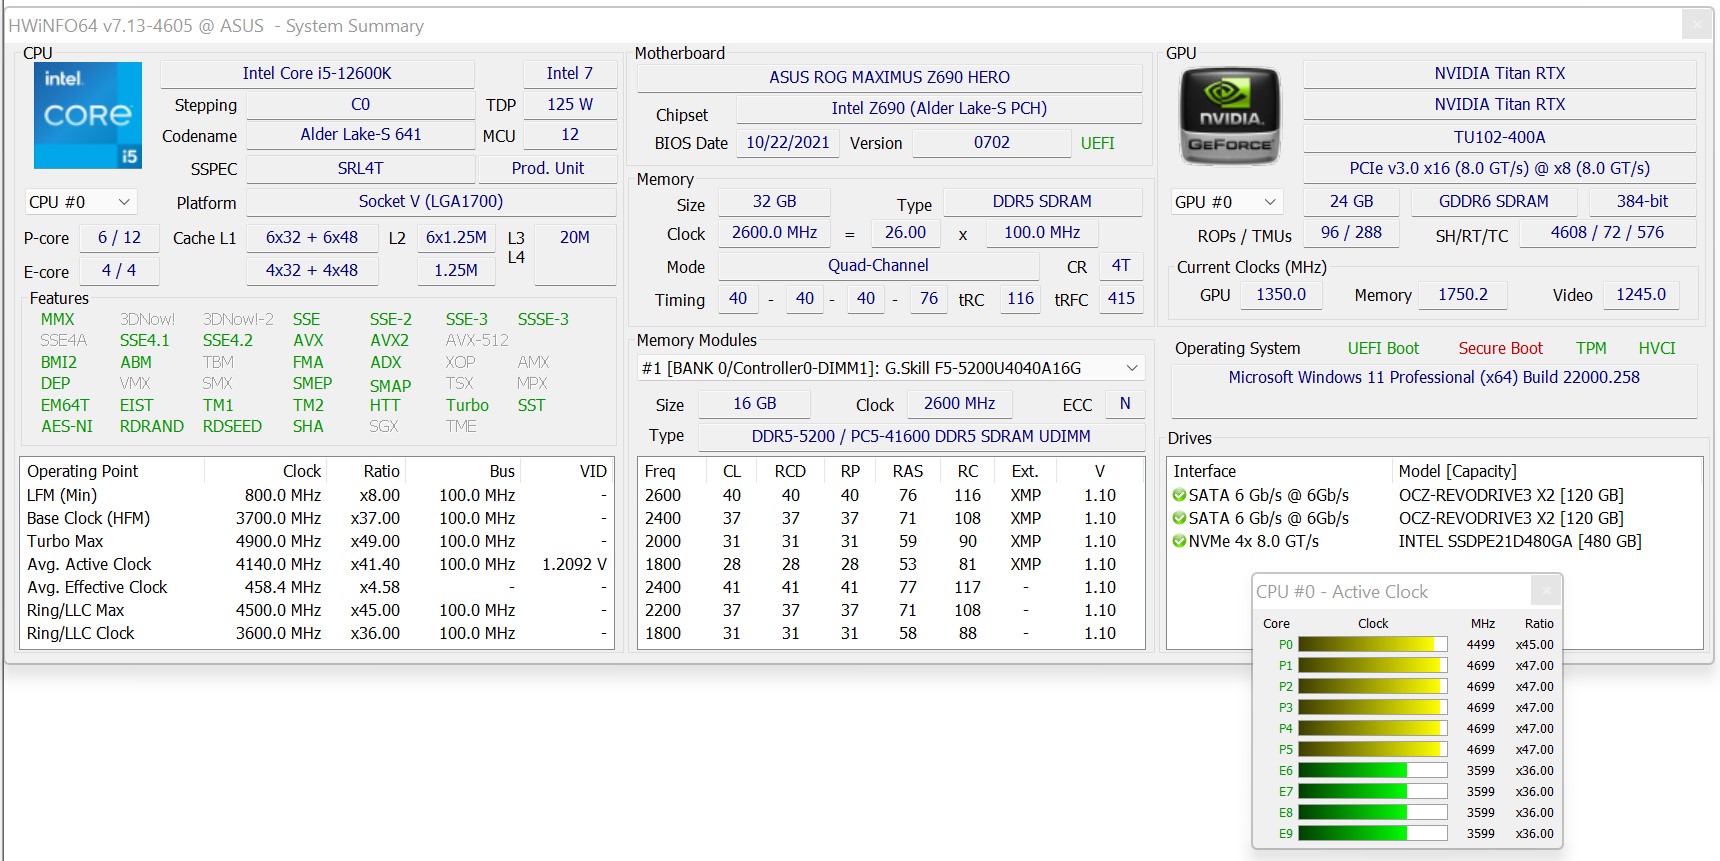
Az Alder Lake-S-szel az Intelnek valóban sikerül a leggyorsabb gamer CPU-val rendelkeznie, legalábbis egyelőre. De ez még nem minden. Az Alder Lake-S nem csak egy felturbózott utolsó generációs processzor, ahogy azt már sokszor láthattuk korábban. Itt nem erről van szó, hiszen az új architektúra számos fejlesztést tartalmaz. Ezek közül sokat már ismerünk a mobil készülékek területéről, hiszen a telefonok és a táblagépek már évek óta tartalmaznak teljesítmény- és energiatakarékos magokkal rendelkező processzorokat. Az Intel a jelenlegi asztali gép kínálatában is ezt a tervezést használja, drasztikusan megnövelve a többmagos teljesítményt. Így az Intel Core i9-12900K összesen 24 szálon képes párhuzamosan dolgozni. Emellett az IPC is jelentősen javult, ami óriási előnyökkel jár a játékoknak.
Az alap is teljesen megváltozott, és a Rocket Lake-S-ről való egyszerű frissítés az alaplap cseréje nélkül nem lehetséges. Ezt mindenképpen bele kell kalkulálni a költségszámításba. Apropó költségek, az ajánlott vételár 589 dollár, és jelenleg 659 eurótól kezdődően kapható egyes helyeken. Elérhetőségtől függően itt is lehetnek áremelkedések, mint ahogy a grafikus kártyáknál is. A valamivel gyengébb, de még mindig nagyon gyors Intel Core i5-12600K az Intel szerint 289 dolláros ajánlott áron indul. Előzetes kutatásaink szerint a modell egyes helyeken már 319 eurótól kapható. Ez egy olyan vonzó ár, amivel jelenleg még az AMD sem tud szembemenni. Az AMD Ryzen 7 5800X megfelelője jelenleg 379 euróba kerül. Kicsit másképp néznek ki a dolgok a csúcsmodellnél, ahol az AMD Ryzen 9 5900X ára lényegesen kedvezőbb, 519 euró.
Az Intel Core i9-12900K egy nagyon jó gamer CPU, amely némi tartalékkal rendelkezik a jövőre nézve. A piacon kapható leggyorsabb gamer CPU-val az Intel egyelőre vállon veregetheti magát.
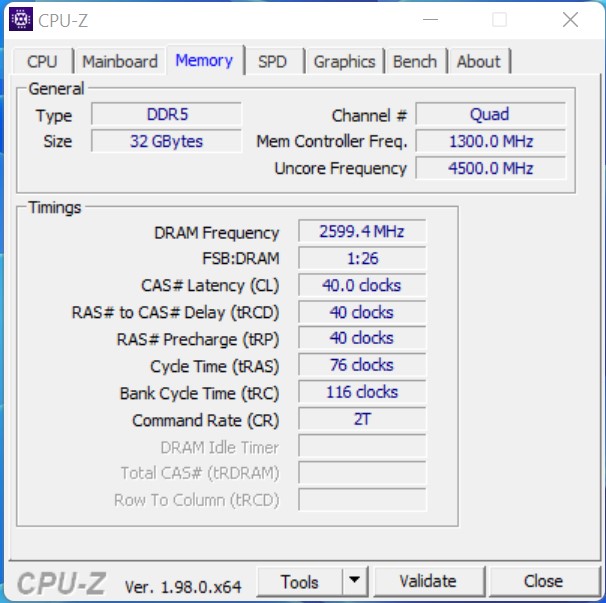
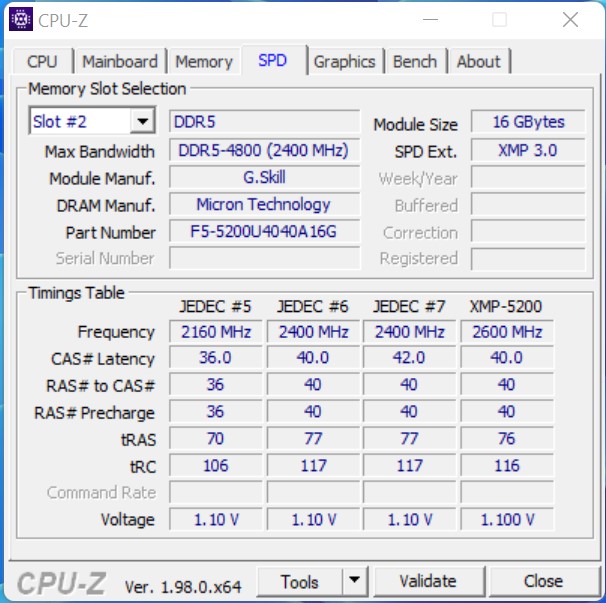
Ahhoz azonban, hogy az Intel Core i9-12900K versenyképesebb legyen, az árnak csökkennie kellene, hiszen ahogy már említettük, mindenképpen új alaplapba és adott esetben új munkamemóriába is be kell fektetni, ha DDR5-ösre van szükség. De nekünk tetszik, hogy lehetőségünk van a DDR4 további használatára is. Az alaplapgyártók ehhez néhány speciális modellt kínálnak DDR4 RAM-mal. Azt azonban jelenleg sajnos még nem tudni, hogy ezek a Raptor Lake-S-t is támogatni fogják-e.
Kicsit csalódottak voltunk az energiafogyasztást illetően. Természetesen a teljesítmény drasztikusan javult, és az ennek megfelelő, kissé magasabb fogyasztás is a határokon belül marad. Jó lett volna viszont, ha ez a teljesítménynövekedés érezhetően alacsonyabb fogyasztással párosul. Ez abban is segítene, hogy a hűtési problémákat jobban kezelni tudjuk.
Aki már most szeretne lecsapni rá, az az Intel Core i5-12600K-t az Amazonról ~323 and the Intel Core i9-12900K also from Amazon for ~$1400 dollárért szerezheti be. A Newegg ugyan 649 dollárért listázza, de ott jelenleg nincs raktáron.

