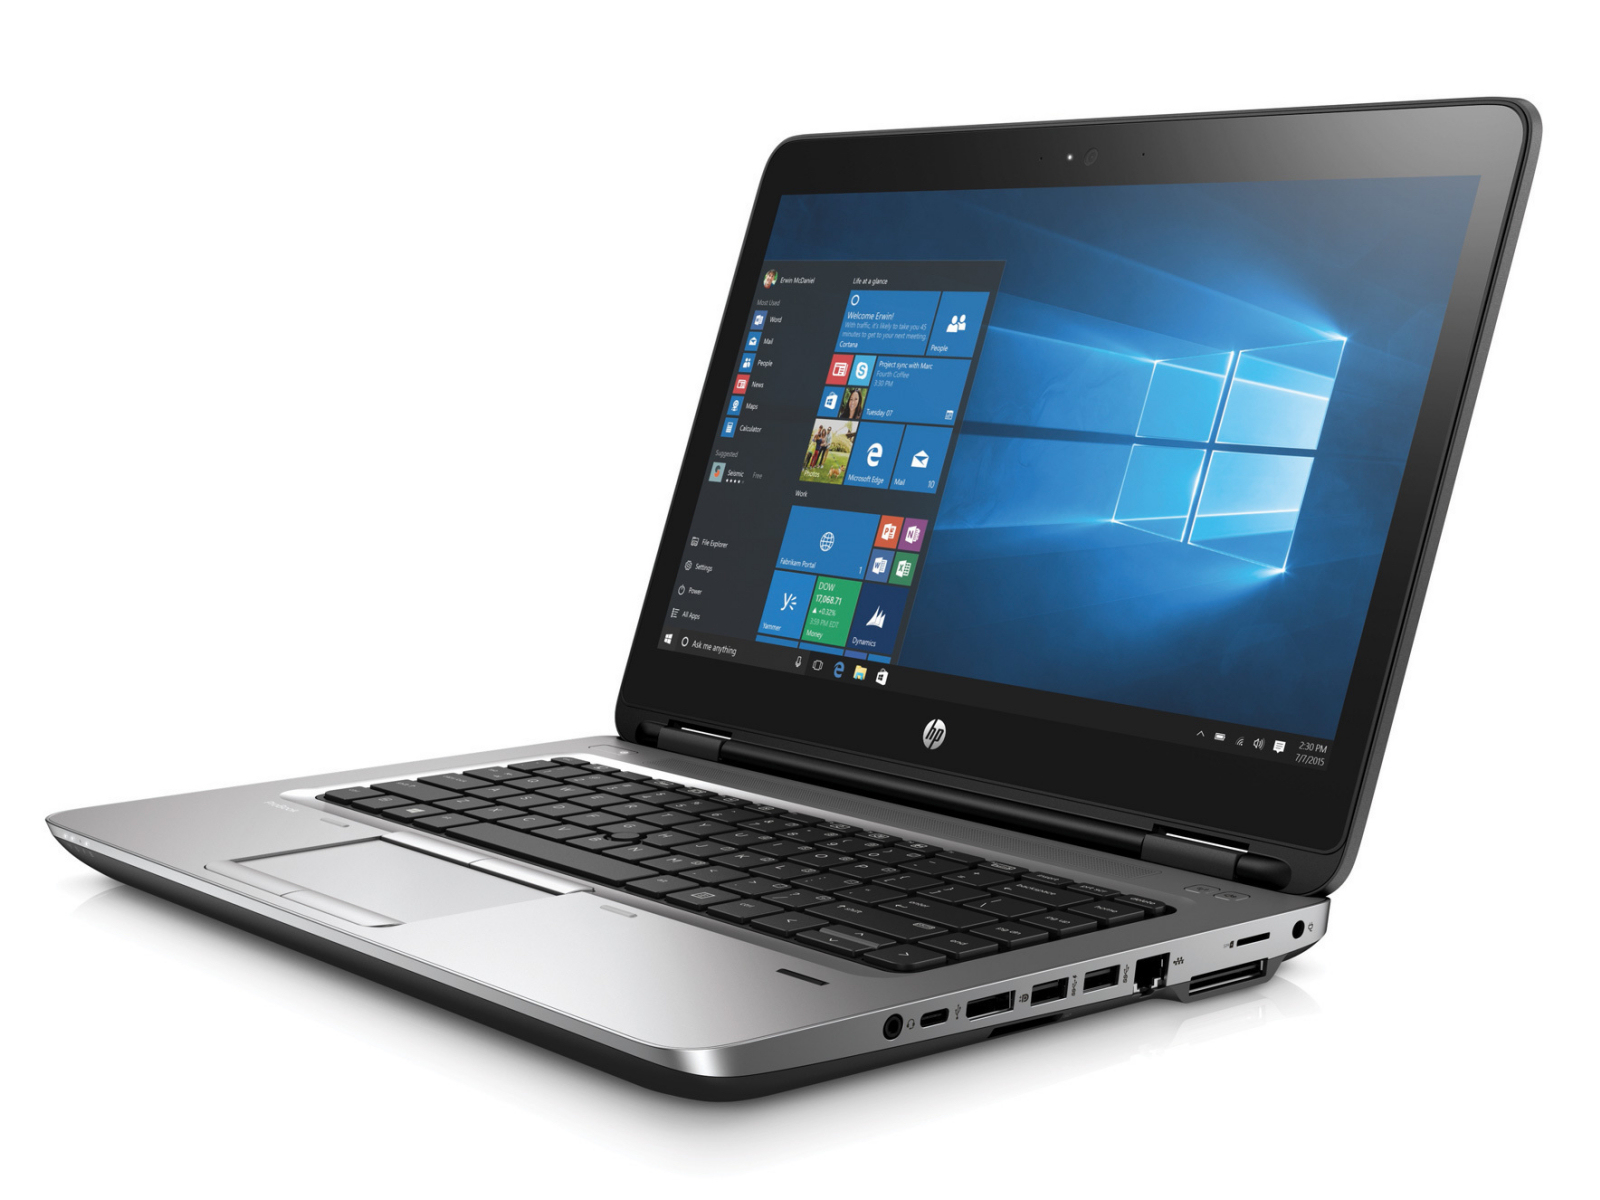
HP ProBook 640 G3 (7200U, Full HD) Business Notebook rövid értékelés
| SD Card Reader | |
| average JPG Copy Test (av. of 3 runs) | |
| Dell Latitude 14 E5470 | |
| Dell Latitude 14 E5470 | |
| HP ProBook 640 G2-T9X60ET | |
| Acer TravelMate P648-M-757N | |
| HP ProBook 640 G3 Z2W33ET | |
| Lenovo ThinkPad L460-20FVS01400 | |
| maximum AS SSD Seq Read Test (1GB) | |
| Dell Latitude 14 E5470 | |
| Dell Latitude 14 E5470 | |
| HP ProBook 640 G2-T9X60ET | |
| Lenovo ThinkPad L460-20FVS01400 | |
| HP ProBook 640 G3 Z2W33ET | |
| Networking | |
| iperf3 transmit AX12 | |
| HP ProBook 640 G3 Z2W33ET (jseb) | |
| Dell Latitude 14 E5470 (jseb) | |
| iperf3 receive AX12 | |
| Dell Latitude 14 E5470 (jseb) | |
| HP ProBook 640 G3 Z2W33ET (jseb) | |
| |||||||||||||||||||||||||
Fényerő megoszlás: 88 %
Centrumban: 360 cd/m²
Kontraszt: 497:1 (Fekete: 0.69 cd/m²)
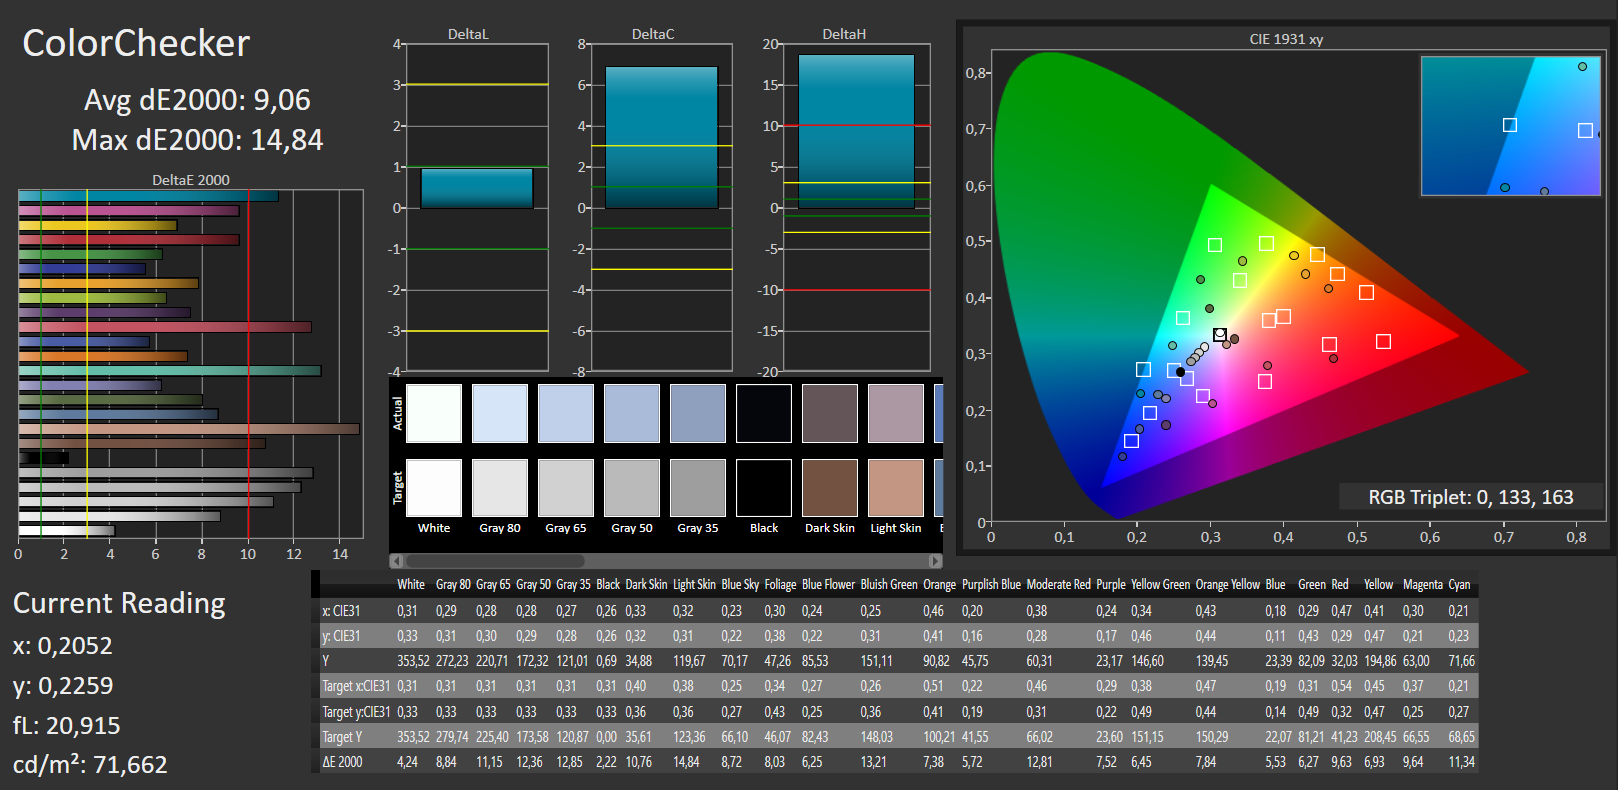
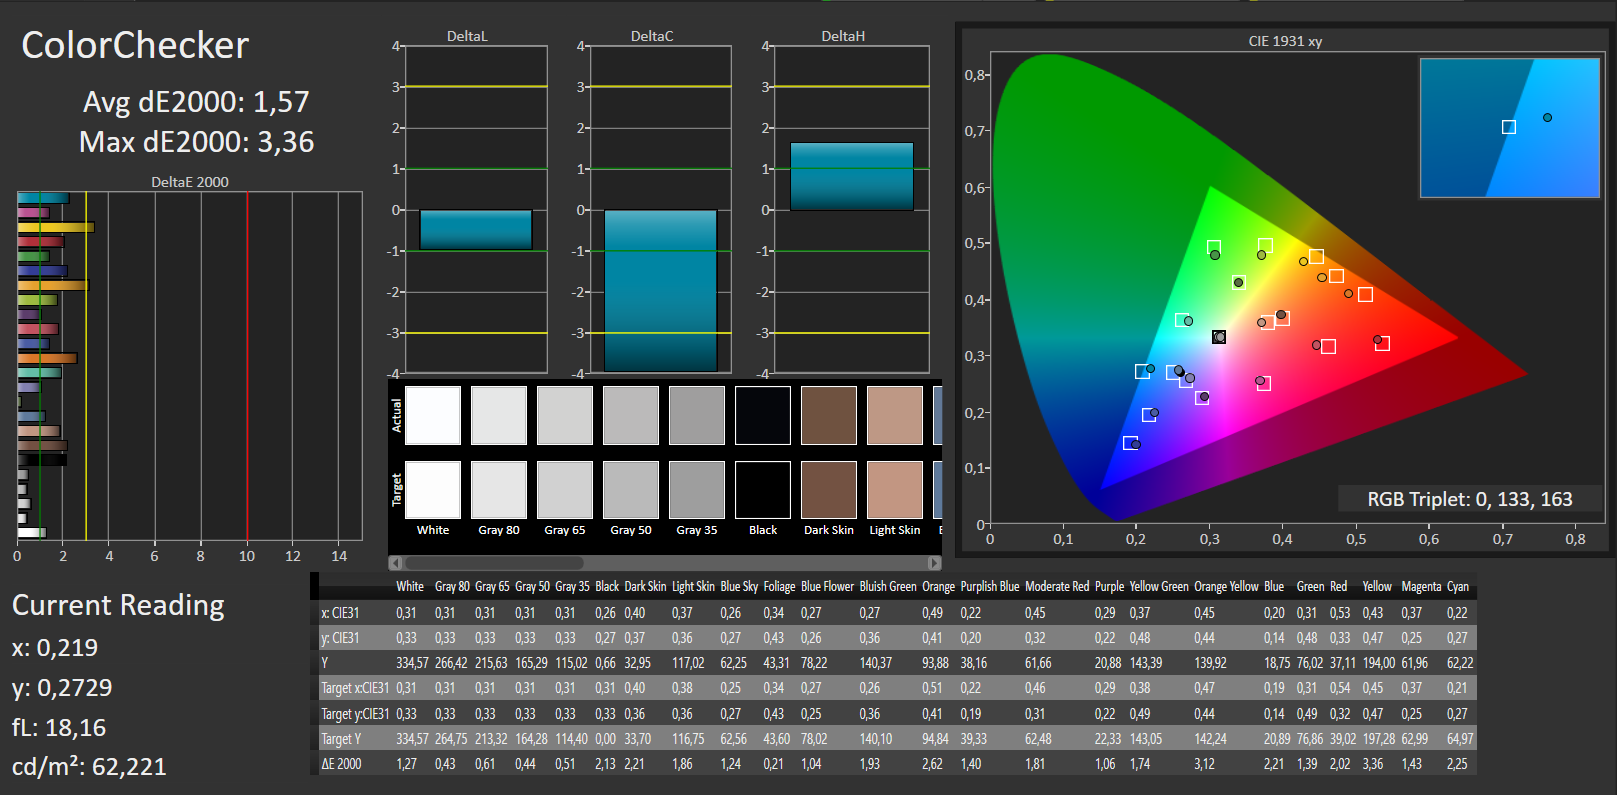
ΔE ColorChecker Calman: 9.06 | ∀{0.5-29.43 Ø4.71}
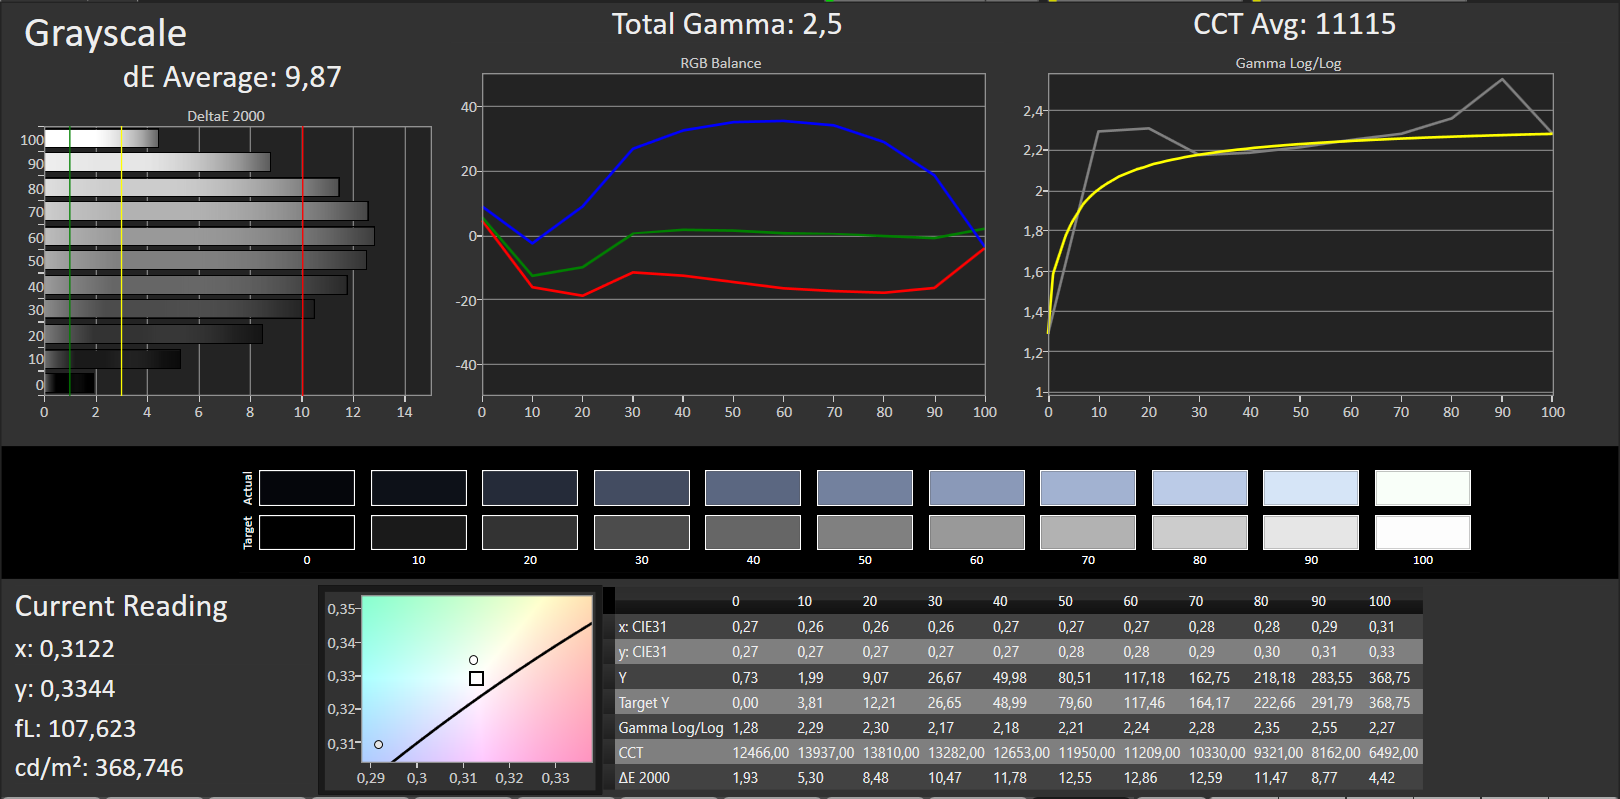
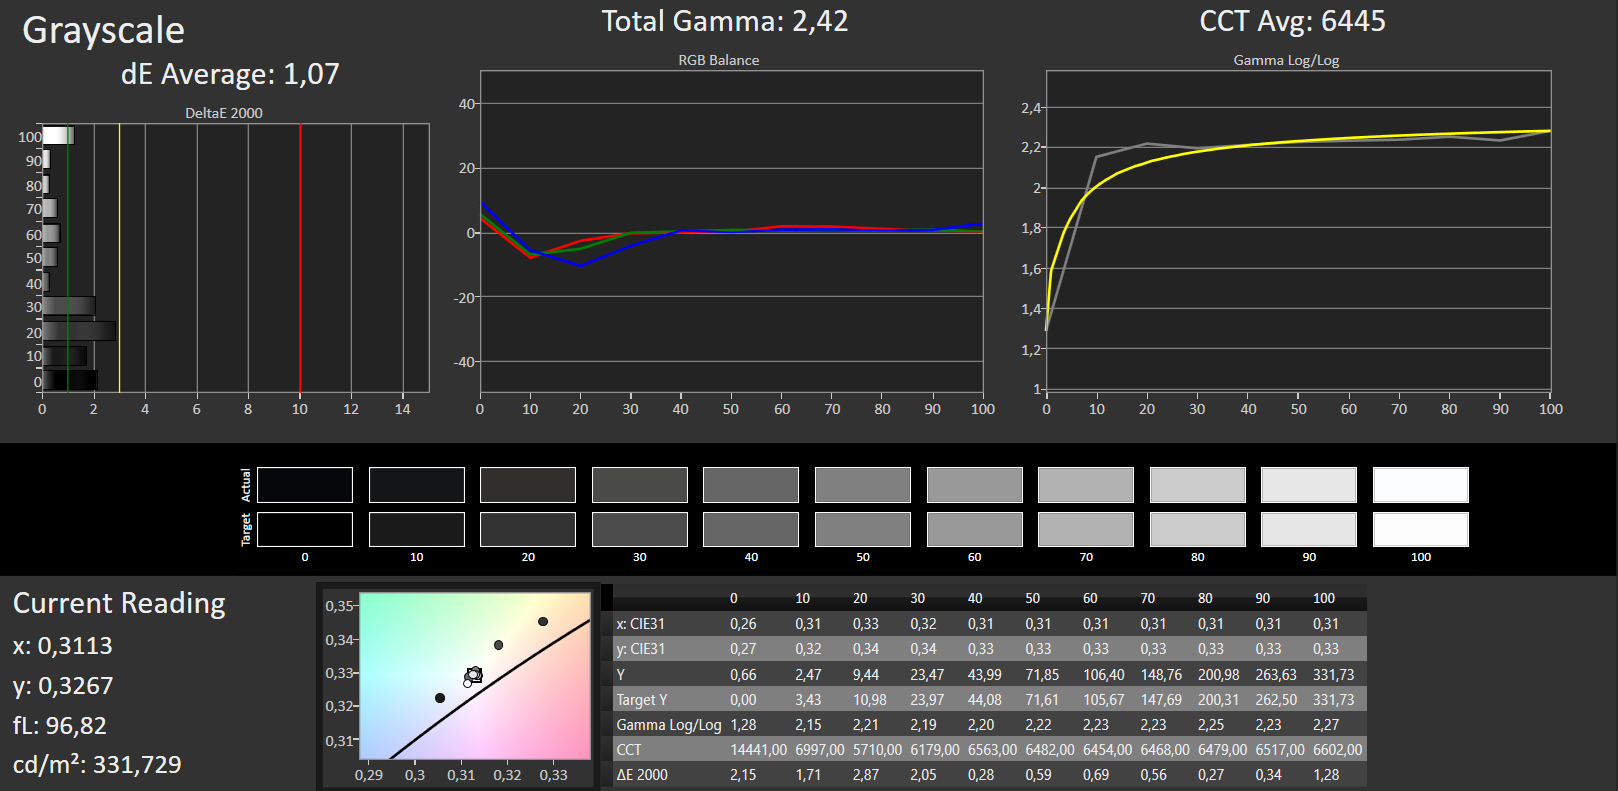
ΔE Greyscale Calman: 9.87 | ∀{0.09-98 Ø4.96}
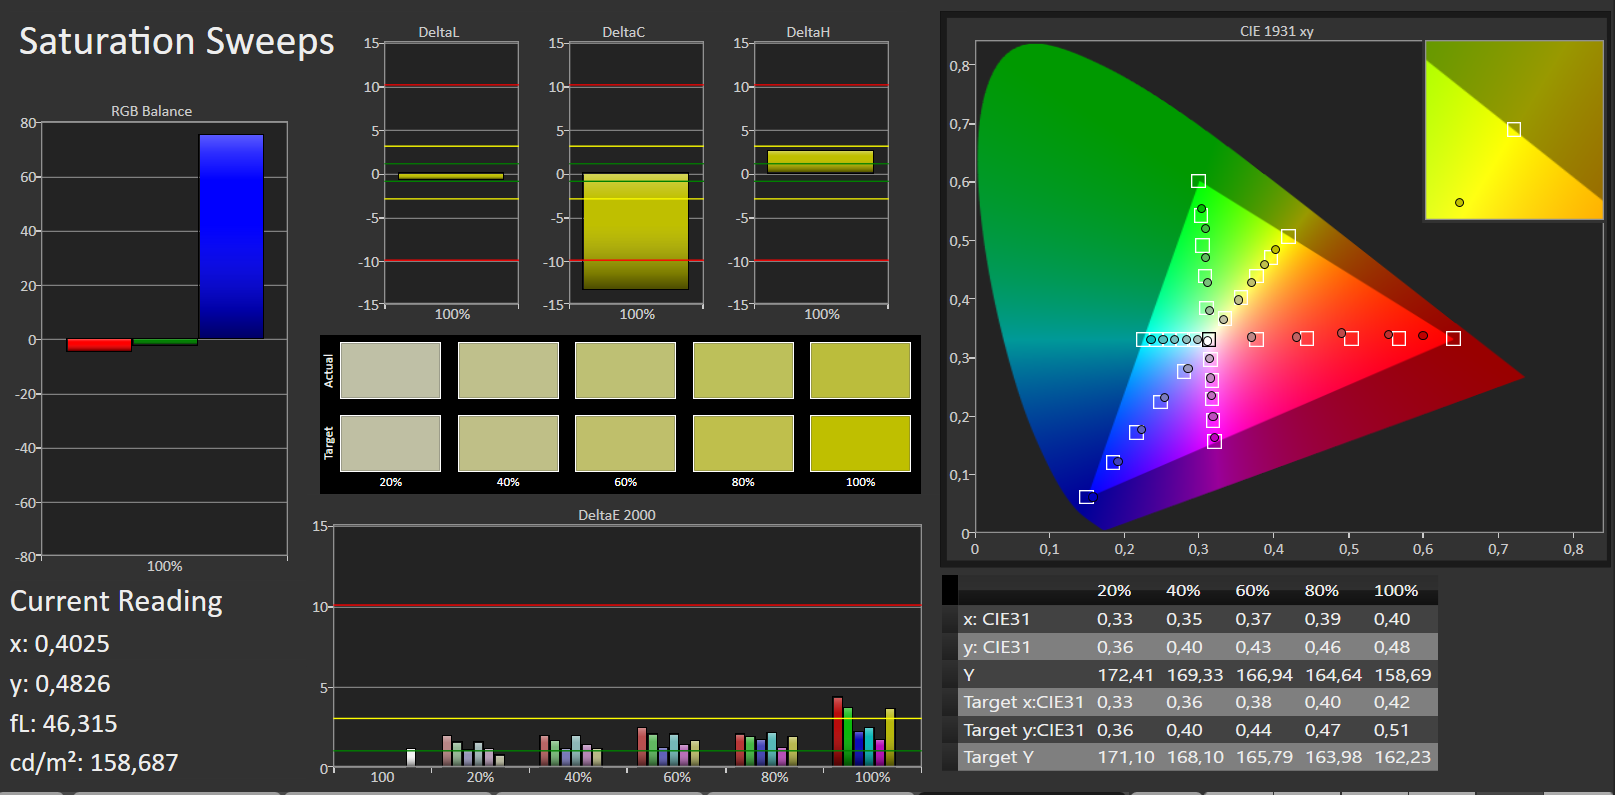
75% sRGB (Argyll 1.6.3 3D)
47% AdobeRGB 1998 (Argyll 1.6.3 3D)
51.1% AdobeRGB 1998 (Argyll 3D)
74.5% sRGB (Argyll 3D)
49.46% Display P3 (Argyll 3D)
Gamma: 2.5
CCT: 11115 K
| HP ProBook 640 G3 Z2W33ET TN LED, 1920x1080, 14" | HP ProBook 640 G2-T9X60ET TN-Panel, 1920x1080, 14" | Dell Latitude 14 E5470 AH-IPS, WLED, 1920x1080, 14" | Dell Latitude 14 E5470 TN, 1366x768, 14" | Lenovo ThinkPad L460-20FVS01400 IPS, 1920x1080, 14" | Acer TravelMate P648-M-757N IPS, 1920x1080, 14" | |
|---|---|---|---|---|---|---|
| Display | 0% | 22% | -19% | -15% | -28% | |
| Display P3 Coverage (%) | 49.46 | 49.54 0% | 64.8 31% | 40.06 -19% | 42.2 -15% | 35.53 -28% |
| sRGB Coverage (%) | 74.5 | 74.6 0% | 84.8 14% | 60.3 -19% | 62.3 -16% | 53.3 -28% |
| AdobeRGB 1998 Coverage (%) | 51.1 | 51.2 0% | 62 21% | 41.42 -19% | 43.72 -14% | 36.72 -28% |
| Response Times | 8% | 9% | -18% | -4% | 5% | |
| Response Time Grey 50% / Grey 80% * (ms) | 41 ? | 43.2 ? -5% | 39 ? 5% | 56.8 ? -39% | 44.4 ? -8% | 44 ? -7% |
| Response Time Black / White * (ms) | 30 ? | 24 ? 20% | 26 ? 13% | 28.8 ? 4% | 29.6 ? 1% | 25 ? 17% |
| PWM Frequency (Hz) | 192 ? | 200 ? | ||||
| Screen | 1% | 21% | -19% | 11% | 28% | |
| Brightness middle (cd/m²) | 343 | 315 -8% | 323 -6% | 229 -33% | 245 -29% | 254 -26% |
| Brightness (cd/m²) | 332 | 304 -8% | 316 -5% | 207 -38% | 225 -32% | 243 -27% |
| Brightness Distribution (%) | 88 | 93 6% | 79 -10% | 80 -9% | 83 -6% | 90 2% |
| Black Level * (cd/m²) | 0.69 | 0.61 12% | 0.57 17% | 0.69 -0% | 0.24 65% | 0.19 72% |
| Contrast (:1) | 497 | 516 4% | 567 14% | 332 -33% | 1021 105% | 1337 169% |
| Colorchecker dE 2000 * | 9.06 | 8.8 3% | 3.68 59% | 10.16 -12% | 6.89 24% | 4.93 46% |
| Colorchecker dE 2000 max. * | 14.84 | 15.03 -1% | 8.33 44% | 17.18 -16% | 17.62 -19% | 10.14 32% |
| Greyscale dE 2000 * | 9.87 | 9.44 4% | 2.99 70% | 10.87 -10% | 6.45 35% | 2.71 73% |
| Gamma | 2.5 88% | 2.53 87% | 2.49 88% | 2.41 91% | 2.46 89% | 2.36 93% |
| CCT | 11115 58% | 11794 55% | 6572 99% | 12881 50% | 6857 95% | 6914 94% |
| Color Space (Percent of AdobeRGB 1998) (%) | 47 | 47.37 1% | 55 17% | 38.4 -18% | 40.1 -15% | 34 -28% |
| Color Space (Percent of sRGB) (%) | 75 | 74.78 0% | 85 13% | 60.4 -19% | 61.8 -18% | 53 -29% |
| Teljes átlag (program / beállítások) | 3% /
2% | 17% /
20% | -19% /
-19% | -3% /
4% | 2% /
14% |
* ... a kisebb jobb
Képernyő villogása / PWM (impulzusszélesség-moduláció)
| Képernyő villogása / PWM észlelve | 192 Hz | ≤ 90 % fényerő beállítása | 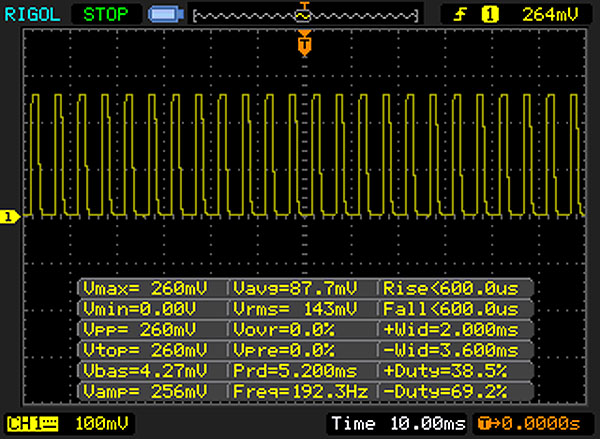 |
A kijelző háttérvilágítása 192 Hz-en villog (a legrosszabb esetben, pl. PWM használatával) Villódzás észlelve a 90 % vagy annál kisebb fényerő-beállításnál. E fényerő-beállítás felett nem lehet villogás vagy PWM. A 192 Hz frekvenciája viszonylag alacsony, így az érzékeny felhasználók valószínűleg villogást észlelnek, és megerőltetik a szemüket a megadott és az alatti fényerő-beállítás mellett. Összehasonlításképpen: az összes tesztelt eszköz 52 %-a nem használja a PWM-et a kijelző elsötétítésére. Ha PWM-et észleltek, akkor átlagosan 7754 (minimum: 5 - maximum: 343500) Hz-t mértek. | |||

Megjelenítési válaszidők
| ↔ Válaszidő Fekete-fehér | ||
|---|---|---|
| 30 ms ... emelkedés és süllyedés ↘ kombinálva | ↗ 13 ms emelkedés | 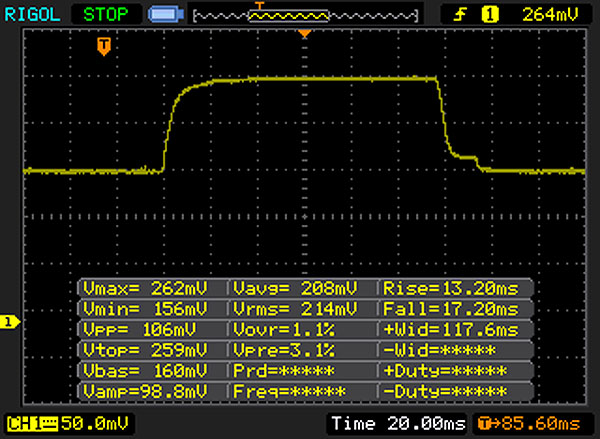 |
| ↘ 17 ms ősz | ||
| A képernyő lassú reakciósebességet mutat tesztjeinkben, és nem lesz kielégítő a játékosok számára. Összehasonlításképpen, az összes tesztelt eszköz 0.1 (minimum) és 240 (maximum) ms között mozog. » 80 % of all devices are better. Ez azt jelenti, hogy a mért válaszidő rosszabb, mint az összes vizsgált eszköz átlaga (19.8 ms). | ||
| ↔ Válaszidő 50% szürke és 80% szürke között | ||
| 41 ms ... emelkedés és süllyedés ↘ kombinálva | ↗ 19 ms emelkedés | 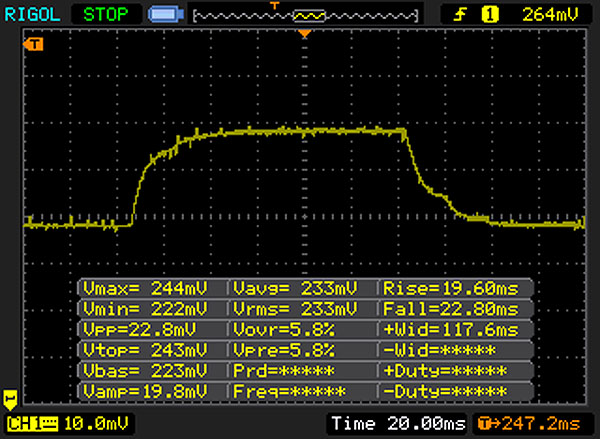 |
| ↘ 22 ms ősz | ||
| A képernyő lassú reakciósebességet mutat tesztjeinkben, és nem lesz kielégítő a játékosok számára. Összehasonlításképpen, az összes tesztelt eszköz 0.165 (minimum) és 636 (maximum) ms között mozog. » 65 % of all devices are better. Ez azt jelenti, hogy a mért válaszidő rosszabb, mint az összes vizsgált eszköz átlaga (31 ms). | ||
| Cinebench R15 | |
| CPU Single 64Bit | |
| Dell Latitude 14 E5470 | |
| Lenovo ThinkPad L460-20FVS01400 | |
| HP ProBook 640 G3 Z2W33ET | |
| Dell Latitude 14 E5470 | |
| HP ProBook 640 G2-T9X60ET | |
| Acer TravelMate P648-M-757N | |
| CPU Multi 64Bit | |
| Dell Latitude 14 E5470 | |
| HP ProBook 640 G3 Z2W33ET | |
| Dell Latitude 14 E5470 | |
| Lenovo ThinkPad L460-20FVS01400 | |
| HP ProBook 640 G2-T9X60ET | |
| Acer TravelMate P648-M-757N | |
| Cinebench R11.5 | |
| CPU Multi 64Bit | |
| Dell Latitude 14 E5470 | |
| HP ProBook 640 G3 Z2W33ET | |
| Dell Latitude 14 E5470 | |
| Lenovo ThinkPad L460-20FVS01400 | |
| HP ProBook 640 G2-T9X60ET | |
| Acer TravelMate P648-M-757N | |
| CPU Single 64Bit | |
| HP ProBook 640 G3 Z2W33ET | |
| Dell Latitude 14 E5470 | |
| Dell Latitude 14 E5470 | |
| Lenovo ThinkPad L460-20FVS01400 | |
| HP ProBook 640 G2-T9X60ET | |
| Acer TravelMate P648-M-757N | |
| Cinebench R10 | |
| Rendering Multiple CPUs 32Bit | |
| Dell Latitude 14 E5470 | |
| HP ProBook 640 G3 Z2W33ET | |
| Lenovo ThinkPad L460-20FVS01400 | |
| Dell Latitude 14 E5470 | |
| HP ProBook 640 G2-T9X60ET | |
| Acer TravelMate P648-M-757N | |
| Rendering Single 32Bit | |
| HP ProBook 640 G3 Z2W33ET | |
| Lenovo ThinkPad L460-20FVS01400 | |
| Dell Latitude 14 E5470 | |
| Dell Latitude 14 E5470 | |
| HP ProBook 640 G2-T9X60ET | |
| Acer TravelMate P648-M-757N | |
| Geekbench 3 | |
| 32 Bit Single-Core Score | |
| Acer TravelMate P648-M-757N | |
| HP ProBook 640 G3 Z2W33ET | |
| Lenovo ThinkPad L460-20FVS01400 | |
| 32 Bit Multi-Core Score | |
| Acer TravelMate P648-M-757N | |
| HP ProBook 640 G3 Z2W33ET | |
| Lenovo ThinkPad L460-20FVS01400 | |
| Geekbench 4.0 | |
| 64 Bit Single-Core Score | |
| HP ProBook 640 G3 Z2W33ET | |
| 64 Bit Multi-Core Score | |
| HP ProBook 640 G3 Z2W33ET | |
| JetStream 1.1 - 1.1 Total | |
| HP ProBook 640 G3 Z2W33ET | |
| Dell Latitude 14 E5470 | |
| Lenovo ThinkPad L460-20FVS01400 | |
| HP ProBook 640 G2-T9X60ET | |
| Acer TravelMate P648-M-757N | |
| PCMark 7 Score | 5067 pontok | |
| PCMark 8 Home Score Accelerated v2 | 3414 pontok | |
| PCMark 8 Creative Score Accelerated v2 | 4274 pontok | |
| PCMark 8 Work Score Accelerated v2 | 4545 pontok | |
Segítség | ||
| PCMark 8 | |
| Home Score Accelerated v2 | |
| Acer TravelMate P648-M-757N | |
| Dell Latitude 14 E5470 | |
| Dell Latitude 14 E5470 | |
| HP ProBook 640 G3 Z2W33ET | |
| HP ProBook 640 G2-T9X60ET | |
| Lenovo ThinkPad L460-20FVS01400 | |
| Work Score Accelerated v2 | |
| Dell Latitude 14 E5470 | |
| Dell Latitude 14 E5470 | |
| Acer TravelMate P648-M-757N | |
| Lenovo ThinkPad L460-20FVS01400 | |
| HP ProBook 640 G3 Z2W33ET | |
| HP ProBook 640 G2-T9X60ET | |

| HP ProBook 640 G3 Z2W33ET Samsung PM951 NVMe MZVLV256 | HP ProBook 640 G2-T9X60ET Samsung SSD PM871 MZNLN256HCHP | Dell Latitude 14 E5470 Micron SSD 1100 (MTFDDAV256TBN) | Dell Latitude 14 E5470 Liteon L8H-256V2G | Lenovo ThinkPad L460-20FVS01400 Toshiba HG6 THNSFJ256GCSU | Acer TravelMate P648-M-757N Lite-On CV1-8B256 | |
|---|---|---|---|---|---|---|
| CrystalDiskMark 3.0 | -22% | -34% | -26% | -31% | -25% | |
| Read Seq (MB/s) | 1285 | 492.8 -62% | 465.4 -64% | 508 -60% | 480.9 -63% | 531 -59% |
| Write Seq (MB/s) | 283.6 | 303.2 7% | 363.1 28% | 360.6 27% | 426.4 50% | 358.8 27% |
| Read 512 (MB/s) | 679 | 417.4 -39% | 338.4 -50% | 374.1 -45% | 361.8 -47% | 384.8 -43% |
| Write 512 (MB/s) | 300.8 | 301.5 0% | 246.1 -18% | 300.2 0% | 220.9 -27% | 363 21% |
| Read 4k (MB/s) | 41.79 | 33.28 -20% | 25.83 -38% | 31.98 -23% | 21.51 -49% | 31.3 -25% |
| Write 4k (MB/s) | 138.6 | 84.6 -39% | 80.3 -42% | 93.1 -33% | 71.5 -48% | 80.3 -42% |
| Read 4k QD32 (MB/s) | 507 | 394.2 -22% | 246.1 -51% | 274.7 -46% | 277.6 -45% | 239.4 -53% |
| Write 4k QD32 (MB/s) | 293.3 | 295.5 1% | 197.7 -33% | 205.6 -30% | 230.4 -21% | 225.3 -23% |
| 3DMark 06 Standard Score | 7879 pontok | |
| 3DMark 11 Performance | 1541 pontok | |
| 3DMark Ice Storm Standard Score | 52206 pontok | |
| 3DMark Cloud Gate Standard Score | 5693 pontok | |
| 3DMark Fire Strike Score | 754 pontok | |
| 3DMark Fire Strike Extreme Score | 337 pontok | |
Segítség | ||
| 3DMark 11 - 1280x720 Performance GPU | |
| Lenovo ThinkPad L460-20FVS01400 | |
| HP ProBook 640 G3 Z2W33ET | |
| HP ProBook 640 G2-T9X60ET | |
| Dell Latitude 14 E5470 | |
| Dell Latitude 14 E5470 | |
| Acer TravelMate P648-M-757N | |
| 3DMark | |
| 1280x720 Cloud Gate Standard Graphics | |
| HP ProBook 640 G3 Z2W33ET | |
| Acer TravelMate P648-M-757N | |
| HP ProBook 640 G2-T9X60ET | |
| Dell Latitude 14 E5470 | |
| Dell Latitude 14 E5470 | |
| Lenovo ThinkPad L460-20FVS01400 | |
| 1920x1080 Fire Strike Graphics | |
| Lenovo ThinkPad L460-20FVS01400 | |
| Acer TravelMate P648-M-757N | |
| HP ProBook 640 G3 Z2W33ET | |
| Dell Latitude 14 E5470 | |
| HP ProBook 640 G2-T9X60ET | |
| Dell Latitude 14 E5470 | |
| alacsony | közepes | magas | ultra | |
|---|---|---|---|---|
| Tomb Raider (2013) | 65.6 | 33.4 | 19.2 | 9.7 |
| BioShock Infinite (2013) | 39.9 | 24.5 | 20.2 | 7.1 |
| Battlefield 4 (2013) | 30.7 | 24.5 | 15.9 | 5.3 |
Zajszint
| Üresjárat |
| 30.7 / 30.7 / 31.5 dB(A) |
| DVD |
| 35.7 / dB(A) |
| Terhelés |
| 31.4 / 31.1 dB(A) |
 | ||
30 dB csendes 40 dB(A) hallható 50 dB(A) hangos |
||
min: | ||
| HP ProBook 640 G3 Z2W33ET i5-7200U, HD Graphics 620 | HP ProBook 640 G2-T9X60ET 6200U, HD Graphics 520 | Dell Latitude 14 E5470 6440HQ, HD Graphics 530 | Dell Latitude 14 E5470 6300U, HD Graphics 520 | Lenovo ThinkPad L460-20FVS01400 6500U, Radeon R5 M330 | Acer TravelMate P648-M-757N 6500U, HD Graphics 520 | |
|---|---|---|---|---|---|---|
| Noise | 2% | -1% | 0% | -0% | -3% | |
| off / környezet * (dB) | 30.7 | 29 6% | 30.3 1% | 29.2 5% | 29.2 5% | 31.2 -2% |
| Idle Minimum * (dB) | 30.7 | 29 6% | 30.3 1% | 29.2 5% | 29.2 5% | 31.2 -2% |
| Idle Average * (dB) | 30.7 | 29.8 3% | 30.3 1% | 29.2 5% | 29.2 5% | 31.2 -2% |
| Idle Maximum * (dB) | 31.5 | 30.2 4% | 30.3 4% | 29.2 7% | 29.2 7% | 31.6 -0% |
| Load Average * (dB) | 31.4 | 30.2 4% | 31.6 -1% | 32.1 -2% | 32.5 -4% | 33.3 -6% |
| Load Maximum * (dB) | 31.1 | 33.9 -9% | 35 -13% | 36.8 -18% | 37.2 -20% | 32.4 -4% |
* ... a kisebb jobb
(+) A felső oldalon a maximális hőmérséklet 34 °C / 93 F, összehasonlítva a 34.3 °C / 94 F átlagával , 21.2 és 62.5 °C között a Office osztálynál.
(+) Az alsó maximum 33.2 °C / 92 F-ig melegszik fel, összehasonlítva a 36.8 °C / 98 F átlagával
(+) Üresjáratban a felső oldal átlagos hőmérséklete 24.9 °C / 77 F, összehasonlítva a 29.5 °C / ### eszközátlaggal class_avg_f### F.
(+) A csuklótámasz és az érintőpad hűvösebb, mint a bőr hőmérséklete, maximum 25.6 °C / 78.1 F, ezért hűvös tapintású.
(±) A hasonló eszközök csuklótámasz területének átlagos hőmérséklete 27.5 °C / 81.5 F volt (+1.9 °C / 3.4 F).
| HP ProBook 640 G3 Z2W33ET i5-7200U, HD Graphics 620 | HP ProBook 640 G2-T9X60ET 6200U, HD Graphics 520 | Dell Latitude 14 E5470 6440HQ, HD Graphics 530 | Dell Latitude 14 E5470 6300U, HD Graphics 520 | Lenovo ThinkPad L460-20FVS01400 6500U, Radeon R5 M330 | Acer TravelMate P648-M-757N 6500U, HD Graphics 520 | |
|---|---|---|---|---|---|---|
| Heat | -21% | -25% | -17% | -20% | -15% | |
| Maximum Upper Side * (°C) | 34 | 40.7 -20% | 43 -26% | 41.5 -22% | 40.8 -20% | 38.5 -13% |
| Maximum Bottom * (°C) | 33.2 | 42.6 -28% | 43 -30% | 41.4 -25% | 51.9 -56% | 36.7 -11% |
| Idle Upper Side * (°C) | 25.6 | 29.9 -17% | 31.2 -22% | 26.9 -5% | 25.2 2% | 31.5 -23% |
| Idle Bottom * (°C) | 26 | 30.3 -17% | 31.3 -20% | 29.6 -14% | 27.6 -6% | 29.6 -14% |
* ... a kisebb jobb
HP ProBook 640 G3 Z2W33ET hangelemzés
(-) | nem túl hangos hangszórók (70 dB)
Basszus 100 - 315 Hz
(-) | szinte nincs basszus – átlagosan 15%-kal alacsonyabb a mediánnál
(±) | a basszus linearitása átlagos (7.5% delta az előző frekvenciához)
Közepes 400-2000 Hz
(+) | kiegyensúlyozott középpontok – csak 4.1% választja el a mediántól
(+) | a középpontok lineárisak (6.1% delta az előző frekvenciához)
Maximum 2-16 kHz
(±) | magasabb csúcsok – átlagosan 8.8%-kal magasabb, mint a medián
(+) | a csúcsok lineárisak (4.6% delta az előző frekvenciához képest)
Összességében 100 - 16.000 Hz
(±) | az általános hang linearitása átlagos (22.2% eltérés a mediánhoz képest)
Ugyanazon osztályhoz képest
» 58%Ebben az osztályban az összes tesztelt eszköz %-a jobb volt, 9% hasonló, 33%-kal rosszabb
» A legjobb delta értéke 7%, az átlag 21%, a legrosszabb 53% volt
Az összes tesztelt eszközzel összehasonlítva
» 65% az összes tesztelt eszköz jobb volt, 6% hasonló, 29%-kal rosszabb
» A legjobb delta értéke 4%, az átlag 23%, a legrosszabb 134% volt
Apple MacBook 12 (Early 2016) 1.1 GHz hangelemzés
(+) | a hangszórók viszonylag hangosan tudnak játszani (83.6 dB)
Basszus 100 - 315 Hz
(±) | csökkentett basszus – átlagosan 11.3%-kal alacsonyabb, mint a medián
(±) | a basszus linearitása átlagos (14.2% delta az előző frekvenciához)
Közepes 400-2000 Hz
(+) | kiegyensúlyozott középpontok – csak 2.4% választja el a mediántól
(+) | a középpontok lineárisak (5.5% delta az előző frekvenciához)
Maximum 2-16 kHz
(+) | kiegyensúlyozott csúcsok – csak 2% választja el a mediántól
(+) | a csúcsok lineárisak (4.5% delta az előző frekvenciához képest)
Összességében 100 - 16.000 Hz
(+) | általános hangzás lineáris (10.2% eltérés a mediánhoz képest)
Ugyanazon osztályhoz képest
» 7%Ebben az osztályban az összes tesztelt eszköz %-a jobb volt, 2% hasonló, 90%-kal rosszabb
» A legjobb delta értéke 5%, az átlag 18%, a legrosszabb 53% volt
Az összes tesztelt eszközzel összehasonlítva
» 5% az összes tesztelt eszköz jobb volt, 1% hasonló, 94%-kal rosszabb
» A legjobb delta értéke 4%, az átlag 23%, a legrosszabb 134% volt
| Kikapcsolt állapot / Készenlét | |
| Üresjárat | |
| Terhelés |
|
Kulcs:
min: | |
| HP ProBook 640 G3 Z2W33ET i5-7200U, HD Graphics 620 | HP ProBook 640 G2-T9X60ET 6200U, HD Graphics 520 | Dell Latitude 14 E5470 6440HQ, HD Graphics 530 | Dell Latitude 14 E5470 6300U, HD Graphics 520 | Lenovo ThinkPad L460-20FVS01400 6500U, Radeon R5 M330 | Acer TravelMate P648-M-757N 6500U, HD Graphics 520 | |
|---|---|---|---|---|---|---|
| Power Consumption | -22% | -66% | -17% | -41% | -68% | |
| Idle Minimum * (Watt) | 2.3 | 3.3 -43% | 4.1 -78% | 3.5 -52% | 3.1 -35% | 5.3 -130% |
| Idle Average * (Watt) | 5.2 | 6 -15% | 8.1 -56% | 5.3 -2% | 6.3 -21% | 9.3 -79% |
| Idle Maximum * (Watt) | 5.6 | 6.9 -23% | 11.4 -104% | 6 -7% | 7.9 -41% | 11.5 -105% |
| Load Average * (Watt) | 27.2 | 27.7 -2% | 33.5 -23% | 26.3 3% | 29.5 -8% | 30.8 -13% |
| Load Maximum * (Watt) | 28.7 | 36.6 -28% | 49 -71% | 36.6 -28% | 57.3 -100% | 32 -11% |
* ... a kisebb jobb
| HP ProBook 640 G3 Z2W33ET i5-7200U, HD Graphics 620, 46 Wh | HP ProBook 640 G2-T9X60ET 6200U, HD Graphics 520, 46 Wh | Dell Latitude 14 E5470 6440HQ, HD Graphics 530, 62 Wh | Dell Latitude 14 E5470 6300U, HD Graphics 520, 62 Wh | Lenovo ThinkPad L460-20FVS01400 6500U, Radeon R5 M330, 48 Wh | Acer TravelMate P648-M-757N 6500U, HD Graphics 520, 54 Wh | |
|---|---|---|---|---|---|---|
| Akkumulátor üzemidő | -9% | -32% | 9% | -26% | -14% | |
| Reader / Idle (h) | 24.6 | 16.6 -33% | 15.2 -38% | 21.7 -12% | 19.2 -22% | 18.1 -26% |
| H.264 (h) | 8.7 | 6.9 -21% | 10.8 24% | 7.2 -17% | 9.1 5% | |
| WiFi v1.3 (h) | 8.7 | 9.6 10% | 7.2 -17% | 11.1 28% | 7.1 -18% | 9.1 5% |
| Load (h) | 3 | 2.9 -3% | 1.4 -53% | 2.9 -3% | 1.6 -47% | 1.8 -40% |
Pro
Kontra
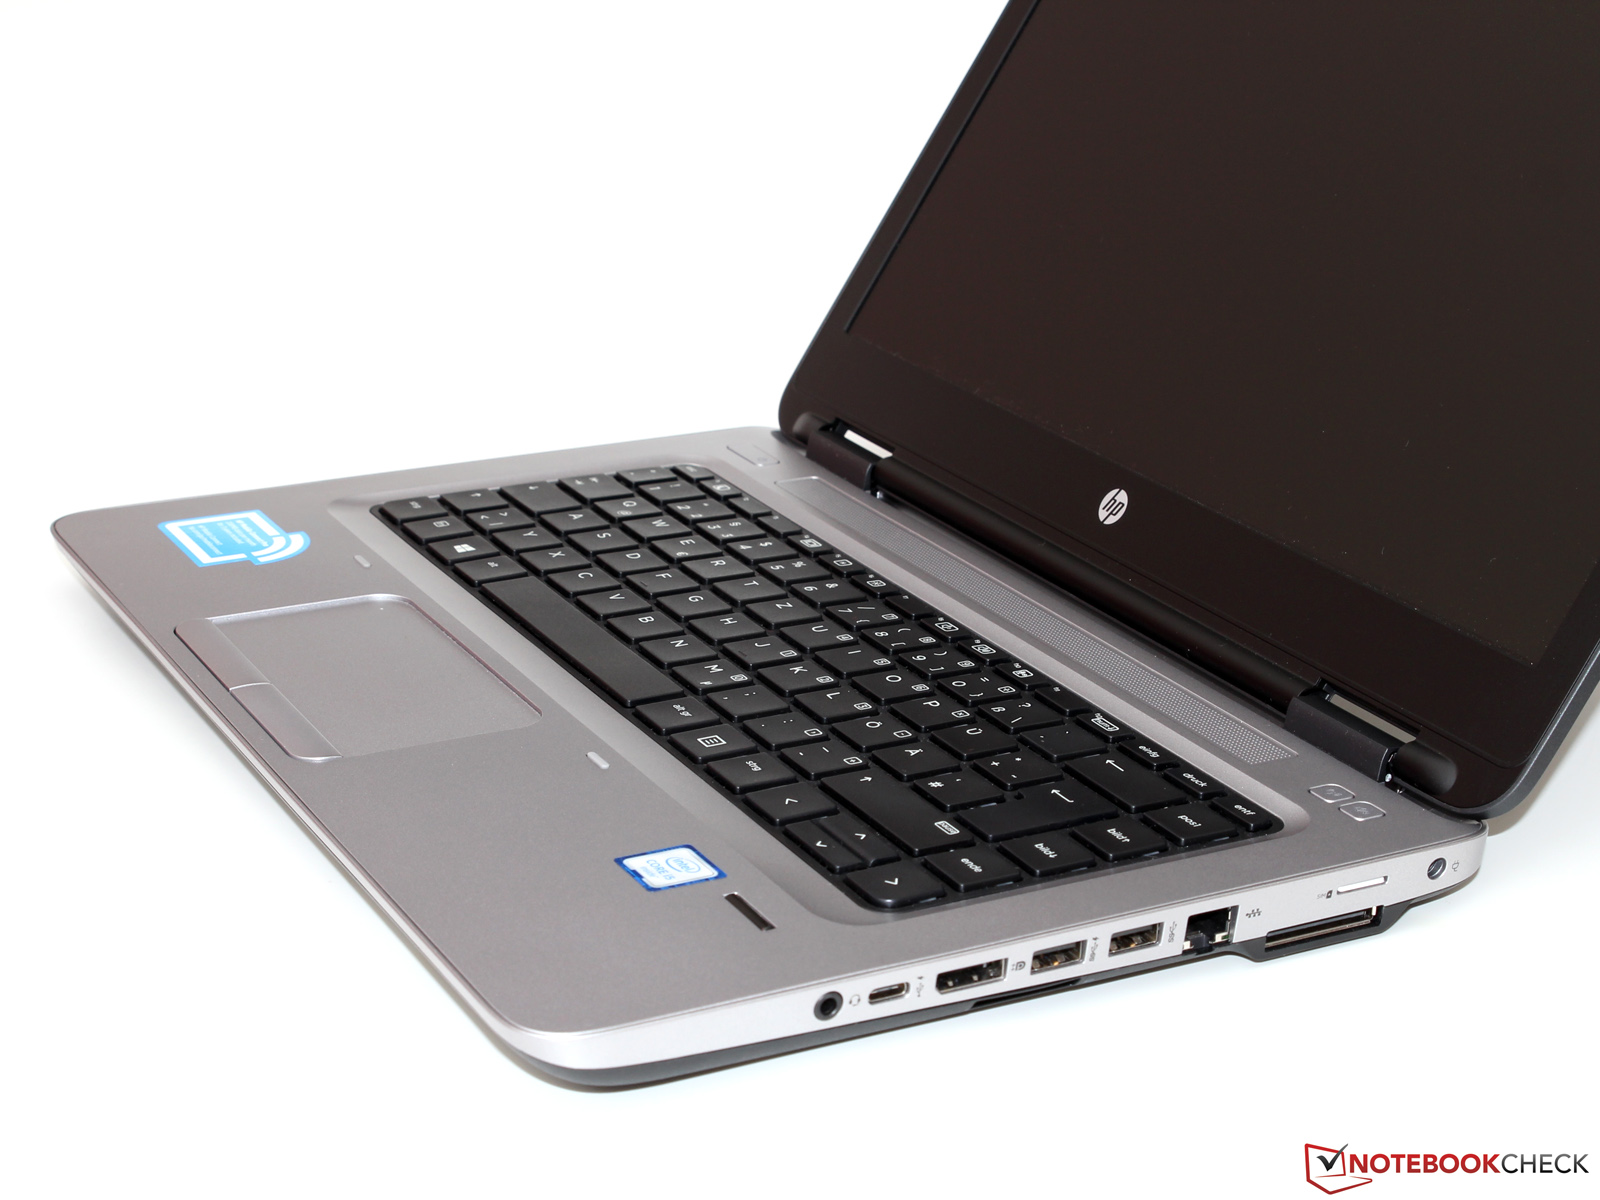
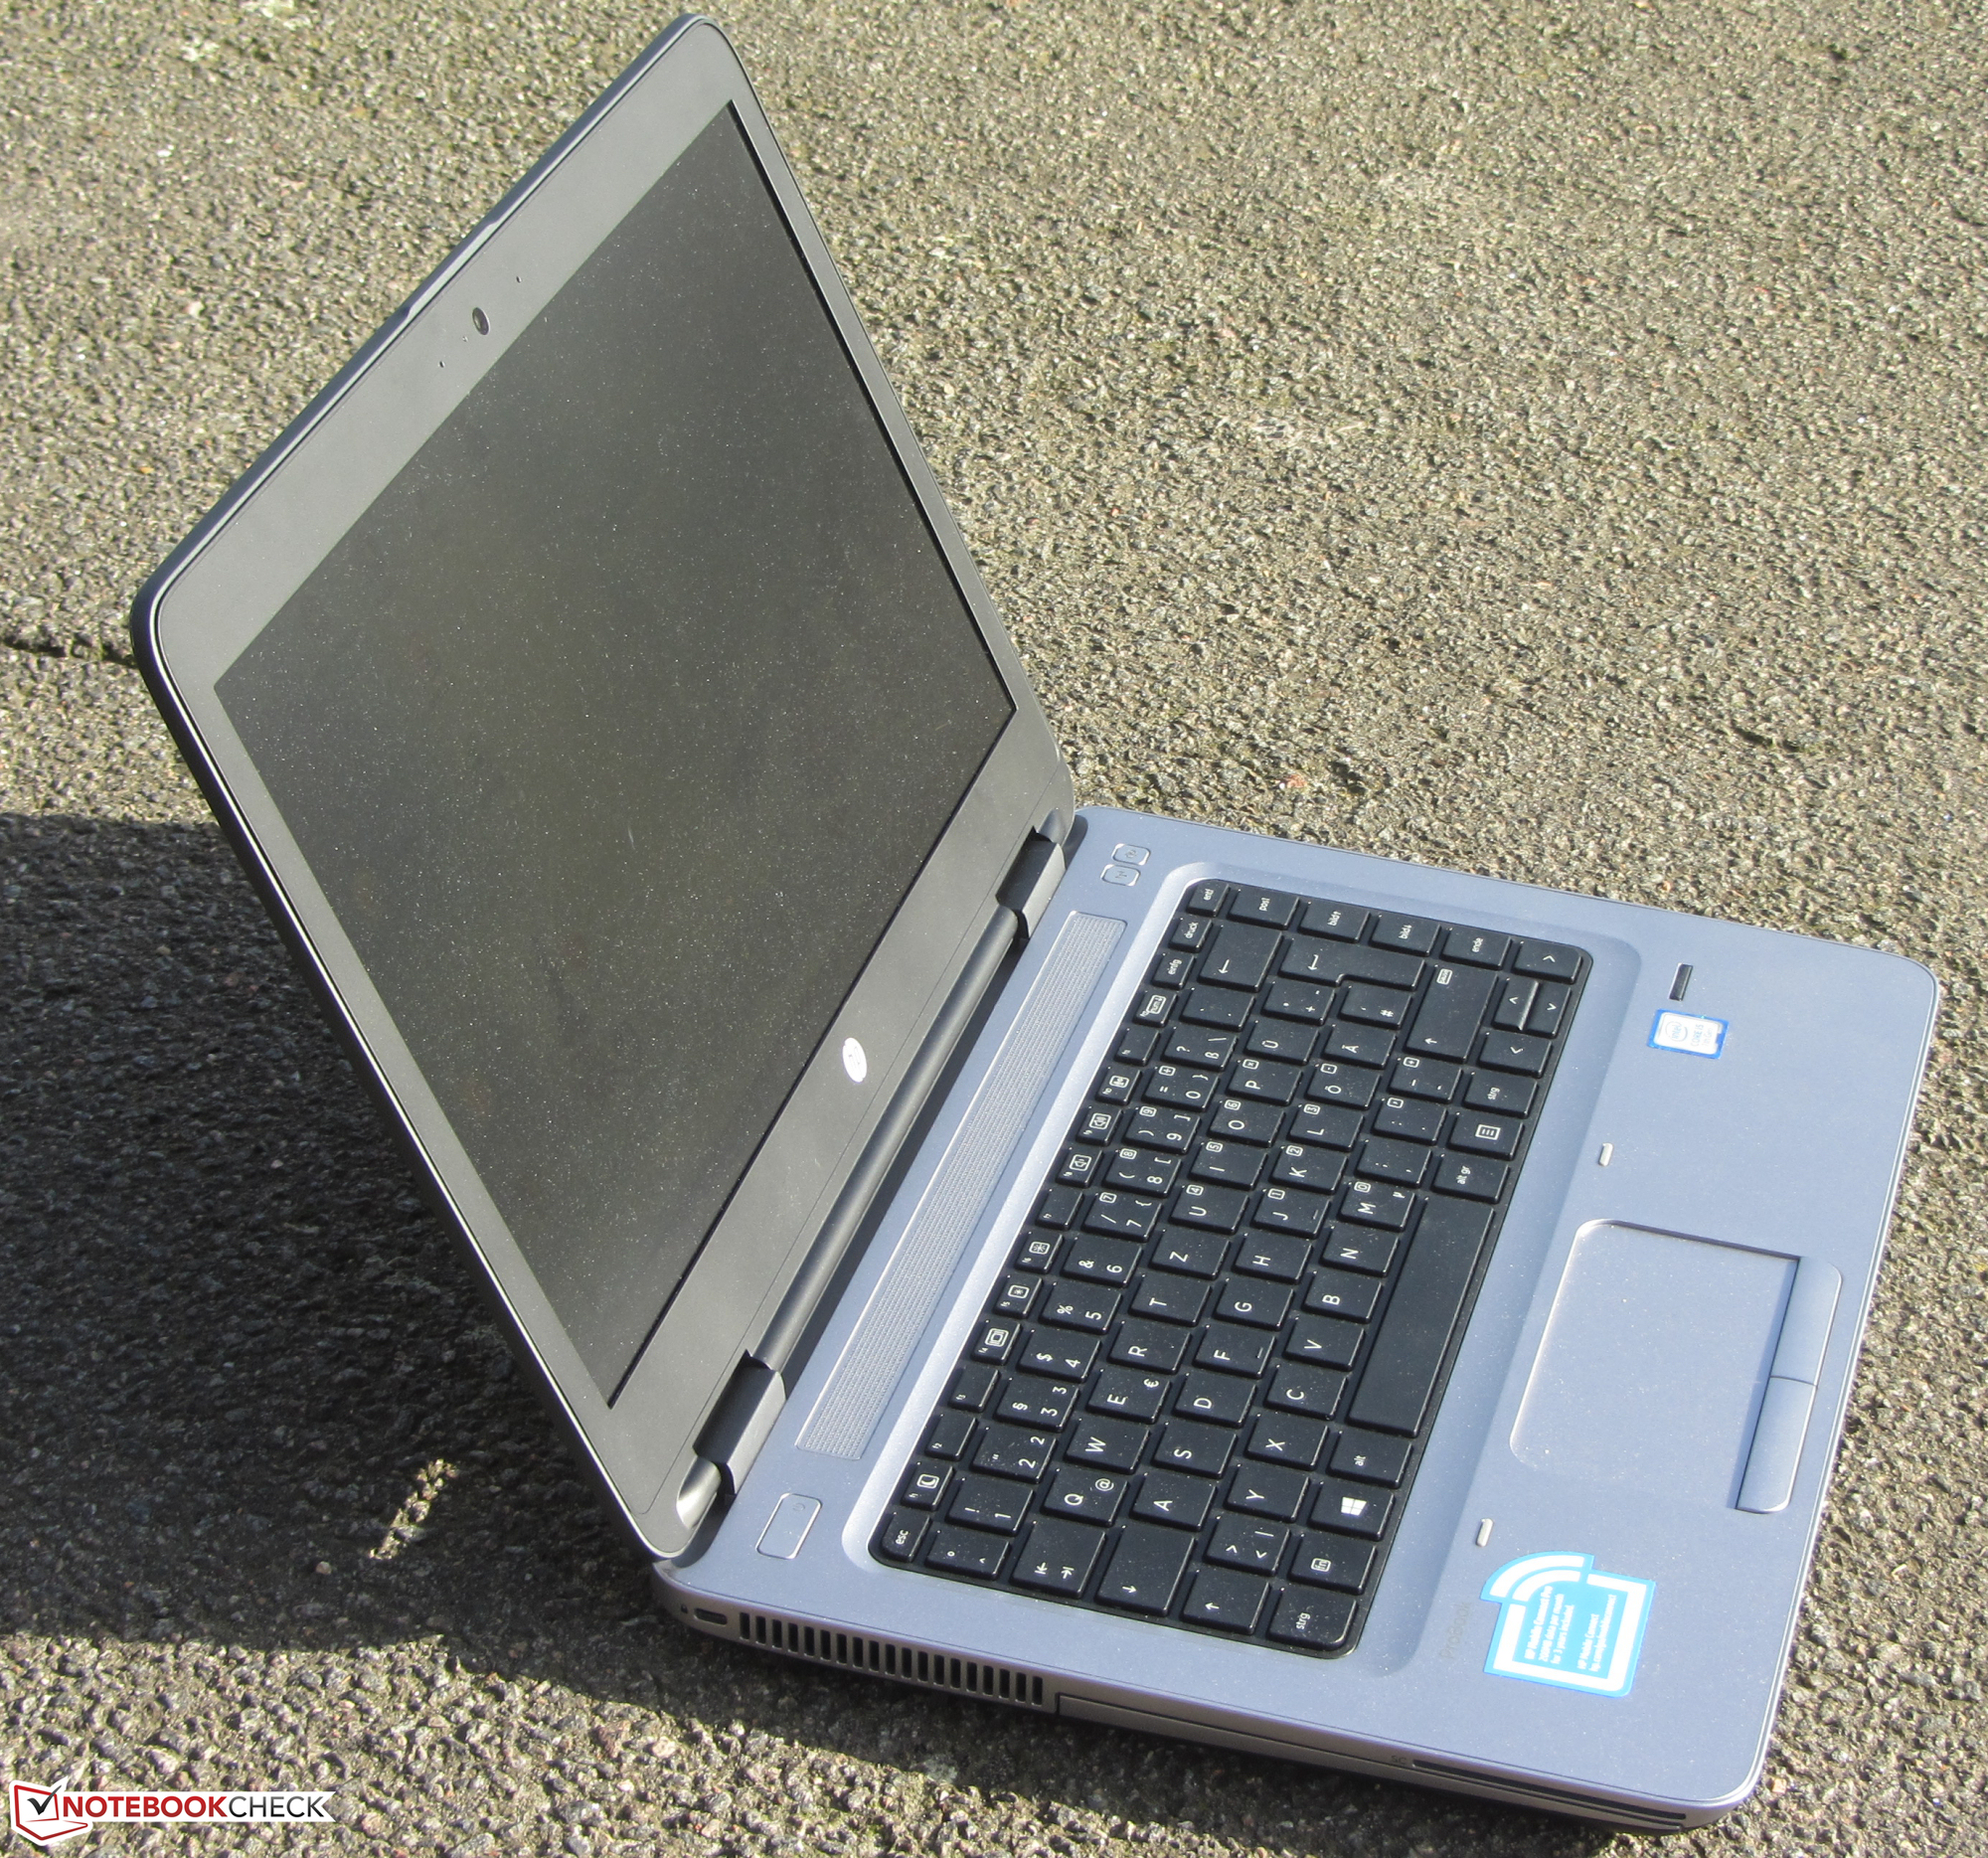
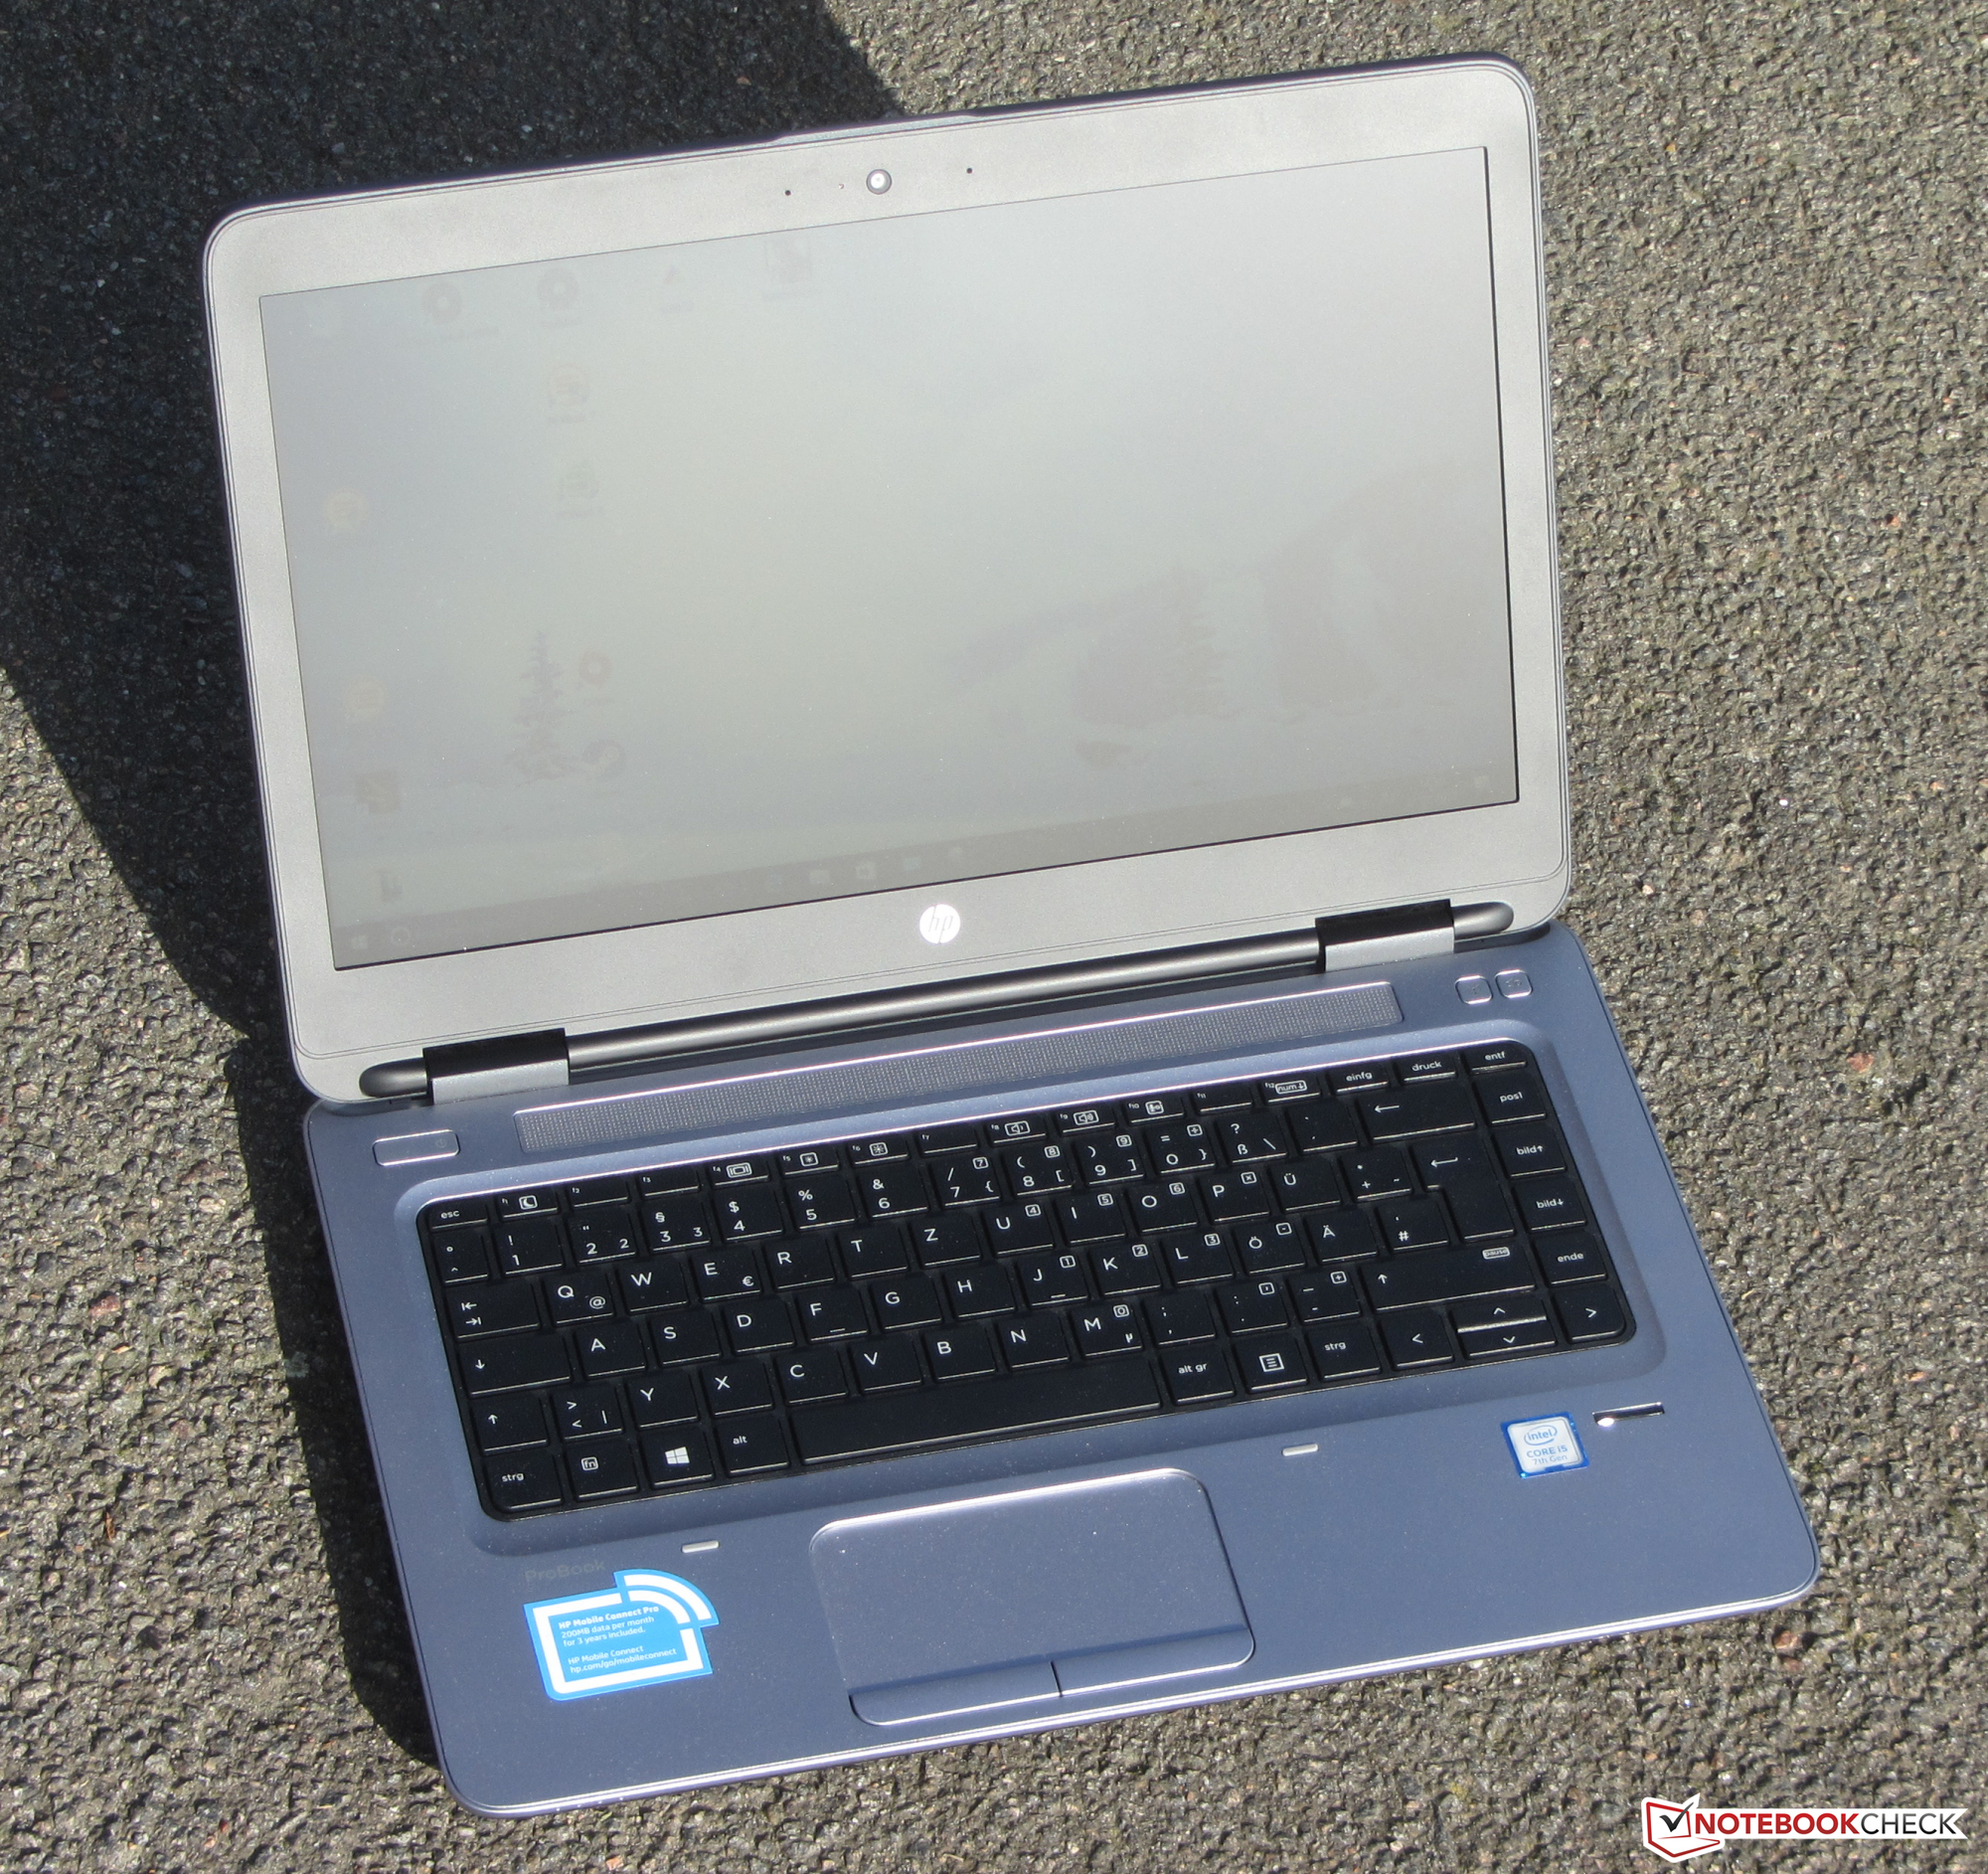
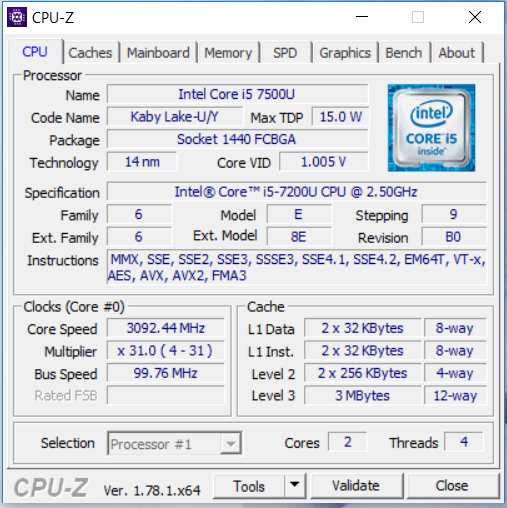
A Kaby Lake processzornak hála, a ProBook nagy alkalmazásteljesítményt kínál. Ugyanakkor a Skylake processzoros elődjéhez képest nincs komoly előnye. A laptop a teljes terhelési spektrumon néma, vagy legalábbis halk marad, és alig melegszik. Ez komoly előny egy munkára szánt gépnél. A beépített NVMe SSD gyorsan futó rendszerről gondoskodik. Az SSD cseréje könnyedén megoldható az alsó burkolat eltávolításával.
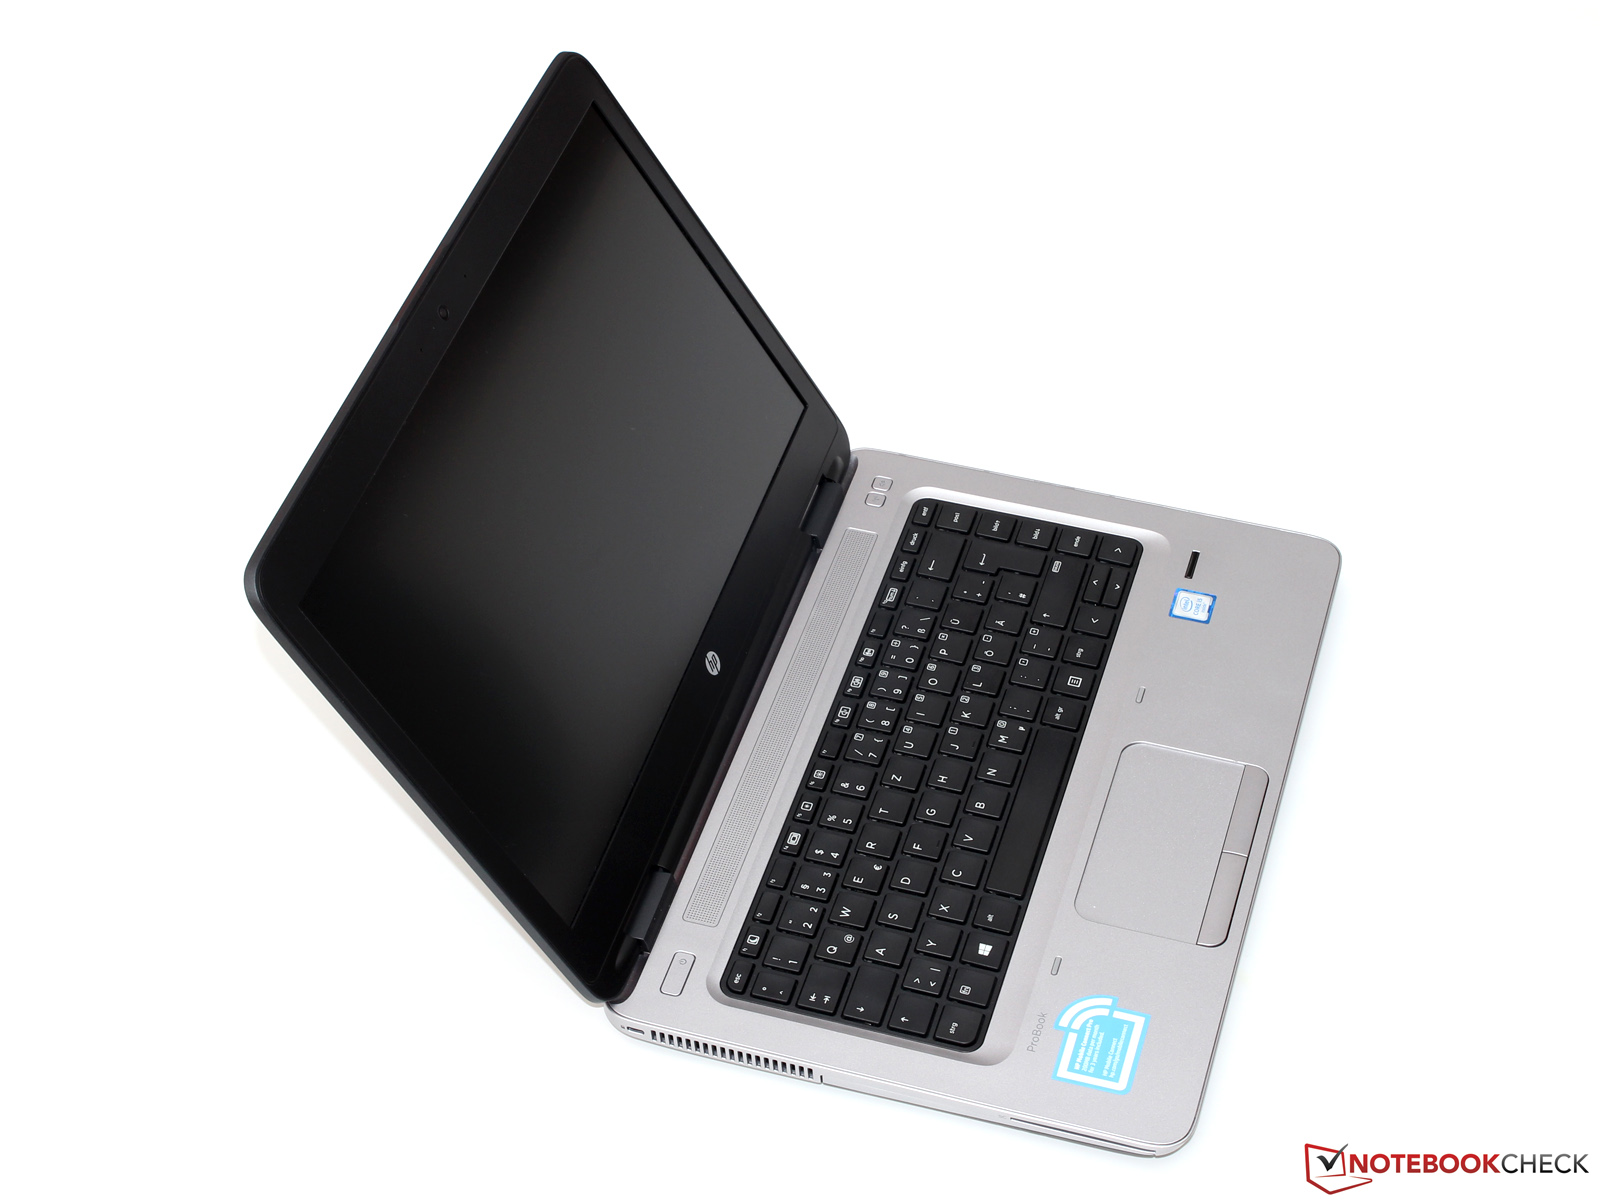
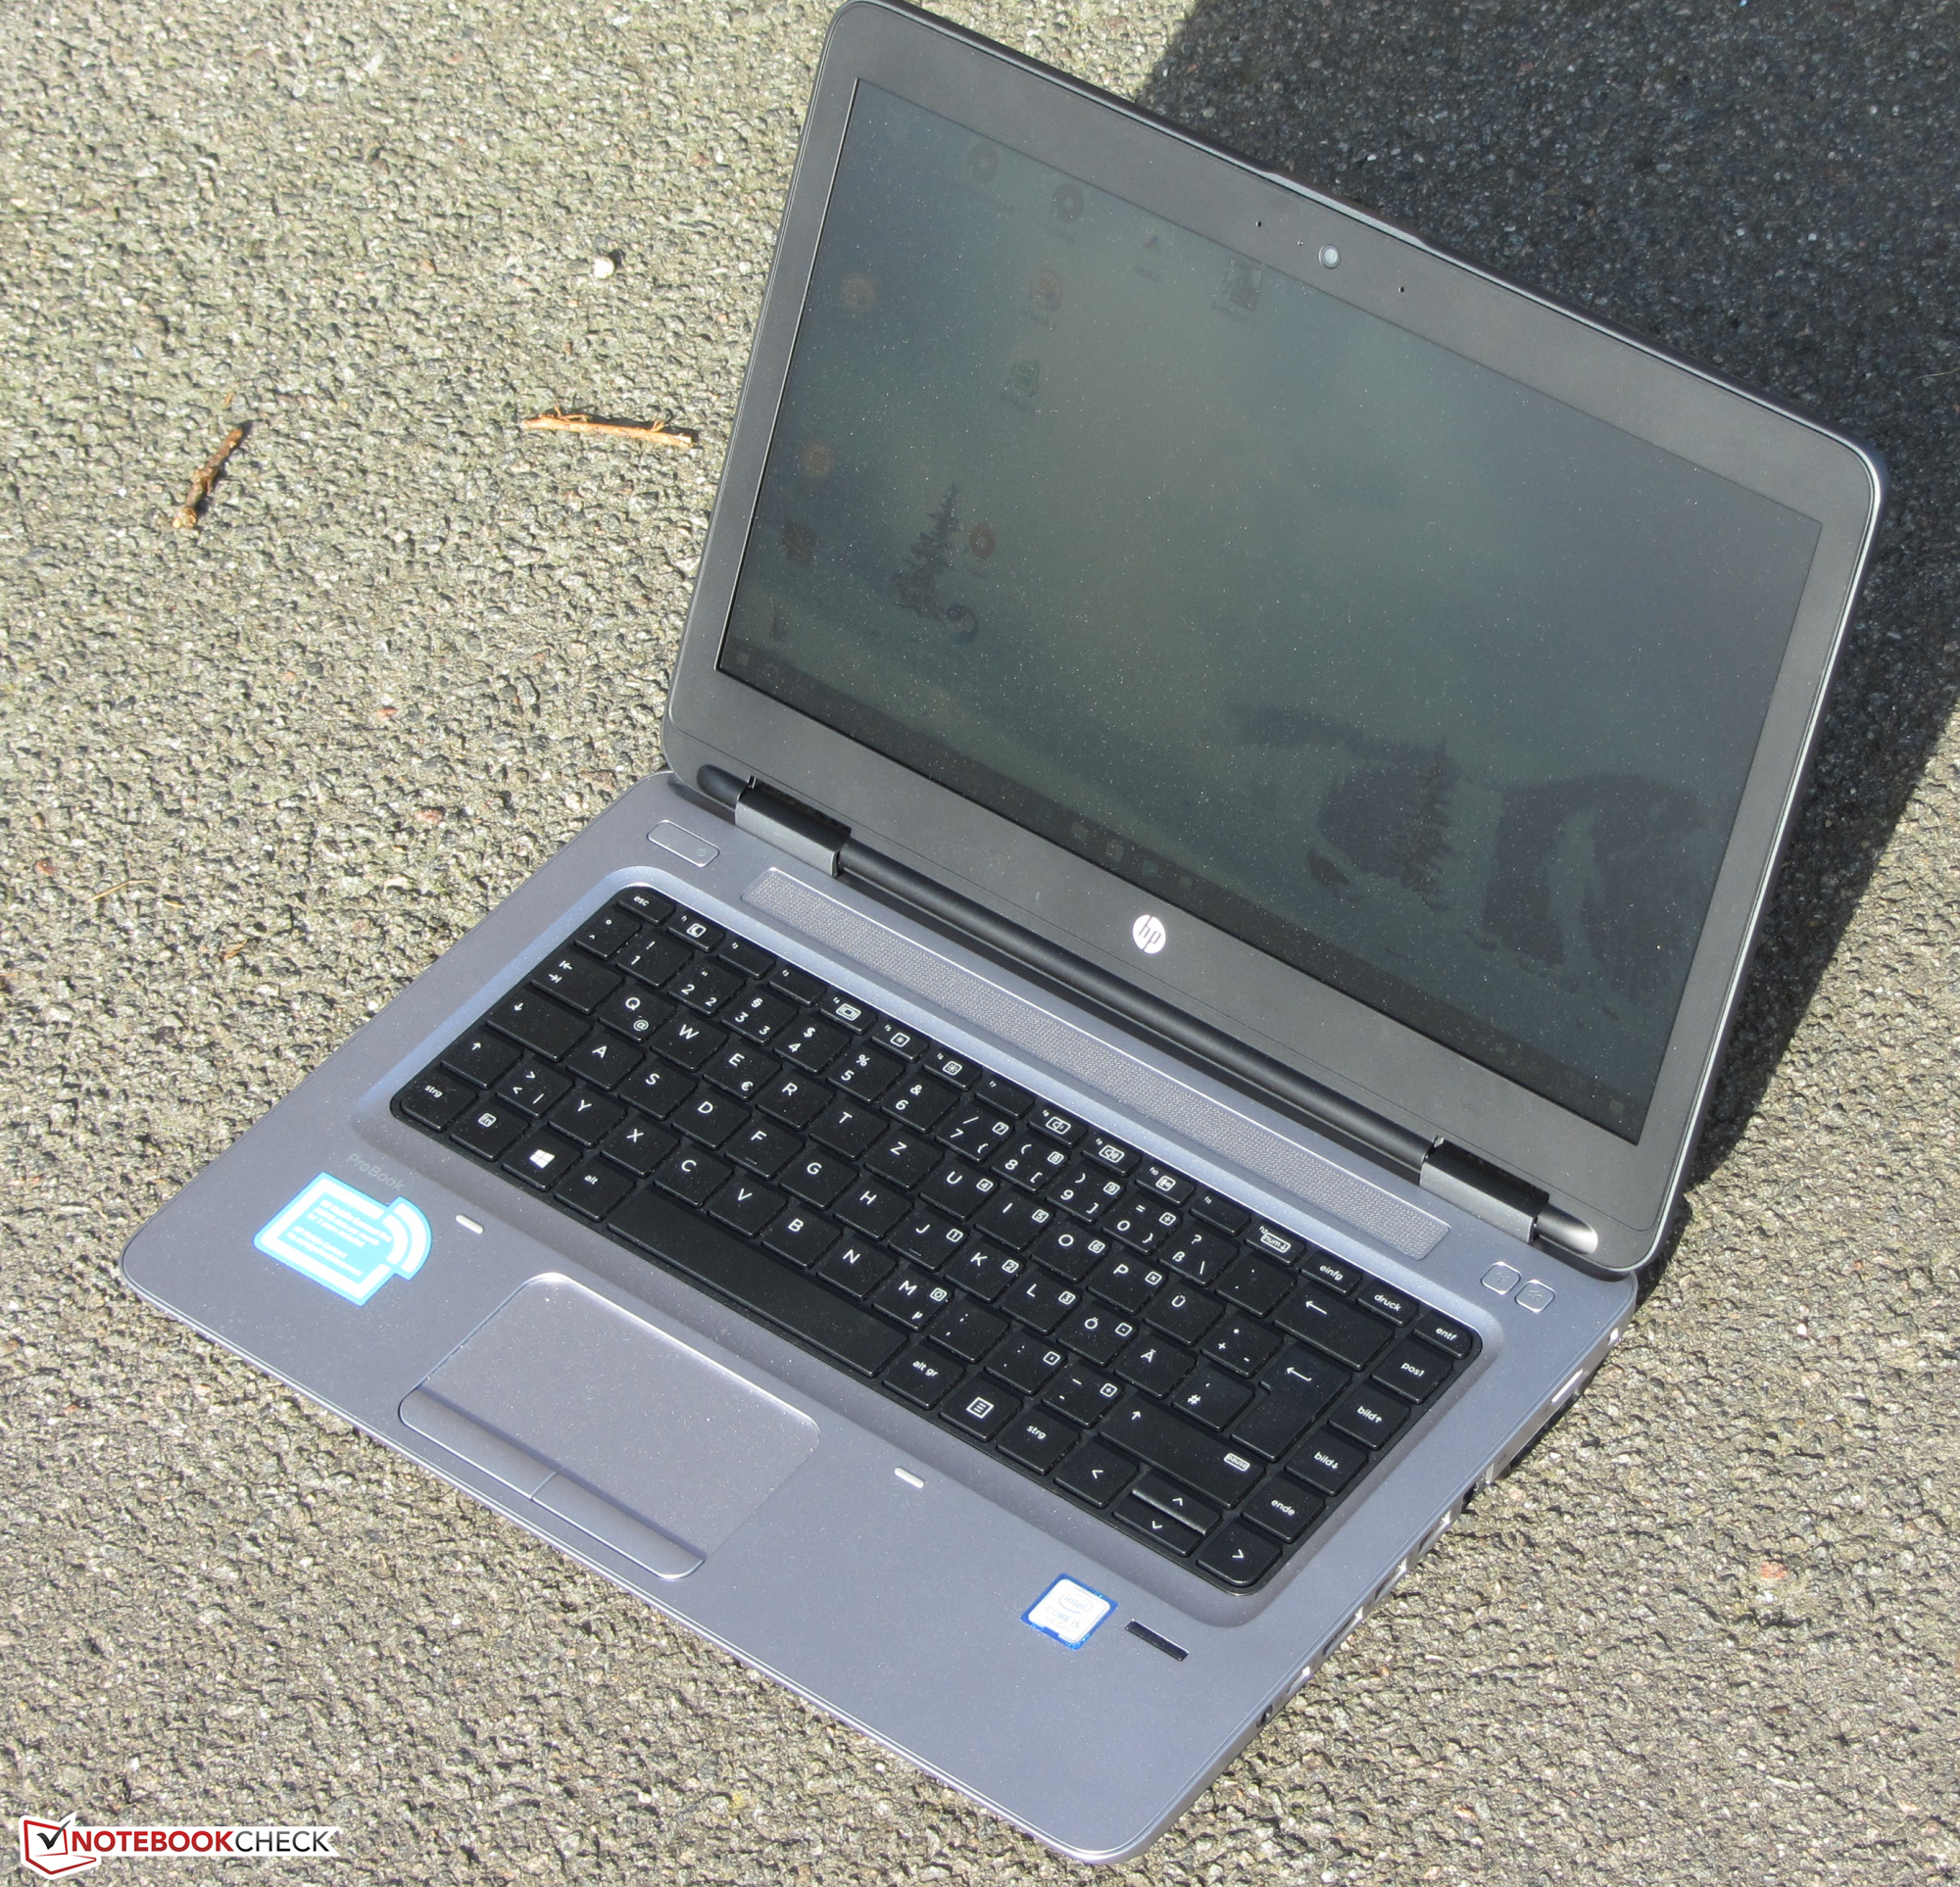
A ház és a beviteli eszközök nem változtak, a HP az elődről emelte át őket. Ez ellen pedig semmi nem szól, mivel mindkét komponens jól bevált. A telep üzemideje nagyon jó, csakúgy, mint elődje esetében, egy munkanapot kibír. Egy LTE/HSPA+ modem lehetővé teszi az internet, vagy egy céges hálózat mobilkommunikáció általi elérését.
A HP sok dolgot eltalált ezzel a notebookkal, de mégsem ússza meg a kritikát.
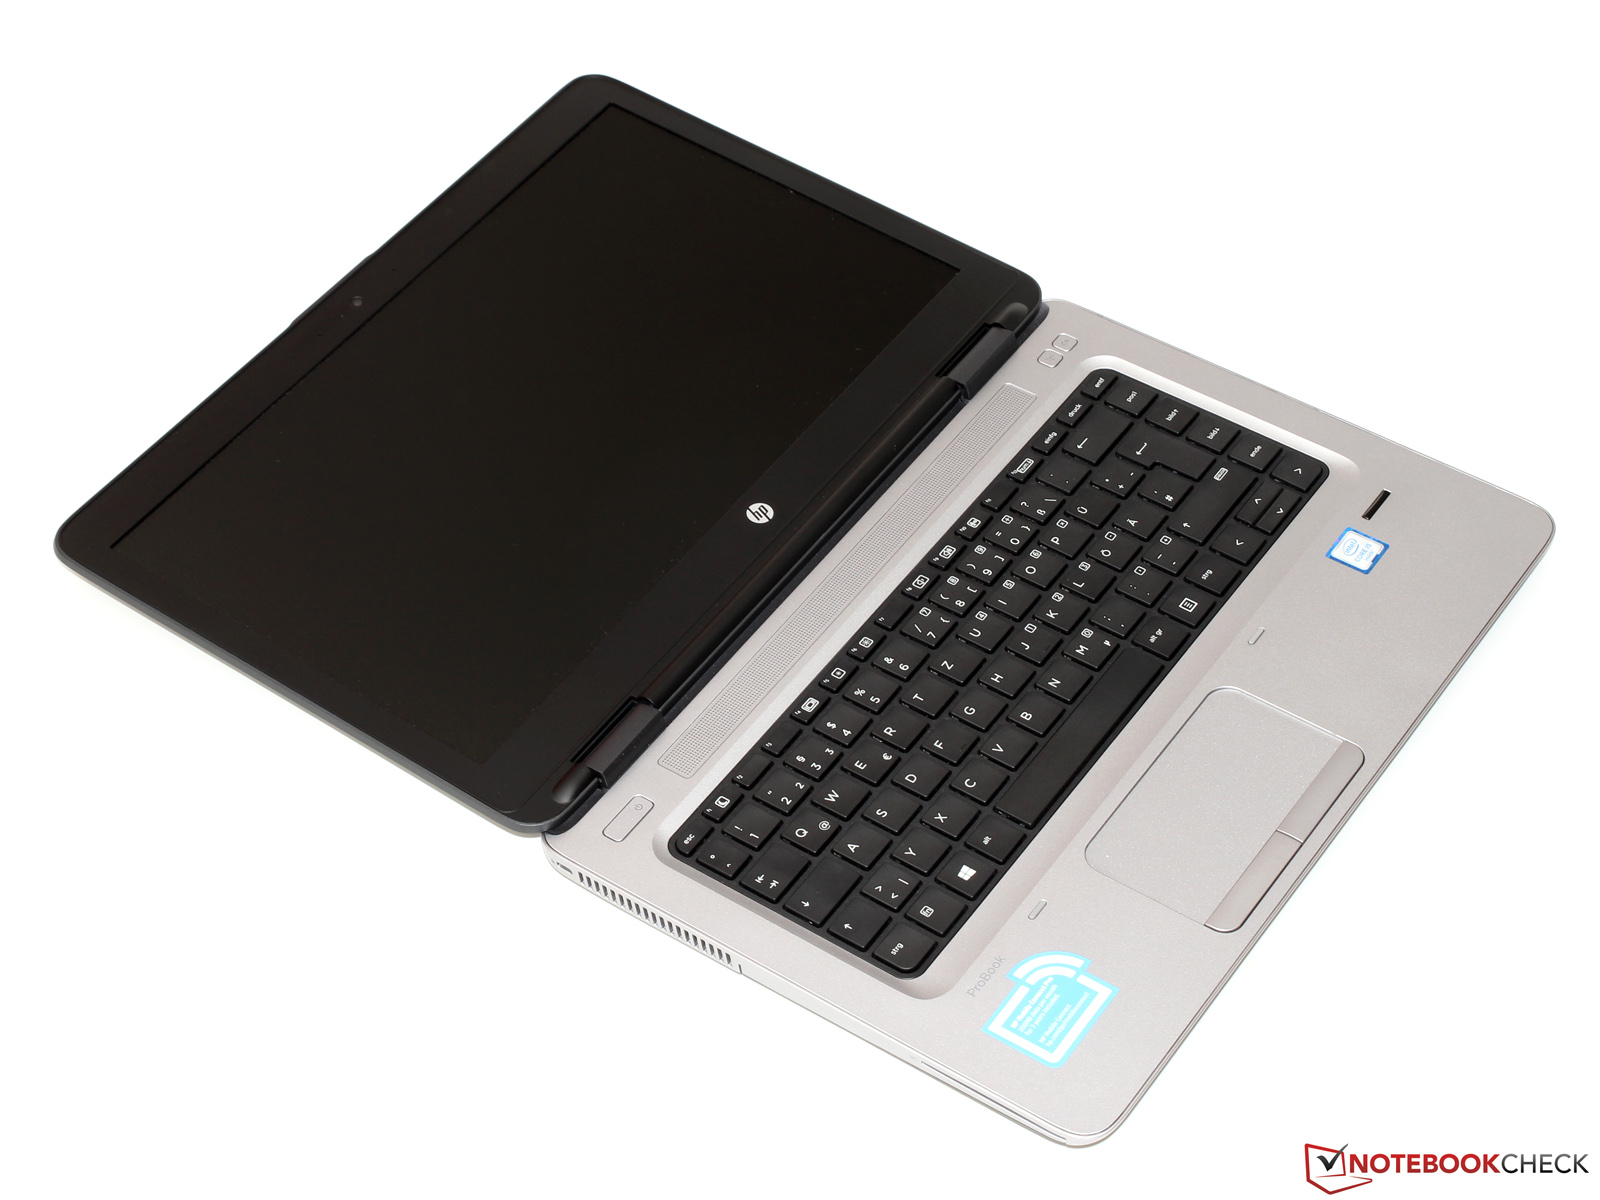
Ismét a kijelzővel van problémánk: a betekintési szögei szűkek, és a kontrasztja alacsony. Ez elfogadhatatlan. Az 1000 euró feletti árazás miatt elvárható egy kiváló kijelző beépítése. Ezen kívül ennyi pénzért a billentyűzet megvilágítását is elvárnánk. Végül, de nem utolsósorban a HP csak egy év garanciát ad a készülékre.
Ez az eredeti értékelés rövidített változata. A teljes, angol nyelvű cikk itt olvasható.
HP ProBook 640 G3 Z2W33ET
- 02/27/2017 v6 (old)
Sascha Mölck