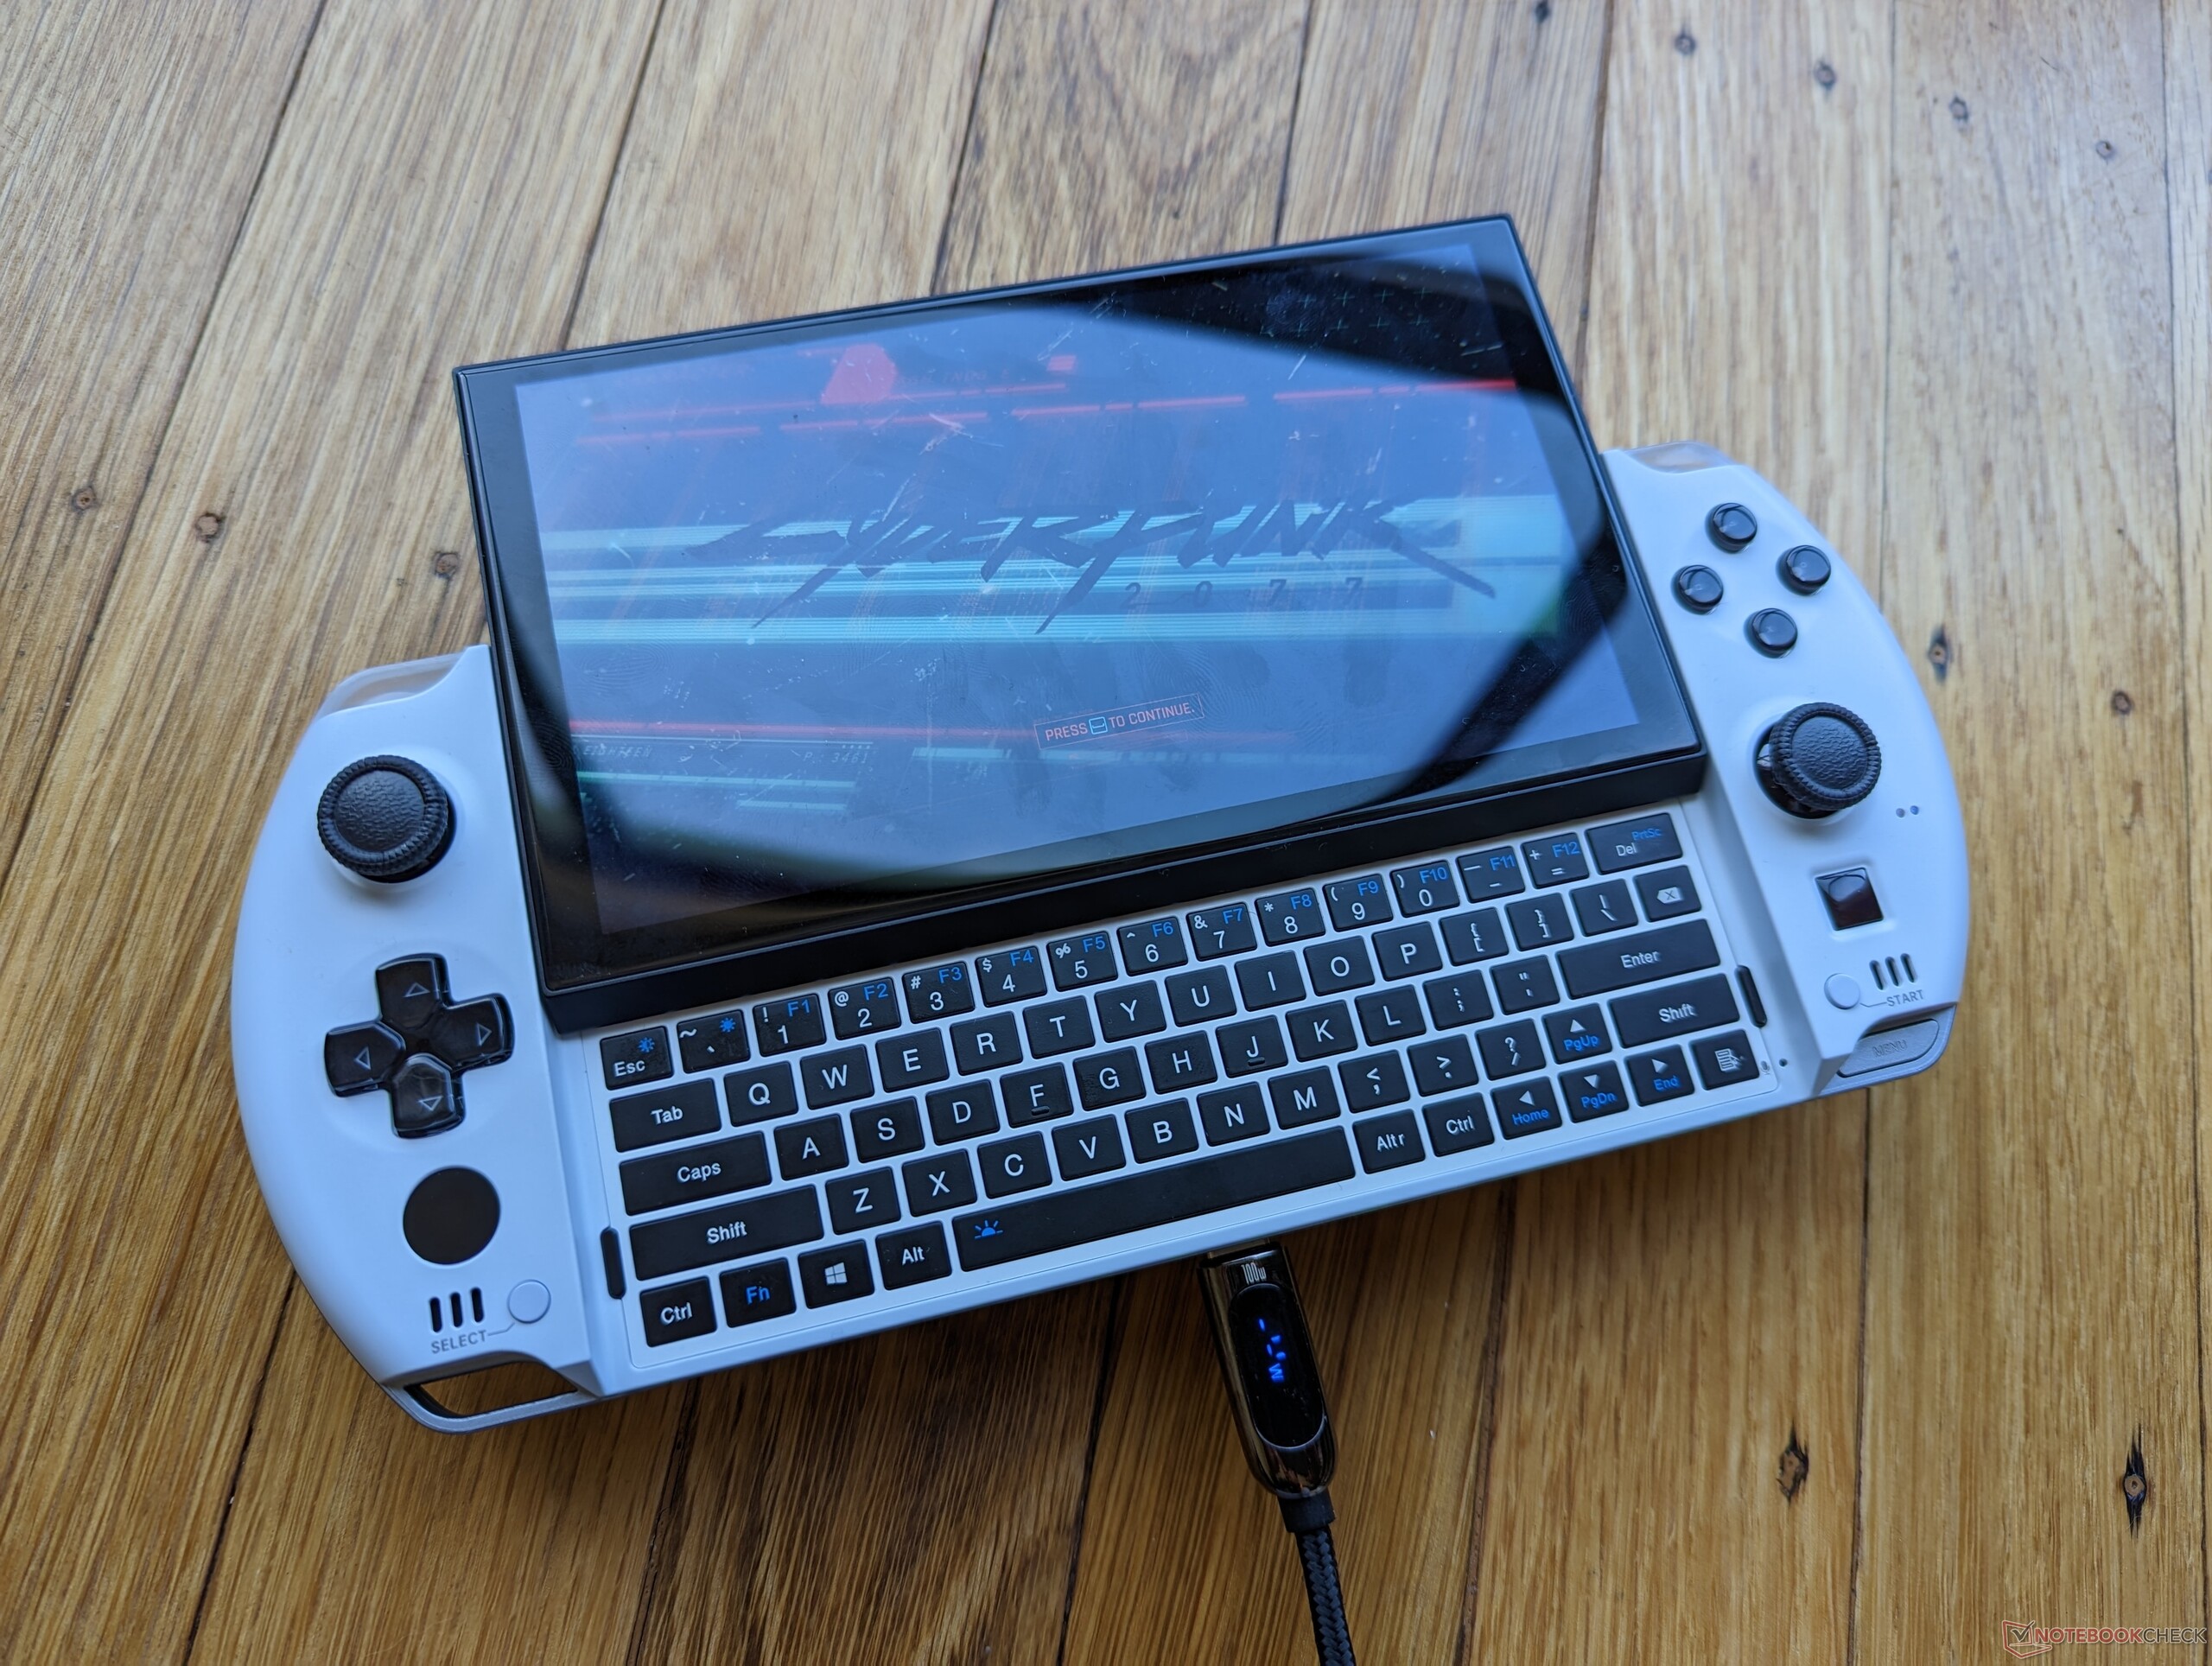
GPD Win 4 kézi PC rövid értékelés: 1080p Ryzen 7 játszás a tenyerünkben
Potential Competitors in Comparison
Értékelés | Dátum | Modell | Súly | Magasság | Méret | Felbontás | Legjobb ár |
|---|---|---|---|---|---|---|---|
| 80.3 % v7 (old) | 07/2023 | GPD Win 4 R7 6800U, Radeon 680M | 607 g | 28 mm | 6.00" | 1920x1080 | |
| 84.5 % v7 (old) | GPD Win Max 2 i7-1260P, Iris Xe G7 96EUs | 1 kg | 23 mm | 10.10" | 2560x1600 | ||
v (old) | GPD Win 3 i5-1135G7, Iris Xe G7 80EUs | 553 g | 27 mm | 5.50" | 1280x720 | ||
| 85.5 % v7 (old) | 04/2021 | Razer Blade Stealth i7-1165G7 GTX 1650 Ti Max-Q i7-1165G7, GeForce GTX 1650 Ti Max-Q | 1.4 kg | 15.3 mm | 13.30" | 1920x1080 | |
| 90.1 % v7 (old) | 01/2023 | Dell XPS 13 9315 2-in-1 Core i5-1230U i5-1230U, Iris Xe G7 80EUs | 764 g | 7.4 mm | 13.00" | 2880x1920 | |
| 90.1 % v7 (old) | 09/2022 | Asus Zenbook S 13 OLED R7 6800U, Radeon 680M | 1.1 kg | 14.9 mm | 13.30" | 2880x1800 |

| SD Card Reader | |
| average JPG Copy Test (av. of 3 runs) | |
| GPD Win Max 2 (Toshiba Exceria Pro SDXC 64 GB UHS-II) | |
| GPD Win 3 (Toshiba Exceria Pro M501 32 GB UHS-II) | |
| GPD Win 4 (AV Pro SD microSD 128 GB V60) | |
| maximum AS SSD Seq Read Test (1GB) | |
| GPD Win Max 2 (Toshiba Exceria Pro SDXC 64 GB UHS-II) | |
| GPD Win 4 (AV Pro SD microSD 128 GB V60) | |
| GPD Win 3 (Toshiba Exceria Pro M501 32 GB UHS-II) | |
| Networking | |
| iperf3 transmit AX12 | |
| GPD Win 3 | |
| Razer Blade Stealth i7-1165G7 GTX 1650 Ti Max-Q | |
| iperf3 receive AX12 | |
| Razer Blade Stealth i7-1165G7 GTX 1650 Ti Max-Q | |
| GPD Win 3 | |
| iperf3 transmit AXE11000 | |
| Asus Zenbook S 13 OLED | |
| GPD Win 4 | |
| iperf3 receive AXE11000 | |
| Asus Zenbook S 13 OLED | |
| GPD Win 4 | |
| iperf3 transmit AXE11000 6GHz | |
| GPD Win Max 2 | |
| Dell XPS 13 9315 2-in-1 Core i5-1230U | |
| GPD Win 4 | |
| iperf3 receive AXE11000 6GHz | |
| GPD Win Max 2 | |
| Dell XPS 13 9315 2-in-1 Core i5-1230U | |
| GPD Win 4 | |
| |||||||||||||||||||||||||
Fényerő megoszlás: 81 %
Centrumban: 413.1 cd/m²
Kontraszt: 1059:1 (Fekete: 0.39 cd/m²)
ΔE ColorChecker Calman: 6.97 | ∀{0.5-29.43 Ø4.71}
calibrated: 1.24
ΔE Greyscale Calman: 9.9 | ∀{0.09-98 Ø4.96}
64.6% AdobeRGB 1998 (Argyll 3D)
92% sRGB (Argyll 3D)
63.1% Display P3 (Argyll 3D)
Gamma: 2.04
CCT: 9571 K
| GPD Win 4 G1618-04, IPS, 1920x1080, 6" | GPD Win Max 2 Toshiba HX_10.1_LCD, IPS, 2560x1600, 10.1" | GPD Win 3 IPS, 1280x720, 5.5" | Razer Blade Stealth i7-1165G7 GTX 1650 Ti Max-Q Sharp LQ133M1JW46, IPS, 1920x1080, 13.3" | Dell XPS 13 9315 2-in-1 Core i5-1230U BOE NE13A1M, IPS, 2880x1920, 13" | Asus Zenbook S 13 OLED SDC4172, OLED, 2880x1800, 13.3" | |
|---|---|---|---|---|---|---|
| Display | 4% | -5% | 5% | 11% | 39% | |
| Display P3 Coverage (%) | 63.1 | 69.8 11% | 59.5 -6% | 66 5% | 70.7 12% | 99.8 58% |
| sRGB Coverage (%) | 92 | 91 -1% | 89.6 -3% | 97.4 6% | 99.8 8% | 100 9% |
| AdobeRGB 1998 Coverage (%) | 64.6 | 66.6 3% | 61.4 -5% | 67.1 4% | 72.6 12% | 97.8 51% |
| Response Times | 16% | -36% | -98% | -42% | 92% | |
| Response Time Grey 50% / Grey 80% * (ms) | 26.8 ? | 21.2 ? 21% | 40 ? -49% | 57.6 ? -115% | 44 ? -64% | 2.1 ? 92% |
| Response Time Black / White * (ms) | 20.9 ? | 18.7 ? 11% | 25.6 ? -22% | 37.6 ? -80% | 24.8 ? -19% | 1.68 ? 92% |
| PWM Frequency (Hz) | 240.4 ? | |||||
| Screen | 8% | -9% | 24% | 41% | 196% | |
| Brightness middle (cd/m²) | 413.1 | 396.7 -4% | 468.8 13% | 356.8 -14% | 507 23% | 336 -19% |
| Brightness (cd/m²) | 407 | 381 -6% | 460 13% | 336 -17% | 486 19% | 338 -17% |
| Brightness Distribution (%) | 81 | 89 10% | 93 15% | 88 9% | 87 7% | 99 22% |
| Black Level * (cd/m²) | 0.39 | 0.36 8% | 0.45 -15% | 0.34 13% | 0.34 13% | 0.02 95% |
| Contrast (:1) | 1059 | 1102 4% | 1042 -2% | 1049 -1% | 1491 41% | 16800 1486% |
| Colorchecker dE 2000 * | 6.97 | 6.31 9% | 9 -29% | 1.63 77% | 2.04 71% | 1.8 74% |
| Colorchecker dE 2000 max. * | 14.11 | 10.23 27% | 15.5 -10% | 5.03 64% | 3.1 78% | 3.8 73% |
| Colorchecker dE 2000 calibrated * | 1.24 | 1.44 -16% | 1.91 -54% | 1.08 13% | 0.86 31% | 1.8 -45% |
| Greyscale dE 2000 * | 9.9 | 5.5 44% | 10.9 -10% | 3 70% | 1.8 82% | 0.9 91% |
| Gamma | 2.04 108% | 2.17 101% | 2.13 103% | 2.23 99% | 2.12 104% | 2.22 99% |
| CCT | 9571 68% | 7502 87% | 10972 59% | 6434 101% | 6561 99% | 6580 99% |
| Color Space (Percent of AdobeRGB 1998) (%) | 56.6 | 62 | ||||
| Color Space (Percent of sRGB) (%) | 89.2 | 97.6 | ||||
| Teljes átlag (program / beállítások) | 9% /
9% | -17% /
-12% | -23% /
2% | 3% /
22% | 109% /
147% |
* ... a kisebb jobb
Megjelenítési válaszidők
| ↔ Válaszidő Fekete-fehér | ||
|---|---|---|
| 20.9 ms ... emelkedés és süllyedés ↘ kombinálva | ↗ 11.4 ms emelkedés | 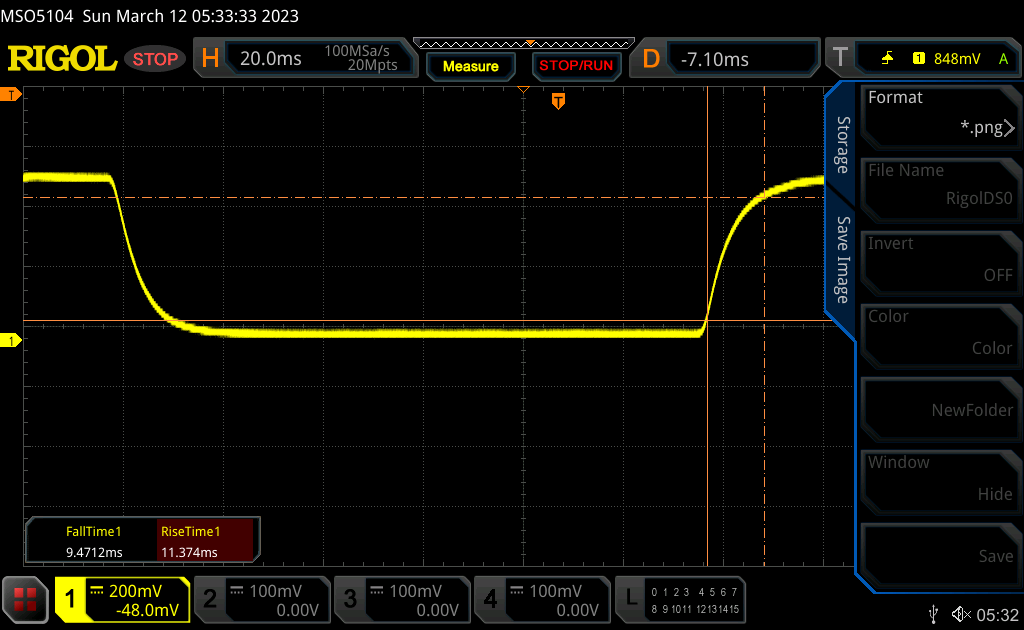 |
| ↘ 9.5 ms ősz | ||
| A képernyő jó reakciósebességet mutat tesztjeinkben, de túl lassú lehet a versenyképes játékosok számára. Összehasonlításképpen, az összes tesztelt eszköz 0.1 (minimum) és 240 (maximum) ms között mozog. » 47 % of all devices are better. Ez azt jelenti, hogy a mért válaszidő hasonló az összes vizsgált eszköz átlagához (19.8 ms). | ||
| ↔ Válaszidő 50% szürke és 80% szürke között | ||
| 26.8 ms ... emelkedés és süllyedés ↘ kombinálva | ↗ 12.5 ms emelkedés | 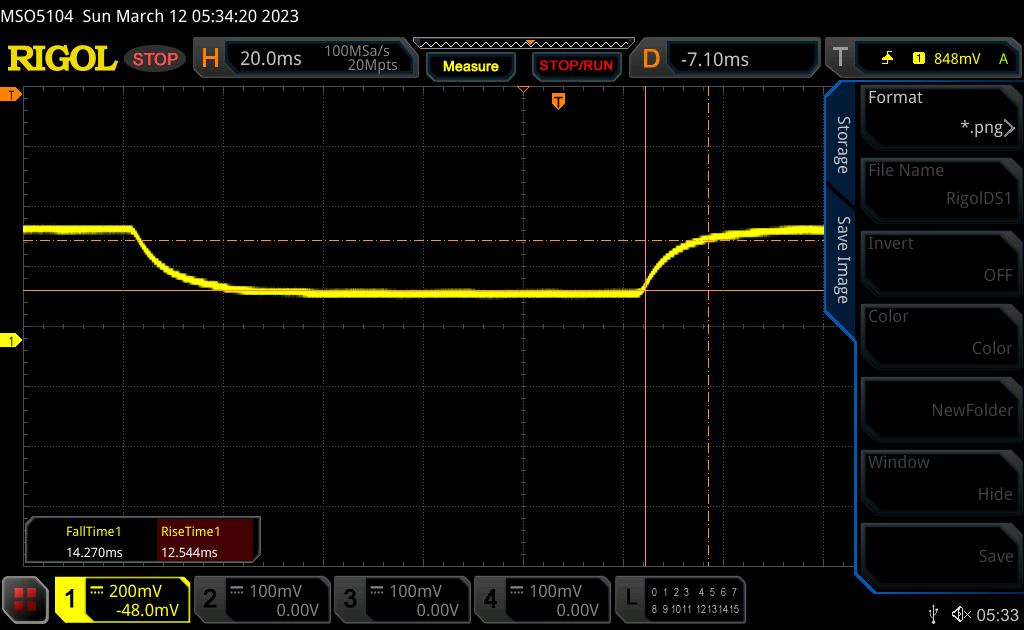 |
| ↘ 14.3 ms ősz | ||
| A képernyő viszonylag lassú reakciósebességet mutat tesztjeinkben, és túl lassú lehet a játékosok számára. Összehasonlításképpen, az összes tesztelt eszköz 0.165 (minimum) és 636 (maximum) ms között mozog. » 37 % of all devices are better. Ez azt jelenti, hogy a mért válaszidő jobb, mint az összes vizsgált eszköz átlaga (30.9 ms). | ||
Képernyő villogása / PWM (impulzusszélesség-moduláció)
| Képernyő villogása / PWM nem érzékelhető |  | ||
Összehasonlításképpen: az összes tesztelt eszköz 52 %-a nem használja a PWM-et a kijelző elsötétítésére. Ha PWM-et észleltek, akkor átlagosan 7741 (minimum: 5 - maximum: 343500) Hz-t mértek. | |||
Cinebench R15 Multi Loop
Cinebench R23: Multi Core | Single Core
Cinebench R20: CPU (Multi Core) | CPU (Single Core)
Cinebench R15: CPU Multi 64Bit | CPU Single 64Bit
Blender: v2.79 BMW27 CPU
7-Zip 18.03: 7z b 4 | 7z b 4 -mmt1
Geekbench 5.5: Multi-Core | Single-Core
HWBOT x265 Benchmark v2.2: 4k Preset
LibreOffice : 20 Documents To PDF
R Benchmark 2.5: Overall mean
| CPU Performance rating | |
| Razer Blade 14 Ryzen 9 6900HX | |
| HP Spectre x360 2-in-1 16-f1075ng | |
| MSI Summit E16 Flip A12UDT-031 | |
| Lenovo Slim 7 Pro X 14ARH7 | |
| GPD Win 4 | |
| Asus Zenbook S 13 OLED | |
| HP Spectre x360 13.5 14t-ef000 | |
| Átlagos AMD Ryzen 7 6800U | |
| GPD Win Max 2 | |
| HP Pavilion Aero 13 be0097nr -2! | |
| Dell XPS 13 9315 2-in-1 Core i5-1230U | |
| Razer Blade Stealth i7-1165G7 GTX 1650 Ti Max-Q -2! | |
| GPD Win 3 | |
| Infinix INBook X2 | |
| Cinebench R23 / Multi Core | |
| MSI Summit E16 Flip A12UDT-031 | |
| Razer Blade 14 Ryzen 9 6900HX | |
| Lenovo Slim 7 Pro X 14ARH7 | |
| HP Spectre x360 2-in-1 16-f1075ng | |
| Átlagos AMD Ryzen 7 6800U (9130 - 11741, n=7) | |
| GPD Win 4 | |
| Asus Zenbook S 13 OLED | |
| HP Spectre x360 13.5 14t-ef000 | |
| HP Pavilion Aero 13 be0097nr | |
| Dell XPS 13 9315 2-in-1 Core i5-1230U | |
| GPD Win Max 2 | |
| GPD Win 3 | |
| Infinix INBook X2 | |
| Cinebench R23 / Single Core | |
| HP Spectre x360 2-in-1 16-f1075ng | |
| GPD Win Max 2 | |
| HP Spectre x360 13.5 14t-ef000 | |
| MSI Summit E16 Flip A12UDT-031 | |
| Lenovo Slim 7 Pro X 14ARH7 | |
| GPD Win 4 | |
| Razer Blade 14 Ryzen 9 6900HX | |
| Dell XPS 13 9315 2-in-1 Core i5-1230U | |
| Asus Zenbook S 13 OLED | |
| Átlagos AMD Ryzen 7 6800U (878 - 1534, n=7) | |
| HP Pavilion Aero 13 be0097nr | |
| GPD Win 3 | |
| Infinix INBook X2 | |
| Cinebench R20 / CPU (Multi Core) | |
| Razer Blade 14 Ryzen 9 6900HX | |
| MSI Summit E16 Flip A12UDT-031 | |
| Lenovo Slim 7 Pro X 14ARH7 | |
| HP Spectre x360 2-in-1 16-f1075ng | |
| Átlagos AMD Ryzen 7 6800U (3529 - 4574, n=8) | |
| GPD Win 4 | |
| Asus Zenbook S 13 OLED | |
| HP Spectre x360 13.5 14t-ef000 | |
| HP Pavilion Aero 13 be0097nr | |
| Dell XPS 13 9315 2-in-1 Core i5-1230U | |
| GPD Win Max 2 | |
| Razer Blade Stealth i7-1165G7 GTX 1650 Ti Max-Q | |
| GPD Win 3 | |
| Infinix INBook X2 | |
| Cinebench R20 / CPU (Single Core) | |
| HP Spectre x360 2-in-1 16-f1075ng | |
| GPD Win Max 2 | |
| HP Spectre x360 13.5 14t-ef000 | |
| MSI Summit E16 Flip A12UDT-031 | |
| Lenovo Slim 7 Pro X 14ARH7 | |
| GPD Win 4 | |
| Razer Blade 14 Ryzen 9 6900HX | |
| Dell XPS 13 9315 2-in-1 Core i5-1230U | |
| Razer Blade Stealth i7-1165G7 GTX 1650 Ti Max-Q | |
| Asus Zenbook S 13 OLED | |
| Átlagos AMD Ryzen 7 6800U (341 - 602, n=8) | |
| HP Pavilion Aero 13 be0097nr | |
| GPD Win 3 | |
| Infinix INBook X2 | |
| Cinebench R15 / CPU Multi 64Bit | |
| MSI Summit E16 Flip A12UDT-031 | |
| Razer Blade 14 Ryzen 9 6900HX | |
| HP Spectre x360 2-in-1 16-f1075ng | |
| Lenovo Slim 7 Pro X 14ARH7 | |
| GPD Win 4 | |
| Átlagos AMD Ryzen 7 6800U (1463 - 1979, n=7) | |
| Asus Zenbook S 13 OLED | |
| HP Spectre x360 13.5 14t-ef000 | |
| HP Pavilion Aero 13 be0097nr | |
| Dell XPS 13 9315 2-in-1 Core i5-1230U | |
| GPD Win Max 2 | |
| Razer Blade Stealth i7-1165G7 GTX 1650 Ti Max-Q | |
| GPD Win 3 | |
| Infinix INBook X2 | |
| Cinebench R15 / CPU Single 64Bit | |
| HP Spectre x360 2-in-1 16-f1075ng | |
| GPD Win Max 2 | |
| HP Spectre x360 13.5 14t-ef000 | |
| GPD Win 4 | |
| Razer Blade 14 Ryzen 9 6900HX | |
| MSI Summit E16 Flip A12UDT-031 | |
| Asus Zenbook S 13 OLED | |
| HP Pavilion Aero 13 be0097nr | |
| Átlagos AMD Ryzen 7 6800U (142.6 - 246, n=6) | |
| Dell XPS 13 9315 2-in-1 Core i5-1230U | |
| Razer Blade Stealth i7-1165G7 GTX 1650 Ti Max-Q | |
| Lenovo Slim 7 Pro X 14ARH7 | |
| GPD Win 3 | |
| Infinix INBook X2 | |
| Blender / v2.79 BMW27 CPU | |
| Infinix INBook X2 | |
| GPD Win 3 | |
| Razer Blade Stealth i7-1165G7 GTX 1650 Ti Max-Q | |
| Dell XPS 13 9315 2-in-1 Core i5-1230U | |
| GPD Win Max 2 | |
| HP Spectre x360 13.5 14t-ef000 | |
| HP Pavilion Aero 13 be0097nr | |
| Asus Zenbook S 13 OLED | |
| MSI Summit E16 Flip A12UDT-031 | |
| GPD Win 4 | |
| Átlagos AMD Ryzen 7 6800U (272 - 347, n=7) | |
| Lenovo Slim 7 Pro X 14ARH7 | |
| HP Spectre x360 2-in-1 16-f1075ng | |
| Razer Blade 14 Ryzen 9 6900HX | |
| 7-Zip 18.03 / 7z b 4 | |
| Razer Blade 14 Ryzen 9 6900HX | |
| Lenovo Slim 7 Pro X 14ARH7 | |
| GPD Win 4 | |
| Átlagos AMD Ryzen 7 6800U (40058 - 53934, n=6) | |
| Asus Zenbook S 13 OLED | |
| HP Spectre x360 2-in-1 16-f1075ng | |
| MSI Summit E16 Flip A12UDT-031 | |
| HP Pavilion Aero 13 be0097nr | |
| HP Spectre x360 13.5 14t-ef000 | |
| Dell XPS 13 9315 2-in-1 Core i5-1230U | |
| GPD Win Max 2 | |
| Razer Blade Stealth i7-1165G7 GTX 1650 Ti Max-Q | |
| GPD Win 3 | |
| Infinix INBook X2 | |
| 7-Zip 18.03 / 7z b 4 -mmt1 | |
| HP Spectre x360 2-in-1 16-f1075ng | |
| Razer Blade 14 Ryzen 9 6900HX | |
| GPD Win Max 2 | |
| Lenovo Slim 7 Pro X 14ARH7 | |
| GPD Win 4 | |
| HP Spectre x360 13.5 14t-ef000 | |
| Asus Zenbook S 13 OLED | |
| HP Pavilion Aero 13 be0097nr | |
| Razer Blade Stealth i7-1165G7 GTX 1650 Ti Max-Q | |
| MSI Summit E16 Flip A12UDT-031 | |
| Átlagos AMD Ryzen 7 6800U (3398 - 5511, n=6) | |
| Dell XPS 13 9315 2-in-1 Core i5-1230U | |
| GPD Win 3 | |
| Infinix INBook X2 | |
| Geekbench 5.5 / Multi-Core | |
| Razer Blade 14 Ryzen 9 6900HX | |
| MSI Summit E16 Flip A12UDT-031 | |
| Lenovo Slim 7 Pro X 14ARH7 | |
| HP Spectre x360 2-in-1 16-f1075ng | |
| HP Spectre x360 13.5 14t-ef000 | |
| GPD Win 4 | |
| Átlagos AMD Ryzen 7 6800U (6854 - 8935, n=9) | |
| Asus Zenbook S 13 OLED | |
| Dell XPS 13 9315 2-in-1 Core i5-1230U | |
| GPD Win Max 2 | |
| Razer Blade Stealth i7-1165G7 GTX 1650 Ti Max-Q | |
| GPD Win 3 | |
| Infinix INBook X2 | |
| Geekbench 5.5 / Single-Core | |
| HP Spectre x360 2-in-1 16-f1075ng | |
| GPD Win Max 2 | |
| HP Spectre x360 13.5 14t-ef000 | |
| MSI Summit E16 Flip A12UDT-031 | |
| Lenovo Slim 7 Pro X 14ARH7 | |
| Razer Blade 14 Ryzen 9 6900HX | |
| Razer Blade Stealth i7-1165G7 GTX 1650 Ti Max-Q | |
| GPD Win 4 | |
| Dell XPS 13 9315 2-in-1 Core i5-1230U | |
| Asus Zenbook S 13 OLED | |
| Átlagos AMD Ryzen 7 6800U (926 - 1555, n=9) | |
| GPD Win 3 | |
| Infinix INBook X2 | |
| HWBOT x265 Benchmark v2.2 / 4k Preset | |
| Razer Blade 14 Ryzen 9 6900HX | |
| Lenovo Slim 7 Pro X 14ARH7 | |
| HP Spectre x360 2-in-1 16-f1075ng | |
| Átlagos AMD Ryzen 7 6800U (11.8 - 14.2, n=6) | |
| GPD Win 4 | |
| Asus Zenbook S 13 OLED | |
| MSI Summit E16 Flip A12UDT-031 | |
| HP Pavilion Aero 13 be0097nr | |
| HP Spectre x360 13.5 14t-ef000 | |
| Dell XPS 13 9315 2-in-1 Core i5-1230U | |
| GPD Win Max 2 | |
| Razer Blade Stealth i7-1165G7 GTX 1650 Ti Max-Q | |
| GPD Win 3 | |
| Infinix INBook X2 | |
| LibreOffice / 20 Documents To PDF | |
| Infinix INBook X2 | |
| Átlagos AMD Ryzen 7 6800U (50.1 - 84.9, n=6) | |
| Asus Zenbook S 13 OLED | |
| HP Pavilion Aero 13 be0097nr | |
| MSI Summit E16 Flip A12UDT-031 | |
| Dell XPS 13 9315 2-in-1 Core i5-1230U | |
| GPD Win 4 | |
| Razer Blade 14 Ryzen 9 6900HX | |
| Razer Blade Stealth i7-1165G7 GTX 1650 Ti Max-Q | |
| GPD Win 3 | |
| Lenovo Slim 7 Pro X 14ARH7 | |
| HP Spectre x360 13.5 14t-ef000 | |
| GPD Win Max 2 | |
| HP Spectre x360 2-in-1 16-f1075ng | |
| R Benchmark 2.5 / Overall mean | |
| Infinix INBook X2 | |
| GPD Win 3 | |
| Razer Blade Stealth i7-1165G7 GTX 1650 Ti Max-Q | |
| HP Pavilion Aero 13 be0097nr | |
| Asus Zenbook S 13 OLED | |
| Dell XPS 13 9315 2-in-1 Core i5-1230U | |
| GPD Win 4 | |
| Átlagos AMD Ryzen 7 6800U (0.508 - 0.529, n=5) | |
| MSI Summit E16 Flip A12UDT-031 | |
| Lenovo Slim 7 Pro X 14ARH7 | |
| HP Spectre x360 13.5 14t-ef000 | |
| Razer Blade 14 Ryzen 9 6900HX | |
| HP Spectre x360 2-in-1 16-f1075ng | |
| GPD Win Max 2 | |
Cinebench R23: Multi Core | Single Core
Cinebench R20: CPU (Multi Core) | CPU (Single Core)
Cinebench R15: CPU Multi 64Bit | CPU Single 64Bit
Blender: v2.79 BMW27 CPU
7-Zip 18.03: 7z b 4 | 7z b 4 -mmt1
Geekbench 5.5: Multi-Core | Single-Core
HWBOT x265 Benchmark v2.2: 4k Preset
LibreOffice : 20 Documents To PDF
R Benchmark 2.5: Overall mean
* ... a kisebb jobb
AIDA64: FP32 Ray-Trace | FPU Julia | CPU SHA3 | CPU Queen | FPU SinJulia | FPU Mandel | CPU AES | CPU ZLib | FP64 Ray-Trace | CPU PhotoWorxx
| Performance rating | |
| Átlagos AMD Ryzen 7 6800U | |
| GPD Win 4 | |
| Asus Zenbook S 13 OLED | |
| Dell XPS 13 9315 2-in-1 Core i5-1230U | |
| GPD Win Max 2 | |
| AIDA64 / FP32 Ray-Trace | |
| Átlagos AMD Ryzen 7 6800U (10902 - 12818, n=6) | |
| GPD Win 4 | |
| Asus Zenbook S 13 OLED | |
| Dell XPS 13 9315 2-in-1 Core i5-1230U | |
| GPD Win Max 2 | |
| AIDA64 / FPU Julia | |
| Átlagos AMD Ryzen 7 6800U (67503 - 84031, n=6) | |
| GPD Win 4 | |
| Asus Zenbook S 13 OLED | |
| Dell XPS 13 9315 2-in-1 Core i5-1230U | |
| GPD Win Max 2 | |
| AIDA64 / CPU SHA3 | |
| Átlagos AMD Ryzen 7 6800U (2296 - 2818, n=6) | |
| GPD Win 4 | |
| Asus Zenbook S 13 OLED | |
| Dell XPS 13 9315 2-in-1 Core i5-1230U | |
| GPD Win Max 2 | |
| AIDA64 / CPU Queen | |
| GPD Win 4 | |
| Átlagos AMD Ryzen 7 6800U (62082 - 96306, n=6) | |
| Asus Zenbook S 13 OLED | |
| GPD Win Max 2 | |
| Dell XPS 13 9315 2-in-1 Core i5-1230U | |
| AIDA64 / FPU SinJulia | |
| GPD Win 4 | |
| Átlagos AMD Ryzen 7 6800U (7753 - 11982, n=6) | |
| Asus Zenbook S 13 OLED | |
| GPD Win Max 2 | |
| Dell XPS 13 9315 2-in-1 Core i5-1230U | |
| AIDA64 / FPU Mandel | |
| Átlagos AMD Ryzen 7 6800U (37417 - 45748, n=6) | |
| GPD Win 4 | |
| Asus Zenbook S 13 OLED | |
| Dell XPS 13 9315 2-in-1 Core i5-1230U | |
| GPD Win Max 2 | |
| AIDA64 / CPU AES | |
| GPD Win 4 | |
| Asus Zenbook S 13 OLED | |
| Átlagos AMD Ryzen 7 6800U (50547 - 115681, n=6) | |
| GPD Win Max 2 | |
| Dell XPS 13 9315 2-in-1 Core i5-1230U | |
| AIDA64 / CPU ZLib | |
| Átlagos AMD Ryzen 7 6800U (554 - 755, n=6) | |
| GPD Win 4 | |
| Asus Zenbook S 13 OLED | |
| GPD Win Max 2 | |
| Dell XPS 13 9315 2-in-1 Core i5-1230U | |
| AIDA64 / FP64 Ray-Trace | |
| Átlagos AMD Ryzen 7 6800U (5825 - 6694, n=6) | |
| GPD Win 4 | |
| Asus Zenbook S 13 OLED | |
| Dell XPS 13 9315 2-in-1 Core i5-1230U | |
| GPD Win Max 2 | |
| AIDA64 / CPU PhotoWorxx | |
| Dell XPS 13 9315 2-in-1 Core i5-1230U | |
| GPD Win Max 2 | |
| GPD Win 4 | |
| Átlagos AMD Ryzen 7 6800U (24728 - 27274, n=6) | |
| Asus Zenbook S 13 OLED | |
CrossMark: Overall | Productivity | Creativity | Responsiveness
| PCMark 10 / Score | |
| GPD Win 4 | |
| Asus Zenbook S 13 OLED | |
| Átlagos AMD Ryzen 7 6800U, AMD Radeon 680M (5057 - 6639, n=7) | |
| Razer Blade Stealth i7-1165G7 GTX 1650 Ti Max-Q | |
| GPD Win Max 2 | |
| Dell XPS 13 9315 2-in-1 Core i5-1230U | |
| GPD Win 3 | |
| PCMark 10 / Essentials | |
| GPD Win Max 2 | |
| Asus Zenbook S 13 OLED | |
| GPD Win 4 | |
| Dell XPS 13 9315 2-in-1 Core i5-1230U | |
| Átlagos AMD Ryzen 7 6800U, AMD Radeon 680M (8143 - 10766, n=6) | |
| GPD Win 3 | |
| Razer Blade Stealth i7-1165G7 GTX 1650 Ti Max-Q | |
| PCMark 10 / Productivity | |
| GPD Win 4 | |
| Asus Zenbook S 13 OLED | |
| Razer Blade Stealth i7-1165G7 GTX 1650 Ti Max-Q | |
| Átlagos AMD Ryzen 7 6800U, AMD Radeon 680M (6089 - 9328, n=6) | |
| GPD Win Max 2 | |
| Dell XPS 13 9315 2-in-1 Core i5-1230U | |
| GPD Win 3 | |
| PCMark 10 / Digital Content Creation | |
| GPD Win 4 | |
| Átlagos AMD Ryzen 7 6800U, AMD Radeon 680M (6066 - 8144, n=6) | |
| Asus Zenbook S 13 OLED | |
| Razer Blade Stealth i7-1165G7 GTX 1650 Ti Max-Q | |
| GPD Win Max 2 | |
| Dell XPS 13 9315 2-in-1 Core i5-1230U | |
| GPD Win 3 | |
| CrossMark / Overall | |
| GPD Win Max 2 | |
| GPD Win 4 | |
| Asus Zenbook S 13 OLED | |
| Átlagos AMD Ryzen 7 6800U, AMD Radeon 680M (1009 - 1575, n=7) | |
| Dell XPS 13 9315 2-in-1 Core i5-1230U | |
| CrossMark / Productivity | |
| GPD Win Max 2 | |
| GPD Win 4 | |
| Asus Zenbook S 13 OLED | |
| Átlagos AMD Ryzen 7 6800U, AMD Radeon 680M (971 - 1596, n=7) | |
| Dell XPS 13 9315 2-in-1 Core i5-1230U | |
| CrossMark / Creativity | |
| GPD Win Max 2 | |
| GPD Win 4 | |
| Asus Zenbook S 13 OLED | |
| Átlagos AMD Ryzen 7 6800U, AMD Radeon 680M (1054 - 1686, n=7) | |
| Dell XPS 13 9315 2-in-1 Core i5-1230U | |
| CrossMark / Responsiveness | |
| GPD Win Max 2 | |
| GPD Win 4 | |
| Átlagos AMD Ryzen 7 6800U, AMD Radeon 680M (994 - 1473, n=7) | |
| Asus Zenbook S 13 OLED | |
| Dell XPS 13 9315 2-in-1 Core i5-1230U | |
| PCMark 10 Score | 6394 pontok | |
Segítség | ||
| AIDA64 / Memory Copy | |
| GPD Win Max 2 | |
| Dell XPS 13 9315 2-in-1 Core i5-1230U | |
| GPD Win 4 | |
| Átlagos AMD Ryzen 7 6800U (47010 - 52159, n=6) | |
| Asus Zenbook S 13 OLED | |
| AIDA64 / Memory Read | |
| GPD Win Max 2 | |
| Dell XPS 13 9315 2-in-1 Core i5-1230U | |
| GPD Win 4 | |
| Átlagos AMD Ryzen 7 6800U (39197 - 45084, n=6) | |
| Asus Zenbook S 13 OLED | |
| AIDA64 / Memory Write | |
| Dell XPS 13 9315 2-in-1 Core i5-1230U | |
| GPD Win Max 2 | |
| GPD Win 4 | |
| Átlagos AMD Ryzen 7 6800U (48723 - 51117, n=6) | |
| Asus Zenbook S 13 OLED | |
| AIDA64 / Memory Latency | |
| Asus Zenbook S 13 OLED | |
| Átlagos AMD Ryzen 7 6800U (106.3 - 123.1, n=6) | |
| GPD Win 4 | |
| GPD Win Max 2 | |
| Dell XPS 13 9315 2-in-1 Core i5-1230U | |
* ... a kisebb jobb
| DPC Latencies / LatencyMon - interrupt to process latency (max), Web, Youtube, Prime95 | |
| Dell XPS 13 9315 2-in-1 Core i5-1230U | |
| Razer Blade Stealth i7-1165G7 GTX 1650 Ti Max-Q | |
| GPD Win 3 | |
| GPD Win 4 | |
| Asus Zenbook S 13 OLED | |
| GPD Win Max 2 | |
* ... a kisebb jobb

| Drive Performance rating - Percent | |
| Asus Zenbook S 13 OLED | |
| GPD Win Max 2 | |
| GPD Win 4 | |
| GPD Win 3 | |
| Razer Blade Stealth i7-1165G7 GTX 1650 Ti Max-Q | |
| Dell XPS 13 9315 2-in-1 Core i5-1230U | |
* ... a kisebb jobb
Disk Throttling: DiskSpd Read Loop, Queue Depth 8
| 3DMark 11 - 1280x720 Performance GPU | |
| MSI RTX 2060 Gaming Z 6G | |
| Desktop PC Intel Xeon E5 2680v4 KFA2 GTX 1060 6GB | |
| Lenovo Slim 7 Pro X 14ARH7 | |
| Razer Blade Stealth i7-1165G7 GTX 1650 Ti Max-Q | |
| GPD Win 4 | |
| Átlagos AMD Radeon 680M (6858 - 11755, n=39) | |
| Asus Zenbook S 13 OLED | |
| GPD Win Max 2 | |
| HP Spectre x360 2-in-1 16-f1075ng | |
| HP Spectre x360 13.5 14t-ef000 | |
| GPD Win 3 | |
| HP Pavilion Aero 13 be0097nr | |
| Infinix INBook X2 | |
| Dell XPS 13 9315 2-in-1 Core i5-1230U | |
| 3DMark 11 Performance | 10232 pontok | |
| 3DMark Fire Strike Score | 6235 pontok | |
| 3DMark Time Spy Score | 2559 pontok | |
Segítség | ||
| Blender | |
| v3.3 Classroom HIP/AMD | |
| Átlagos AMD Radeon 680M (270 - 555, n=34) | |
| GPD Win 4 | |
| v3.3 Classroom OPTIX/RTX | |
| Lenovo Slim 7 Pro X 14ARH7 | |
| MSI Summit E16 Flip A12UDT-031 | |
| v3.3 Classroom CUDA | |
| Lenovo Slim 7 Pro X 14ARH7 | |
| MSI Summit E16 Flip A12UDT-031 | |
| v3.3 Classroom CPU | |
| Dell XPS 13 9315 2-in-1 Core i5-1230U | |
| HP Spectre x360 13.5 14t-ef000 | |
| MSI Summit E16 Flip A12UDT-031 | |
| GPD Win 4 | |
| Átlagos AMD Radeon 680M (389 - 980, n=37) | |
| HP Spectre x360 2-in-1 16-f1075ng | |
| Lenovo Slim 7 Pro X 14ARH7 | |
* ... a kisebb jobb
| Performance rating - Percent | |
| MSI Summit E16 Flip A12UDT-031 | |
| Lenovo Slim 7 Pro X 14ARH7 | |
| Razer Blade Stealth i7-1165G7 GTX 1650 Ti Max-Q | |
| GPD Win 4 | |
| Asus Zenbook S 13 OLED | |
| HP Spectre x360 13.5 14t-ef000 | |
| GPD Win Max 2 | |
| GPD Win 3 -1! | |
| HP Spectre x360 2-in-1 16-f1075ng | |
| HP Pavilion Aero 13 be0097nr | |
| Infinix INBook X2 -2! | |
| Dell XPS 13 9315 2-in-1 Core i5-1230U -2! | |
| The Witcher 3 - 1920x1080 Ultra Graphics & Postprocessing (HBAO+) | |
| MSI Summit E16 Flip A12UDT-031 | |
| Lenovo Slim 7 Pro X 14ARH7 | |
| Razer Blade Stealth i7-1165G7 GTX 1650 Ti Max-Q | |
| Asus Zenbook S 13 OLED | |
| GPD Win 4 | |
| HP Pavilion Aero 13 be0097nr | |
| HP Spectre x360 13.5 14t-ef000 | |
| GPD Win Max 2 | |
| GPD Win 3 | |
| HP Spectre x360 2-in-1 16-f1075ng | |
| Infinix INBook X2 | |
| Dell XPS 13 9315 2-in-1 Core i5-1230U | |
| GTA V - 1920x1080 Highest AA:4xMSAA + FX AF:16x | |
| MSI Summit E16 Flip A12UDT-031 | |
| Lenovo Slim 7 Pro X 14ARH7 | |
| Razer Blade Stealth i7-1165G7 GTX 1650 Ti Max-Q | |
| GPD Win 4 | |
| Asus Zenbook S 13 OLED | |
| HP Spectre x360 13.5 14t-ef000 | |
| GPD Win Max 2 | |
| HP Pavilion Aero 13 be0097nr | |
| HP Spectre x360 2-in-1 16-f1075ng | |
| Dell XPS 13 9315 2-in-1 Core i5-1230U | |
| Final Fantasy XV Benchmark - 1920x1080 High Quality | |
| MSI Summit E16 Flip A12UDT-031 | |
| Lenovo Slim 7 Pro X 14ARH7 | |
| Razer Blade Stealth i7-1165G7 GTX 1650 Ti Max-Q | |
| GPD Win 4 | |
| Asus Zenbook S 13 OLED | |
| GPD Win Max 2 | |
| HP Spectre x360 13.5 14t-ef000 | |
| GPD Win 3 | |
| HP Spectre x360 2-in-1 16-f1075ng | |
| HP Pavilion Aero 13 be0097nr | |
| Infinix INBook X2 | |
| Strange Brigade - 1920x1080 ultra AA:ultra AF:16 | |
| MSI Summit E16 Flip A12UDT-031 | |
| Lenovo Slim 7 Pro X 14ARH7 | |
| Razer Blade Stealth i7-1165G7 GTX 1650 Ti Max-Q | |
| GPD Win 4 | |
| Asus Zenbook S 13 OLED | |
| GPD Win Max 2 | |
| HP Spectre x360 13.5 14t-ef000 | |
| HP Spectre x360 2-in-1 16-f1075ng | |
| GPD Win 3 | |
| HP Pavilion Aero 13 be0097nr | |
| Dota 2 Reborn - 1920x1080 ultra (3/3) best looking | |
| MSI Summit E16 Flip A12UDT-031 | |
| Razer Blade Stealth i7-1165G7 GTX 1650 Ti Max-Q | |
| Lenovo Slim 7 Pro X 14ARH7 | |
| GPD Win 4 | |
| Asus Zenbook S 13 OLED | |
| HP Spectre x360 13.5 14t-ef000 | |
| GPD Win Max 2 | |
| HP Spectre x360 2-in-1 16-f1075ng | |
| HP Pavilion Aero 13 be0097nr | |
| GPD Win 3 | |
| Dell XPS 13 9315 2-in-1 Core i5-1230U | |
| Infinix INBook X2 | |
| X-Plane 11.11 - 1920x1080 high (fps_test=3) | |
| MSI Summit E16 Flip A12UDT-031 | |
| Razer Blade Stealth i7-1165G7 GTX 1650 Ti Max-Q | |
| Lenovo Slim 7 Pro X 14ARH7 | |
| HP Spectre x360 2-in-1 16-f1075ng | |
| HP Spectre x360 13.5 14t-ef000 | |
| Asus Zenbook S 13 OLED | |
| GPD Win 4 | |
| GPD Win Max 2 | |
| GPD Win 3 | |
| HP Pavilion Aero 13 be0097nr | |
| Dell XPS 13 9315 2-in-1 Core i5-1230U | |
| Infinix INBook X2 | |
| F1 22 | |
| 1280x720 Ultra Low Preset AA:T AF:16x | |
| GPD Win 4 | |
| Átlagos AMD Radeon 680M (75.5 - 147.3, n=19) | |
| HP Spectre x360 2-in-1 16-f1075ng | |
| 1920x1080 Low Preset AA:T AF:16x | |
| GPD Win 4 | |
| Átlagos AMD Radeon 680M (44.1 - 85.4, n=25) | |
| HP Spectre x360 2-in-1 16-f1075ng | |
| 1920x1080 Medium Preset AA:T AF:16x | |
| GPD Win 4 | |
| Átlagos AMD Radeon 680M (38 - 75.1, n=25) | |
| HP Spectre x360 2-in-1 16-f1075ng | |
| 1920x1080 High Preset AA:T AF:16x | |
| GPD Win 4 | |
| Átlagos AMD Radeon 680M (30 - 56.2, n=25) | |
| HP Spectre x360 2-in-1 16-f1075ng | |
| 1920x1080 Ultra High Preset AA:T AF:16x | |
| HP Spectre x360 2-in-1 16-f1075ng | |
| GPD Win 4 | |
| Átlagos AMD Radeon 680M (7.85 - 14.7, n=22) | |
| Cyberpunk 2077 1.6 | |
| 1280x720 Low Preset | |
| Lenovo Slim 7 Pro X 14ARH7 | |
| Átlagos AMD Radeon 680M (46.1 - 77.6, n=14) | |
| GPD Win 4 | |
| Asus Zenbook S 13 OLED | |
| GPD Win Max 2 | |
| 1920x1080 Low Preset | |
| Lenovo Slim 7 Pro X 14ARH7 | |
| Átlagos AMD Radeon 680M (26 - 50.6, n=15) | |
| GPD Win 4 | |
| Asus Zenbook S 13 OLED | |
| HP Spectre x360 13.5 14t-ef000 | |
| GPD Win Max 2 | |
| 1920x1080 Medium Preset | |
| Lenovo Slim 7 Pro X 14ARH7 | |
| Átlagos AMD Radeon 680M (20.1 - 41.8, n=15) | |
| GPD Win 4 | |
| Asus Zenbook S 13 OLED | |
| HP Spectre x360 13.5 14t-ef000 | |
| GPD Win Max 2 | |
| 1920x1080 High Preset | |
| Lenovo Slim 7 Pro X 14ARH7 | |
| GPD Win 4 | |
| Átlagos AMD Radeon 680M (16.3 - 33.6, n=15) | |
| Asus Zenbook S 13 OLED | |
| HP Spectre x360 13.5 14t-ef000 | |
| GPD Win Max 2 | |
| 1920x1080 Ultra Preset | |
| Lenovo Slim 7 Pro X 14ARH7 | |
| Átlagos AMD Radeon 680M (14 - 23.8, n=15) | |
| GPD Win 4 | |
| Asus Zenbook S 13 OLED | |
| HP Spectre x360 13.5 14t-ef000 | |
| GPD Win Max 2 | |
Witcher 3 FPS Chart
| alacsony | közepes | magas | ultra | |
|---|---|---|---|---|
| GTA V (2015) | 140.3 | 127.6 | 51.4 | 24.8 |
| The Witcher 3 (2015) | 94.3 | 63.8 | 37.5 | 22.8 |
| Dota 2 Reborn (2015) | 120.2 | 100.1 | 76.4 | 67.2 |
| Final Fantasy XV Benchmark (2018) | 57.1 | 32.7 | 23.9 | |
| X-Plane 11.11 (2018) | 56.2 | 41.4 | 33.5 | |
| Strange Brigade (2018) | 145.7 | 57.5 | 47.8 | 41.5 |
| Cyberpunk 2077 1.6 (2022) | 37.7 | 28.9 | 21.6 | 16.7 |
| F1 22 (2022) | 78.1 | 70.4 | 51.5 | 12.6 |
Zajszint
| Üresjárat |
| 31.2 / 31.2 / 33.5 dB(A) |
| Terhelés |
| 45.5 / 49 dB(A) |
 | ||
30 dB csendes 40 dB(A) hallható 50 dB(A) hangos |
||
min: | ||
| GPD Win 4 Radeon 680M, R7 6800U, BiWin CE480Y2D100-1TB | GPD Win Max 2 Iris Xe G7 96EUs, i7-1260P, BiWin NQ200 1TB CNF82GS1D00-1TB | GPD Win 3 Iris Xe G7 80EUs, i5-1135G7, BIWIN NS200 1TB CNF82GS1G02-1TB | Razer Blade Stealth i7-1165G7 GTX 1650 Ti Max-Q GeForce GTX 1650 Ti Max-Q, i7-1165G7, Samsung SSD PM981a MZVLB512HBJQ | Dell XPS 13 9315 2-in-1 Core i5-1230U Iris Xe G7 80EUs, i5-1230U | Asus Zenbook S 13 OLED Radeon 680M, R7 6800U, Samsung PM9A1 MZVL21T0HCLR | |
|---|---|---|---|---|---|---|
| Noise | 18% | 6% | 11% | 19% | ||
| off / környezet * (dB) | 24 | 22.6 6% | 27.4 -14% | 25.3 -5% | 24 -0% | |
| Idle Minimum * (dB) | 31.2 | 23.7 24% | 29.1 7% | 25.3 19% | 24 23% | |
| Idle Average * (dB) | 31.2 | 23.7 24% | 29.1 7% | 25.3 19% | 24 23% | |
| Idle Maximum * (dB) | 33.5 | 28.5 15% | 29.1 13% | 27 19% | 24 28% | |
| Load Average * (dB) | 45.5 | 36.5 20% | 40.7 11% | 47.9 -5% | 33.1 27% | |
| Witcher 3 ultra * (dB) | 48.6 | 39.8 18% | 42.8 12% | 38.4 21% | 40.2 17% | |
| Load Maximum * (dB) | 49 | 40.5 17% | 46.3 6% | 45.9 6% | 41.7 15% |
* ... a kisebb jobb
(+) A felső oldalon a maximális hőmérséklet 35 °C / 95 F, összehasonlítva a 35.9 °C / 97 F átlagával , 21.4 és 59 °C között a Subnotebook osztálynál.
(+) Az alsó maximum 26.8 °C / 80 F-ig melegszik fel, összehasonlítva a 39.2 °C / 103 F átlagával
(+) Üresjáratban a felső oldal átlagos hőmérséklete 26 °C / 79 F, összehasonlítva a 30.8 °C / ### eszközátlaggal class_avg_f### F.
(+) A The Witcher 3 játék során a felső oldal átlaghőmérséklete 28.1 °C / 83 F, összehasonlítva a 30.8 °C / ## eszközátlaggal #class_avg_f### F.
(+) A csuklótámasz és az érintőpad eléri a bőr maximális hőmérsékletét (32.2 °C / 90 F), ezért nem forrók.
(-) A hasonló eszközök csuklótámasz területének átlagos hőmérséklete 28.2 °C / 82.8 F volt (-4 °C / -7.2 F).
| GPD Win 4 AMD Ryzen 7 6800U, AMD Radeon 680M | GPD Win Max 2 Intel Core i7-1260P, Intel Iris Xe Graphics G7 96EUs | Razer Blade Stealth i7-1165G7 GTX 1650 Ti Max-Q Intel Core i7-1165G7, NVIDIA GeForce GTX 1650 Ti Max-Q | Dell XPS 13 9315 2-in-1 Core i5-1230U Intel Core i5-1230U, Intel Iris Xe Graphics G7 80EUs | Asus Zenbook S 13 OLED AMD Ryzen 7 6800U, AMD Radeon 680M | |
|---|---|---|---|---|---|
| Heat | -1% | -40% | -17% | -37% | |
| Maximum Upper Side * (°C) | 35 | 28.6 18% | 44 -26% | 41.8 -19% | 47.9 -37% |
| Maximum Bottom * (°C) | 26.8 | 33 -23% | 47.4 -77% | 38.2 -43% | 56.1 -109% |
| Idle Upper Side * (°C) | 28.4 | 24.6 13% | 32.2 -13% | 27.4 4% | 26.8 6% |
| Idle Bottom * (°C) | 25 | 27.6 -10% | 36 -44% | 27.2 -9% | 27.3 -9% |
* ... a kisebb jobb
GPD Win 4 hangelemzés
(+) | a hangszórók viszonylag hangosan tudnak játszani (86.4 dB)
Basszus 100 - 315 Hz
(-) | szinte nincs basszus – átlagosan 26.1%-kal alacsonyabb a mediánnál
(±) | a basszus linearitása átlagos (9.1% delta az előző frekvenciához)
Közepes 400-2000 Hz
(±) | magasabb középértékek – átlagosan 7.3%-kal magasabb, mint a medián
(±) | a középpontok linearitása átlagos (7.4% delta az előző gyakorisághoz)
Maximum 2-16 kHz
(±) | magasabb csúcsok – átlagosan 5.6%-kal magasabb, mint a medián
(+) | a csúcsok lineárisak (5.4% delta az előző frekvenciához képest)
Összességében 100 - 16.000 Hz
(±) | az általános hang linearitása átlagos (25.6% eltérés a mediánhoz képest)
Ugyanazon osztályhoz képest
» 86%Ebben az osztályban az összes tesztelt eszköz %-a jobb volt, 3% hasonló, 11%-kal rosszabb
» A legjobb delta értéke 5%, az átlag 18%, a legrosszabb 53% volt
Az összes tesztelt eszközzel összehasonlítva
» 79% az összes tesztelt eszköz jobb volt, 4% hasonló, 17%-kal rosszabb
» A legjobb delta értéke 4%, az átlag 23%, a legrosszabb 134% volt
Apple MacBook Pro 16 2021 M1 Pro hangelemzés
(+) | a hangszórók viszonylag hangosan tudnak játszani (84.7 dB)
Basszus 100 - 315 Hz
(+) | jó basszus – csak 3.8% választja el a mediántól
(+) | a basszus lineáris (5.2% delta az előző frekvenciához)
Közepes 400-2000 Hz
(+) | kiegyensúlyozott középpontok – csak 1.3% választja el a mediántól
(+) | a középpontok lineárisak (2.1% delta az előző frekvenciához)
Maximum 2-16 kHz
(+) | kiegyensúlyozott csúcsok – csak 1.9% választja el a mediántól
(+) | a csúcsok lineárisak (2.7% delta az előző frekvenciához képest)
Összességében 100 - 16.000 Hz
(+) | általános hangzás lineáris (4.6% eltérés a mediánhoz képest)
Ugyanazon osztályhoz képest
» 0%Ebben az osztályban az összes tesztelt eszköz %-a jobb volt, 0% hasonló, 100%-kal rosszabb
» A legjobb delta értéke 5%, az átlag 17%, a legrosszabb 45% volt
Az összes tesztelt eszközzel összehasonlítva
» 0% az összes tesztelt eszköz jobb volt, 0% hasonló, 100%-kal rosszabb
» A legjobb delta értéke 4%, az átlag 23%, a legrosszabb 134% volt
| Kikapcsolt állapot / Készenlét | |
| Üresjárat | |
| Terhelés |
|
Kulcs:
min: | |
| GPD Win 4 R7 6800U, Radeon 680M, BiWin CE480Y2D100-1TB, IPS, 1920x1080, 6" | GPD Win Max 2 i7-1260P, Iris Xe G7 96EUs, BiWin NQ200 1TB CNF82GS1D00-1TB, IPS, 2560x1600, 10.1" | GPD Win 3 i5-1135G7, Iris Xe G7 80EUs, BIWIN NS200 1TB CNF82GS1G02-1TB, IPS, 1280x720, 5.5" | Razer Blade Stealth i7-1165G7 GTX 1650 Ti Max-Q i7-1165G7, GeForce GTX 1650 Ti Max-Q, Samsung SSD PM981a MZVLB512HBJQ, IPS, 1920x1080, 13.3" | Dell XPS 13 9315 2-in-1 Core i5-1230U i5-1230U, Iris Xe G7 80EUs, , IPS, 2880x1920, 13" | Asus Zenbook S 13 OLED R7 6800U, Radeon 680M, Samsung PM9A1 MZVL21T0HCLR, OLED, 2880x1800, 13.3" | |
|---|---|---|---|---|---|---|
| Power Consumption | 2% | 45% | -20% | 32% | 18% | |
| Idle Minimum * (Watt) | 7.5 | 5.8 23% | 2.9 61% | 4 47% | 5.2 31% | 4.8 36% |
| Idle Average * (Watt) | 12.4 | 10.2 18% | 4.5 64% | 6.3 49% | 7.9 36% | 8.7 30% |
| Idle Maximum * (Watt) | 13 | 11.5 12% | 4.5 65% | 14.5 -12% | 8 38% | 10.1 22% |
| Load Average * (Watt) | 46 | 47.7 -4% | 38.5 16% | 79.2 -72% | 31.2 32% | 45.6 1% |
| Witcher 3 ultra * (Watt) | 45.2 | 45.6 -1% | 28.9 36% | 68.2 -51% | 28.2 38% | 42.4 6% |
| Load Maximum * (Watt) | 56 | 76.8 -37% | 41.4 26% | 99.4 -78% | 47.6 15% | 49.5 12% |
* ... a kisebb jobb
Power Consumption Witcher 3 / Stresstest
Power Consumption external Monitor
| GPD Win 4 R7 6800U, Radeon 680M, 46 Wh | GPD Win Max 2 i7-1260P, Iris Xe G7 96EUs, 70 Wh | GPD Win 3 i5-1135G7, Iris Xe G7 80EUs, 44 Wh | Razer Blade Stealth i7-1165G7 GTX 1650 Ti Max-Q i7-1165G7, GeForce GTX 1650 Ti Max-Q, 53.1 Wh | Dell XPS 13 9315 2-in-1 Core i5-1230U i5-1230U, Iris Xe G7 80EUs, 49.5 Wh | Asus Zenbook S 13 OLED R7 6800U, Radeon 680M, 67 Wh | |
|---|---|---|---|---|---|---|
| Akkumulátor üzemidő | 35% | 26% | 66% | 38% | 54% | |
| Reader / Idle (h) | 9.7 | 15.4 59% | 20.6 112% | 13.6 40% | ||
| WiFi v1.3 (h) | 7.5 | 8.7 16% | 11.3 51% | 9 20% | 9 20% | 9.2 23% |
| Load (h) | 1.3 | 1.7 31% | 1.3 0% | 2 54% | 2.4 85% | |
| H.264 (h) | 15.2 |
Pro
Kontra
Összegzés - A Steam Deck így már elavultnak tűnik

A Win 4 szinte minden szempontból hatalmas előrelépés a Win 3-hoz képest. A kijelző nagyobb, a kezelőszervek tapinthatóbbak, a dizájn szolidabb és vonzóbb, a billentyűzet megbízhatóbb, a teljesítmény pedig jóval gyorsabb. Az előlapra rácsaphatunk egy PS logót, és valószínűleg sokakat megtévesztene.
Az új képernyő, a teljesítmény és a beépített fizikai billentyűzet hozzájárul a Win 4 nagyobb súlyához, vastagabb profiljához és hangosabb ventilátor zajhoz, ami a modell három legnagyobb hátránya. Lehet, hogy masszívan megépített, de más kézi gamer készülékek, mint a Switch vagy a OneXPlayer vékonyabbak és könnyebbek, így könnyebb útközben játszani. Még így is van előnye a Steam Deck-el szemben, amely lassúbb és nagyobb is, mint a GPD megoldása.
A GPD Win 4 a nagy teljesítményű AMD Radeon 680M GPU-t és a rendkívüli minőséget ötvözi egy olyan kézi számítógépben, amely szinte minden tekintetben háttérbe szorítja a Steam Deck-et.
A Win 4 két hiányzó tulajdonsága a gyenge végfelhasználói szervizelhetőség és a FreeSync hiánya. A sűrűn pakolt kialakítás megnehezíti a belső SSD vagy az esetlegesen eltört gombok cseréjét, míg a FreeSync minden további hardver nélkül is javította volna a játékélményt. Ami azt illeti, a kijelző rendelkezik natív 40 Hz-es móddal, ha a felhasználók a 40 FPS-t szeretnék megcélozni a ritkább képernyő „tearing” (szakadás) érdekében.
Amit mindenképpen ki kéne javítani, az a gyenge képkockasebesség-stabilitás vagy a játék közbeni mikro-akadozások. A legtöbb Ultrabook és különösen a gamer laptopok nem mutatják ezt a problémát, és ugyanezt várjuk egy olyan kézi készüléktől is, ahol a játék a legfontosabb értékesítési szempont.
A jövőbeli modellek esetében szeretnénk, ha a GPD még több technológiát építene a készülékébe a jelenlegi gamer laptopokból, hogy minimalizálja a vastagságot és potenciálisan a súlyt. A folyékony fém hővezető paszta, a gőzkamrás hűtés és a nagyobb belső ventilátor például nagyobb teljesítményt tenne lehetővé a mérethez mérten. Addig is, a GPD Win 4 egyértelműen a jelenleg elérhető legjobb és leggyorsabb Windows-alapú kézi gamer készülékek közé tartozik.
Ár és Elérhetőség
A Win 4 Indiegogo oldala már elérhető, az első szállítások 2023 márciusában kezdődnek. A konfigurációk 16 GB RAM és 1 TB SSD esetén 1000 USD alatt kezdődnek, a dupla RAM és tárhely esetén pedig 1300 USD-tól.
Átláthatóság
A felülvizsgálandó készülékek kiválasztását szerkesztőségünk végzi. A tesztmintát a gyártó vagy a kiskereskedő kölcsönként bocsátotta a szerző rendelkezésére a felülvizsgálat céljából. A hitelezőnek nem volt befolyása erre a felülvizsgálatra, és a gyártó sem kapott másolatot erről a felülvizsgálatról a közzététel előtt. Nem volt kötelesség ezt az ismertetőt közzétenni. Független médiavállalatként a Notebookcheck nincs alávetve a gyártók, kiskereskedők vagy kiadók felhatalmazásának.
Így tesztel a Notebookcheck
A Notebookcheck minden évben független, laptopok és okostelefonok százait vizsgálja meg szabványosított eljárások alkalmazásával annak érdekében, hogy minden eredmény összehasonlítható legyen. Körülbelül 20 éve folyamatosan fejlesztjük vizsgálati módszereinket, és ennek során iparági szabványokat állítottunk fel. Tesztlaboratóriumainkban kiváló minőségű mérőberendezéseket használnak tapasztalt technikusok és szerkesztők. Ezek a tesztek többlépcsős validációs folyamatot foglalnak magukban. Komplex minősítési rendszerünk több száz megalapozott mérésen és benchmarkon alapul, ami megőrzi az objektivitást.Price comparison

