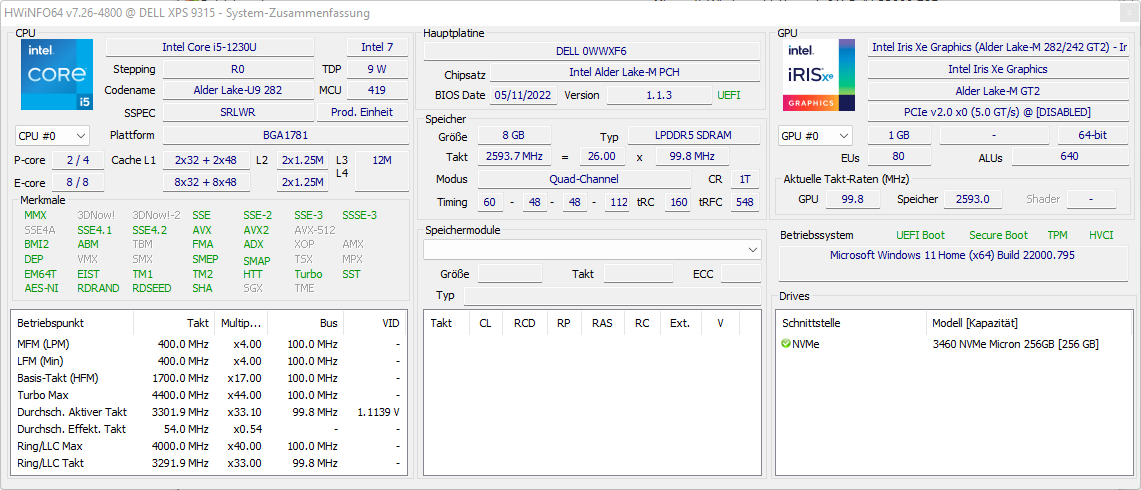
Dell XPS 13 9315 Laptop rövid értékelés: Kis teljesítmény, hihetetlen üzemidő
Potential Competitors in Comparison
Értékelés | Dátum | Modell | Súly | Magasság | Méret | Felbontás | Legjobb ár |
|---|---|---|---|---|---|---|---|
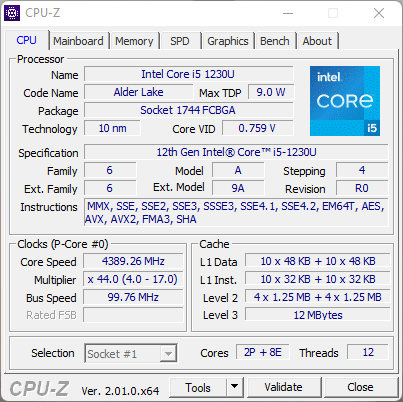
| 88.2 % v7 (old) | 11/2022 | Dell XPS 13 9315, i5-1230U i5-1230U, Iris Xe G7 80EUs | 1.2 kg | 14 mm | 13.40" | 1920x1200 | |
| 91.1 % v7 (old) | 12/2020 | Apple MacBook Air 2020 M1 Entry M1, M1 7-Core GPU | 1.3 kg | 16.1 mm | 13.30" | 2560x1600 | |
| 90.1 % v7 (old) | 09/2022 | Asus Zenbook S 13 OLED R7 6800U, Radeon 680M | 1.1 kg | 14.9 mm | 13.30" | 2880x1800 | |
| 89.8 % v7 (old) | 02/2021 | Lenovo ThinkPad X1 Nano-20UN002UGE i7-1160G7, Iris Xe G7 96EUs | 946 g | 16 mm | 13.00" | 2160x1350 | |
| 88.8 % v7 (old) | Huawei MateBook 13s i5 11300H i5-11300H, Iris Xe G7 80EUs | 1.3 kg | 16.5 mm | 13.40" | 2520x1680 | ||
| 86.9 % v7 (old) | 08/2022 | Dell XPS 13 Plus 9320 4K i7-1260P, Iris Xe G7 96EUs | 1.2 kg | 15.3 mm | 13.40" | 3840x2400 | |
| 86.1 % v7 (old) | 09/2022 | Dell XPS 13 Plus 9320 i5-1240p i5-1240P, Iris Xe G7 80EUs | 1.2 kg | 15.3 mm | 13.40" | 1920x1200 |
| Networking | |
| iperf3 transmit AX12 | |
| Átlagos Intel Wi-Fi 6E AX211 (1003 - 1501, n=4) | |
| Lenovo ThinkPad X1 Nano-20UN002UGE | |
| Dell XPS 13 9310 Core i7 FHD | |
| Huawei MateBook 13s i5 11300H | |
| Apple MacBook Air 2020 M1 Entry | |
| iperf3 receive AX12 | |
| Dell XPS 13 9310 Core i7 FHD | |
| Átlagos Intel Wi-Fi 6E AX211 (1178 - 1623, n=4) | |
| Lenovo ThinkPad X1 Nano-20UN002UGE | |
| Huawei MateBook 13s i5 11300H | |
| Apple MacBook Air 2020 M1 Entry | |
| iperf3 receive AXE11000 6GHz | |
| Dell XPS 13 9315, i5-1230U | |
| Dell XPS 13 Plus 9320 i5-1240p | |
| Az osztály átlaga Subnotebook (1250 - 1784, n=23, az elmúlt 2 évben) | |
| Átlagos Intel Wi-Fi 6E AX211 (700 - 1857, n=226) | |
| iperf3 transmit AXE11000 6GHz | |
| Átlagos Intel Wi-Fi 6E AX211 (385 - 1851, n=226) | |
| Az osztály átlaga Subnotebook (524 - 1797, n=23, az elmúlt 2 évben) | |
| Dell XPS 13 9315, i5-1230U | |
| Dell XPS 13 Plus 9320 i5-1240p | |


| |||||||||||||||||||||||||
Fényerő megoszlás: 89 %
Centrumban: 406 cd/m²
Kontraszt: 1165:1 (Fekete: 0.4 cd/m²)
ΔE ColorChecker Calman: 3.03 | ∀{0.5-29.43 Ø4.72}
calibrated: 2.34
ΔE Greyscale Calman: 3.12 | ∀{0.09-98 Ø4.97}
71% AdobeRGB 1998 (Argyll 3D)
100% sRGB (Argyll 3D)
69% Display P3 (Argyll 3D)
Gamma: 2.41
CCT: 6418 K
| Dell XPS 13 9315, i5-1230U Sharp SHP1548 LQ134N1, IPS, 1920x1200, 13.4" | Apple MacBook Air 2020 M1 Entry IPS, 2560x1600, 13.3" | Asus Zenbook S 13 OLED SDC4172, OLED, 2880x1800, 13.3" | Lenovo ThinkPad X1 Nano-20UN002UGE MND007ZA1-2, IPS, 2160x1350, 13" | Huawei MateBook 13s i5 11300H TL134GDXP02-0, LTPS, 2520x1680, 13.4" | Dell XPS 13 Plus 9320 4K LQ134R1, IPS, 3840x2400, 13.4" | |
|---|---|---|---|---|---|---|
| Display | 21% | 28% | 1% | -6% | 6% | |
| Display P3 Coverage (%) | 69 | 98.6 43% | 99.8 45% | 70.4 2% | 65.2 -6% | 76.5 11% |
| sRGB Coverage (%) | 100 | 100 0% | 100 0% | 99.9 0% | 92 -8% | 100 0% |
| AdobeRGB 1998 Coverage (%) | 71 | 85.9 21% | 97.8 38% | 72 1% | 67.5 -5% | 76 7% |
| Response Times | 2% | 94% | -22% | -8% | 2% | |
| Response Time Grey 50% / Grey 80% * (ms) | 40 ? | 31 ? 22% | 2.1 ? 95% | 46.8 ? -17% | 44.8 ? -12% | 38.9 ? 3% |
| Response Time Black / White * (ms) | 22 ? | 26.1 ? -19% | 1.68 ? 92% | 28 ? -27% | 22.8 ? -4% | 21.9 ? -0% |
| PWM Frequency (Hz) | 118000 ? | 240.4 ? | 9804 ? | |||
| Screen | 23% | 175% | 31% | 25% | 18% | |
| Brightness middle (cd/m²) | 466 | 417 -11% | 336 -28% | 460 -1% | 468 0% | 494 6% |
| Brightness (cd/m²) | 442 | 395 -11% | 338 -24% | 434 -2% | 450 2% | 474 7% |
| Brightness Distribution (%) | 89 | 91 2% | 99 11% | 92 3% | 92 3% | 89 0% |
| Black Level * (cd/m²) | 0.4 | 0.39 2% | 0.02 95% | 0.27 32% | 0.23 43% | 0.28 30% |
| Contrast (:1) | 1165 | 1069 -8% | 16800 1342% | 1704 46% | 2035 75% | 1764 51% |
| Colorchecker dE 2000 * | 3.03 | 1.12 63% | 1.8 41% | 1.1 64% | 2 34% | 3.1 -2% |
| Colorchecker dE 2000 max. * | 6.68 | 2.71 59% | 3.8 43% | 4.5 33% | 5.5 18% | 4.2 37% |
| Colorchecker dE 2000 calibrated * | 2.34 | 0.77 67% | 1.8 23% | 1 57% | 1.5 36% | 1.5 36% |
| Greyscale dE 2000 * | 3.12 | 1.7 46% | 0.9 71% | 1.6 49% | 2.6 17% | 3.2 -3% |
| Gamma | 2.41 91% | 2207 0% | 2.22 99% | 2.2 100% | 2.17 101% | 2.41 91% |
| CCT | 6418 101% | 6870 95% | 6580 99% | 6475 100% | 6511 100% | 6189 105% |
| Color Space (Percent of AdobeRGB 1998) (%) | 65.7 | |||||
| Color Space (Percent of sRGB) (%) | 99.9 | |||||
| Teljes átlag (program / beállítások) | 15% /
20% | 99% /
132% | 3% /
17% | 4% /
14% | 9% /
13% |
* ... a kisebb jobb
Megjelenítési válaszidők
| ↔ Válaszidő Fekete-fehér | ||
|---|---|---|
| 22 ms ... emelkedés és süllyedés ↘ kombinálva | ↗ 9 ms emelkedés |  |
| ↘ 13 ms ősz | ||
| A képernyő jó reakciósebességet mutat tesztjeinkben, de túl lassú lehet a versenyképes játékosok számára. Összehasonlításképpen, az összes tesztelt eszköz 0.1 (minimum) és 240 (maximum) ms között mozog. » 49 % of all devices are better. Ez azt jelenti, hogy a mért válaszidő rosszabb, mint az összes vizsgált eszköz átlaga (19.8 ms). | ||
| ↔ Válaszidő 50% szürke és 80% szürke között | ||
| 40 ms ... emelkedés és süllyedés ↘ kombinálva | ↗ 20 ms emelkedés |  |
| ↘ 20 ms ősz | ||
| A képernyő lassú reakciósebességet mutat tesztjeinkben, és nem lesz kielégítő a játékosok számára. Összehasonlításképpen, az összes tesztelt eszköz 0.165 (minimum) és 636 (maximum) ms között mozog. » 61 % of all devices are better. Ez azt jelenti, hogy a mért válaszidő rosszabb, mint az összes vizsgált eszköz átlaga (31 ms). | ||
Képernyő villogása / PWM (impulzusszélesség-moduláció)
| Képernyő villogása / PWM nem érzékelhető | ≤ 100 % fényerő beállítása |    | |
Összehasonlításképpen: az összes tesztelt eszköz 52 %-a nem használja a PWM-et a kijelző elsötétítésére. Ha PWM-et észleltek, akkor átlagosan 7753 (minimum: 5 - maximum: 343500) Hz-t mértek. | |||
Cinebench R15 Multi Loop
Cinebench R23: Multi Core | Single Core
Cinebench R20: CPU (Multi Core) | CPU (Single Core)
Cinebench R15: CPU Multi 64Bit | CPU Single 64Bit
7-Zip 18.03: 7z b 4 | 7z b 4 -mmt1
Geekbench 5.5: Multi-Core | Single-Core
| CPU Performance rating | |
| Az osztály átlaga Subnotebook | |
| Dell XPS 13 Plus 9320 4K | |
| Asus Zenbook S 13 OLED | |
| Dell XPS 13 Plus 9320 i5-1240p | |
| Apple MacBook Air 2020 M1 Entry | |
| Huawei MateBook 13s i5 11300H | |
| Átlagos Intel Core i5-1230U | |
| Lenovo ThinkPad X1 Nano-20UN002UGE -1! | |
| Dell XPS 13 9315, i5-1230U | |
| Cinebench R23 / Multi Core | |
| Az osztály átlaga Subnotebook (1555 - 21812, n=59, az elmúlt 2 évben) | |
| Asus Zenbook S 13 OLED | |
| Dell XPS 13 Plus 9320 4K | |
| Dell XPS 13 Plus 9320 i5-1240p | |
| Apple MacBook Air 2020 M1 Entry | |
| Lenovo ThinkPad X1 Nano-20UN002UGE | |
| Huawei MateBook 13s i5 11300H | |
| Átlagos Intel Core i5-1230U (3066 - 7264, n=3) | |
| Dell XPS 13 9315, i5-1230U | |
| Cinebench R23 / Single Core | |
| Az osztály átlaga Subnotebook (358 - 2213, n=60, az elmúlt 2 évben) | |
| Dell XPS 13 Plus 9320 4K | |
| Dell XPS 13 Plus 9320 i5-1240p | |
| Apple MacBook Air 2020 M1 Entry | |
| Asus Zenbook S 13 OLED | |
| Átlagos Intel Core i5-1230U (1135 - 1512, n=3) | |
| Dell XPS 13 9315, i5-1230U | |
| Huawei MateBook 13s i5 11300H | |
| Cinebench R20 / CPU (Multi Core) | |
| Az osztály átlaga Subnotebook (579 - 8541, n=56, az elmúlt 2 évben) | |
| Asus Zenbook S 13 OLED | |
| Dell XPS 13 Plus 9320 4K | |
| Dell XPS 13 Plus 9320 i5-1240p | |
| Huawei MateBook 13s i5 11300H | |
| Átlagos Intel Core i5-1230U (1175 - 2802, n=3) | |
| Apple MacBook Air 2020 M1 Entry | |
| Lenovo ThinkPad X1 Nano-20UN002UGE | |
| Dell XPS 13 9315, i5-1230U | |
| Cinebench R20 / CPU (Single Core) | |
| Az osztály átlaga Subnotebook (128 - 832, n=56, az elmúlt 2 évben) | |
| Dell XPS 13 Plus 9320 4K | |
| Dell XPS 13 Plus 9320 i5-1240p | |
| Asus Zenbook S 13 OLED | |
| Lenovo ThinkPad X1 Nano-20UN002UGE | |
| Átlagos Intel Core i5-1230U (441 - 580, n=3) | |
| Dell XPS 13 9315, i5-1230U | |
| Huawei MateBook 13s i5 11300H | |
| Apple MacBook Air 2020 M1 Entry | |
| Cinebench R15 / CPU Multi 64Bit | |
| Az osztály átlaga Subnotebook (327 - 3345, n=56, az elmúlt 2 évben) | |
| Asus Zenbook S 13 OLED | |
| Dell XPS 13 Plus 9320 4K | |
| Dell XPS 13 Plus 9320 4K | |
| Dell XPS 13 Plus 9320 i5-1240p | |
| Apple MacBook Air 2020 M1 Entry | |
| Huawei MateBook 13s i5 11300H | |
| Huawei MateBook 13s i5 11300H | |
| Lenovo ThinkPad X1 Nano-20UN002UGE | |
| Átlagos Intel Core i5-1230U (433 - 1254, n=3) | |
| Dell XPS 13 9315, i5-1230U | |
| Cinebench R15 / CPU Single 64Bit | |
| Az osztály átlaga Subnotebook (72.4 - 322, n=56, az elmúlt 2 évben) | |
| Dell XPS 13 Plus 9320 4K | |
| Asus Zenbook S 13 OLED | |
| Dell XPS 13 Plus 9320 i5-1240p | |
| Apple MacBook Air 2020 M1 Entry | |
| Lenovo ThinkPad X1 Nano-20UN002UGE | |
| Huawei MateBook 13s i5 11300H | |
| Dell XPS 13 9315, i5-1230U | |
| Átlagos Intel Core i5-1230U (120.1 - 221, n=3) | |
| 7-Zip 18.03 / 7z b 4 | |
| Asus Zenbook S 13 OLED | |
| Az osztály átlaga Subnotebook (11668 - 77867, n=56, az elmúlt 2 évben) | |
| Dell XPS 13 Plus 9320 4K | |
| Dell XPS 13 Plus 9320 i5-1240p | |
| Apple MacBook Air 2020 M1 Entry | |
| Huawei MateBook 13s i5 11300H | |
| Átlagos Intel Core i5-1230U (12470 - 34505, n=3) | |
| Lenovo ThinkPad X1 Nano-20UN002UGE | |
| Dell XPS 13 9315, i5-1230U | |
| 7-Zip 18.03 / 7z b 4 -mmt1 | |
| Az osztály átlaga Subnotebook (2643 - 6699, n=58, az elmúlt 2 évben) | |
| Apple MacBook Air 2020 M1 Entry | |
| Asus Zenbook S 13 OLED | |
| Dell XPS 13 Plus 9320 4K | |
| Huawei MateBook 13s i5 11300H | |
| Dell XPS 13 Plus 9320 i5-1240p | |
| Lenovo ThinkPad X1 Nano-20UN002UGE | |
| Átlagos Intel Core i5-1230U (3873 - 4870, n=3) | |
| Dell XPS 13 9315, i5-1230U | |
| Geekbench 5.5 / Multi-Core | |
| Az osztály átlaga Subnotebook (2557 - 17218, n=47, az elmúlt 2 évben) | |
| Dell XPS 13 Plus 9320 4K | |
| Asus Zenbook S 13 OLED | |
| Apple MacBook Air 2020 M1 Entry | |
| Dell XPS 13 9315, i5-1230U | |
| Átlagos Intel Core i5-1230U (4193 - 7309, n=3) | |
| Huawei MateBook 13s i5 11300H | |
| Lenovo ThinkPad X1 Nano-20UN002UGE | |
| Dell XPS 13 Plus 9320 i5-1240p | |
| Geekbench 5.5 / Single-Core | |
| Az osztály átlaga Subnotebook (726 - 2224, n=47, az elmúlt 2 évben) | |
| Apple MacBook Air 2020 M1 Entry | |
| Dell XPS 13 Plus 9320 4K | |
| Dell XPS 13 9315, i5-1230U | |
| Dell XPS 13 Plus 9320 i5-1240p | |
| Átlagos Intel Core i5-1230U (1454 - 1640, n=3) | |
| Asus Zenbook S 13 OLED | |
| Huawei MateBook 13s i5 11300H | |
| Lenovo ThinkPad X1 Nano-20UN002UGE | |
AIDA64: FP32 Ray-Trace | FPU Julia | CPU SHA3 | CPU Queen | FPU SinJulia | FPU Mandel | CPU AES | CPU ZLib | FP64 Ray-Trace | CPU PhotoWorxx
| Performance rating | |
| Asus Zenbook S 13 OLED | |
| Az osztály átlaga Subnotebook | |
| Huawei MateBook 13s i5 11300H | |
| Dell XPS 13 Plus 9320 4K | |
| Dell XPS 13 Plus 9320 i5-1240p | |
| Lenovo ThinkPad X1 Nano-20UN002UGE | |
| Átlagos Intel Core i5-1230U | |
| Dell XPS 13 9315, i5-1230U | |
| AIDA64 / FP32 Ray-Trace | |
| Az osztály átlaga Subnotebook (1135 - 32888, n=57, az elmúlt 2 évben) | |
| Asus Zenbook S 13 OLED | |
| Huawei MateBook 13s i5 11300H | |
| Lenovo ThinkPad X1 Nano-20UN002UGE | |
| Dell XPS 13 Plus 9320 4K | |
| Dell XPS 13 Plus 9320 i5-1240p | |
| Átlagos Intel Core i5-1230U (2344 - 6360, n=3) | |
| Dell XPS 13 9315, i5-1230U | |
| AIDA64 / FPU Julia | |
| Asus Zenbook S 13 OLED | |
| Az osztály átlaga Subnotebook (5218 - 123315, n=57, az elmúlt 2 évben) | |
| Huawei MateBook 13s i5 11300H | |
| Lenovo ThinkPad X1 Nano-20UN002UGE | |
| Dell XPS 13 Plus 9320 4K | |
| Dell XPS 13 Plus 9320 i5-1240p | |
| Átlagos Intel Core i5-1230U (11867 - 31714, n=3) | |
| Dell XPS 13 9315, i5-1230U | |
| AIDA64 / CPU SHA3 | |
| Az osztály átlaga Subnotebook (444 - 5287, n=57, az elmúlt 2 évben) | |
| Asus Zenbook S 13 OLED | |
| Huawei MateBook 13s i5 11300H | |
| Lenovo ThinkPad X1 Nano-20UN002UGE | |
| Dell XPS 13 Plus 9320 4K | |
| Dell XPS 13 Plus 9320 i5-1240p | |
| Átlagos Intel Core i5-1230U (772 - 1711, n=3) | |
| Dell XPS 13 9315, i5-1230U | |
| AIDA64 / CPU Queen | |
| Asus Zenbook S 13 OLED | |
| Dell XPS 13 Plus 9320 4K | |
| Dell XPS 13 Plus 9320 i5-1240p | |
| Az osztály átlaga Subnotebook (10579 - 95002, n=49, az elmúlt 2 évben) | |
| Dell XPS 13 9315, i5-1230U | |
| Huawei MateBook 13s i5 11300H | |
| Átlagos Intel Core i5-1230U (30824 - 52533, n=3) | |
| Lenovo ThinkPad X1 Nano-20UN002UGE | |
| AIDA64 / FPU SinJulia | |
| Asus Zenbook S 13 OLED | |
| Az osztály átlaga Subnotebook (744 - 18418, n=57, az elmúlt 2 évben) | |
| Dell XPS 13 Plus 9320 4K | |
| Dell XPS 13 Plus 9320 i5-1240p | |
| Huawei MateBook 13s i5 11300H | |
| Lenovo ThinkPad X1 Nano-20UN002UGE | |
| Átlagos Intel Core i5-1230U (2269 - 3947, n=3) | |
| Dell XPS 13 9315, i5-1230U | |
| AIDA64 / FPU Mandel | |
| Asus Zenbook S 13 OLED | |
| Az osztály átlaga Subnotebook (3341 - 65433, n=57, az elmúlt 2 évben) | |
| Huawei MateBook 13s i5 11300H | |
| Lenovo ThinkPad X1 Nano-20UN002UGE | |
| Dell XPS 13 Plus 9320 i5-1240p | |
| Dell XPS 13 Plus 9320 4K | |
| Átlagos Intel Core i5-1230U (6379 - 15896, n=3) | |
| Dell XPS 13 9315, i5-1230U | |
| AIDA64 / CPU AES | |
| Asus Zenbook S 13 OLED | |
| Huawei MateBook 13s i5 11300H | |
| Lenovo ThinkPad X1 Nano-20UN002UGE | |
| Az osztály átlaga Subnotebook (638 - 96917, n=57, az elmúlt 2 évben) | |
| Dell XPS 13 Plus 9320 i5-1240p | |
| Dell XPS 13 Plus 9320 4K | |
| Átlagos Intel Core i5-1230U (18011 - 31941, n=3) | |
| Dell XPS 13 9315, i5-1230U | |
| AIDA64 / CPU ZLib | |
| Az osztály átlaga Subnotebook (164.9 - 1379, n=57, az elmúlt 2 évben) | |
| Dell XPS 13 Plus 9320 4K | |
| Dell XPS 13 Plus 9320 i5-1240p | |
| Asus Zenbook S 13 OLED | |
| Huawei MateBook 13s i5 11300H | |
| Átlagos Intel Core i5-1230U (229 - 495, n=3) | |
| Lenovo ThinkPad X1 Nano-20UN002UGE | |
| Dell XPS 13 9315, i5-1230U | |
| AIDA64 / FP64 Ray-Trace | |
| Az osztály átlaga Subnotebook (610 - 17495, n=57, az elmúlt 2 évben) | |
| Asus Zenbook S 13 OLED | |
| Huawei MateBook 13s i5 11300H | |
| Lenovo ThinkPad X1 Nano-20UN002UGE | |
| Dell XPS 13 Plus 9320 4K | |
| Dell XPS 13 Plus 9320 i5-1240p | |
| Átlagos Intel Core i5-1230U (1328 - 3305, n=3) | |
| Dell XPS 13 9315, i5-1230U | |
| AIDA64 / CPU PhotoWorxx | |
| Az osztály átlaga Subnotebook (6569 - 85600, n=57, az elmúlt 2 évben) | |
| Dell XPS 13 Plus 9320 4K | |
| Dell XPS 13 Plus 9320 i5-1240p | |
| Lenovo ThinkPad X1 Nano-20UN002UGE | |
| Huawei MateBook 13s i5 11300H | |
| Átlagos Intel Core i5-1230U (17516 - 37042, n=3) | |
| Asus Zenbook S 13 OLED | |
| Dell XPS 13 9315, i5-1230U | |
CrossMark: Overall | Productivity | Creativity | Responsiveness
| PCMark 10 / Score | |
| Az osztály átlaga Subnotebook (4920 - 9939, n=44, az elmúlt 2 évben) | |
| Asus Zenbook S 13 OLED | |
| Dell XPS 13 Plus 9320 4K | |
| Huawei MateBook 13s i5 11300H | |
| Dell XPS 13 Plus 9320 i5-1240p | |
| Dell XPS 13 9315, i5-1230U | |
| Lenovo ThinkPad X1 Nano-20UN002UGE | |
| Átlagos Intel Core i5-1230U, Intel Iris Xe Graphics G7 80EUs (4001 - 4943, n=3) | |
| PCMark 10 / Essentials | |
| Asus Zenbook S 13 OLED | |
| Dell XPS 13 Plus 9320 4K | |
| Az osztály átlaga Subnotebook (8552 - 11646, n=44, az elmúlt 2 évben) | |
| Dell XPS 13 9315, i5-1230U | |
| Huawei MateBook 13s i5 11300H | |
| Lenovo ThinkPad X1 Nano-20UN002UGE | |
| Átlagos Intel Core i5-1230U, Intel Iris Xe Graphics G7 80EUs (8348 - 10139, n=3) | |
| Dell XPS 13 Plus 9320 i5-1240p | |
| PCMark 10 / Productivity | |
| Az osztály átlaga Subnotebook (5435 - 16606, n=44, az elmúlt 2 évben) | |
| Asus Zenbook S 13 OLED | |
| Dell XPS 13 Plus 9320 4K | |
| Dell XPS 13 Plus 9320 i5-1240p | |
| Dell XPS 13 9315, i5-1230U | |
| Huawei MateBook 13s i5 11300H | |
| Átlagos Intel Core i5-1230U, Intel Iris Xe Graphics G7 80EUs (5735 - 6692, n=3) | |
| Lenovo ThinkPad X1 Nano-20UN002UGE | |
| PCMark 10 / Digital Content Creation | |
| Az osztály átlaga Subnotebook (5722 - 13779, n=44, az elmúlt 2 évben) | |
| Asus Zenbook S 13 OLED | |
| Dell XPS 13 Plus 9320 4K | |
| Dell XPS 13 Plus 9320 i5-1240p | |
| Huawei MateBook 13s i5 11300H | |
| Lenovo ThinkPad X1 Nano-20UN002UGE | |
| Dell XPS 13 9315, i5-1230U | |
| Átlagos Intel Core i5-1230U, Intel Iris Xe Graphics G7 80EUs (3632 - 4833, n=3) | |
| CrossMark / Overall | |
| Dell XPS 13 Plus 9320 4K | |
| Az osztály átlaga Subnotebook (365 - 2356, n=59, az elmúlt 2 évben) | |
| Asus Zenbook S 13 OLED | |
| Dell XPS 13 Plus 9320 i5-1240p | |
| Apple MacBook Air 2020 M1 Entry | |
| Huawei MateBook 13s i5 11300H | |
| Dell XPS 13 9315, i5-1230U | |
| Átlagos Intel Core i5-1230U, Intel Iris Xe Graphics G7 80EUs (1117 - 1383, n=3) | |
| CrossMark / Productivity | |
| Dell XPS 13 Plus 9320 4K | |
| Az osztály átlaga Subnotebook (364 - 2277, n=59, az elmúlt 2 évben) | |
| Asus Zenbook S 13 OLED | |
| Huawei MateBook 13s i5 11300H | |
| Dell XPS 13 Plus 9320 i5-1240p | |
| Dell XPS 13 9315, i5-1230U | |
| Átlagos Intel Core i5-1230U, Intel Iris Xe Graphics G7 80EUs (1187 - 1356, n=3) | |
| Apple MacBook Air 2020 M1 Entry | |
| CrossMark / Creativity | |
| Dell XPS 13 Plus 9320 4K | |
| Az osztály átlaga Subnotebook (372 - 2743, n=59, az elmúlt 2 évben) | |
| Dell XPS 13 Plus 9320 i5-1240p | |
| Apple MacBook Air 2020 M1 Entry | |
| Asus Zenbook S 13 OLED | |
| Dell XPS 13 9315, i5-1230U | |
| Átlagos Intel Core i5-1230U, Intel Iris Xe Graphics G7 80EUs (1095 - 1469, n=3) | |
| Huawei MateBook 13s i5 11300H | |
| CrossMark / Responsiveness | |
| Huawei MateBook 13s i5 11300H | |
| Dell XPS 13 Plus 9320 4K | |
| Az osztály átlaga Subnotebook (312 - 1854, n=59, az elmúlt 2 évben) | |
| Dell XPS 13 Plus 9320 i5-1240p | |
| Asus Zenbook S 13 OLED | |
| Dell XPS 13 9315, i5-1230U | |
| Átlagos Intel Core i5-1230U, Intel Iris Xe Graphics G7 80EUs (990 - 1224, n=3) | |
| Apple MacBook Air 2020 M1 Entry | |
| PCMark 10 Score | 4633 pontok | |
Segítség | ||
| AIDA64 / Memory Copy | |
| Az osztály átlaga Subnotebook (14554 - 131023, n=57, az elmúlt 2 évben) | |
| Dell XPS 13 Plus 9320 4K | |
| Dell XPS 13 Plus 9320 i5-1240p | |
| Huawei MateBook 13s i5 11300H | |
| Dell XPS 13 9315, i5-1230U | |
| Átlagos Intel Core i5-1230U (32539 - 60944, n=3) | |
| Asus Zenbook S 13 OLED | |
| Lenovo ThinkPad X1 Nano-20UN002UGE | |
| AIDA64 / Memory Read | |
| Az osztály átlaga Subnotebook (15948 - 127174, n=57, az elmúlt 2 évben) | |
| Dell XPS 13 Plus 9320 i5-1240p | |
| Dell XPS 13 Plus 9320 4K | |
| Dell XPS 13 9315, i5-1230U | |
| Huawei MateBook 13s i5 11300H | |
| Átlagos Intel Core i5-1230U (31342 - 60435, n=3) | |
| Lenovo ThinkPad X1 Nano-20UN002UGE | |
| Asus Zenbook S 13 OLED | |
| AIDA64 / Memory Write | |
| Az osztály átlaga Subnotebook (15709 - 135141, n=57, az elmúlt 2 évben) | |
| Dell XPS 13 Plus 9320 4K | |
| Dell XPS 13 9315, i5-1230U | |
| Dell XPS 13 Plus 9320 i5-1240p | |
| Huawei MateBook 13s i5 11300H | |
| Átlagos Intel Core i5-1230U (33224 - 65665, n=3) | |
| Lenovo ThinkPad X1 Nano-20UN002UGE | |
| Asus Zenbook S 13 OLED | |
| DPC Latencies / LatencyMon - interrupt to process latency (max), Web, Youtube, Prime95 | |
| Dell XPS 13 9315, i5-1230U | |
| Dell XPS 13 Plus 9320 i5-1240p | |
| Lenovo ThinkPad X1 Nano-20UN002UGE | |
| Huawei MateBook 13s i5 11300H | |
| Dell XPS 13 Plus 9320 4K | |
| Asus Zenbook S 13 OLED | |
* ... a kisebb jobb

| Drive Performance rating - Percent | |
| Asus Zenbook S 13 OLED | |
| Huawei MateBook 13s i5 11300H | |
| Dell XPS 13 Plus 9320 4K | |
| Az osztály átlaga Subnotebook | |
| Lenovo ThinkPad X1 Nano-20UN002UGE | |
| Dell XPS 13 Plus 9320 i5-1240p | |
| Dell XPS 13 9315, i5-1230U | |
| Átlagos Micron 3460 256 GB Soldered | |
* ... a kisebb jobb
Disk Throttling: DiskSpd Read Loop, Queue Depth 8
| 3DMark Performance rating - Percent | |
| Az osztály átlaga Subnotebook | |
| Asus Zenbook S 13 OLED -1! | |
| Dell XPS 13 Plus 9320 4K | |
| Dell XPS 13 9310 Core i7 FHD | |
| Lenovo ThinkPad X1 Nano-20UN002UGE -1! | |
| Huawei MateBook 13s i5 11300H | |
| Átlagos Intel Iris Xe Graphics G7 80EUs | |
| Dell XPS 13 Plus 9320 i5-1240p | |
| Dell XPS 13 9315, i5-1230U | |
| 3DMark 11 - 1280x720 Performance GPU | |
| Az osztály átlaga Subnotebook (995 - 18489, n=54, az elmúlt 2 évben) | |
| Asus Zenbook S 13 OLED | |
| Dell XPS 13 Plus 9320 4K | |
| Dell XPS 13 9310 Core i7 FHD | |
| Huawei MateBook 13s i5 11300H | |
| Lenovo ThinkPad X1 Nano-20UN002UGE | |
| Átlagos Intel Iris Xe Graphics G7 80EUs (2246 - 6579, n=112) | |
| Dell XPS 13 Plus 9320 i5-1240p | |
| Dell XPS 13 9315, i5-1230U | |
| 3DMark 06 Standard Score | 15617 pontok | |
| 3DMark 11 Performance | 4260 pontok | |
| 3DMark Cloud Gate Standard Score | 14350 pontok | |
| 3DMark Fire Strike Score | 3048 pontok | |
| 3DMark Time Spy Score | 1053 pontok | |
Segítség | ||
| The Witcher 3 | |
| 1366x768 Medium Graphics & Postprocessing | |
| Az osztály átlaga Subnotebook (71 - 115, n=8, az elmúlt 2 évben) | |
| Dell XPS 13 Plus 9320 4K | |
| Huawei MateBook 13s i5 11300H | |
| Dell XPS 13 Plus 9320 i5-1240p | |
| Dell XPS 13 9315, i5-1230U | |
| Lenovo ThinkPad X1 Nano-20UN002UGE | |
| Átlagos Intel Iris Xe Graphics G7 80EUs (21.8 - 56.9, n=103) | |
| 1920x1080 High Graphics & Postprocessing (Nvidia HairWorks Off) | |
| Az osztály átlaga Subnotebook (25.6 - 64, n=13, az elmúlt 2 évben) | |
| Asus Zenbook S 13 OLED | |
| Dell XPS 13 Plus 9320 4K | |
| Dell XPS 13 Plus 9320 i5-1240p | |
| Huawei MateBook 13s i5 11300H | |
| Lenovo ThinkPad X1 Nano-20UN002UGE | |
| Dell XPS 13 9315, i5-1230U | |
| Átlagos Intel Iris Xe Graphics G7 80EUs (9.3 - 33.5, n=101) | |
| Strange Brigade | |
| 1280x720 lowest AF:1 | |
| Az osztály átlaga Subnotebook (85 - 335, n=49, az elmúlt 2 évben) | |
| Asus Zenbook S 13 OLED | |
| Dell XPS 13 Plus 9320 4K | |
| Huawei MateBook 13s i5 11300H | |
| Átlagos Intel Iris Xe Graphics G7 80EUs (22.7 - 98.7, n=84) | |
| Dell XPS 13 Plus 9320 i5-1240p | |
| Dell XPS 13 9315, i5-1230U | |
| 1920x1080 medium AA:medium AF:4 | |
| Az osztály átlaga Subnotebook (29.8 - 137.5, n=49, az elmúlt 2 évben) | |
| Asus Zenbook S 13 OLED | |
| Dell XPS 13 Plus 9320 4K | |
| Huawei MateBook 13s i5 11300H | |
| Dell XPS 13 Plus 9320 i5-1240p | |
| Átlagos Intel Iris Xe Graphics G7 80EUs (6 - 48.8, n=86) | |
| Dell XPS 13 9315, i5-1230U | |
| Ghostwire Tokyo - 1920x1080 Low Settings | |
| Dell XPS 13 9315, i5-1230U | |
| Átlagos Intel Iris Xe Graphics G7 80EUs (13.5 - 25.8, n=2) | |
| Far Cry 5 | |
| 1280x720 Low Preset AA:T | |
| Az osztály átlaga Subnotebook (36 - 104, n=24, az elmúlt 2 évben) | |
| Dell XPS 13 Plus 9320 i5-1240p | |
| Dell XPS 13 Plus 9320 4K | |
| Asus Zenbook S 13 OLED | |
| Huawei MateBook 13s i5 11300H | |
| Lenovo ThinkPad X1 Nano-20UN002UGE | |
| Átlagos Intel Iris Xe Graphics G7 80EUs (14 - 63, n=50) | |
| Dell XPS 13 9315, i5-1230U | |
| 1920x1080 Medium Preset AA:T | |
| Az osztály átlaga Subnotebook (21 - 59, n=24, az elmúlt 2 évben) | |
| Asus Zenbook S 13 OLED | |
| Dell XPS 13 Plus 9320 4K | |
| Dell XPS 13 Plus 9320 i5-1240p | |
| Huawei MateBook 13s i5 11300H | |
| Lenovo ThinkPad X1 Nano-20UN002UGE | |
| Átlagos Intel Iris Xe Graphics G7 80EUs (9 - 31, n=47) | |
| Dell XPS 13 9315, i5-1230U | |
| GTA V - 1366x768 Normal/Off AF:4x | |
| Az osztály átlaga Subnotebook (81.2 - 176.9, n=53, az elmúlt 2 évben) | |
| Asus Zenbook S 13 OLED | |
| Dell XPS 13 Plus 9320 4K | |
| Dell XPS 13 Plus 9320 i5-1240p | |
| Huawei MateBook 13s i5 11300H | |
| Átlagos Intel Iris Xe Graphics G7 80EUs (28.9 - 133.8, n=87) | |
| Dell XPS 13 9315, i5-1230U | |
| Final Fantasy XV Benchmark - 1280x720 Lite Quality | |
| Az osztály átlaga Subnotebook (21.4 - 129.8, n=54, az elmúlt 2 évben) | |
| Asus Zenbook S 13 OLED | |
| Dell XPS 13 Plus 9320 4K | |
| Huawei MateBook 13s i5 11300H | |
| Dell XPS 13 Plus 9320 i5-1240p | |
| Átlagos Intel Iris Xe Graphics G7 80EUs (8.32 - 45.6, n=107) | |
| Dell XPS 13 9315, i5-1230U | |
Witcher 3 FPS Graph
| alacsony | közepes | magas | ultra | |
|---|---|---|---|---|
| GTA V (2015) | 31 | 10 | ||
| The Witcher 3 (2015) | 67 | 47 | 22 | 8 |
| Final Fantasy XV Benchmark (2018) | 18.9 | 10.8 | 5.24 | |
| Far Cry 5 (2018) | 22 | 14 | ||
| Strange Brigade (2018) | 47.5 | 6 | 17.8 | |
| Ghostwire Tokyo (2022) | 25 súlyos grafikai problémák (out of video memory) | 19 súlyos grafikai problémák (out of video memory) |
Zajszint
| Üresjárat |
| 26 / 26 / 27.5 dB(A) |
| Terhelés |
| 39.5 / 39.6 dB(A) |
 | ||
30 dB csendes 40 dB(A) hallható 50 dB(A) hangos |
||
min: | ||
| Dell XPS 13 9315, i5-1230U Iris Xe G7 80EUs, i5-1230U, Micron 3460 256 GB Soldered | Dell XPS 13 Plus 9320 4K Iris Xe G7 96EUs, i7-1260P, Samsung PM9A1 MZVL21T0HCLR | Dell XPS 13 Plus 9320 i5-1240p Iris Xe G7 80EUs, i5-1240P, Micron 3400 MTFDKBA512TFH 512GB | Asus Zenbook S 13 OLED Radeon 680M, R7 6800U, Samsung PM9A1 MZVL21T0HCLR | Lenovo ThinkPad X1 Nano-20UN002UGE Iris Xe G7 96EUs, i7-1160G7, WDC PC SN530 SDBPNPZ-512G | Huawei MateBook 13s i5 11300H Iris Xe G7 80EUs, i5-11300H, Phison Electronics PS5012 | |
|---|---|---|---|---|---|---|
| Noise | -1% | -2% | 7% | 3% | 5% | |
| off / környezet * (dB) | 26 | 24.4 6% | 26 -0% | 24 8% | 24.9 4% | 24.5 6% |
| Idle Minimum * (dB) | 26 | 24.4 6% | 26.2 -1% | 24 8% | 24.9 4% | 24.5 6% |
| Idle Average * (dB) | 26 | 24.4 6% | 26.2 -1% | 24 8% | 26.3 -1% | 24.5 6% |
| Idle Maximum * (dB) | 27.5 | 25.5 7% | 26.2 5% | 24 13% | 31.8 -16% | 28 -2% |
| Load Average * (dB) | 39.5 | 40.4 -2% | 38.4 3% | 33.1 16% | 34.3 13% | 35.9 9% |
| Witcher 3 ultra * (dB) | 39.6 | 45.5 -15% | 40.2 -2% | 34.3 13% | 35.9 9% | |
| Load Maximum * (dB) | 39.6 | 45.5 -15% | 47.1 -19% | 41.7 -5% | 37.5 5% | 38.6 3% |
* ... a kisebb jobb
(±) A felső oldalon a maximális hőmérséklet 42.3 °C / 108 F, összehasonlítva a 35.9 °C / 97 F átlagával , 21.4 és 59 °C között a Subnotebook osztálynál.
(±) Az alsó maximum 44.9 °C / 113 F-ig melegszik fel, összehasonlítva a 39.2 °C / 103 F átlagával
(+) Üresjáratban a felső oldal átlagos hőmérséklete 30.8 °C / 87 F, összehasonlítva a 30.8 °C / ### eszközátlaggal class_avg_f### F.
(±) A The Witcher 3 játék során a felső oldal átlaghőmérséklete 36.5 °C / 98 F, összehasonlítva a 30.8 °C / ## eszközátlaggal #class_avg_f### F.
(+) A csuklótámasz és az érintőpad eléri a bőr maximális hőmérsékletét (34.4 °C / 93.9 F), ezért nem forrók.
(-) A hasonló eszközök csuklótámasz területének átlagos hőmérséklete 28.2 °C / 82.8 F volt (-6.2 °C / -11.1 F).
| Dell XPS 13 9315, i5-1230U Intel Core i5-1230U, Intel Iris Xe Graphics G7 80EUs | Dell XPS 13 Plus 9320 4K Intel Core i7-1260P, Intel Iris Xe Graphics G7 96EUs | Dell XPS 13 Plus 9320 i5-1240p Intel Core i5-1240P, Intel Iris Xe Graphics G7 80EUs | Apple MacBook Air 2020 M1 Entry Apple M1, Apple M1 7-Core GPU | Asus Zenbook S 13 OLED AMD Ryzen 7 6800U, AMD Radeon 680M | Lenovo ThinkPad X1 Nano-20UN002UGE Intel Core i7-1160G7, Intel Iris Xe Graphics G7 96EUs | Huawei MateBook 13s i5 11300H Intel Core i5-11300H, Intel Iris Xe Graphics G7 80EUs | |
|---|---|---|---|---|---|---|---|
| Heat | 8% | -17% | 11% | 2% | 13% | 12% | |
| Maximum Upper Side * (°C) | 42.3 | 41.1 3% | 47.6 -13% | 44 -4% | 47.9 -13% | 42.2 -0% | 42.8 -1% |
| Maximum Bottom * (°C) | 44.9 | 48.8 -9% | 57 -27% | 44 2% | 56.1 -25% | 47.5 -6% | 46.9 -4% |
| Idle Upper Side * (°C) | 32.5 | 28 14% | 38.8 -19% | 27 17% | 26.8 18% | 24.3 25% | 25.2 22% |
| Idle Bottom * (°C) | 38.2 | 29.3 23% | 41 -7% | 27 29% | 27.3 29% | 25.3 34% | 26 32% |
* ... a kisebb jobb
Dell XPS 13 9315, i5-1230U hangelemzés
(±) | a hangszóró hangereje átlagos, de jó (81.81 dB)
Basszus 100 - 315 Hz
(±) | csökkentett basszus – átlagosan 11.6%-kal alacsonyabb, mint a medián
(±) | a basszus linearitása átlagos (10.7% delta az előző frekvenciához)
Közepes 400-2000 Hz
(+) | kiegyensúlyozott középpontok – csak 1.6% választja el a mediántól
(+) | a középpontok lineárisak (5.8% delta az előző frekvenciához)
Maximum 2-16 kHz
(+) | kiegyensúlyozott csúcsok – csak 4.2% választja el a mediántól
(±) | a csúcsok linearitása átlagos (7.1% delta az előző gyakorisághoz)
Összességében 100 - 16.000 Hz
(+) | általános hangzás lineáris (11.3% eltérés a mediánhoz képest)
Ugyanazon osztályhoz képest
» 11%Ebben az osztályban az összes tesztelt eszköz %-a jobb volt, 2% hasonló, 86%-kal rosszabb
» A legjobb delta értéke 5%, az átlag 18%, a legrosszabb 53% volt
Az összes tesztelt eszközzel összehasonlítva
» 7% az összes tesztelt eszköz jobb volt, 2% hasonló, 91%-kal rosszabb
» A legjobb delta értéke 4%, az átlag 23%, a legrosszabb 134% volt
Asus Zenbook S 13 OLED hangelemzés
(±) | a hangszóró hangereje átlagos, de jó (76.5 dB)
Basszus 100 - 315 Hz
(±) | csökkentett basszus – átlagosan 12.6%-kal alacsonyabb, mint a medián
(±) | a basszus linearitása átlagos (11.1% delta az előző frekvenciához)
Közepes 400-2000 Hz
(±) | magasabb középértékek – átlagosan 5.8%-kal magasabb, mint a medián
(+) | a középpontok lineárisak (4.7% delta az előző frekvenciához)
Maximum 2-16 kHz
(+) | kiegyensúlyozott csúcsok – csak 2.6% választja el a mediántól
(+) | a csúcsok lineárisak (5.3% delta az előző frekvenciához képest)
Összességében 100 - 16.000 Hz
(+) | általános hangzás lineáris (14.7% eltérés a mediánhoz képest)
Ugyanazon osztályhoz képest
» 31%Ebben az osztályban az összes tesztelt eszköz %-a jobb volt, 5% hasonló, 64%-kal rosszabb
» A legjobb delta értéke 5%, az átlag 18%, a legrosszabb 53% volt
Az összes tesztelt eszközzel összehasonlítva
» 19% az összes tesztelt eszköz jobb volt, 4% hasonló, 77%-kal rosszabb
» A legjobb delta értéke 4%, az átlag 23%, a legrosszabb 134% volt
Dell XPS 13 9310 Core i7 FHD hangelemzés
(+) | a hangszórók viszonylag hangosan tudnak játszani (84.6 dB)
Basszus 100 - 315 Hz
(-) | szinte nincs basszus – átlagosan 16.1%-kal alacsonyabb a mediánnál
(±) | a basszus linearitása átlagos (13.1% delta az előző frekvenciához)
Közepes 400-2000 Hz
(+) | kiegyensúlyozott középpontok – csak 2.6% választja el a mediántól
(+) | a középpontok lineárisak (4.6% delta az előző frekvenciához)
Maximum 2-16 kHz
(+) | kiegyensúlyozott csúcsok – csak 1.3% választja el a mediántól
(+) | a csúcsok lineárisak (4% delta az előző frekvenciához képest)
Összességében 100 - 16.000 Hz
(+) | általános hangzás lineáris (10.7% eltérés a mediánhoz képest)
Ugyanazon osztályhoz képest
» 9%Ebben az osztályban az összes tesztelt eszköz %-a jobb volt, 3% hasonló, 88%-kal rosszabb
» A legjobb delta értéke 5%, az átlag 18%, a legrosszabb 53% volt
Az összes tesztelt eszközzel összehasonlítva
» 6% az összes tesztelt eszköz jobb volt, 2% hasonló, 93%-kal rosszabb
» A legjobb delta értéke 4%, az átlag 23%, a legrosszabb 134% volt
| Kikapcsolt állapot / Készenlét | |
| Üresjárat | |
| Terhelés |
|
Kulcs:
min: | |
| Dell XPS 13 9315, i5-1230U i5-1230U, Iris Xe G7 80EUs, Micron 3460 256 GB Soldered, IPS, 1920x1200, 13.4" | Apple MacBook Air 2020 M1 Entry M1, M1 7-Core GPU, Apple SSD AP0256Q, IPS, 2560x1600, 13.3" | Asus Zenbook S 13 OLED R7 6800U, Radeon 680M, Samsung PM9A1 MZVL21T0HCLR, OLED, 2880x1800, 13.3" | Lenovo ThinkPad X1 Nano-20UN002UGE i7-1160G7, Iris Xe G7 96EUs, WDC PC SN530 SDBPNPZ-512G, IPS, 2160x1350, 13" | Huawei MateBook 13s i5 11300H i5-11300H, Iris Xe G7 80EUs, Phison Electronics PS5012, LTPS, 2520x1680, 13.4" | Dell XPS 13 Plus 9320 4K i7-1260P, Iris Xe G7 96EUs, Samsung PM9A1 MZVL21T0HCLR, IPS, 3840x2400, 13.4" | Dell XPS 13 Plus 9320 i5-1240p i5-1240P, Iris Xe G7 80EUs, Micron 3400 MTFDKBA512TFH 512GB, IPS, 1920x1200, 13.4" | Átlagos Intel Iris Xe Graphics G7 80EUs | Az osztály átlaga Subnotebook | |
|---|---|---|---|---|---|---|---|---|---|
| Power Consumption | 16% | -48% | -11% | -43% | -86% | -97% | -31% | -26% | |
| Idle Minimum * (Watt) | 3.6 | 1.9 47% | 4.8 -33% | 3.3 8% | 4.2 -17% | 7 -94% | 10 -178% | 4.49 ? -25% | 3.78 ? -5% |
| Idle Average * (Watt) | 6.8 | 6.4 6% | 8.7 -28% | 5.7 16% | 8.1 -19% | 11 -62% | 12.3 -81% | 7.4 ? -9% | 6.57 ? 3% |
| Idle Maximum * (Watt) | 6.8 | 7 -3% | 10.1 -49% | 9.1 -34% | 9 -32% | 11.4 -68% | 15.5 -128% | 9.26 ? -36% | 7.94 ? -17% |
| Load Average * (Watt) | 24 | 25 -4% | 45.6 -90% | 29.6 -23% | 41.7 -74% | 59.7 -149% | 43 -79% | 36.6 ? -53% | 41.9 ? -75% |
| Witcher 3 ultra * (Watt) | 23.6 | 42.4 -80% | 27.7 -17% | 40.1 -70% | 49.4 -109% | 43.1 -83% | |||
| Load Maximum * (Watt) | 47 | 30.3 36% | 49.5 -5% | 55.1 -17% | 68 -45% | 63 -34% | 62.8 -34% | 61.7 ? -31% | 64.4 ? -37% |
* ... a kisebb jobb
Consumption Witcher 3/Stress Test
Consumption external Monitor
| Dell XPS 13 9315, i5-1230U i5-1230U, Iris Xe G7 80EUs, 51 Wh | Apple MacBook Air 2020 M1 Entry M1, M1 7-Core GPU, 49.9 Wh | Asus Zenbook S 13 OLED R7 6800U, Radeon 680M, 67 Wh | Lenovo ThinkPad X1 Nano-20UN002UGE i7-1160G7, Iris Xe G7 96EUs, 48.2 Wh | Huawei MateBook 13s i5 11300H i5-11300H, Iris Xe G7 80EUs, 60 Wh | Dell XPS 13 Plus 9320 4K i7-1260P, Iris Xe G7 96EUs, 55 Wh | Dell XPS 13 Plus 9320 i5-1240p i5-1240P, Iris Xe G7 80EUs, 55 Wh | Az osztály átlaga Subnotebook | |
|---|---|---|---|---|---|---|---|---|
| Akkumulátor üzemidő | 8% | -23% | -36% | -37% | -52% | -42% | -15% | |
| WiFi v1.3 (h) | 14.8 | 16 8% | 9.2 -38% | 9.9 -33% | 9.4 -36% | 6.9 -53% | 8 -46% | 14 ? -5% |
| Load (h) | 2.6 | 2.4 -8% | 1.6 -38% | 1.6 -38% | 1.3 -50% | 1.6 -38% | 1.969 ? -24% | |
| H.264 (h) | 15.2 | 15.4 | 11 | 11 | 15.4 ? |
Pro
Kontra
Összegzés - Feleannyi Teljesítmény, Kétszer Annyi Üzemidő
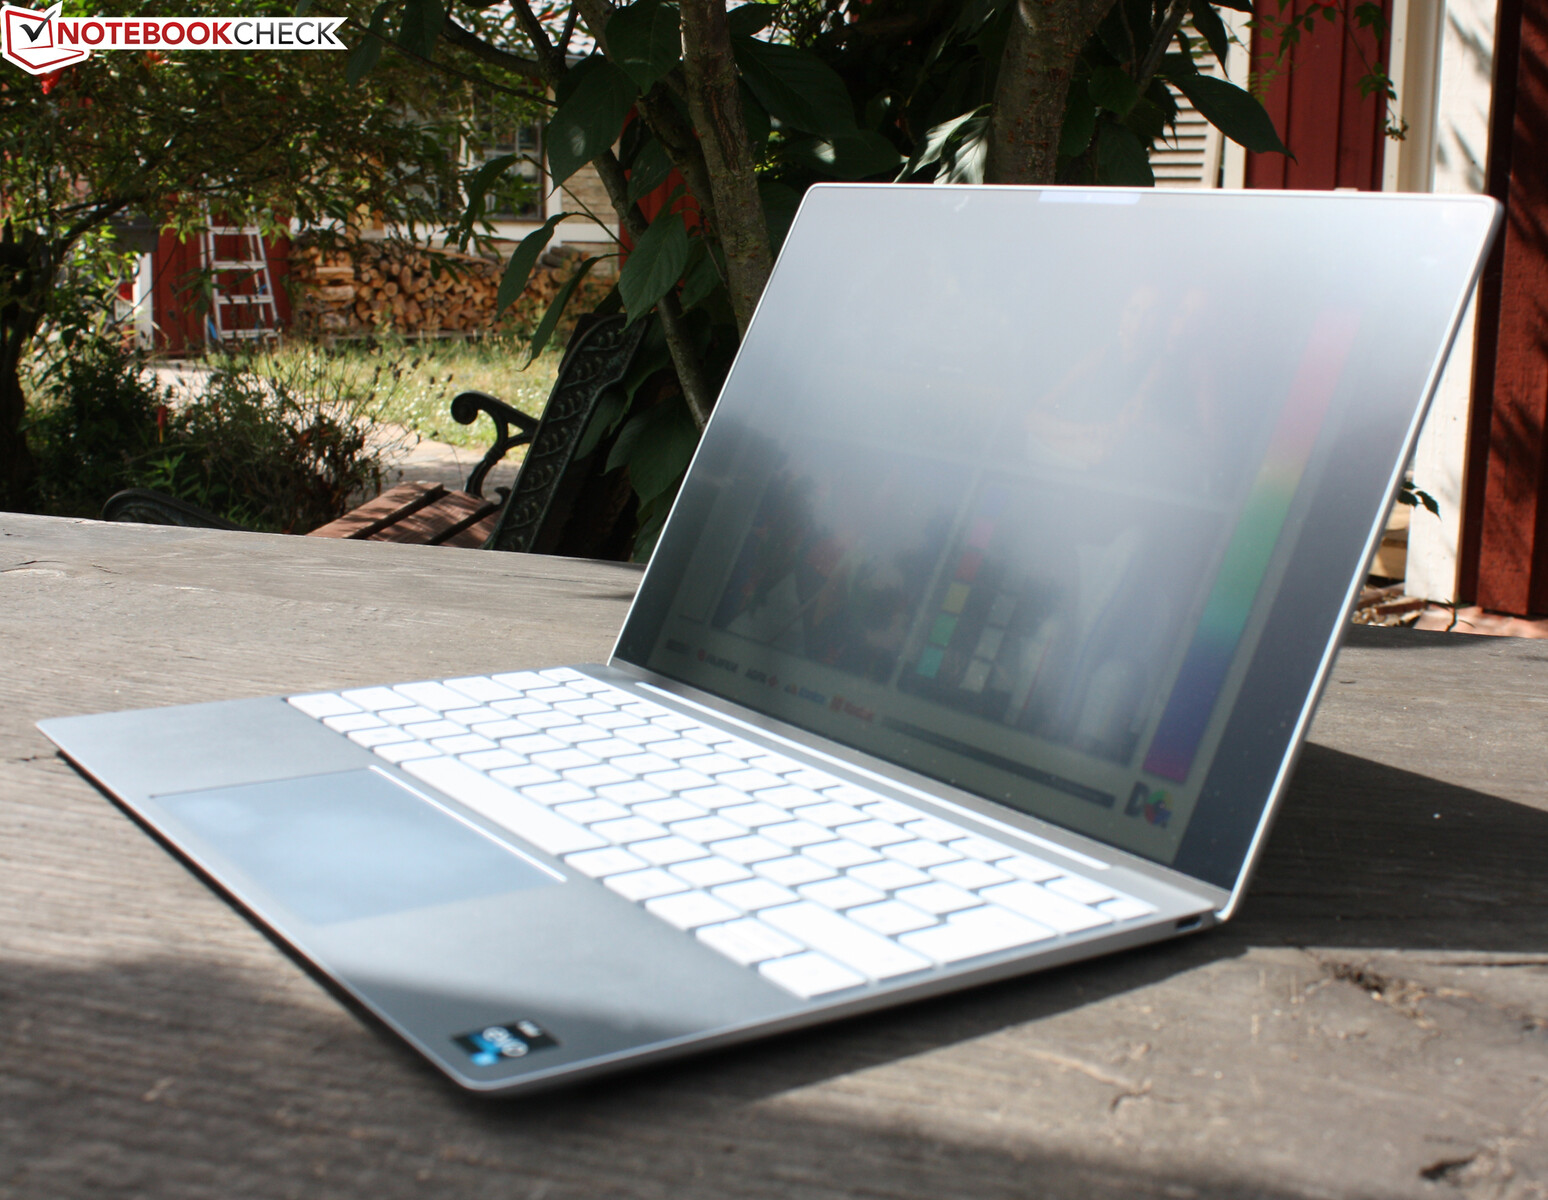
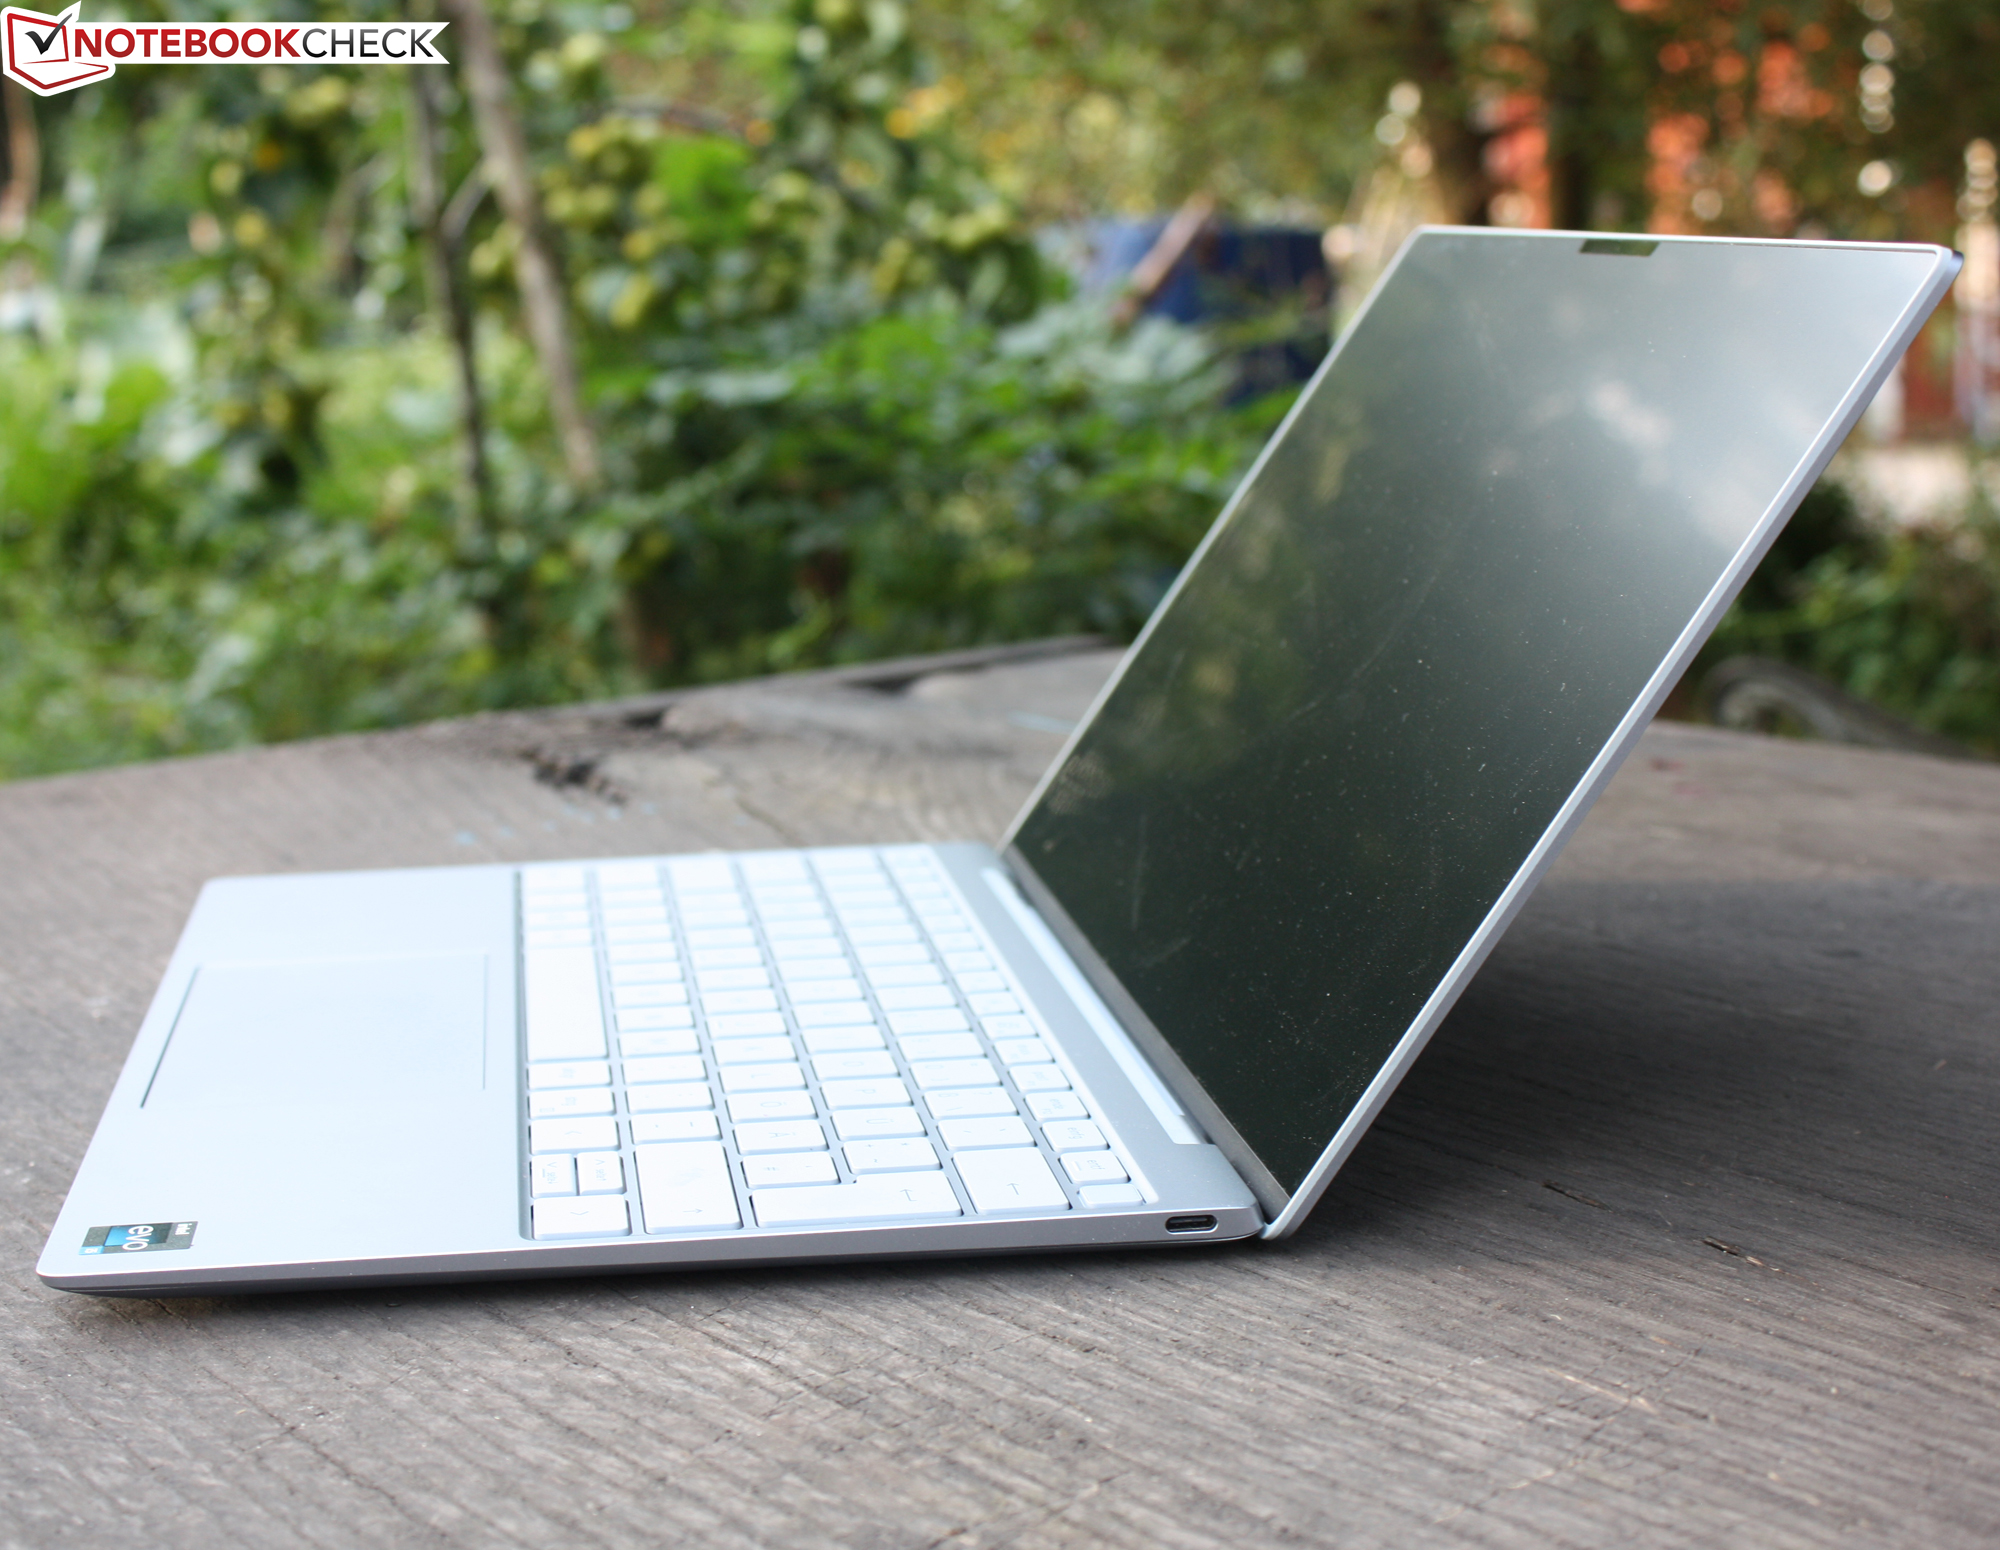
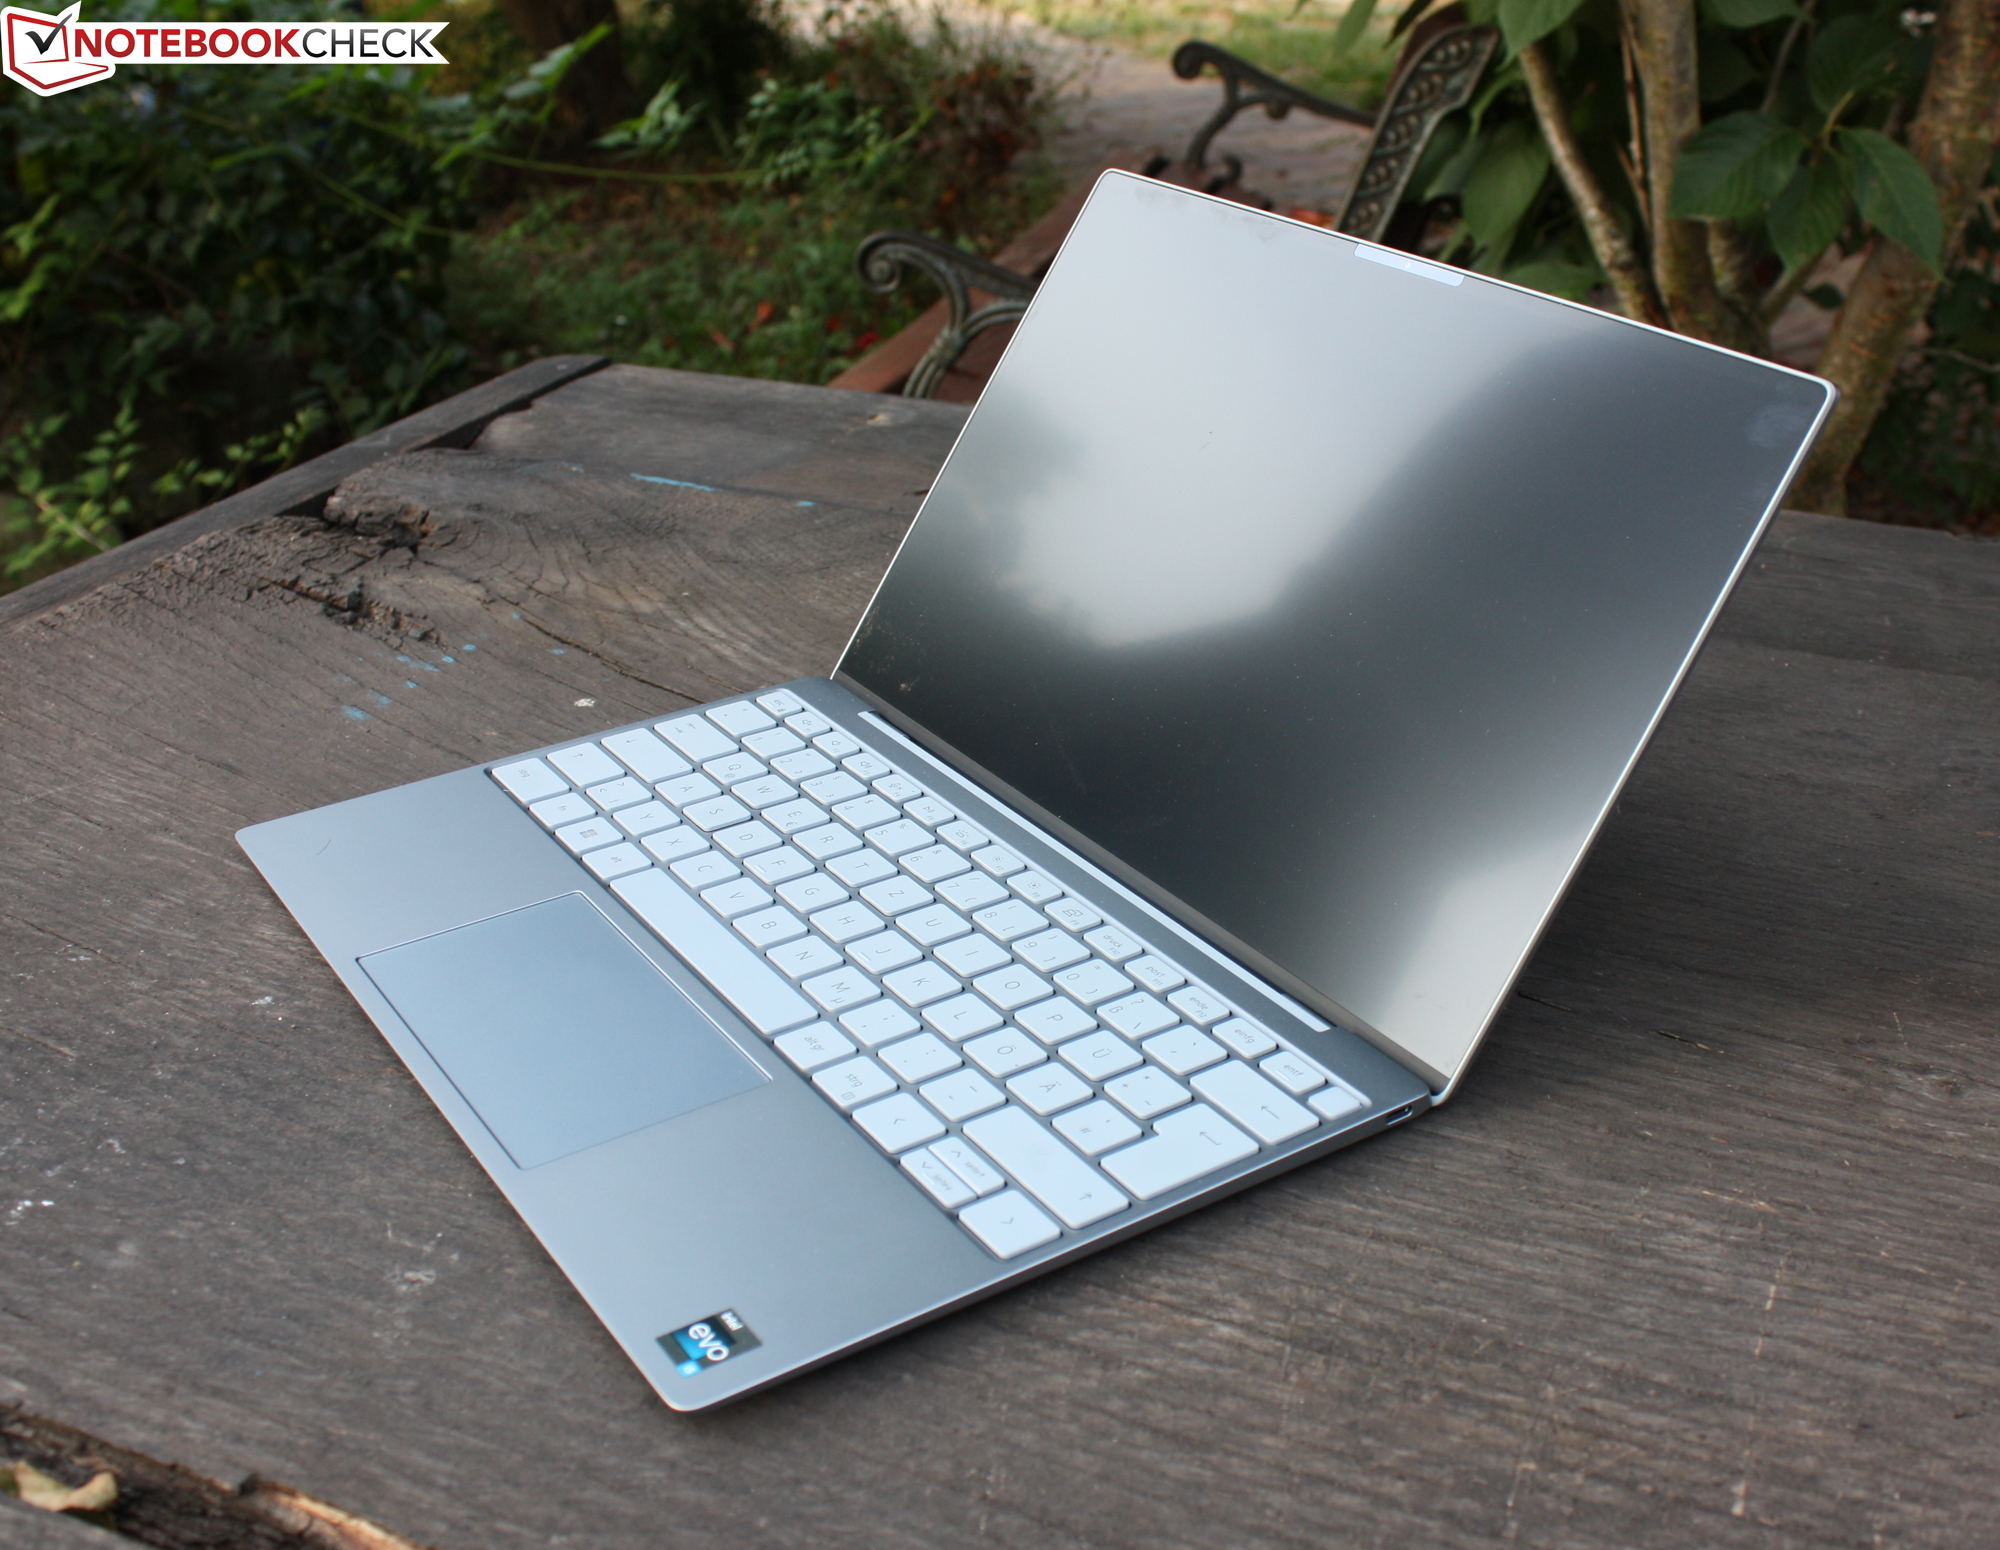
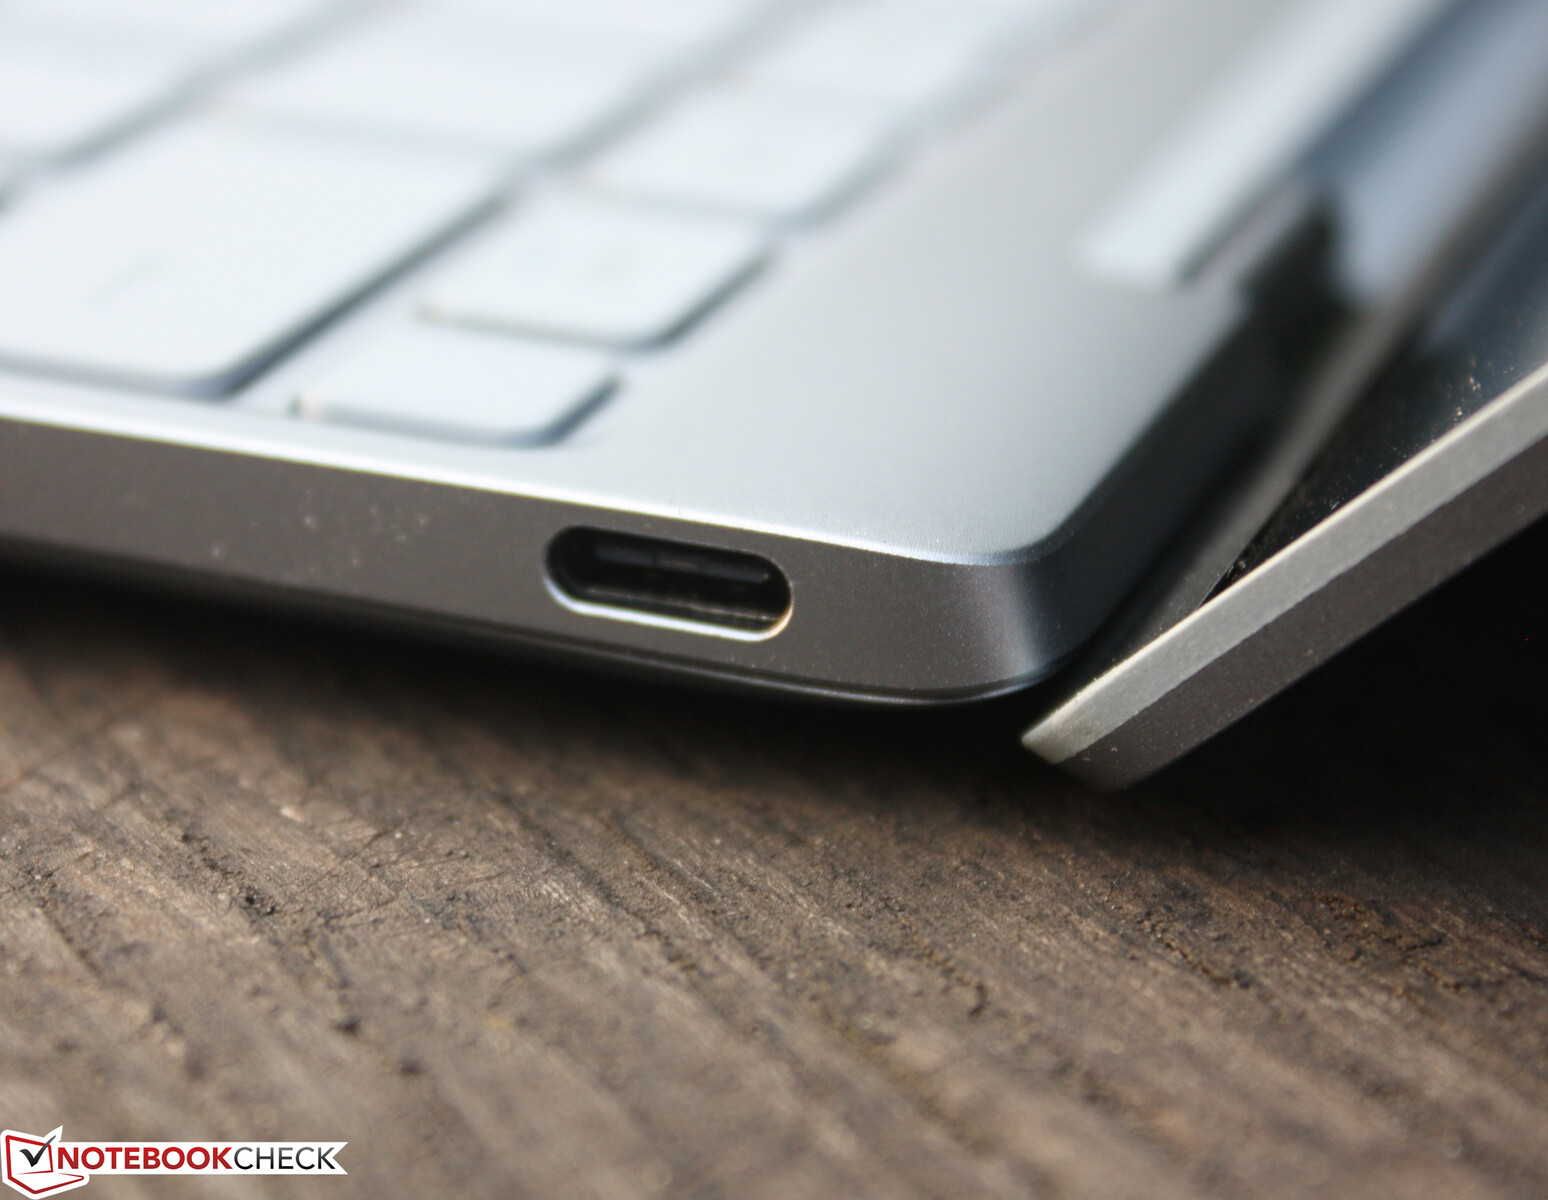
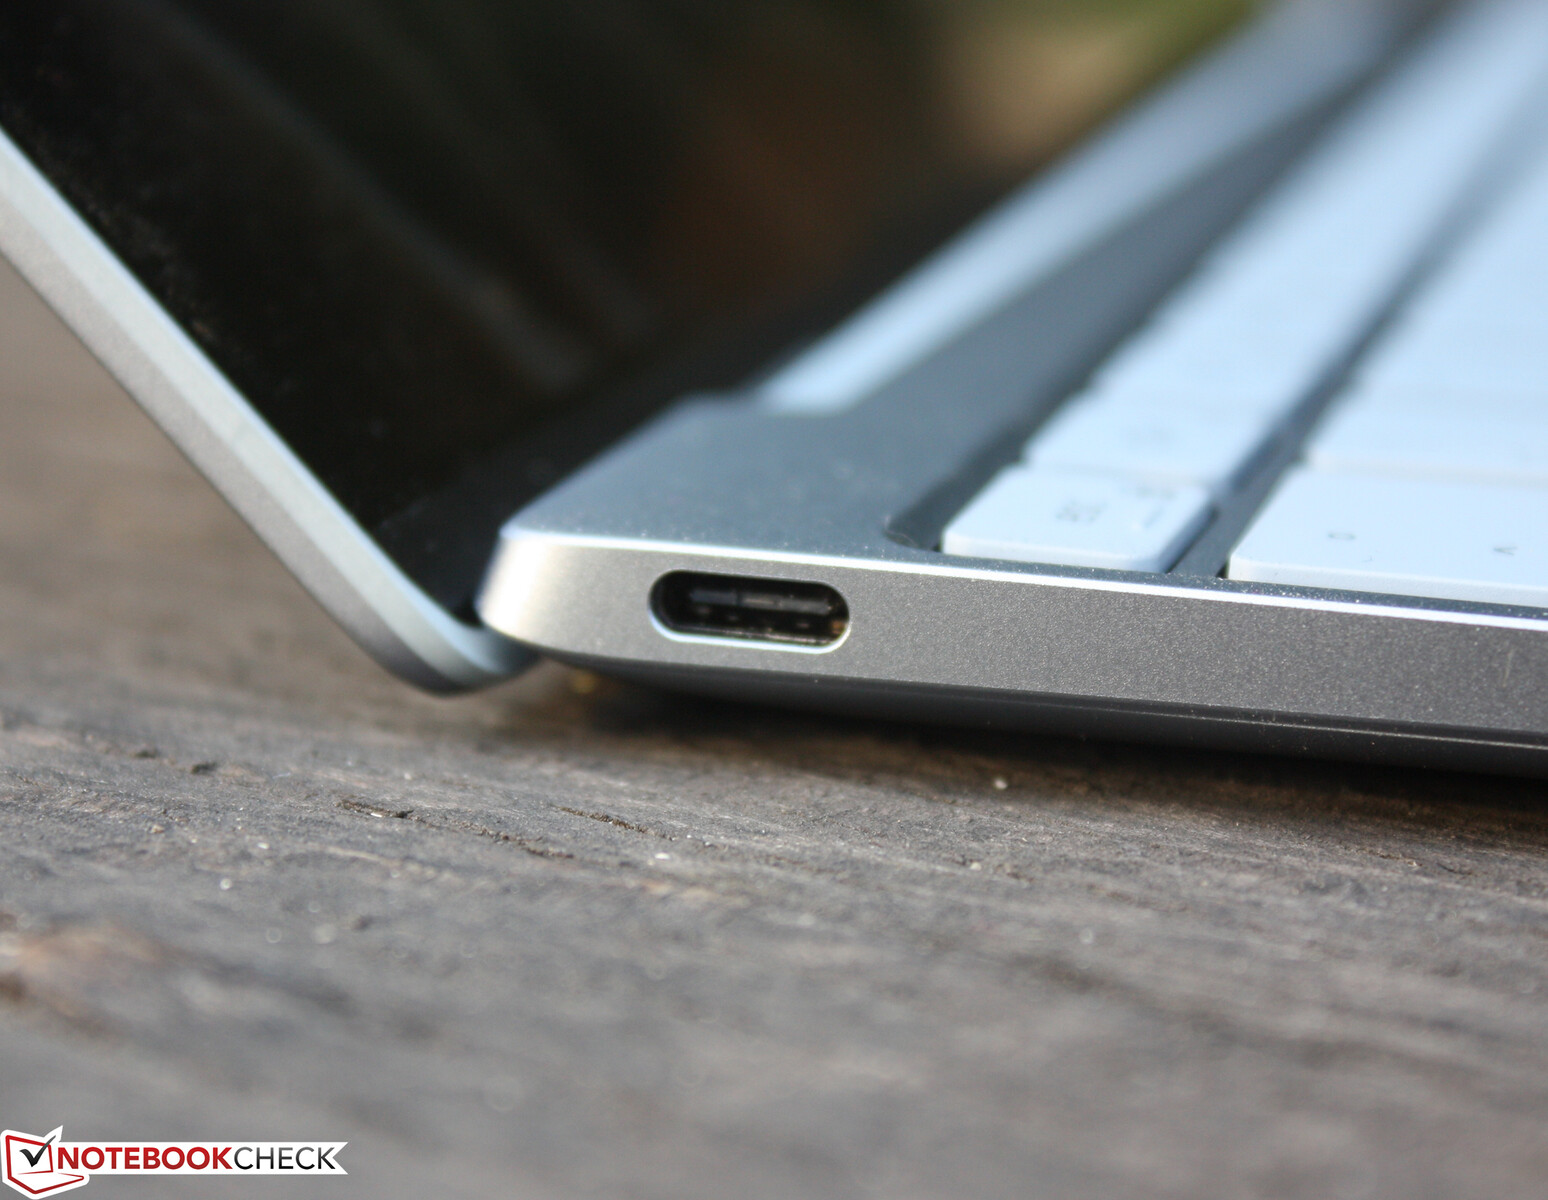
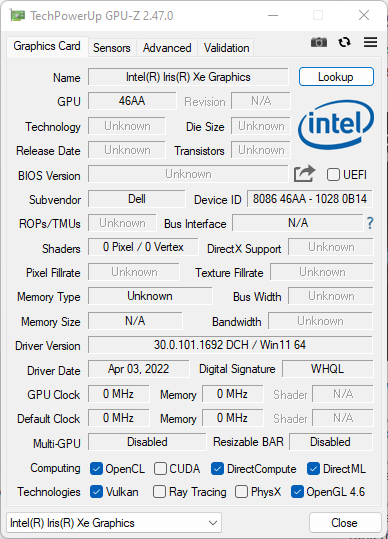
Korlátozott teljesítmény, mint kompromisszum a kiváló hordozhatóságért - az Alder Lake-U processzorral és IPS FHD panellel ellátott 2022-es XPS 13 alsókategóriás modellje meggyőző eszköz könnyű irodai munkákhoz. Hihetetlen, közel 15 órás üzemidejével megduplázza testvérmodellje, az XPS 13 Plus eredményét. A Dell a mindennapi használatra alkalmas, világos kijelzőre épít, van két Thunderbolt 4 port és mély- és magassugárzóval ellátott hangszórók. Ennek köszönhetően a filmnézés a beépített hangszórókat használva élvezetes élmény.
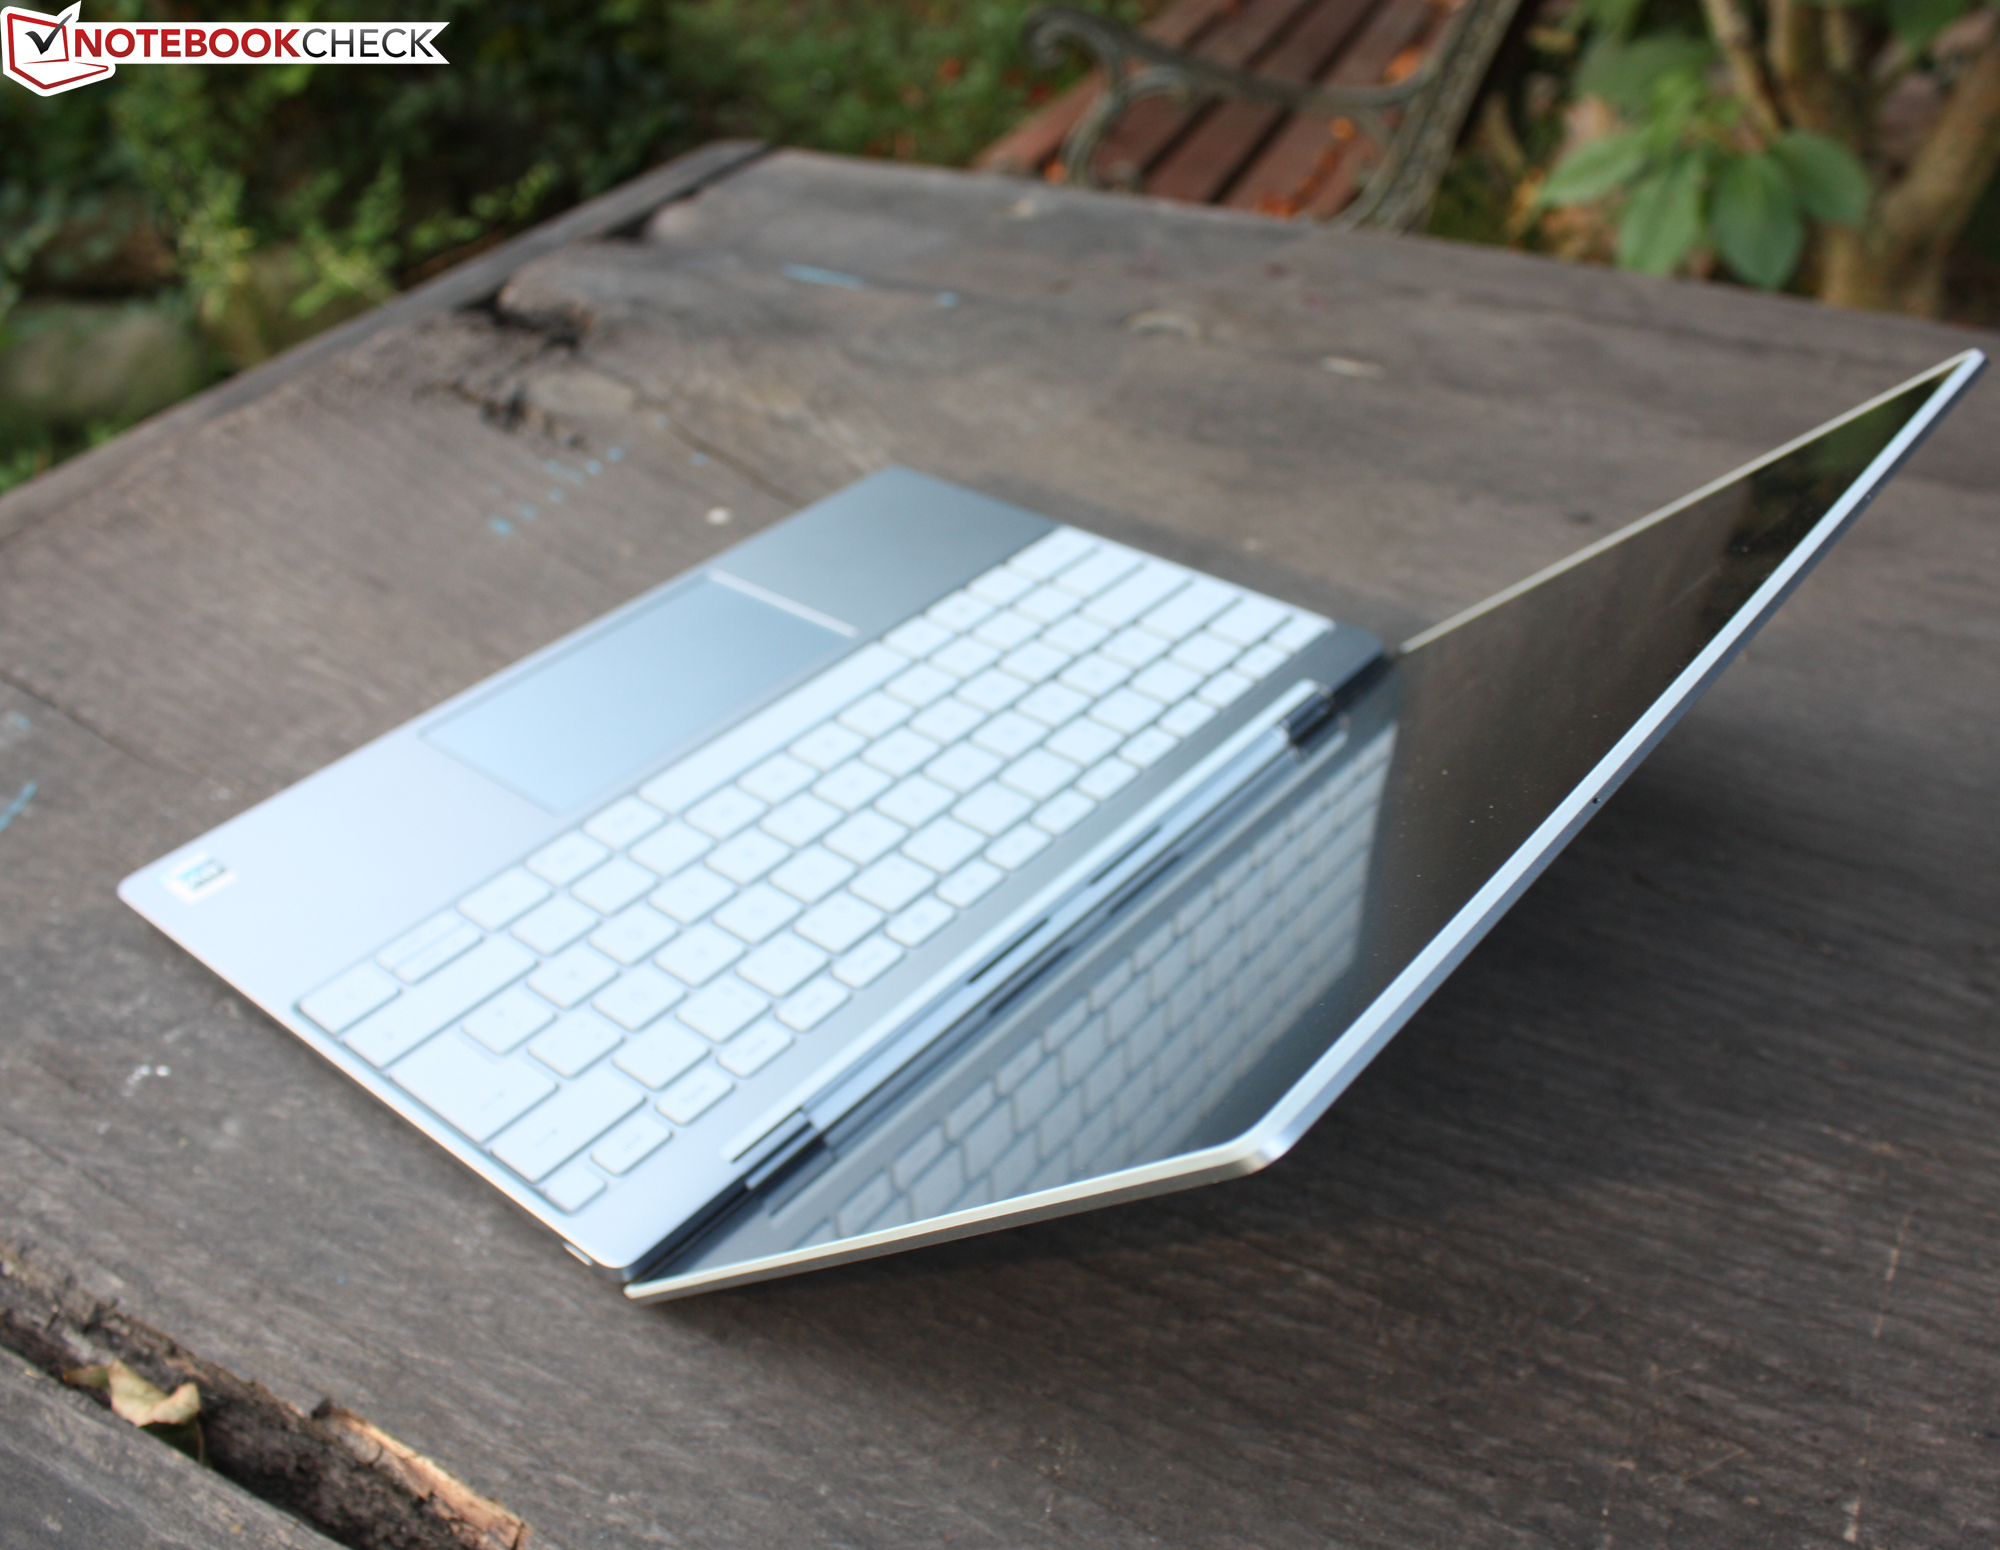
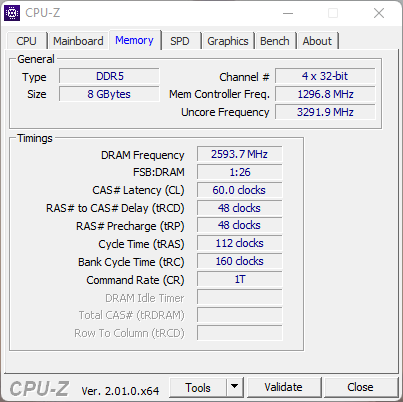
Talán emiatt hiányzik a fejhallgató jack és a kártyaolvasó? Vagy a minimalista koncepció miatt? Mindenesetre lehetséges egy olyan működőképes laptop rendszert összeállítani, amely mindössze két C-típusú porttal - amelyek közül az egyiket a hálózati adapter foglalja el - rendelkezik, feltéve, ha erre fel vagyunk készülve. Belül azonban van egy láthatatlan akadály, hiszen az XPS 13-at semmilyen módon nem lehet frissíteni. A RAM, a Wi-Fi modul és az SSD mind rögzítve van. Ezt figyelembe kell venni, ha a 256 GB-os tárolóval rendelkező, alsókategóriás modellt választjuk.
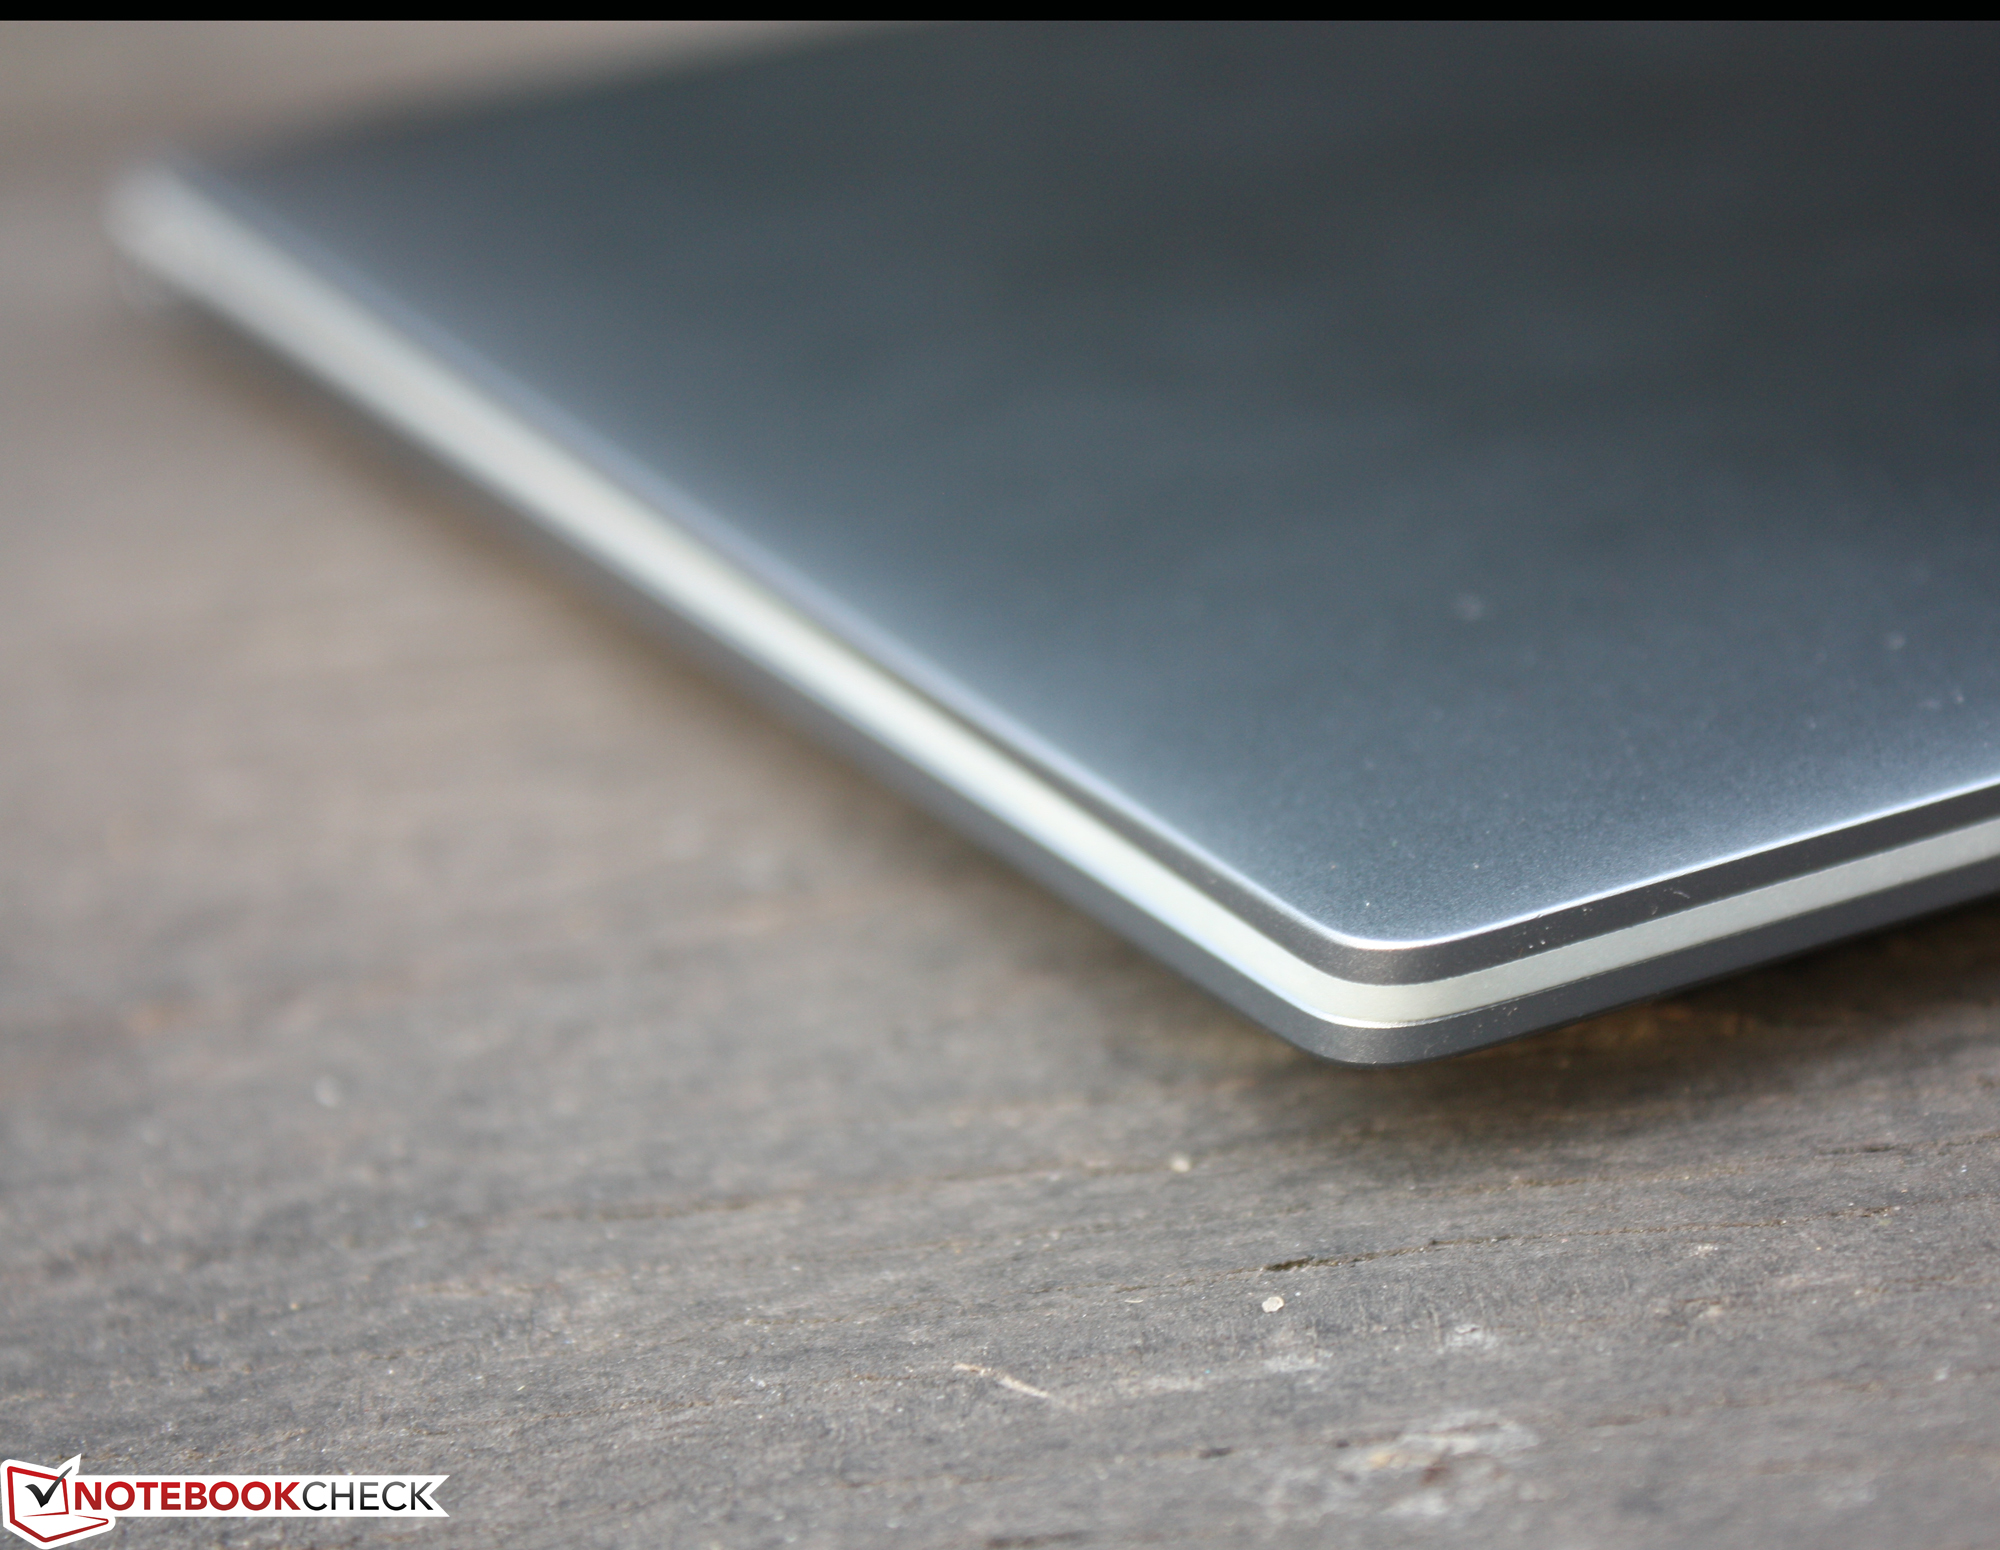
Hosszú üzemidő, masszív váz, mindennapi használatra alkalmas bemeneti eszközök és mélynyomóval erősített hangzás - még a belépőszintű XPS 13 is képes örömet okozni.
A teljesítmény tekintetében vannak kompromisszumok, és az Alder Lake-U chip nem áll túl jól más, azonos CPU-val rendelkező subnotebook modellekhez képest. Az XPS 13 Plus modellben található Alder Lake-P CPU-khoz képest igen jelentős a teljesítménybeli lemaradás. Legalább a Dell világos vonalat húz: Ha teljesítményre vágyunk, akkor a Plus az egyetlen lehetőség. Webböngészéshez, szórakozáshoz és e-mailezéshez elegendő az XPS alapváltozata.
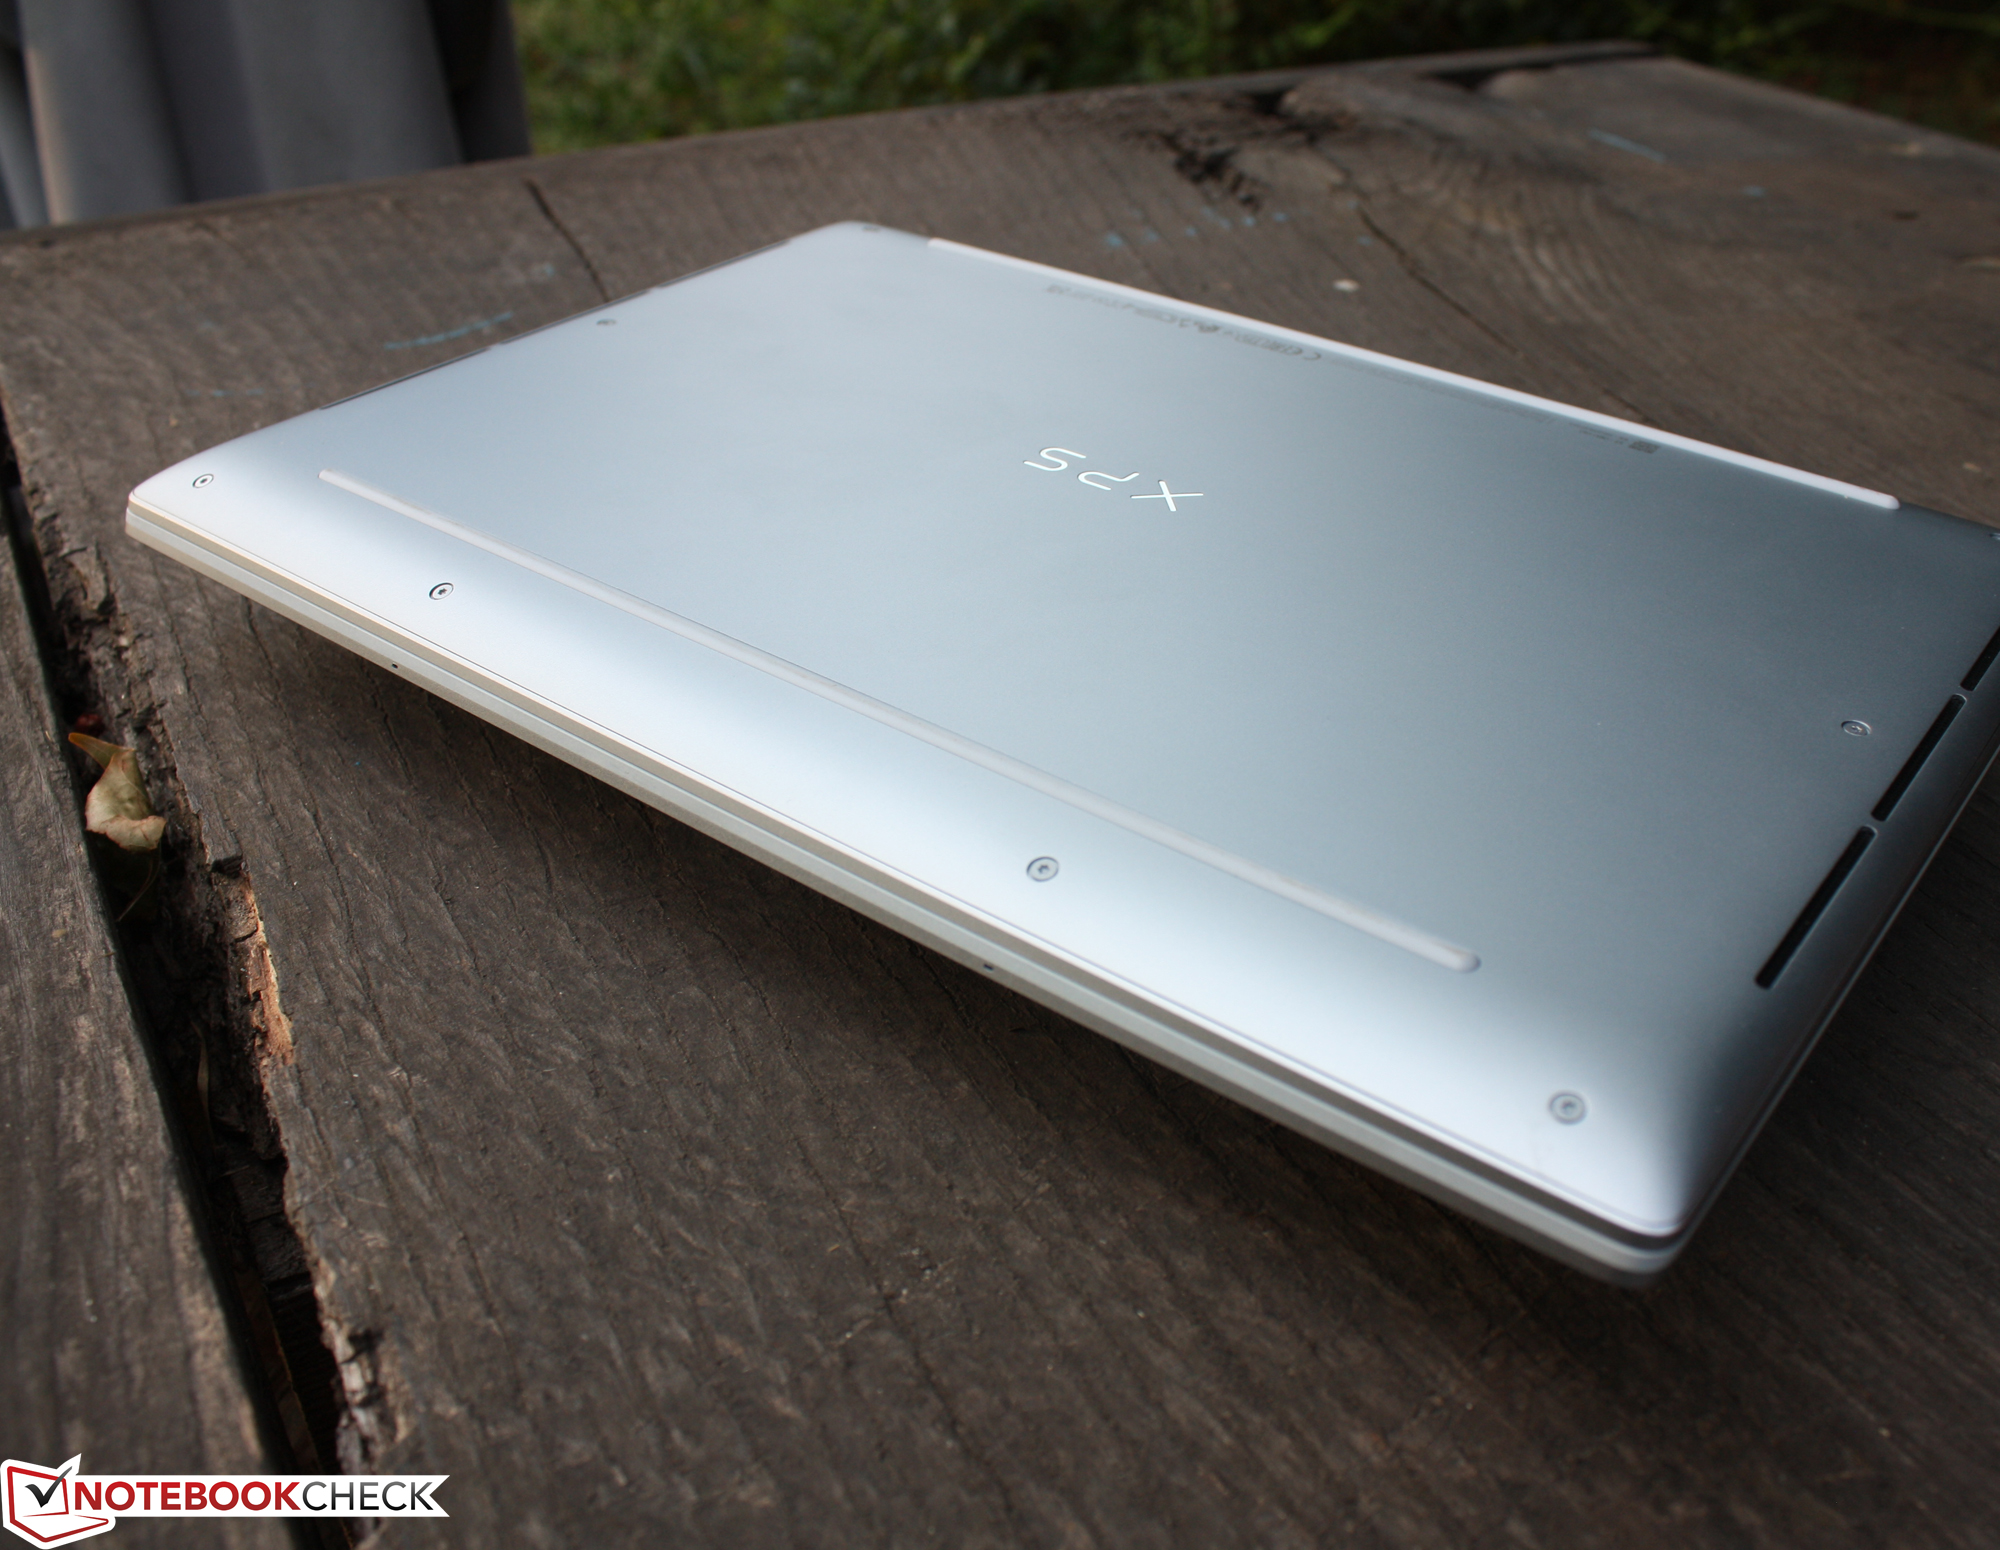
Az új XPS sorozat: Két teljesítménykategóriára osztva. Az alap XPS a hordozhatóságra összpontosít, ahelyett, hogy az utolsó csepp teljesítményt is megpróbálná kipréselni a komponensekből.Az új XPS sorozat: Két teljesítménykategóriára osztva. Az alap XPS a hordozhatóságra összpontosít, ahelyett, hogy az utolsó csepp teljesítményt is megpróbálná kipréselni a komponensekből.
Az alsó kategóriás XPS 13 lemarad az AMD Ryzen 6000 processzorral szerelt Zenbook S 13-hoz képest, és még az Apple MacBook Air M1-hez képest is küszködik. Így az összehasonlítás az új MacBook Air M2-vel, amelyet szintén most tesztelünk, nem valószínű, hogy kedvező fényben tünteti fel a Dell-t, még akkor sem, ha az XPS 13 Plus-ra fókuszálunk.
A szerző jelenleg az XPS 13 Plus alapmodelljét értékelii, FHD kijelzővel, 512 GB-mal és Alder Lake-P Core i5 processzorral. Az XPS 13 Plus-t is teszteltük 4K-val és i7-tel: Az XPS 13 már érintősávval rendelkezik.
Ár és Elérhetőség
A 2022 XPS 13 9315 már 999 USD-től elérhető a Dell webáruházában. A Plus modell 1299 USD-től indul.
Dell XPS 13 9315, i5-1230U
- 08/05/2022 v7 (old)
Sebastian Jentsch
Price comparison

