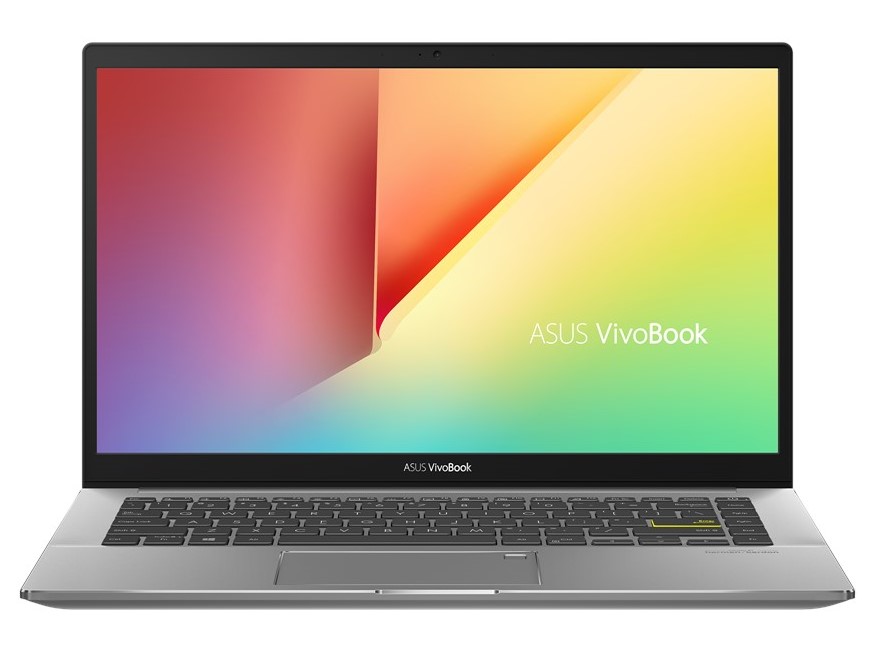
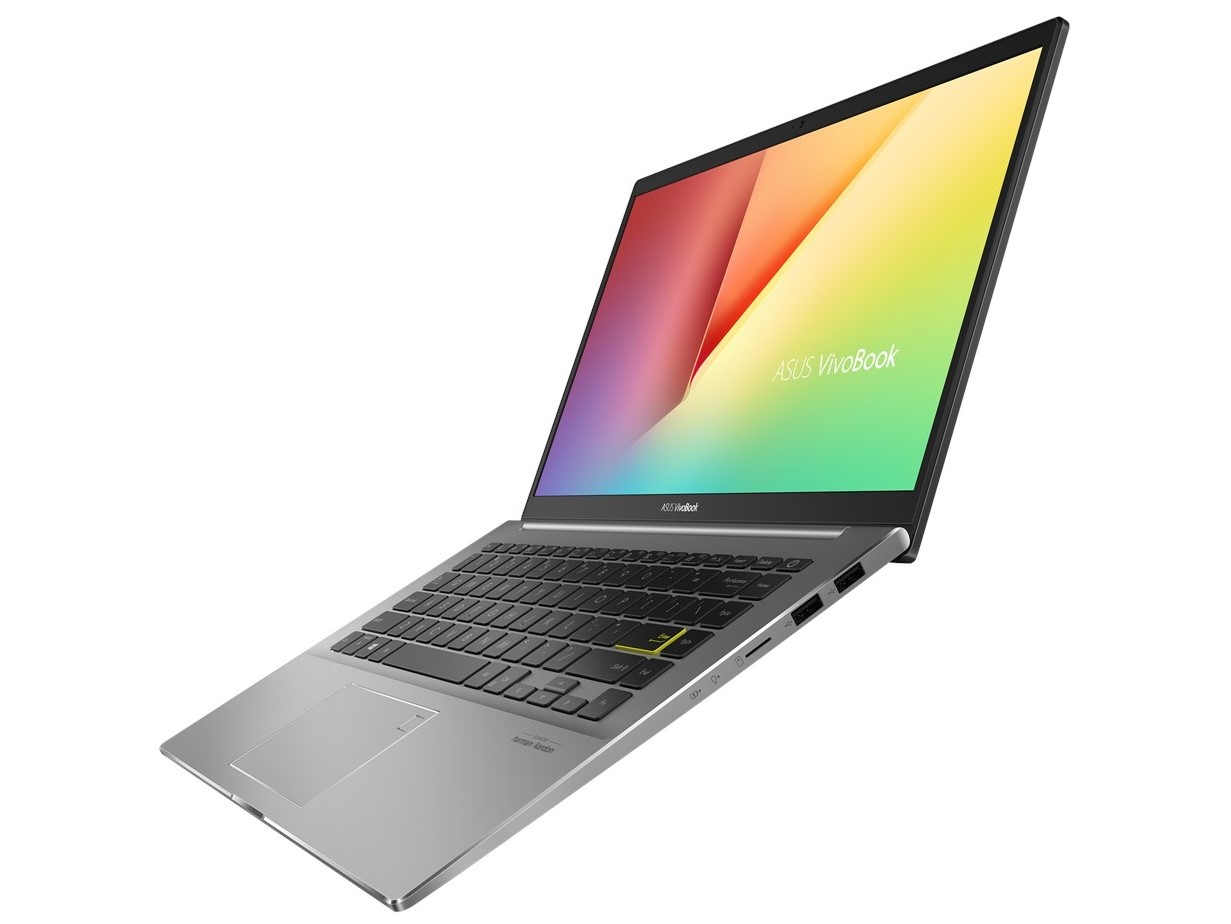
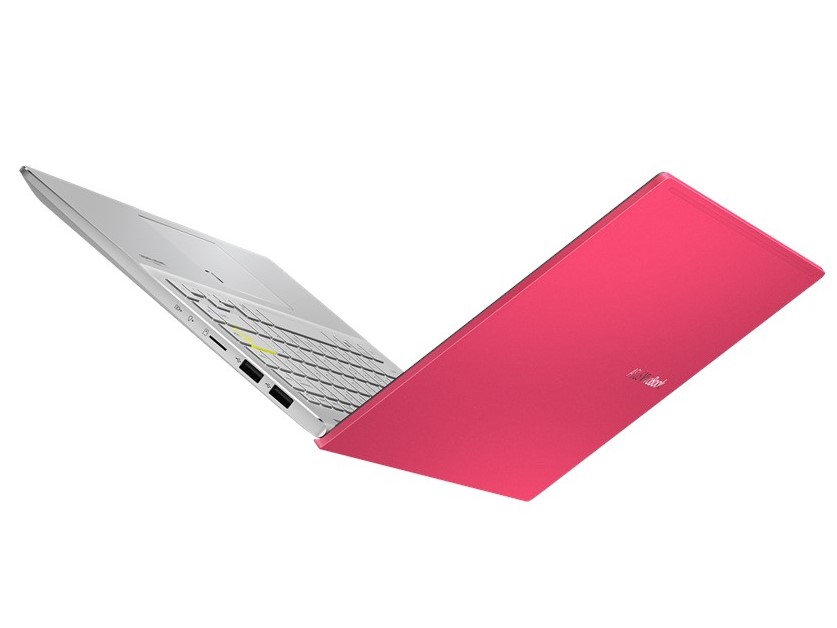
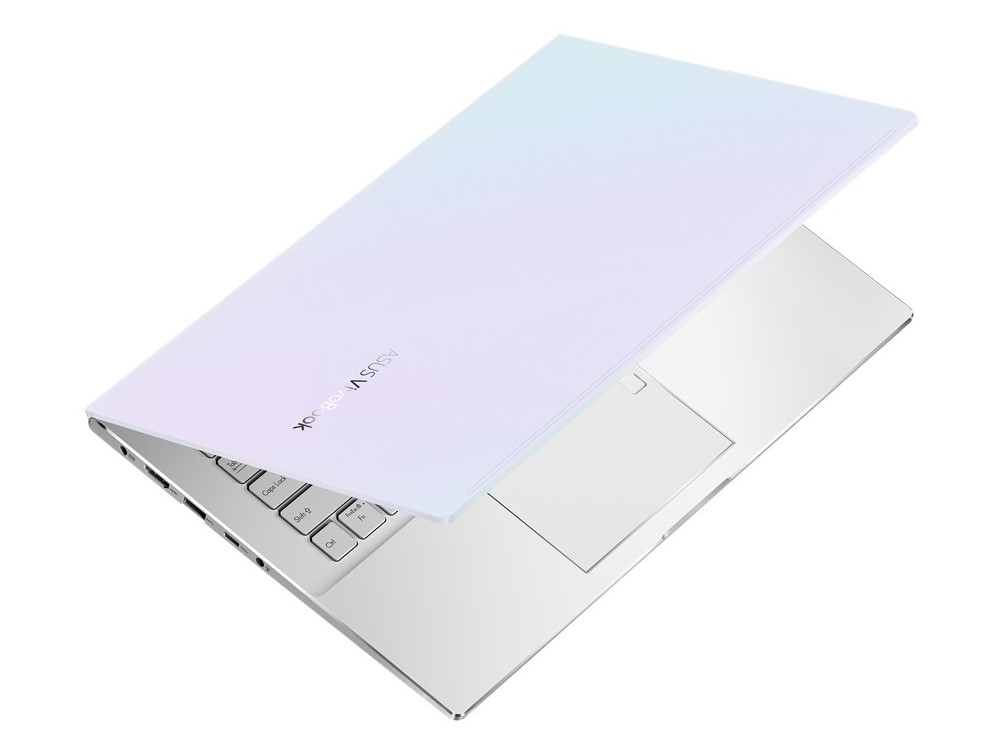
Asus VivoBook S14 S433FL rövid értékelés: Színes laptop stabil házzal
Értékelés | Dátum | Modell | Súly | Magasság | Méret | Felbontás | Legjobb ár |
|---|---|---|---|---|---|---|---|
| 80.7 % v7 (old) | 09/2020 | Asus VivoBook S14 S433FL i7-10510U, GeForce MX250 | 1.4 kg | 16 mm | 14.00" | 1920x1080 | |
| 86.5 % v7 (old) | 07/2020 | Acer Swift 3 SF314-42-R4XJ R7 4700U, Vega 7 | 1.2 kg | 16.55 mm | 14.00" | 1920x1080 | |
| 85.6 % v7 (old) | 04/2020 | Schenker VIA 14 i5-10210U, UHD Graphics 620 | 1.1 kg | 16.5 mm | 14.00" | 1920x1080 | |
| 77.8 % v7 (old) | 04/2020 | HP Pavilion 14-ce3040ng i7-1065G7, GeForce MX250 | 1.6 kg | 18 mm | 14.00" | 1920x1080 |
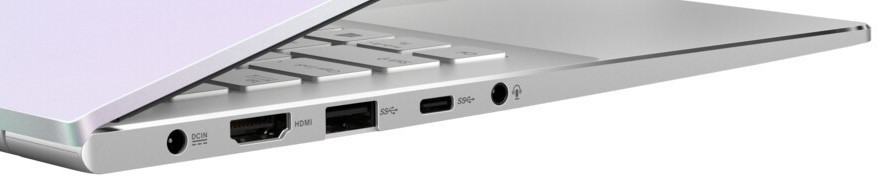
Port configuration

| SD Card Reader | |
| average JPG Copy Test (av. of 3 runs) | |
| Az osztály átlaga Multimedia (23 - 531, n=43, az elmúlt 2 évben) | |
| Schenker VIA 14 | |
| HP Pavilion 14-ce3040ng (Toshiba Exceria Pro SDXC 64 GB UHS-II) | |
| Asus VivoBook S14 S433FL (Toshiba Exceria Pro M501 microSDXC 64GB) | |
| maximum AS SSD Seq Read Test (1GB) | |
| Az osztály átlaga Multimedia (27.9 - 1455, n=42, az elmúlt 2 évben) | |
| Schenker VIA 14 (Toshiba Exceria pro M501 64 GB UHS-II) | |
| HP Pavilion 14-ce3040ng (Toshiba Exceria Pro SDXC 64 GB UHS-II) | |
| Asus VivoBook S14 S433FL (Toshiba Exceria Pro M501 microSDXC 64GB) | |

")
")
| |||||||||||||||||||||||||
Fényerő megoszlás: 68 %
Centrumban: 216 cd/m²
Kontraszt: 1419:1 (Fekete: 0.155 cd/m²)
ΔE ColorChecker Calman: 5.23 | ∀{0.5-29.43 Ø4.72}
calibrated: 4.4
ΔE Greyscale Calman: 3.77 | ∀{0.09-98 Ø4.97}
62% sRGB (Argyll 1.6.3 3D)
40% AdobeRGB 1998 (Argyll 1.6.3 3D)
42.99% AdobeRGB 1998 (Argyll 3D)
62% sRGB (Argyll 3D)
41.55% Display P3 (Argyll 3D)
Gamma: 2.35
CCT: 6666 K
| Asus VivoBook S14 S433FL Chi Mei CMN14D4, IPS, 1920x1080, 14" | Acer Swift 3 SF314-42-R4XJ AU Optronics B140HAN04.0, IPS, 1920x1080, 14" | Schenker VIA 14 B140HAN06.2, a-Si AHVA-IPS LED, 1920x1080, 14" | HP Pavilion 14-ce3040ng AUO543D, IPS, 1920x1080, 14" | |
|---|---|---|---|---|
| Display | -10% | 65% | 59% | |
| Display P3 Coverage (%) | 41.55 | 37.2 -10% | 69.8 68% | 66.5 60% |
| sRGB Coverage (%) | 62 | 55.9 -10% | 99.6 61% | 98.4 59% |
| AdobeRGB 1998 Coverage (%) | 42.99 | 38.43 -11% | 71.6 67% | 68.2 59% |
| Response Times | -13% | -63% | -51% | |
| Response Time Grey 50% / Grey 80% * (ms) | 34 ? | 41 ? -21% | 60.8 ? -79% | 60.8 ? -79% |
| Response Time Black / White * (ms) | 24 ? | 25 ? -4% | 35.2 ? -47% | 29.6 ? -23% |
| PWM Frequency (Hz) | 250 ? | |||
| Screen | 3% | 44% | 27% | |
| Brightness middle (cd/m²) | 220 | 269 22% | 335 52% | 395 80% |
| Brightness (cd/m²) | 204 | 244 20% | 309 51% | 375 84% |
| Brightness Distribution (%) | 68 | 83 22% | 84 24% | 91 34% |
| Black Level * (cd/m²) | 0.155 | 0.23 -48% | 0.17 -10% | 0.26 -68% |
| Contrast (:1) | 1419 | 1170 -18% | 1971 39% | 1519 7% |
| Colorchecker dE 2000 * | 5.23 | 4.94 6% | 2.3 56% | 5.92 -13% |
| Colorchecker dE 2000 max. * | 21.51 | 20.37 5% | 5 77% | 9.79 54% |
| Colorchecker dE 2000 calibrated * | 4.4 | 5.03 -14% | 1 77% | 0.91 79% |
| Greyscale dE 2000 * | 3.77 | 1.71 55% | 3.9 -3% | 6.69 -77% |
| Gamma | 2.35 94% | 2.52 87% | 2.19 100% | 2.78 79% |
| CCT | 6666 98% | 6535 99% | 6556 99% | 7596 86% |
| Color Space (Percent of AdobeRGB 1998) (%) | 40 | 35 -12% | 65.5 64% | 63 58% |
| Color Space (Percent of sRGB) (%) | 62 | 56 -10% | 99.6 61% | 98 58% |
| Teljes átlag (program / beállítások) | -7% /
-2% | 15% /
35% | 12% /
23% |
* ... a kisebb jobb
Megjelenítési válaszidők
| ↔ Válaszidő Fekete-fehér | ||
|---|---|---|
| 24 ms ... emelkedés és süllyedés ↘ kombinálva | ↗ 14 ms emelkedés | 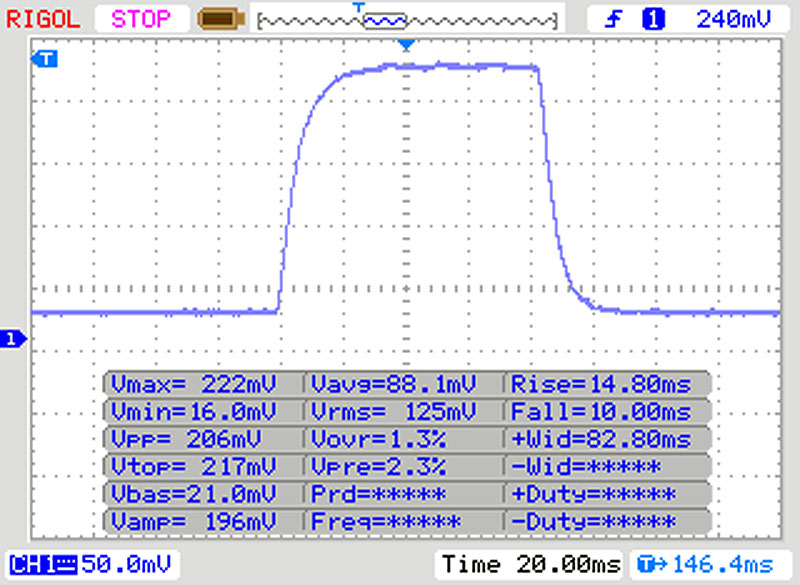 |
| ↘ 10 ms ősz | ||
| A képernyő jó reakciósebességet mutat tesztjeinkben, de túl lassú lehet a versenyképes játékosok számára. Összehasonlításképpen, az összes tesztelt eszköz 0.1 (minimum) és 240 (maximum) ms között mozog. » 54 % of all devices are better. Ez azt jelenti, hogy a mért válaszidő rosszabb, mint az összes vizsgált eszköz átlaga (19.8 ms). | ||
| ↔ Válaszidő 50% szürke és 80% szürke között | ||
| 34 ms ... emelkedés és süllyedés ↘ kombinálva | ↗ 16 ms emelkedés | 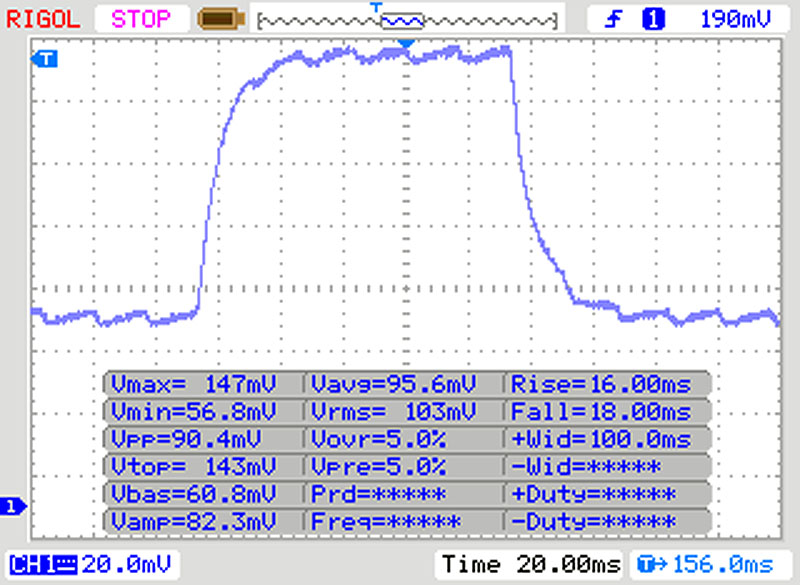 |
| ↘ 18 ms ősz | ||
| A képernyő lassú reakciósebességet mutat tesztjeinkben, és nem lesz kielégítő a játékosok számára. Összehasonlításképpen, az összes tesztelt eszköz 0.165 (minimum) és 636 (maximum) ms között mozog. » 47 % of all devices are better. Ez azt jelenti, hogy a mért válaszidő hasonló az összes vizsgált eszköz átlagához (31 ms). | ||
Képernyő villogása / PWM (impulzusszélesség-moduláció)
| Képernyő villogása / PWM észlelve | 250 Hz | ≤ 20 % fényerő beállítása | 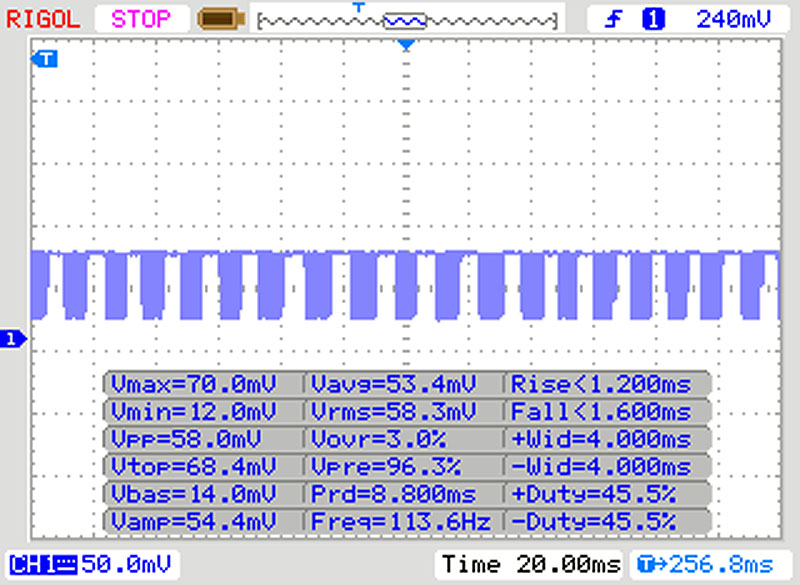 |
A kijelző háttérvilágítása 250 Hz-en villog (a legrosszabb esetben, pl. PWM használatával) Villódzás észlelve a 20 % vagy annál kisebb fényerő-beállításnál. E fényerő-beállítás felett nem lehet villogás vagy PWM. A 250 Hz frekvenciája viszonylag alacsony, így az érzékeny felhasználók valószínűleg villogást észlelnek, és megerőltetik a szemüket a megadott és az alatti fényerő-beállítás mellett. Összehasonlításképpen: az összes tesztelt eszköz 52 %-a nem használja a PWM-et a kijelző elsötétítésére. Ha PWM-et észleltek, akkor átlagosan 7763 (minimum: 5 - maximum: 343500) Hz-t mértek. | |||
Cinebench R15: CPU Single 64Bit | CPU Multi 64Bit
Blender: v2.79 BMW27 CPU
7-Zip 18.03: 7z b 4 -mmt1 | 7z b 4
Geekbench 5.5: Single-Core | Multi-Core
HWBOT x265 Benchmark v2.2: 4k Preset
LibreOffice : 20 Documents To PDF
R Benchmark 2.5: Overall mean
| Cinebench R20 / CPU (Single Core) | |
| Az osztály átlaga Multimedia (425 - 853, n=63, az elmúlt 2 évben) | |
| HP Pavilion 14-ce3040ng | |
| Acer Swift 3 SF314-42-R4XJ | |
| Asus VivoBook S14 S433FL | |
| Átlagos Intel Core i7-10510U (362 - 497, n=37) | |
| Schenker VIA 14 | |
| Cinebench R20 / CPU (Multi Core) | |
| Az osztály átlaga Multimedia (1887 - 12912, n=63, az elmúlt 2 évben) | |
| Acer Swift 3 SF314-42-R4XJ | |
| HP Pavilion 14-ce3040ng | |
| Asus VivoBook S14 S433FL | |
| Átlagos Intel Core i7-10510U (1015 - 1897, n=38) | |
| Schenker VIA 14 | |
| Cinebench R15 / CPU Single 64Bit | |
| Az osztály átlaga Multimedia (184.8 - 326, n=65, az elmúlt 2 évben) | |
| HP Pavilion 14-ce3040ng | |
| Acer Swift 3 SF314-42-R4XJ | |
| Átlagos Intel Core i7-10510U (113 - 202, n=42) | |
| Asus VivoBook S14 S433FL | |
| Schenker VIA 14 | |
| Cinebench R15 / CPU Multi 64Bit | |
| Az osztály átlaga Multimedia (856 - 5224, n=67, az elmúlt 2 évben) | |
| Acer Swift 3 SF314-42-R4XJ | |
| Schenker VIA 14 | |
| HP Pavilion 14-ce3040ng | |
| Átlagos Intel Core i7-10510U (482 - 856, n=45) | |
| Asus VivoBook S14 S433FL | |
| Blender / v2.79 BMW27 CPU | |
| Schenker VIA 14 | |
| Átlagos Intel Core i7-10510U (628 - 1051, n=31) | |
| Asus VivoBook S14 S433FL | |
| Acer Swift 3 SF314-42-R4XJ | |
| Az osztály átlaga Multimedia (100 - 557, n=64, az elmúlt 2 évben) | |
| 7-Zip 18.03 / 7z b 4 -mmt1 | |
| Az osztály átlaga Multimedia (3666 - 7545, n=62, az elmúlt 2 évben) | |
| Asus VivoBook S14 S433FL | |
| Átlagos Intel Core i7-10510U (3747 - 4981, n=31) | |
| Acer Swift 3 SF314-42-R4XJ | |
| Schenker VIA 14 | |
| 7-Zip 18.03 / 7z b 4 | |
| Az osztály átlaga Multimedia (26062 - 130368, n=61, az elmúlt 2 évben) | |
| Acer Swift 3 SF314-42-R4XJ | |
| Átlagos Intel Core i7-10510U (12196 - 21298, n=31) | |
| Asus VivoBook S14 S433FL | |
| Schenker VIA 14 | |
| Geekbench 5.5 / Single-Core | |
| Az osztály átlaga Multimedia (805 - 2974, n=61, az elmúlt 2 évben) | |
| Asus VivoBook S14 S433FL | |
| Átlagos Intel Core i7-10510U (977 - 1287, n=31) | |
| Acer Swift 3 SF314-42-R4XJ | |
| Schenker VIA 14 | |
| Geekbench 5.5 / Multi-Core | |
| Az osztály átlaga Multimedia (4652 - 20422, n=61, az elmúlt 2 évben) | |
| Acer Swift 3 SF314-42-R4XJ | |
| Schenker VIA 14 | |
| Asus VivoBook S14 S433FL | |
| Átlagos Intel Core i7-10510U (2474 - 4484, n=31) | |
| HWBOT x265 Benchmark v2.2 / 4k Preset | |
| Az osztály átlaga Multimedia (5.26 - 36.1, n=62, az elmúlt 2 évben) | |
| Acer Swift 3 SF314-42-R4XJ | |
| Átlagos Intel Core i7-10510U (3.41 - 6.04, n=31) | |
| Asus VivoBook S14 S433FL | |
| Schenker VIA 14 | |
| LibreOffice / 20 Documents To PDF | |
| Átlagos Intel Core i7-10510U (50.7 - 77.8, n=27) | |
| Acer Swift 3 SF314-42-R4XJ | |
| Asus VivoBook S14 S433FL | |
| Az osztály átlaga Multimedia (23.9 - 146.7, n=63, az elmúlt 2 évben) | |
| R Benchmark 2.5 / Overall mean | |
| Schenker VIA 14 | |
| Átlagos Intel Core i7-10510U (0.637 - 0.81, n=28) | |
| Asus VivoBook S14 S433FL | |
| Acer Swift 3 SF314-42-R4XJ | |
| Az osztály átlaga Multimedia (0.3604 - 0.947, n=62, az elmúlt 2 évben) | |
* ... a kisebb jobb
| PCMark 10 Score | 3933 pontok | |
Segítség | ||
| DPC Latencies / LatencyMon - interrupt to process latency (max), Web, Youtube, Prime95 | |
| Schenker VIA 14 | |
| Acer Swift 3 SF314-42-R4XJ | |
| Asus VivoBook S14 S433FL | |
* ... a kisebb jobb
| Asus VivoBook S14 S433FL Intel Optane Memory H10 with Solid State Storage 32GB + 512GB HBRPEKNX0202A(L/H) | Acer Swift 3 SF314-42-R4XJ Samsung PM991 MZVLQ1T0HALB | Schenker VIA 14 Seagate FireCuda 520 SSD ZP1000GM30002 | HP Pavilion 14-ce3040ng Toshiba XG6 KXG60ZNV1T02 | Átlagos Intel Optane Memory H10 with Solid State Storage 32GB + 512GB HBRPEKNX0202A(L/H) | Az osztály átlaga Multimedia | |
|---|---|---|---|---|---|---|
| CrystalDiskMark 5.2 / 6 | 13% | 74% | 63% | -4% | 116% | |
| Write 4K (MB/s) | 124.9 | 98.8 -21% | 201 61% | 181.6 45% | 110.3 ? -12% | 164.2 ? 31% |
| Read 4K (MB/s) | 147.9 | 32.44 -78% | 60.2 -59% | 57.4 -61% | 131.9 ? -11% | 67.8 ? -54% |
| Write Seq (MB/s) | 753 | 1582 110% | 2471 228% | 1982 163% | 569 ? -24% | 2680 ? 256% |
| Read Seq (MB/s) | 1223 | 1471 20% | 2104 72% | 1899 55% | 1372 ? 12% | 3133 ? 156% |
| Write 4K Q32T1 (MB/s) | 369.2 | 375.4 2% | 323.6 -12% | 509 38% | 387 ? 5% | 454 ? 23% |
| Read 4K Q32T1 (MB/s) | 358.1 | 491.9 37% | 551 54% | 545 52% | 375 ? 5% | 580 ? 62% |
| Write Seq Q32T1 (MB/s) | 1057 | 1574 49% | 3407 222% | 3072 191% | 1141 ? 8% | 4626 ? 338% |
| Read Seq Q32T1 (MB/s) | 2738 | 2329 -15% | 3475 27% | 3281 20% | 2439 ? -11% | 5831 ? 113% |
| AS SSD | 37% | 215% | 166% | -3% | 206% | |
| Seq Read (MB/s) | 957 | 1960 105% | 2488 160% | 2762 189% | 1056 ? 10% | 4476 ? 368% |
| Seq Write (MB/s) | 353.1 | 1547 338% | 2615 641% | 2493 606% | 429 ? 21% | 3059 ? 766% |
| 4K Read (MB/s) | 62.4 | 31.56 -49% | 72.8 17% | 52.1 -17% | 61.9 ? -1% | 61.4 ? -2% |
| 4K Write (MB/s) | 122.8 | 116.6 -5% | 172.3 40% | 147.5 20% | 105 ? -14% | 185 ? 51% |
| 4K-64 Read (MB/s) | 386.2 | 454.7 18% | 2052 431% | 1473 281% | 459 ? 19% | 1071 ? 177% |
| 4K-64 Write (MB/s) | 605 | 262.1 -57% | 1746 189% | 1456 141% | 644 ? 6% | 2210 ? 265% |
| Access Time Read * (ms) | 0.107 | 0.06 44% | 0.094 12% | 0.1019 ? 5% | 0.05975 ? 44% | |
| Access Time Write * (ms) | 0.046 | 0.034 26% | 0.022 52% | 0.03 35% | 0.09417 ? -105% | 0.07482 ? -63% |
| Score Read (Points) | 544 | 682 25% | 2373 336% | 1801 231% | 627 ? 15% | 1580 ? 190% |
| Score Write (Points) | 763 | 533 -30% | 2180 186% | 1853 143% | 792 ? 4% | 2701 ? 254% |
| Score Total (Points) | 1581 | 1552 -2% | 5782 266% | 4568 189% | 1732 ? 10% | 5031 ? 218% |
| Teljes átlag (program / beállítások) | 25% /
26% | 145% /
156% | 115% /
123% | -4% /
-3% | 161% /
168% |
* ... a kisebb jobb

Continuous load read: DiskSpd Read Loop, Queue Depth 8
| 3DMark 11 Performance | 5022 pontok | |
| 3DMark Fire Strike Score | 3460 pontok | |
| 3DMark Time Spy Score | 1282 pontok | |
Segítség | ||
| The Witcher 3 | |
| 1024x768 Low Graphics & Postprocessing | |
| Az osztály átlaga Multimedia (68 - 380, n=8, az elmúlt 2 évben) | |
| Átlagos NVIDIA GeForce MX250 (47.4 - 70, n=24) | |
| HP Pavilion 14-ce3040ng | |
| Acer Swift 3 SF314-42-R4XJ | |
| 1366x768 Medium Graphics & Postprocessing | |
| Az osztály átlaga Multimedia (41 - 93, n=4, az elmúlt 2 évben) | |
| Asus VivoBook S14 S433FL | |
| Átlagos NVIDIA GeForce MX250 (30 - 40, n=27) | |
| HP Pavilion 14-ce3040ng | |
| Acer Swift 3 SF314-42-R4XJ | |
| 1920x1080 High Graphics & Postprocessing (Nvidia HairWorks Off) | |
| Az osztály átlaga Multimedia (22 - 224, n=11, az elmúlt 2 évben) | |
| Asus VivoBook S14 S433FL | |
| Átlagos NVIDIA GeForce MX250 (16.3 - 23.1, n=27) | |
| HP Pavilion 14-ce3040ng | |
| Acer Swift 3 SF314-42-R4XJ | |
| 1920x1080 Ultra Graphics & Postprocessing (HBAO+) | |
| Az osztály átlaga Multimedia (11 - 121, n=11, az elmúlt 2 évben) | |
| Asus VivoBook S14 S433FL | |
| Átlagos NVIDIA GeForce MX250 (9 - 16, n=24) | |
| HP Pavilion 14-ce3040ng | |
| Acer Swift 3 SF314-42-R4XJ | |
| X-Plane 11.11 - 1920x1080 high (fps_test=3) | |
| Az osztály átlaga Multimedia (16.9 - 141.1, n=60, az elmúlt 2 évben) | |
| Átlagos NVIDIA GeForce MX250 (9.8 - 52.6, n=17) | |
| Asus VivoBook S14 S433FL | |
| Acer Swift 3 SF314-42-R4XJ | |
| Schenker VIA 14 | |
| alacsony | közepes | magas | ultra | |
|---|---|---|---|---|
| The Witcher 3 (2015) | 36 | 21 | 13 | |
| Dota 2 Reborn (2015) | 102.4 | 90.5 | 71.3 | 63.8 |
| X-Plane 11.11 (2018) | 47.7 | 42.8 | 39.3 |
Zajszint
| Üresjárat |
| 31 / 31 / 31.3 dB(A) |
| Terhelés |
| 43.4 / 41.5 dB(A) |
 | ||
30 dB csendes 40 dB(A) hallható 50 dB(A) hangos |
||
min: | ||
(±) A felső oldalon a maximális hőmérséklet 43 °C / 109 F, összehasonlítva a 36.8 °C / 98 F átlagával , 21 és 71 °C között a Multimedia osztálynál.
(±) Az alsó maximum 44.8 °C / 113 F-ig melegszik fel, összehasonlítva a 39.1 °C / 102 F átlagával
(+) Üresjáratban a felső oldal átlagos hőmérséklete 25.7 °C / 78 F, összehasonlítva a 31.3 °C / ### eszközátlaggal class_avg_f### F.
(±) A The Witcher 3 játék során a felső oldal átlaghőmérséklete 35.2 °C / 95 F, összehasonlítva a 31.3 °C / ## eszközátlaggal #class_avg_f### F.
(+) A csuklótámasz és az érintőpad eléri a bőr maximális hőmérsékletét (33.2 °C / 91.8 F), ezért nem forrók.
(-) A hasonló eszközök csuklótámasz területének átlagos hőmérséklete 28.7 °C / 83.7 F volt (-4.5 °C / -8.1 F).
Asus VivoBook S14 S433FL hangelemzés
(-) | nem túl hangos hangszórók (70.2 dB)
Basszus 100 - 315 Hz
(-) | szinte nincs basszus – átlagosan 18.1%-kal alacsonyabb a mediánnál
(-) | A basszus nem lineáris (16.5% delta az előző frekvenciához)
Közepes 400-2000 Hz
(+) | kiegyensúlyozott középpontok – csak 4.8% választja el a mediántól
(±) | a középpontok linearitása átlagos (7.1% delta az előző gyakorisághoz)
Maximum 2-16 kHz
(+) | kiegyensúlyozott csúcsok – csak 2.6% választja el a mediántól
(±) | a csúcsok linearitása átlagos (7.3% delta az előző gyakorisághoz)
Összességében 100 - 16.000 Hz
(±) | az általános hang linearitása átlagos (19.5% eltérés a mediánhoz képest)
Ugyanazon osztályhoz képest
» 63%Ebben az osztályban az összes tesztelt eszköz %-a jobb volt, 7% hasonló, 29%-kal rosszabb
» A legjobb delta értéke 5%, az átlag 17%, a legrosszabb 45% volt
Az összes tesztelt eszközzel összehasonlítva
» 48% az összes tesztelt eszköz jobb volt, 7% hasonló, 44%-kal rosszabb
» A legjobb delta értéke 4%, az átlag 24%, a legrosszabb 134% volt
Apple MacBook 12 (Early 2016) 1.1 GHz hangelemzés
(+) | a hangszórók viszonylag hangosan tudnak játszani (83.6 dB)
Basszus 100 - 315 Hz
(±) | csökkentett basszus – átlagosan 11.3%-kal alacsonyabb, mint a medián
(±) | a basszus linearitása átlagos (14.2% delta az előző frekvenciához)
Közepes 400-2000 Hz
(+) | kiegyensúlyozott középpontok – csak 2.4% választja el a mediántól
(+) | a középpontok lineárisak (5.5% delta az előző frekvenciához)
Maximum 2-16 kHz
(+) | kiegyensúlyozott csúcsok – csak 2% választja el a mediántól
(+) | a csúcsok lineárisak (4.5% delta az előző frekvenciához képest)
Összességében 100 - 16.000 Hz
(+) | általános hangzás lineáris (10.2% eltérés a mediánhoz képest)
Ugyanazon osztályhoz képest
» 7%Ebben az osztályban az összes tesztelt eszköz %-a jobb volt, 2% hasonló, 91%-kal rosszabb
» A legjobb delta értéke 5%, az átlag 18%, a legrosszabb 53% volt
Az összes tesztelt eszközzel összehasonlítva
» 5% az összes tesztelt eszköz jobb volt, 1% hasonló, 94%-kal rosszabb
» A legjobb delta értéke 4%, az átlag 24%, a legrosszabb 134% volt
| Kikapcsolt állapot / Készenlét | |
| Üresjárat | |
| Terhelés |
|
Kulcs:
min: | |
Pro
Kontra
Összegzés - Életstílus laptop sokféle felhasználásra.
Az Asus VivoBook S14 nagyon sokoldalú laptopnak bizonyult a tesztünkben. Irodai alkalmazásokhoz bőven van teljesítmény, és az Nvidia GeForce MX250 teljesítménye alkalmi játszáshoz is elegendő. A jó üzemidővel és a kis mérettel kombinálva a 14 hüvelykes laptop utazótársként is jó.
Az Asus VivoBook S14 S433FL egy jó mindenes, amely számos helyzetben jó teljesítményre képes.
Egyedül a lassú microSD kártyaolvasó és a billentyűzet adnak okot panaszra, ez utóbbi kissé túl finom a mi ízlésünknek. A konfiguráció többi része határozottan kielégítő a laptop árszintjéhez képest. Érzékenyebb felhasználóknak viszont gondot okozhat az enyhe „coil whine”, amikor a hálózati adapter be van dugva, és a PWM (impulzusszélesség-moduláció), amely alacsony fényerőszinteken jelen van. Akik értékelik az ujjlenyomat-olvasót, azok számbillentyűzet nélkül fognak maradni. Másrészt pedig azok a felhasználók, akik szeretnének számbillentyűzetet használni, kénytelenek lesznek feladni az ujjlenyomat-olvasót.
Asus VivoBook S14 S433FL
- 07/20/2020 v7 (old)
Mike Wobker
Price comparison

