 Deutsch
 English
 Español
 Français
 Italiano
 Nederlands
 Polski
 Português
 Русский
 Türkçe
 Svenska
 Chinese
 Magyar
MSI GT73VR 6RF Titan Notebook rövid értékelés

| SD Card Reader | |
| average JPG Copy Test (av. of 3 runs) | |
| Asus G701VO-CS74K | |
| MSI GT73VR 6RF | |
| MSI GS73VR 6RF | |
| maximum AS SSD Seq Read Test (1GB) | |
| Asus G701VO-CS74K | |
| MSI GT73VR 6RF | |
| MSI GS73VR 6RF | |
| Networking | |
| WiFi Speed Client 1m 512KB | |
| WiFi Speed Server 1m 512KB |
| |||||||||||||||||||||||||
Fényerő megoszlás: 87 %
Centrumban: 334.8 cd/m²
Kontraszt: 793:1 (Fekete: 0.422 cd/m²)
ΔE Color 4.11 | 0.5-29.43 Ø5
ΔE Greyscale 5.74 | 0.57-98 Ø5.3
96% sRGB (Argyll 1.6.3 3D)
60.5% AdobeRGB 1998 (Argyll 1.6.3 3D)
65.7% AdobeRGB 1998 (Argyll 2.2.0 3D)
95.8% sRGB (Argyll 2.2.0 3D)
63.6% Display P3 (Argyll 2.2.0 3D)
Gamma: 2.3
| MSI GT73VR 6RF IPS, 17.30, 3840x2160 | MSI GT73VR-6RE16SR451 N173HHE-G32 (CMN1747), TN, 17.30, 1920x1080 | Acer Predator 17 G9-793-77LG AU Optronics B173ZAN01.0 (AUO109B), IPS, 17.30, 3840x2160 | Asus G701VO-CS74K IPS, 17.30, 1920x1080 | MSI GS73VR 6RF TN LED, 17.30, 1920x1080 | |
|---|---|---|---|---|---|
| Display | 25% | 31% | -1% | 24% | |
| Display P3 Coverage | 63.6 | 91.2 43% | 86.9 37% | 68.8 8% | 90 42% |
| sRGB Coverage | 95.8 | 100 4% | 100 4% | 87.7 -8% | 99.9 4% |
| AdobeRGB 1998 Coverage | 65.7 | 84.9 29% | 99.4 51% | 64.1 -2% | 83.6 27% |
| Response Times | 50% | 5% | 13% | 43% | |
| Response Time Grey 50% / Grey 80% * | 33.6 ? | 26 ? 23% | 37 ? -10% | 29.2 ? 13% | 28 ? 17% |
| Response Time Black / White * | 30 ? | 6.8 ? 77% | 24 ? 20% | 26.4 ? 12% | 9.6 ? 68% |
| PWM Frequency | |||||
| Screen | -17% | 21% | 7% | 21% | |
| Brightness middle | 334.8 | 314 -6% | 336 0% | 368.1 10% | 337.2 1% |
| Brightness | 316 | 294 -7% | 320 1% | 349 10% | 315 0% |
| Brightness Distribution | 87 | 89 2% | 88 1% | 86 -1% | 86 -1% |
| Black Level * | 0.422 | 0.23 45% | 0.25 41% | 0.365 14% | 0.308 27% |
| Contrast | 793 | 1365 72% | 1344 69% | 1008 27% | 1095 38% |
| Colorchecker dE 2000 * | 4.11 | 9.74 -137% | 3.61 12% | 4.16 -1% | 2.96 28% |
| Colorchecker dE 2000 max. * | 7.8 | 15.71 -101% | 6.02 23% | 8.7 -12% | 5.45 30% |
| Greyscale dE 2000 * | 5.74 | 9.58 -67% | 4.78 17% | 3.86 33% | 2.57 55% |
| Gamma | 2.3 96% | 2.5 88% | 2.32 95% | 2.19 100% | 2.25 98% |
| CCT | 5987 109% | 11854 55% | 6185 105% | 6892 94% | 7114 91% |
| Color Space (Percent of AdobeRGB 1998) | 60.5 | 76 26% | 88 45% | 57.6 -5% | 74.3 23% |
| Color Space (Percent of sRGB) | 96 | 100 4% | 100 4% | 87.6 -9% | 100 4% |
| Teljes átlag (program / beállítások) | 19% /
0% | 19% /
21% | 6% /
6% | 29% /
24% |
* ... a kisebb jobb
Megjelenítési válaszidők
| ↔ Válaszidő Fekete-fehér | ||
|---|---|---|
| 30 ms ... emelkedés és süllyedés ↘ kombinálva | ↗ 5.2 ms emelkedés | 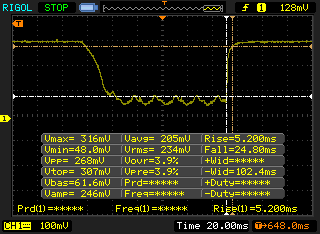 |
| ↘ 24.8 ms ősz | ||
| A képernyő lassú reakciósebességet mutat tesztjeinkben, és nem lesz kielégítő a játékosok számára. In comparison, all tested devices range from 0.1 (minimum) to 240 (maximum) ms. » 77 % of all devices are better. Ez azt jelenti, hogy a mért válaszidő rosszabb, mint az összes vizsgált eszköz átlaga (21.5 ms). | ||
| ↔ Válaszidő 50% szürke és 80% szürke között | ||
| 33.6 ms ... emelkedés és süllyedés ↘ kombinálva | ↗ 13.2 ms emelkedés | 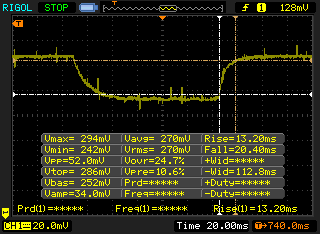 |
| ↘ 20.4 ms ősz | ||
| A képernyő lassú reakciósebességet mutat tesztjeinkben, és nem lesz kielégítő a játékosok számára. In comparison, all tested devices range from 0.2 (minimum) to 636 (maximum) ms. » 39 % of all devices are better. Ez azt jelenti, hogy a mért válaszidő hasonló az összes vizsgált eszköz átlagához (33.7 ms). | ||
Képernyő villogása / PWM (impulzusszélesség-moduláció)
| Képernyő villogása / PWM nem érzékelhető | 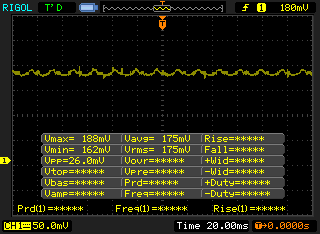 | ||
In comparison: 53 % of all tested devices do not use PWM to dim the display. If PWM was detected, an average of 17924 (minimum: 5 - maximum: 3846000) Hz was measured. | |||
| Cinebench R15 | |
| CPU Single 64Bit | |
| MSI GT73VR 6RF | |
| Eurocom Sky X7E2 | |
| MSI GP62-2QEi781FD | |
| MSI GT72VR 6RD-063US | |
| Toshiba Satellite S70-B-106 | |
| CPU Multi 64Bit | |
| Eurocom Sky X7E2 | |
| MSI GT73VR 6RF | |
| MSI GP62-2QEi781FD | |
| MSI GT72VR 6RD-063US | |
| Toshiba Satellite S70-B-106 | |
| Cinebench R11.5 | |
| CPU Single 64Bit | |
| MSI GT73VR 6RF | |
| Eurocom Sky X7E2 | |
| MSI GP62-2QEi781FD | |
| MSI GT72VR 6RD-063US | |
| Toshiba Satellite S70-B-106 | |
| CPU Multi 64Bit | |
| MSI GT73VR 6RF | |
| Eurocom Sky X7E2 | |
| MSI GP62-2QEi781FD | |
| MSI GT72VR 6RD-063US | |
| Toshiba Satellite S70-B-106 | |
| Cinebench R10 | |
| Rendering Multiple CPUs 32Bit | |
| MSI GT73VR 6RF | |
| Eurocom Sky X7E2 | |
| MSI GT72VR 6RD-063US | |
| MSI GP62-2QEi781FD | |
| Rendering Single 32Bit | |
| Eurocom Sky X7E2 | |
| MSI GT73VR 6RF | |
| MSI GP62-2QEi781FD | |
| MSI GT72VR 6RD-063US | |
| PCMark 8 | |
| Home Score Accelerated v2 | |
| Asus G752VS-XB78K | |
| Asus G701VO-CS74K | |
| MSI GT73VR 6RF | |
| MSI GS73VR 6RF | |
| EVGA SC17 | |
| Work Score Accelerated v2 | |
| Asus G752VS-XB78K | |
| Asus G701VO-CS74K | |
| MSI GS73VR 6RF | |
| MSI GT73VR 6RF | |
| EVGA SC17 | |
| Creative Score Accelerated v2 | |
| Asus G752VS-XB78K | |
| MSI GT73VR 6RF | |
| Asus G701VO-CS74K | |
| MSI GS73VR 6RF | |
| EVGA SC17 | |
| PCMark 8 Home Score Accelerated v2 | 4252 pontok | |
| PCMark 8 Creative Score Accelerated v2 | 8227 pontok | |
| PCMark 8 Work Score Accelerated v2 | 4378 pontok | |
Segítség | ||
| MSI GT73VR 6RF 2x SanDisk X400 1TB M.2 SD8SN8U1T001122 (RAID 0) | MSI GT73VR-6RE16SR451 2x Samsung SM951 MZVPV256HDGL (RAID 0) | Asus G701VO-CS74K 2x Samsung SM951 MZVPV512HDGL (RAID 0) | Eurocom Sky X7E2 Samsung SM951 MZVPV512HDGL m.2 PCI-e | MSI GS73VR 6RF SanDisk SD8SN8U1T001122 | |
|---|---|---|---|---|---|
| CrystalDiskMark 3.0 | 127% | 105% | 67% | -55% | |
| Read Seq | 914 | 3285 259% | 3067 236% | 1673 83% | 334.3 -63% |
| Write Seq | 916 | 2560 179% | 2434 166% | 1576 72% | 319 -65% |
| Read 512 | 698 | 1775 154% | 1582 127% | 1180 69% | 242.3 -65% |
| Write 512 | 916 | 2327 154% | 2255 146% | 1561 70% | 254.4 -72% |
| Read 4k | 31.37 | 52.2 66% | 47.25 51% | 51.5 64% | 20.3 -35% |
| Write 4k | 65.7 | 153.1 133% | 110.7 68% | 144 119% | 42.51 -35% |
| Read 4k QD32 | 425 | 627 48% | 584 37% | 694 63% | 251.6 -41% |
| Write 4k QD32 | 441.8 | 527 19% | 463.3 5% | 422.1 -4% | 167.1 -62% |

| 3DMark | |
| 1920x1080 Fire Strike Graphics | |
| MSI GT73VR 6RF | |
| Nvidia GeForce GTX 1080 Founders Edition | |
| Eurocom X8 | |
| MSI GT73VR-6RE16SR451 | |
| Asus G701VO-CS74K | |
| MSI GT72VR 6RD-063US | |
| Asus Strix GL502VY-DS71 | |
| 3840x2160 Fire Strike Ultra Graphics | |
| MSI GT73VR 6RF | |
| Nvidia GeForce GTX 1080 Founders Edition | |
| MSI GT73VR-6RE16SR451 | |
| Asus G701VO-CS74K | |
| MSI GT72VR 6RD-063US | |
| Asus Strix GL502VY-DS71 | |
| Fire Strike Extreme Graphics | |
| MSI GT73VR 6RF | |
| Nvidia GeForce GTX 1080 Founders Edition | |
| Eurocom X8 | |
| Asus G701VO-CS74K | |
| MSI GT72VR 6RD-063US | |
| Asus Strix GL502VY-DS71 | |
| 3DMark 11 | |
| 1280x720 Performance GPU | |
| Nvidia GeForce GTX 1080 Founders Edition | |
| MSI GT73VR 6RF | |
| MSI GT73VR-6RE16SR451 | |
| Eurocom X8 | |
| Asus G701VO-CS74K | |
| MSI GT72VR 6RD-063US | |
| Asus Strix GL502VY-DS71 | |
| 1280x720 Performance Combined | |
| Nvidia GeForce GTX 1080 Founders Edition | |
| MSI GT73VR-6RE16SR451 | |
| Asus G701VO-CS74K | |
| MSI GT73VR 6RF | |
| Eurocom X8 | |
| Asus Strix GL502VY-DS71 | |
| MSI GT72VR 6RD-063US | |
| 3DMark 11 Performance | 18087 pontok | |
| 3DMark Ice Storm Standard Score | 124187 pontok | |
| 3DMark Cloud Gate Standard Score | 24487 pontok | |
| 3DMark Fire Strike Score | 14820 pontok | |
| 3DMark Fire Strike Extreme Score | 9042 pontok | |
Segítség | ||
| Fallout 4 - 3840x2160 High Preset AA:T AF:16x | |
| Nvidia GeForce GTX 1080 Founders Edition | |
| MSI GT73VR 6RF | |
| Nvidia GeForce GTX 1070 Founders Edition | |
| Nvidia GeForce GTX 1060 Founders Edition 6 GB | |
| Batman: Arkham Knight - 3840x2160 High / On (Interactive Smoke & Paper Debris Off) AA:SM AF:8x | |
| MSI GT73VR 6RF | |
| Nvidia GeForce GTX 1060 Founders Edition 6 GB | |
| Rise of the Tomb Raider - 3840x2160 High Preset AA:FX AF:4x | |
| Nvidia GeForce GTX 1080 Founders Edition | |
| Nvidia GeForce GTX 1080 Founders Edition | |
| MSI GT73VR 6RF | |
| Nvidia GeForce GTX 1070 Founders Edition | |
| Nvidia GeForce GTX 1060 Founders Edition 6 GB | |
| Nvidia GeForce GTX 1060 Founders Edition 6 GB | |
| Doom - 3840x2160 High Preset AA:FX | |
| MSI GT73VR 6RF | |
| Nvidia GeForce GTX 1080 Founders Edition | |
| Nvidia GeForce GTX 1070 Founders Edition | |
| Nvidia GeForce GTX 1060 Founders Edition 6 GB | |
| Overwatch - 3840x2160 High (Render Scale 100 %) AA:SM AF:4x | |
| Nvidia GeForce GTX 1080 Founders Edition | |
| MSI GT73VR 6RF | |
| Nvidia GeForce GTX 1070 Founders Edition | |
| Nvidia GeForce GTX 1060 Founders Edition 6 GB | |
| Mafia 3 - 3840x2160 High Preset | |
| Nvidia GeForce GTX 1080 Founders Edition | |
| alacsony | közepes | magas | ultra | 4K | |
| Batman: Arkham Knight (2015) | 52 | ||||
| Metal Gear Solid V (2015) | 60 | ||||
| Fallout 4 (2015) | 51.7 | ||||
| Rise of the Tomb Raider (2016) | 49.8 | ||||
| Doom (2016) | 64.1 | ||||
| Overwatch (2016) | 103.1 | ||||
| Mafia 3 (2016) | 73.6 |
Zajszint
| Üresjárat |
| 32 / 32 / 35 dB(A) |
| Terhelés |
| 50 / 64 dB(A) |
 | ||
30 dB csendes 40 dB(A) hallható 50 dB(A) hangos |
||
min: | ||
| MSI GT73VR 6RF GeForce GTX 1080 Mobile, 6820HK, 2x SanDisk X400 1TB M.2 SD8SN8U1T001122 (RAID 0) | MSI GT73VR-6RE16SR451 GeForce GTX 1070 Mobile, 6820HK, 2x Samsung SM951 MZVPV256HDGL (RAID 0) | Acer Predator 17 G9-793-77LG GeForce GTX 1070 Mobile, 6700HQ, Toshiba NVMe THNSN5256GPU7 | Asus G701VO-CS74K GeForce GTX 980 (Laptop), 6820HK, 2x Samsung SM951 MZVPV512HDGL (RAID 0) | MSI GS73VR 6RF GeForce GTX 1060 Mobile, 6700HQ, SanDisk SD8SN8U1T001122 | |
|---|---|---|---|---|---|
| Noise | 8% | 1% | 9% | 6% | |
| off / környezet * | 29.2 | 30 -3% | 31 -6% | 29.1 -0% | 28.4 3% |
| Idle Minimum * | 32 | 32 -0% | 33 -3% | 29.1 9% | 31.9 -0% |
| Idle Average * | 32 | 33 -3% | 34 -6% | 31.9 -0% | 32 -0% |
| Idle Maximum * | 35 | 35 -0% | 40 -14% | 31.9 9% | 34 3% |
| Load Average * | 50 | 35 30% | 44 12% | 46 8% | 47 6% |
| Load Maximum * | 64 | 49 23% | 50 22% | 47.5 26% | 49.4 23% |
* ... a kisebb jobb
(±) The maximum temperature on the upper side is 41.4 °C / 107 F, compared to the average of 40.4 °C / 105 F, ranging from 21.2 to 68.8 °C for the class Gaming.
(-) The bottom heats up to a maximum of 59 °C / 138 F, compared to the average of 43.2 °C / 110 F
(+) In idle usage, the average temperature for the upper side is 26.8 °C / 80 F, compared to the device average of 33.8 °C / 93 F.
(+) The palmrests and touchpad are cooler than skin temperature with a maximum of 30.4 °C / 86.7 F and are therefore cool to the touch.
(±) The average temperature of the palmrest area of similar devices was 28.9 °C / 84 F (-1.5 °C / -2.7 F).
MSI GT73VR 6RF audio analysis
(±) | speaker loudness is average but good (79.1 dB)
Bass 100 - 315 Hz
(±) | reduced bass - on average 8.2% lower than median
(±) | linearity of bass is average (8% delta to prev. frequency)
Mids 400 - 2000 Hz
(+) | balanced mids - only 3.3% away from median
(+) | mids are linear (6.4% delta to prev. frequency)
Highs 2 - 16 kHz
(+) | balanced highs - only 4.6% away from median
(±) | linearity of highs is average (9.9% delta to prev. frequency)
Összességében 100 - 16.000 Hz
(±) | linearity of overall sound is average (19.9% difference to median)
Ugyanazon osztályhoz képest
» 67% of all tested devices in this class were better, 6% similar, 27% worse
» The best had a delta of 6%, average was 18%, worst was 132%
Az összes tesztelt eszközzel összehasonlítva
» 46% of all tested devices were better, 7% similar, 47% worse
» The best had a delta of 4%, average was 25%, worst was 134%
Apple MacBook 12 (Early 2016) 1.1 GHz audio analysis
(+) | speakers can play relatively loud (83.6 dB)
Bass 100 - 315 Hz
(±) | reduced bass - on average 11.3% lower than median
(±) | linearity of bass is average (14.2% delta to prev. frequency)
Mids 400 - 2000 Hz
(+) | balanced mids - only 2.4% away from median
(+) | mids are linear (5.5% delta to prev. frequency)
Highs 2 - 16 kHz
(+) | balanced highs - only 2% away from median
(+) | highs are linear (4.5% delta to prev. frequency)
Összességében 100 - 16.000 Hz
(+) | overall sound is linear (10.2% difference to median)
Ugyanazon osztályhoz képest
» 5% of all tested devices in this class were better, 2% similar, 93% worse
» The best had a delta of 5%, average was 19%, worst was 53%
Az összes tesztelt eszközzel összehasonlítva
» 3% of all tested devices were better, 1% similar, 96% worse
» The best had a delta of 4%, average was 25%, worst was 134%
| Kikapcsolt állapot / Készenlét | |
| Üresjárat | |
| Terhelés |
|
| MSI GT73VR 6RF 6820HK, GeForce GTX 1080 Mobile, 2x SanDisk X400 1TB M.2 SD8SN8U1T001122 (RAID 0), IPS, 3840x2160, 17.30 | MSI GT73VR-6RE16SR451 6820HK, GeForce GTX 1070 Mobile, 2x Samsung SM951 MZVPV256HDGL (RAID 0), TN, 1920x1080, 17.30 | Acer Predator 17 G9-793-77LG 6700HQ, GeForce GTX 1070 Mobile, Toshiba NVMe THNSN5256GPU7, IPS, 3840x2160, 17.30 | Asus G701VO-CS74K 6820HK, GeForce GTX 980 (Laptop), 2x Samsung SM951 MZVPV512HDGL (RAID 0), IPS, 1920x1080, 17.30 | MSI GS73VR 6RF 6700HQ, GeForce GTX 1060 Mobile, SanDisk SD8SN8U1T001122, TN LED, 1920x1080, 17.30 | |
|---|---|---|---|---|---|
| Power Consumption | 8% | 8% | 14% | 22% | |
| Idle Minimum * | 28.9 | 31 -7% | 25 13% | 28.2 2% | 22.6 22% |
| Idle Average * | 30.6 | 35 -14% | 35 -14% | 32 -5% | 32.7 -7% |
| Idle Maximum * | 33.1 | 40 -21% | 46 -39% | 32.6 2% | 32.8 1% |
| Load Average * | 224.4 | 106 53% | 103 54% | 162.2 28% | 114.7 49% |
| Load Maximum * | 302.6 | 218 28% | 223 26% | 173.5 43% | 167.9 45% |
* ... a kisebb jobb
| MSI GT73VR 6RF 6820HK, GeForce GTX 1080 Mobile, 75.2 Wh | MSI GT73VR-6RE16SR451 6820HK, GeForce GTX 1070 Mobile, 75.2 Wh | Acer Predator 17 G9-793-77LG 6700HQ, GeForce GTX 1070 Mobile, 88 Wh | Asus G701VO-CS74K 6820HK, GeForce GTX 980 (Laptop), 93 Wh | MSI GS73VR 6RF 6700HQ, GeForce GTX 1060 Mobile, 65 Wh | |
|---|---|---|---|---|---|
| Akkumulátor üzemidő | 3% | 10% | 6% | 8% | |
| Reader / Idle | 306 | 290 -5% | 278 -9% | 242 -21% | 353 15% |
| WiFi v1.3 | 198 | 206 4% | 200 1% | 202 2% | 213 8% |
| Load | 65 | 72 11% | 89 37% | 89 37% | 66 2% |
Pro
Kontra

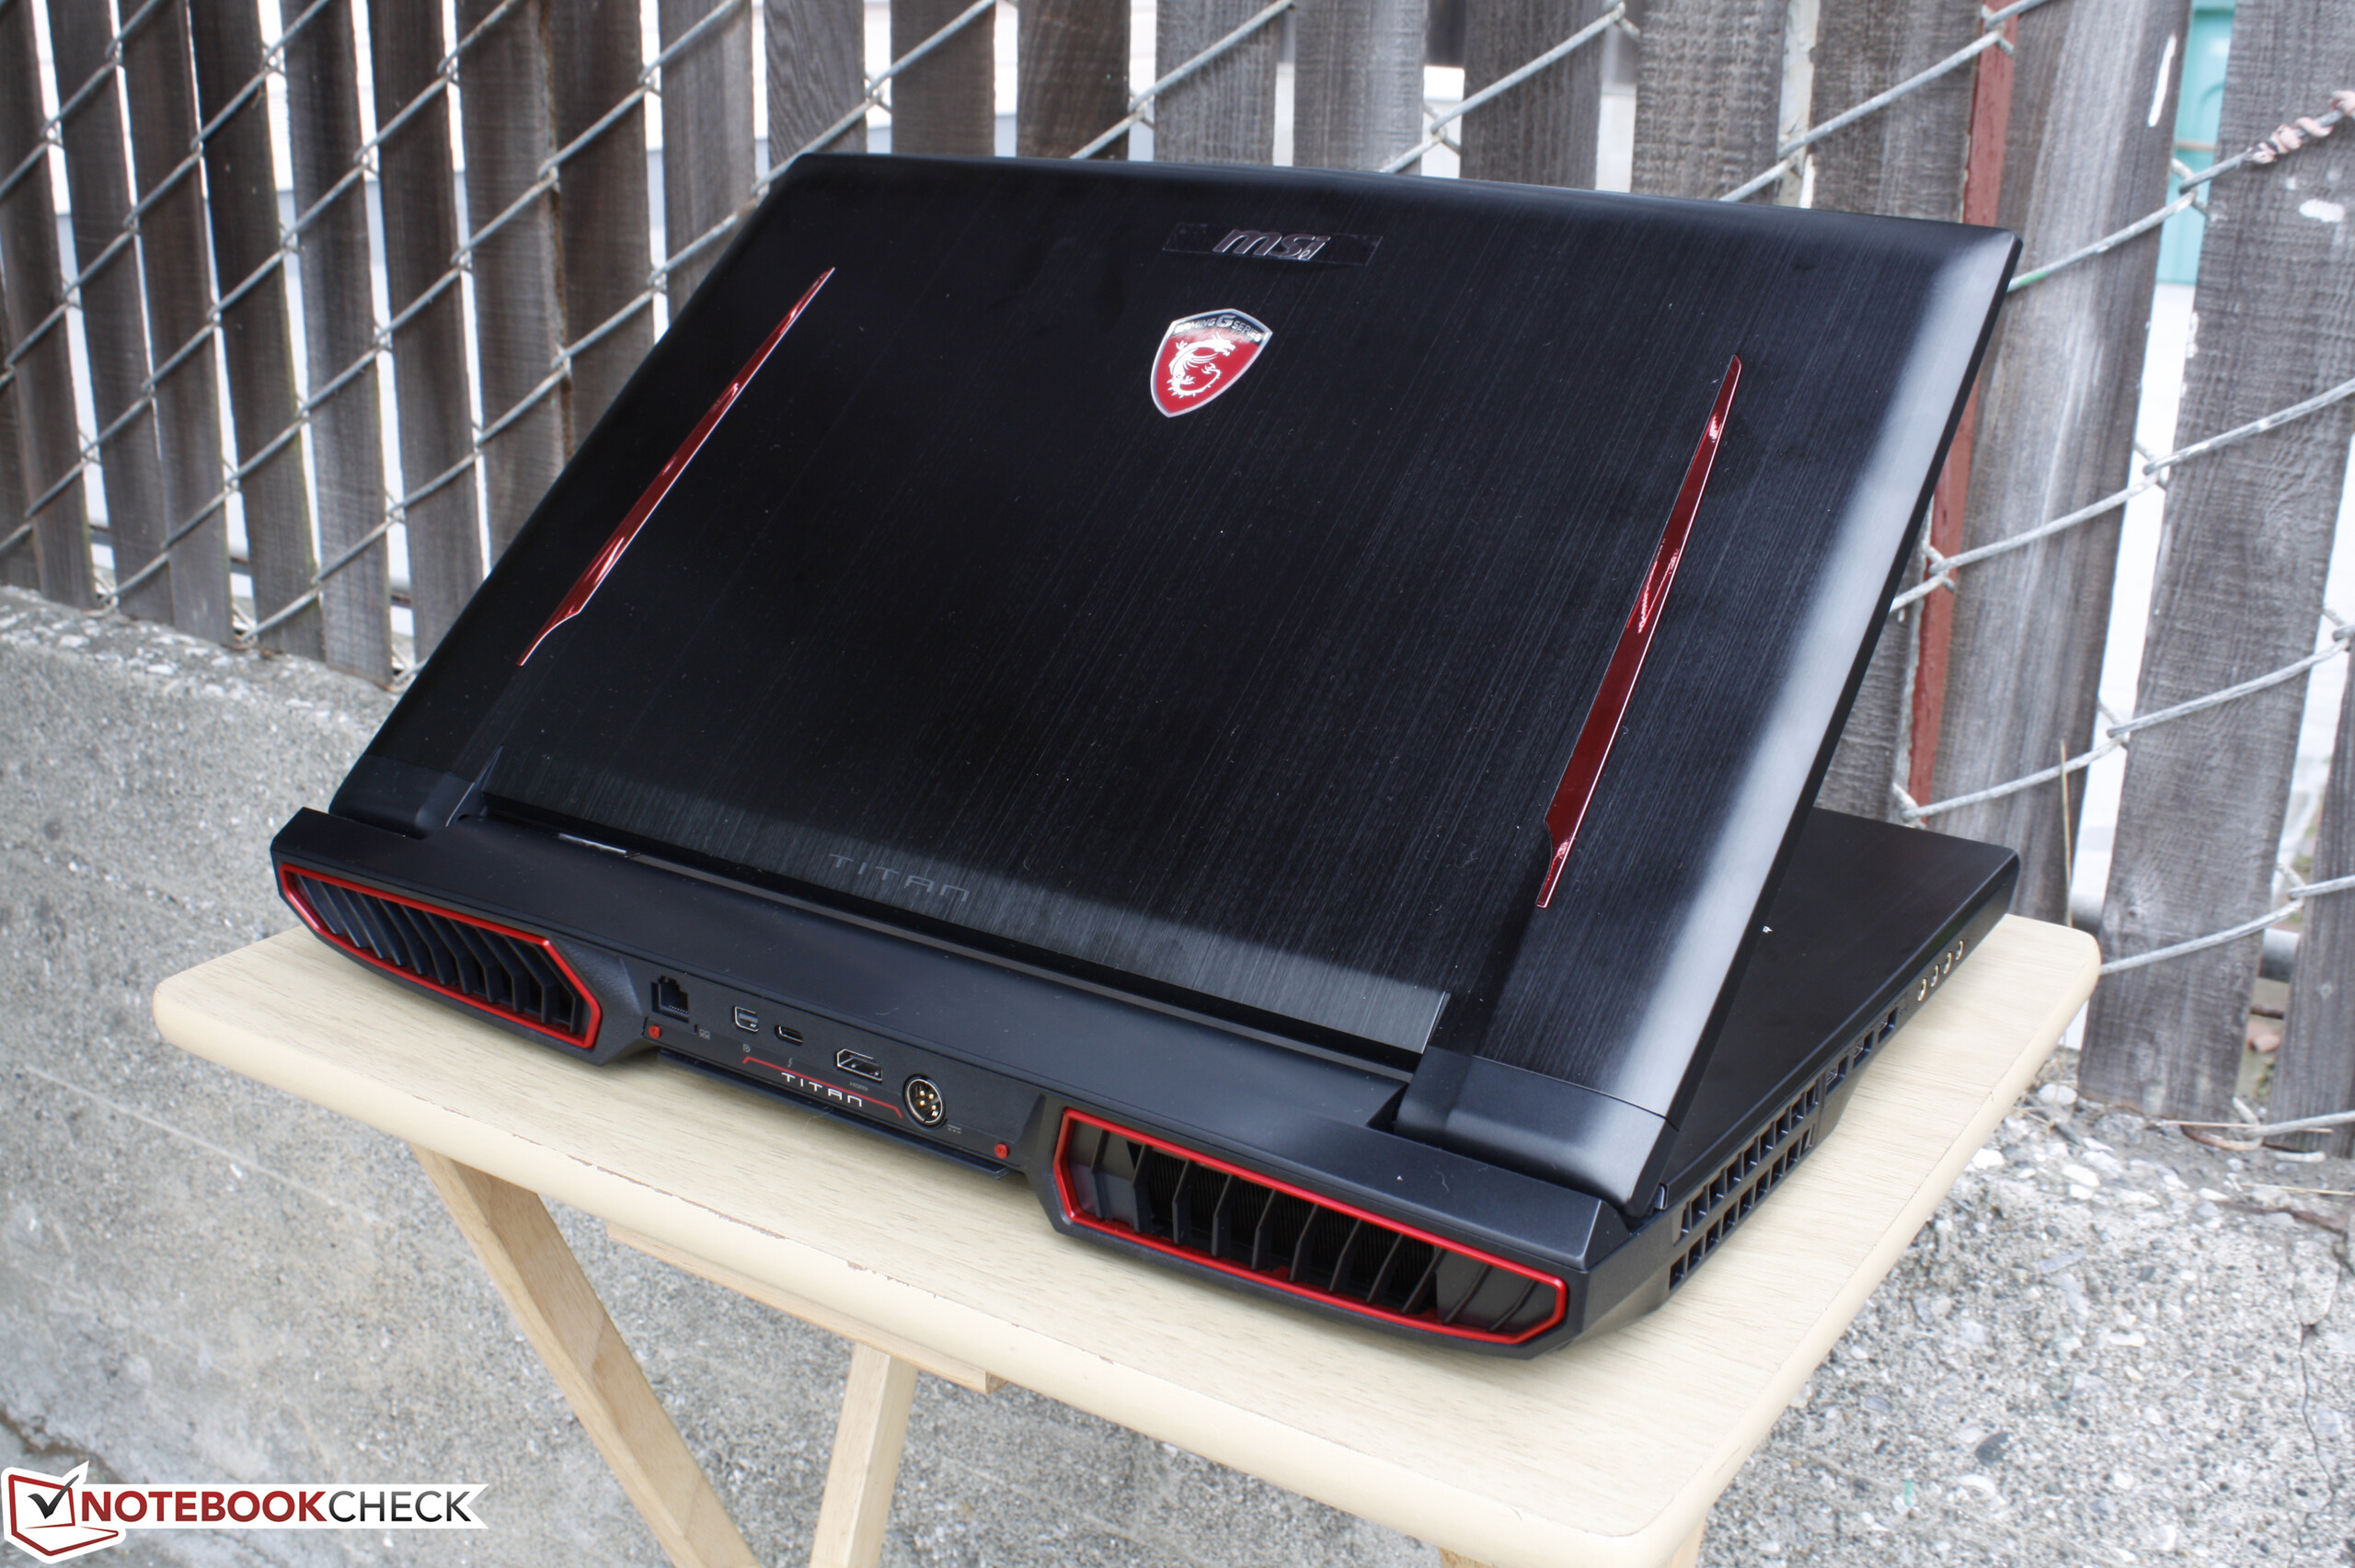
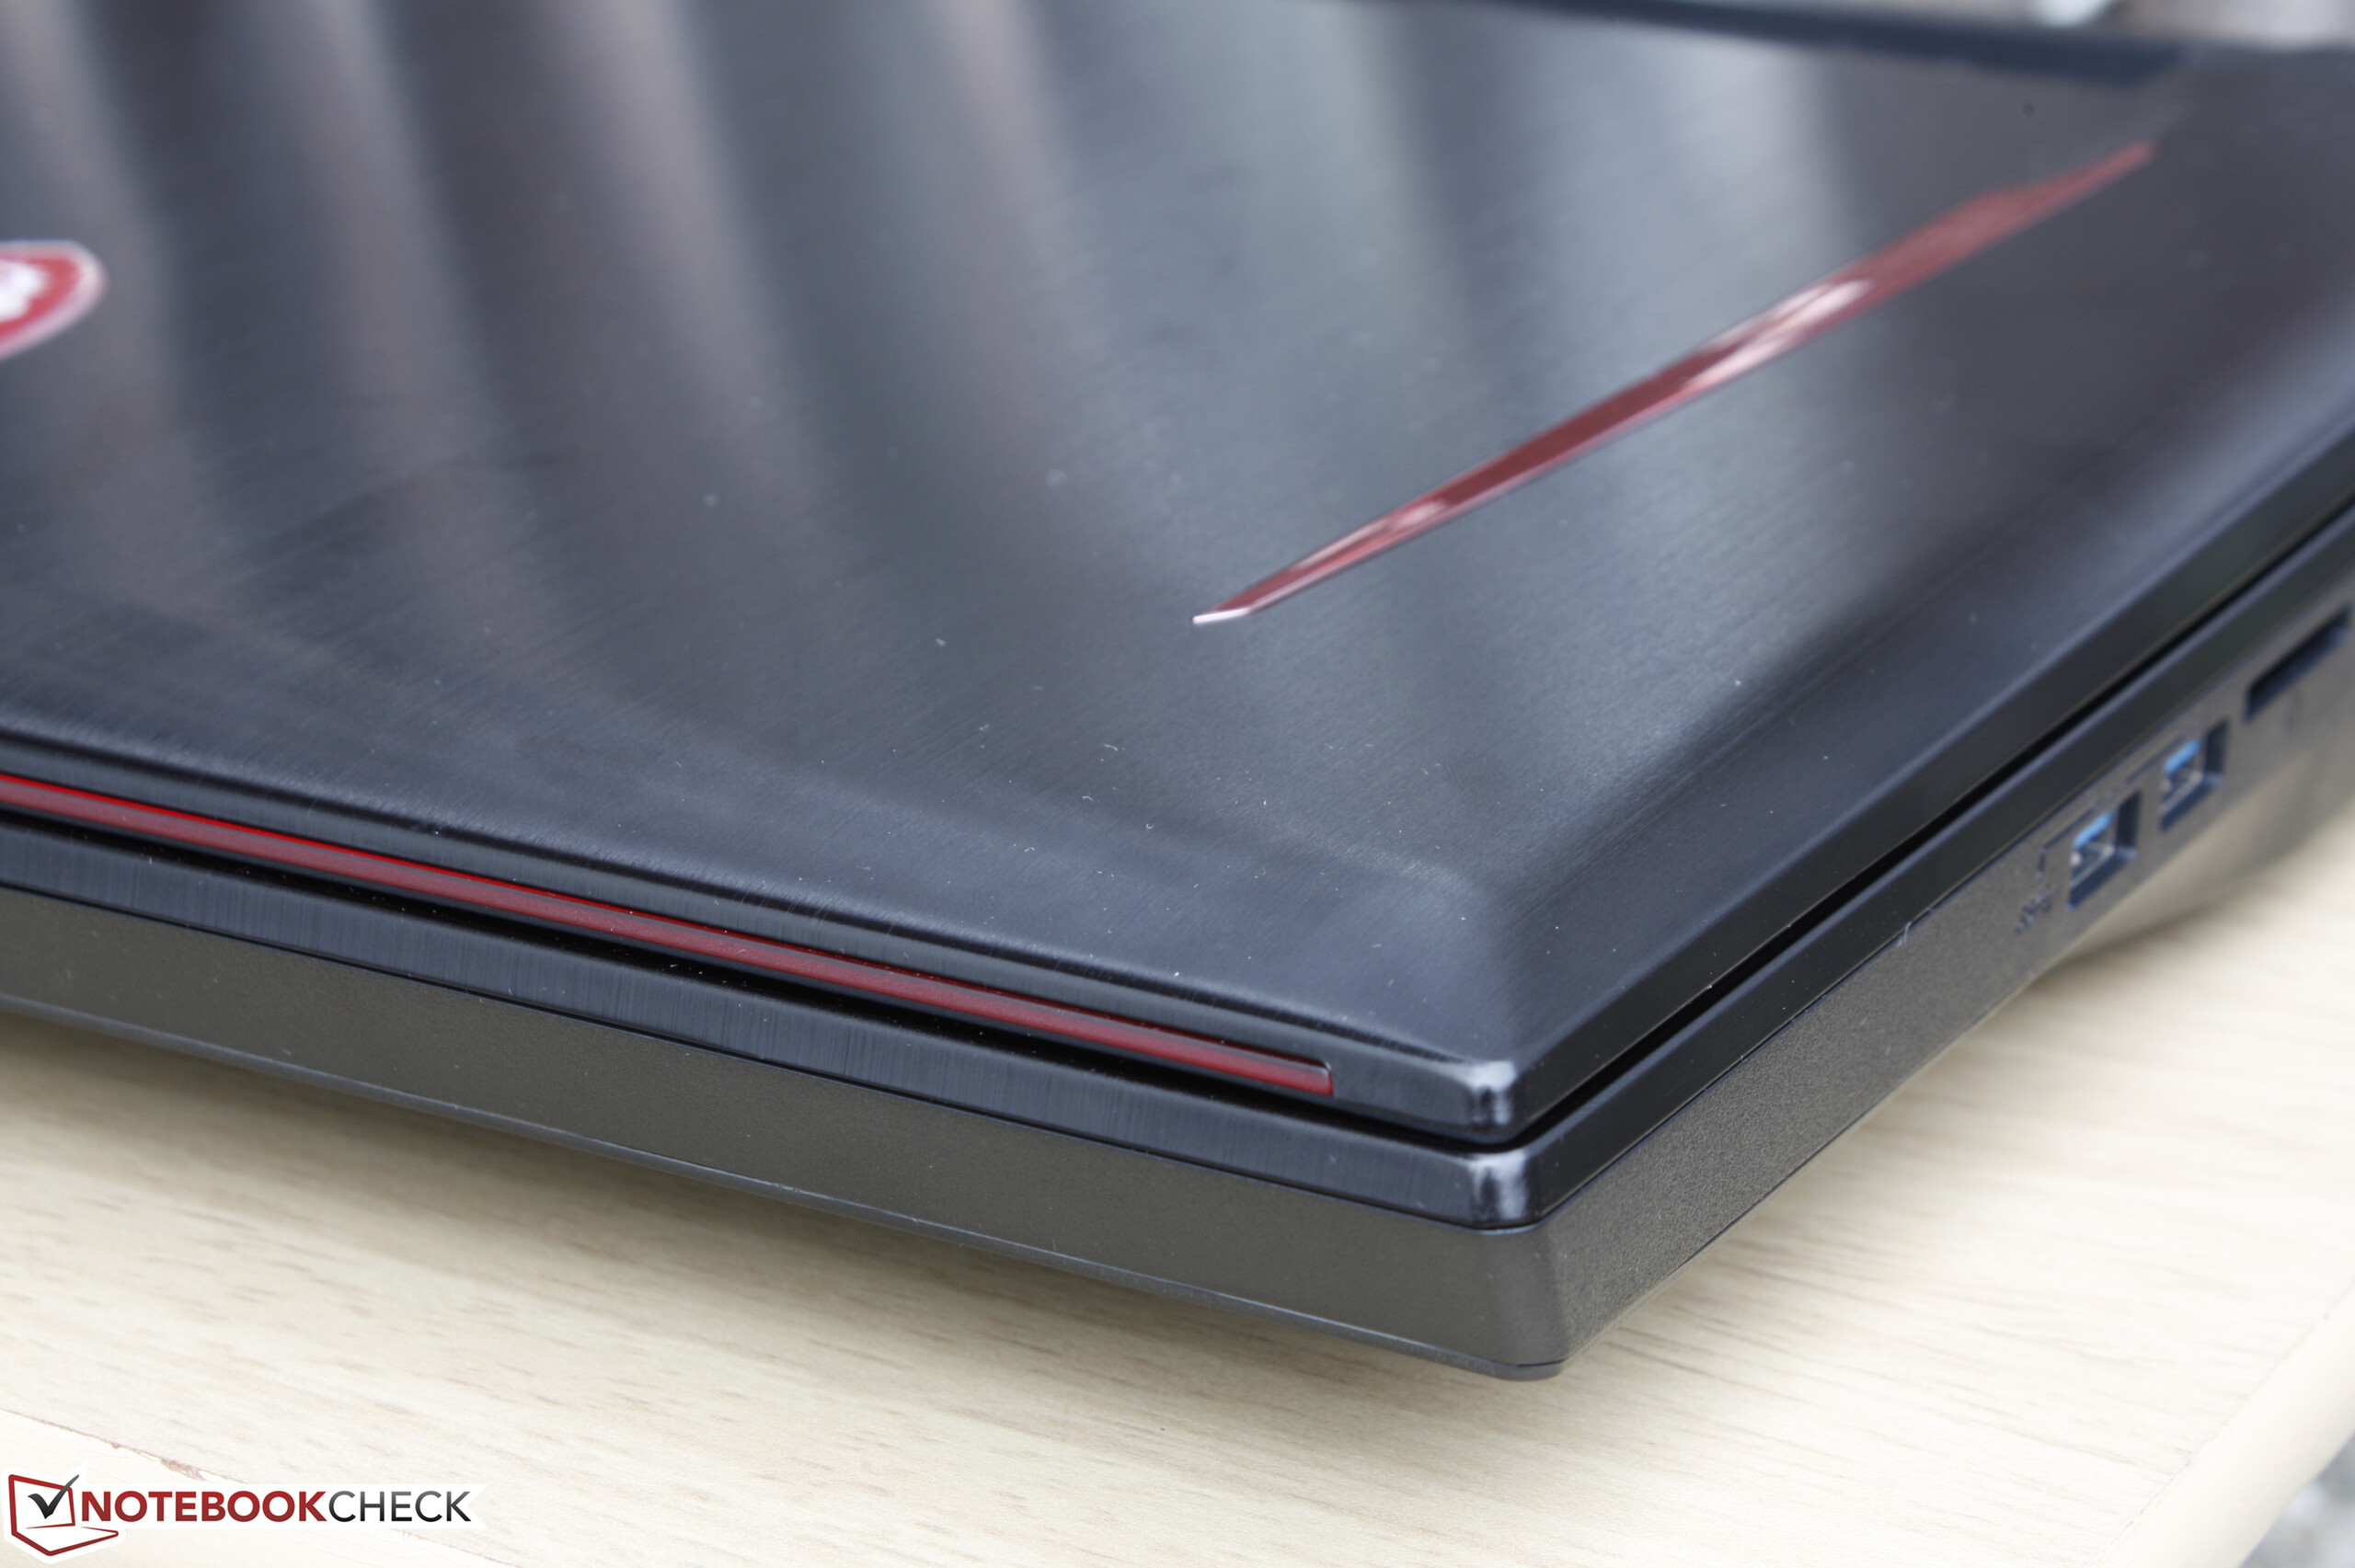
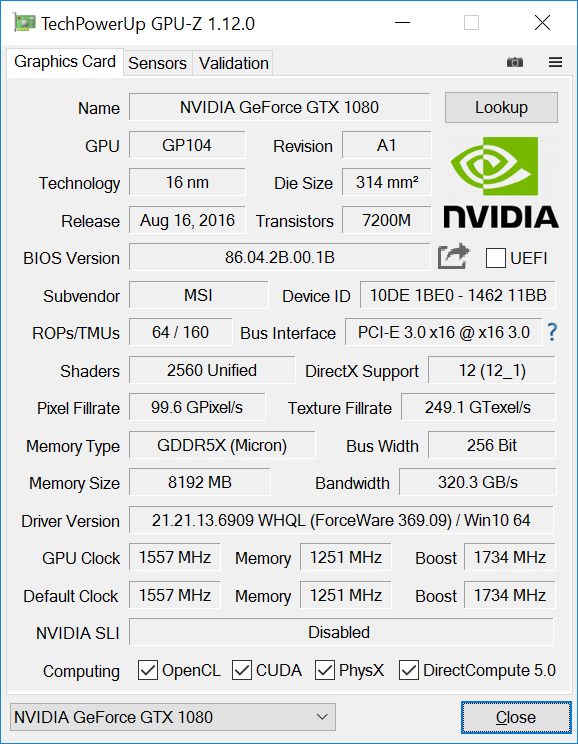
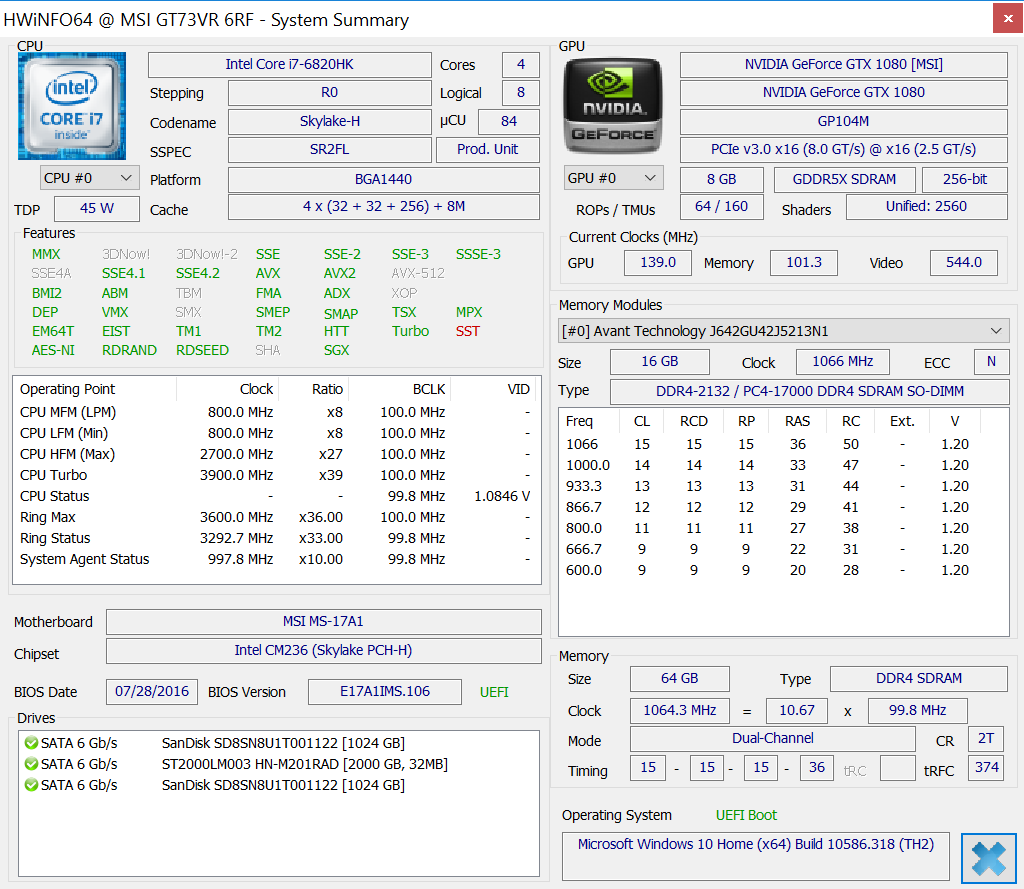
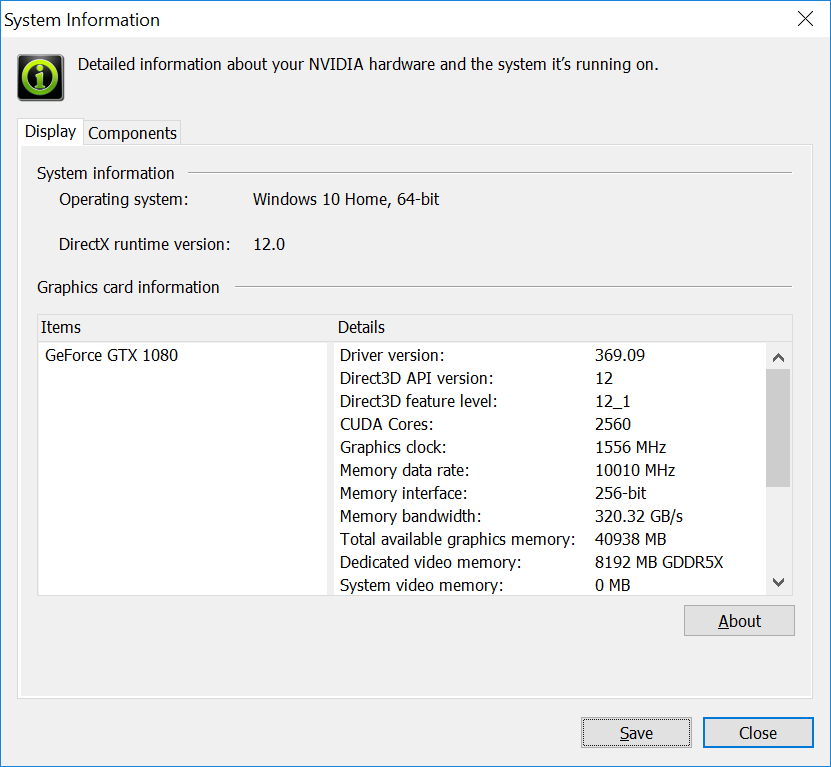
A 4K UHD kijelző, és a GTX 1080 GPU kombinációja az "ultimate" egy GPU-s konfiguráció a GT73VR szériánál. A teljesítménye hihetetlen, rengeteget tud, de az olcsóbb FHD-s, GTX 1070 SKU-s konfigurációhoz képest vannak olyan hátrányai, amelyek mellett nem mehetünk el szó nélkül.
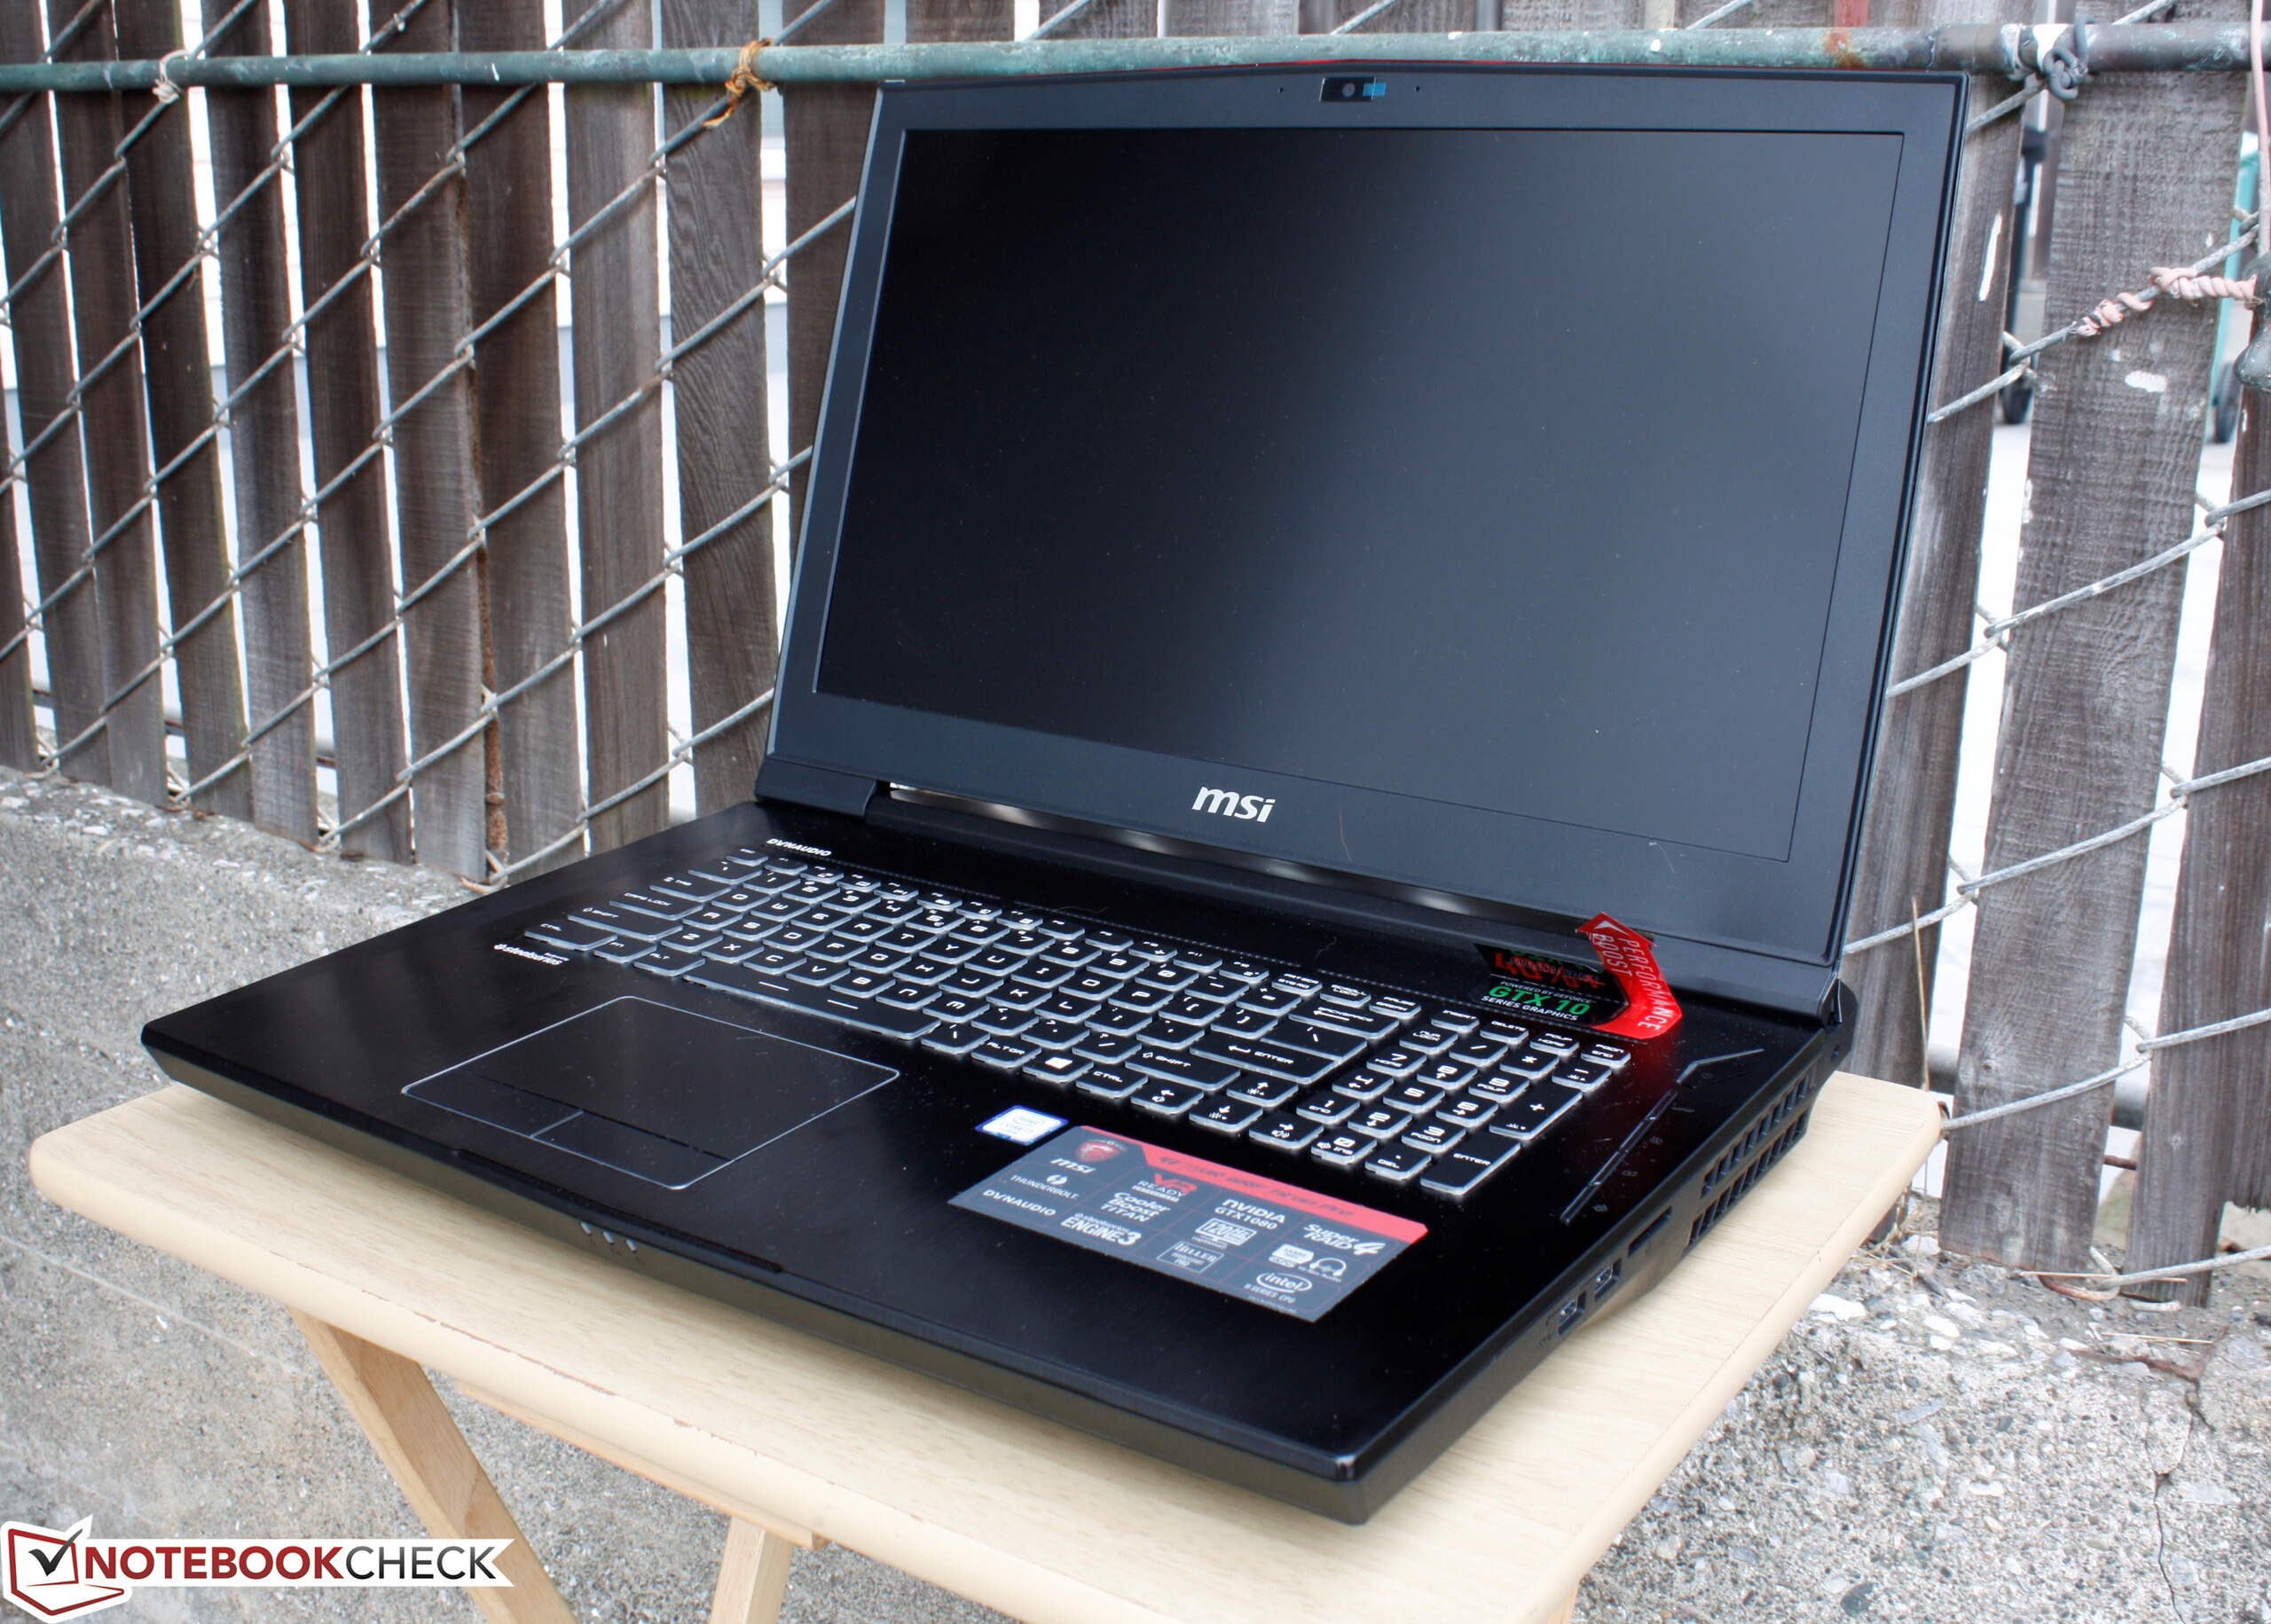
Először is, a 4K UHD kijelzőt 60 Hz-re limitálták, és szellemképesebb mint a 120 Hz/5 ms FHD-s változat. A kontraszt és a színskálája is rosszabb az FHD panelnél. Másodszor, a GTX 1080 GPU észre vehetően jobban melegszik és zajosabban működik a GTX 1070-nél, tehát a megnövelt grafikus teljesítménynek nem csak pénzben mérhető ára van.
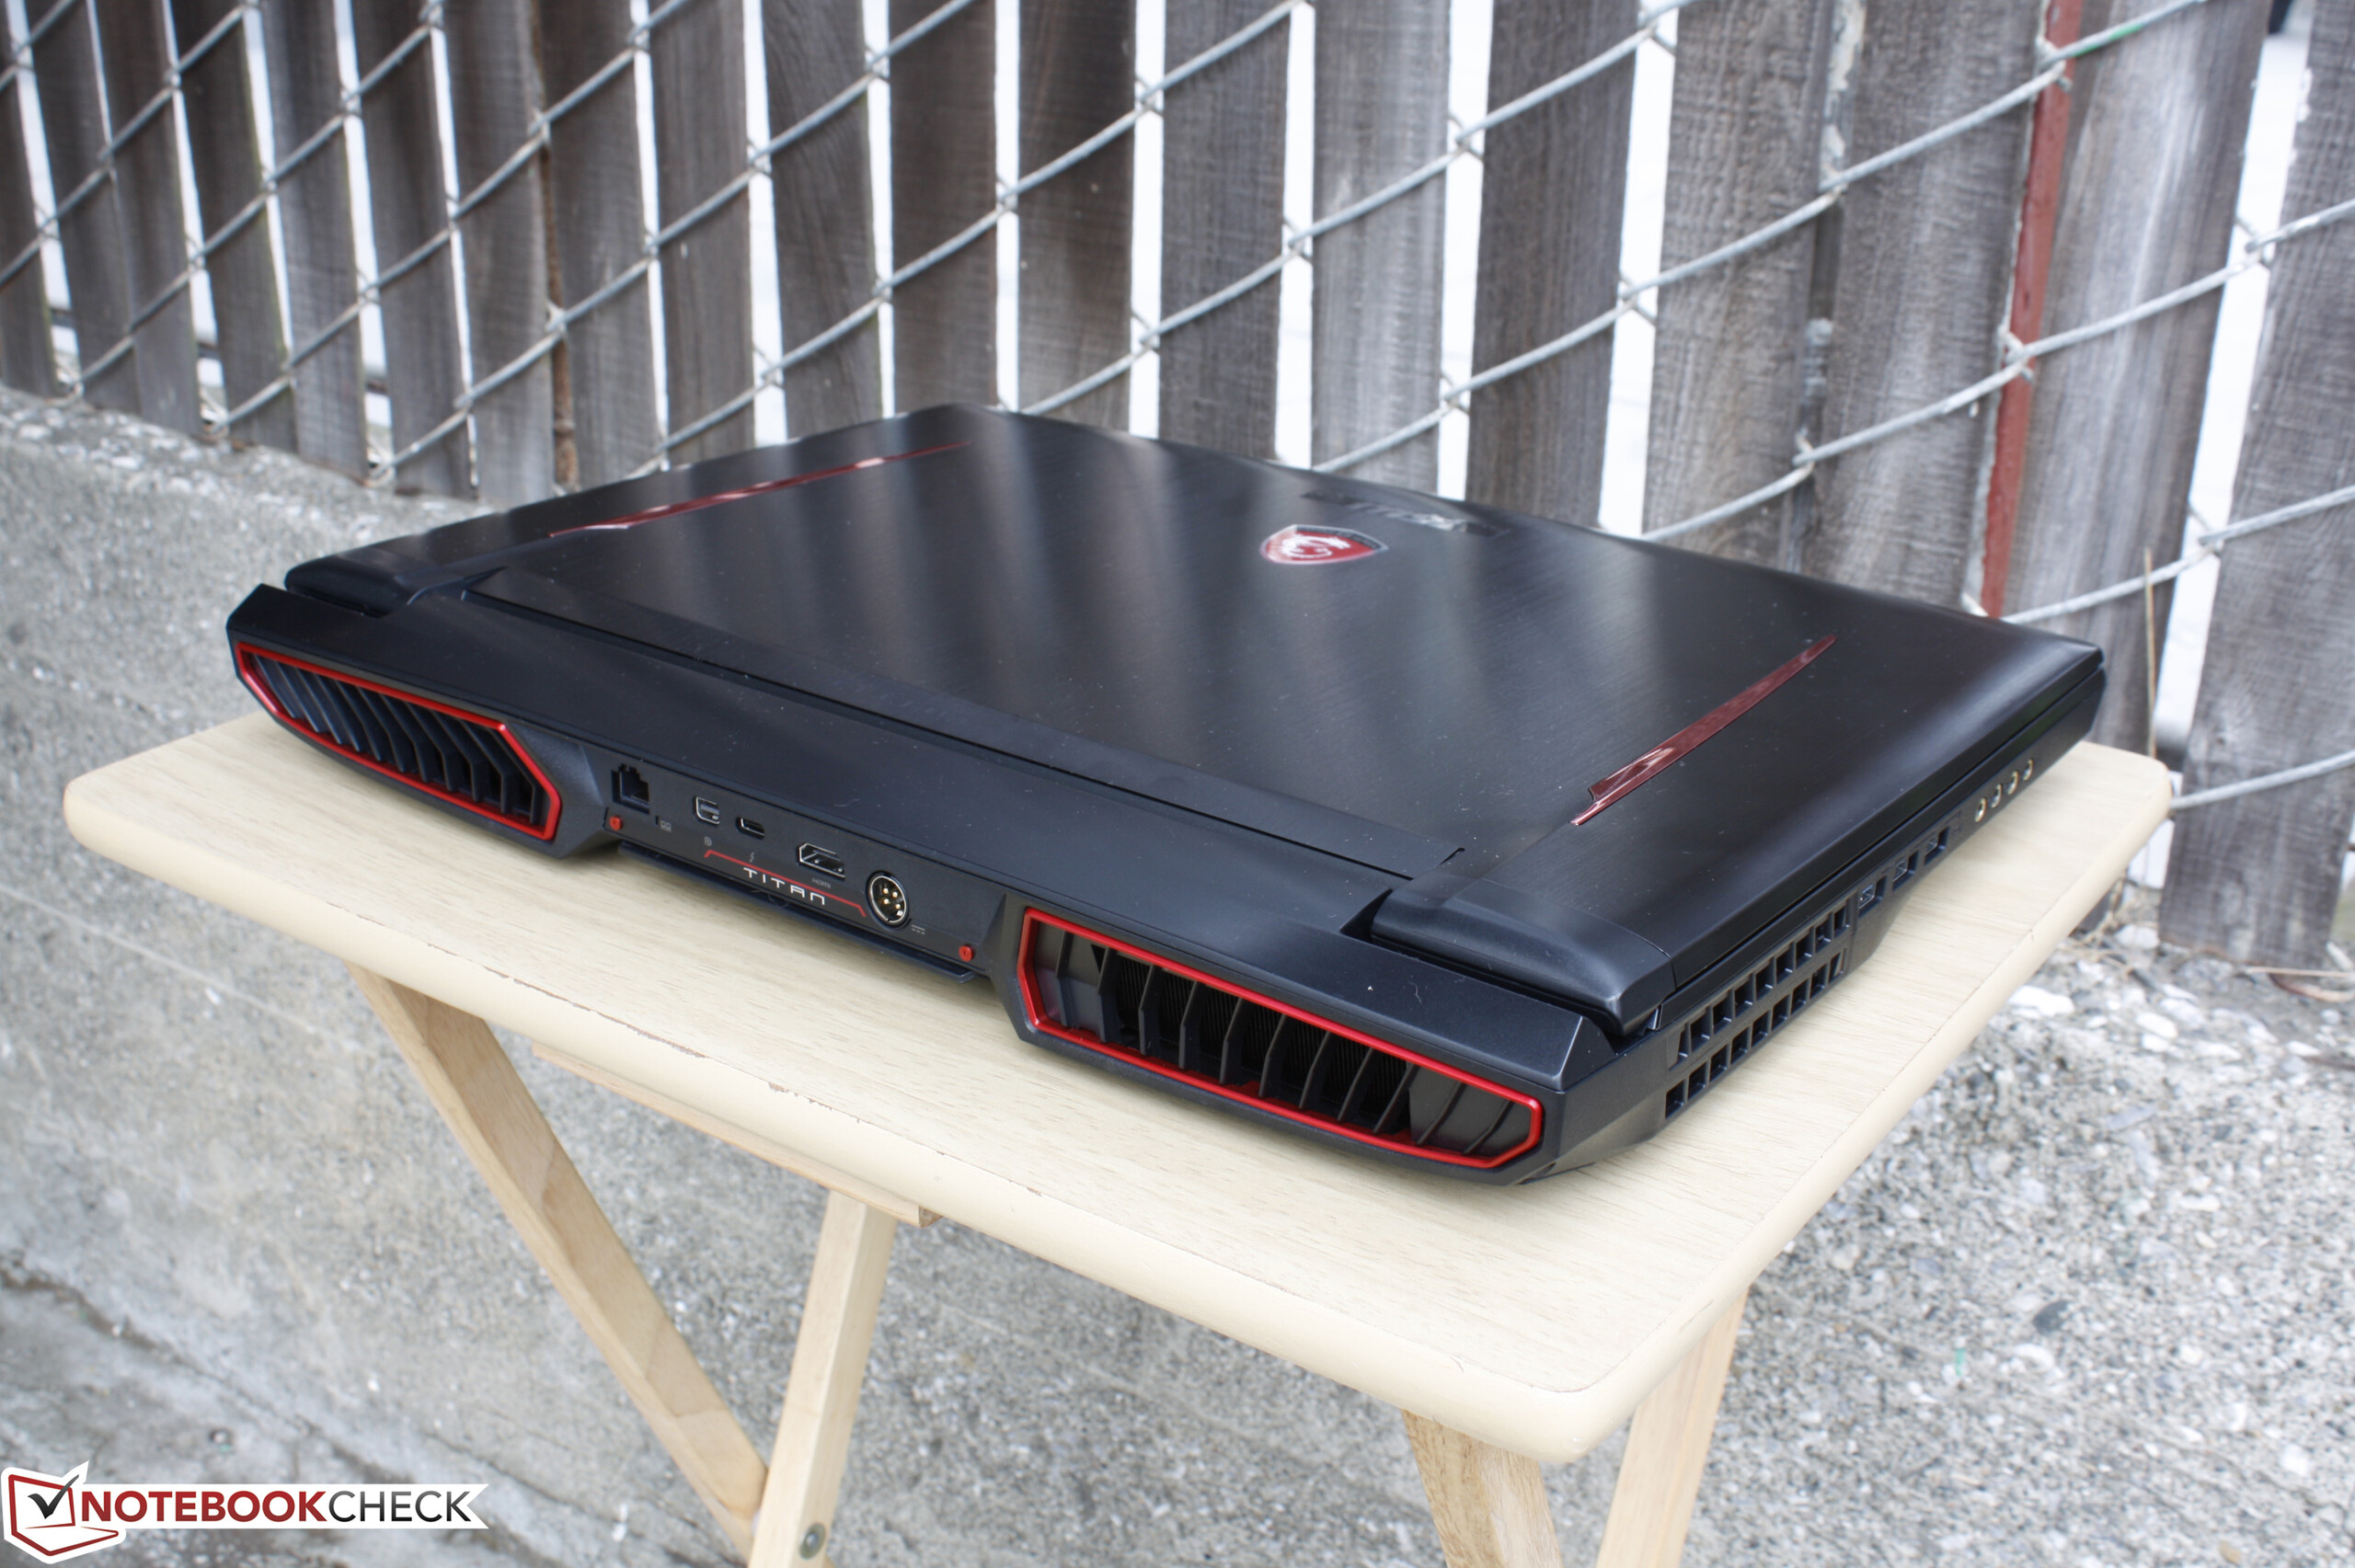
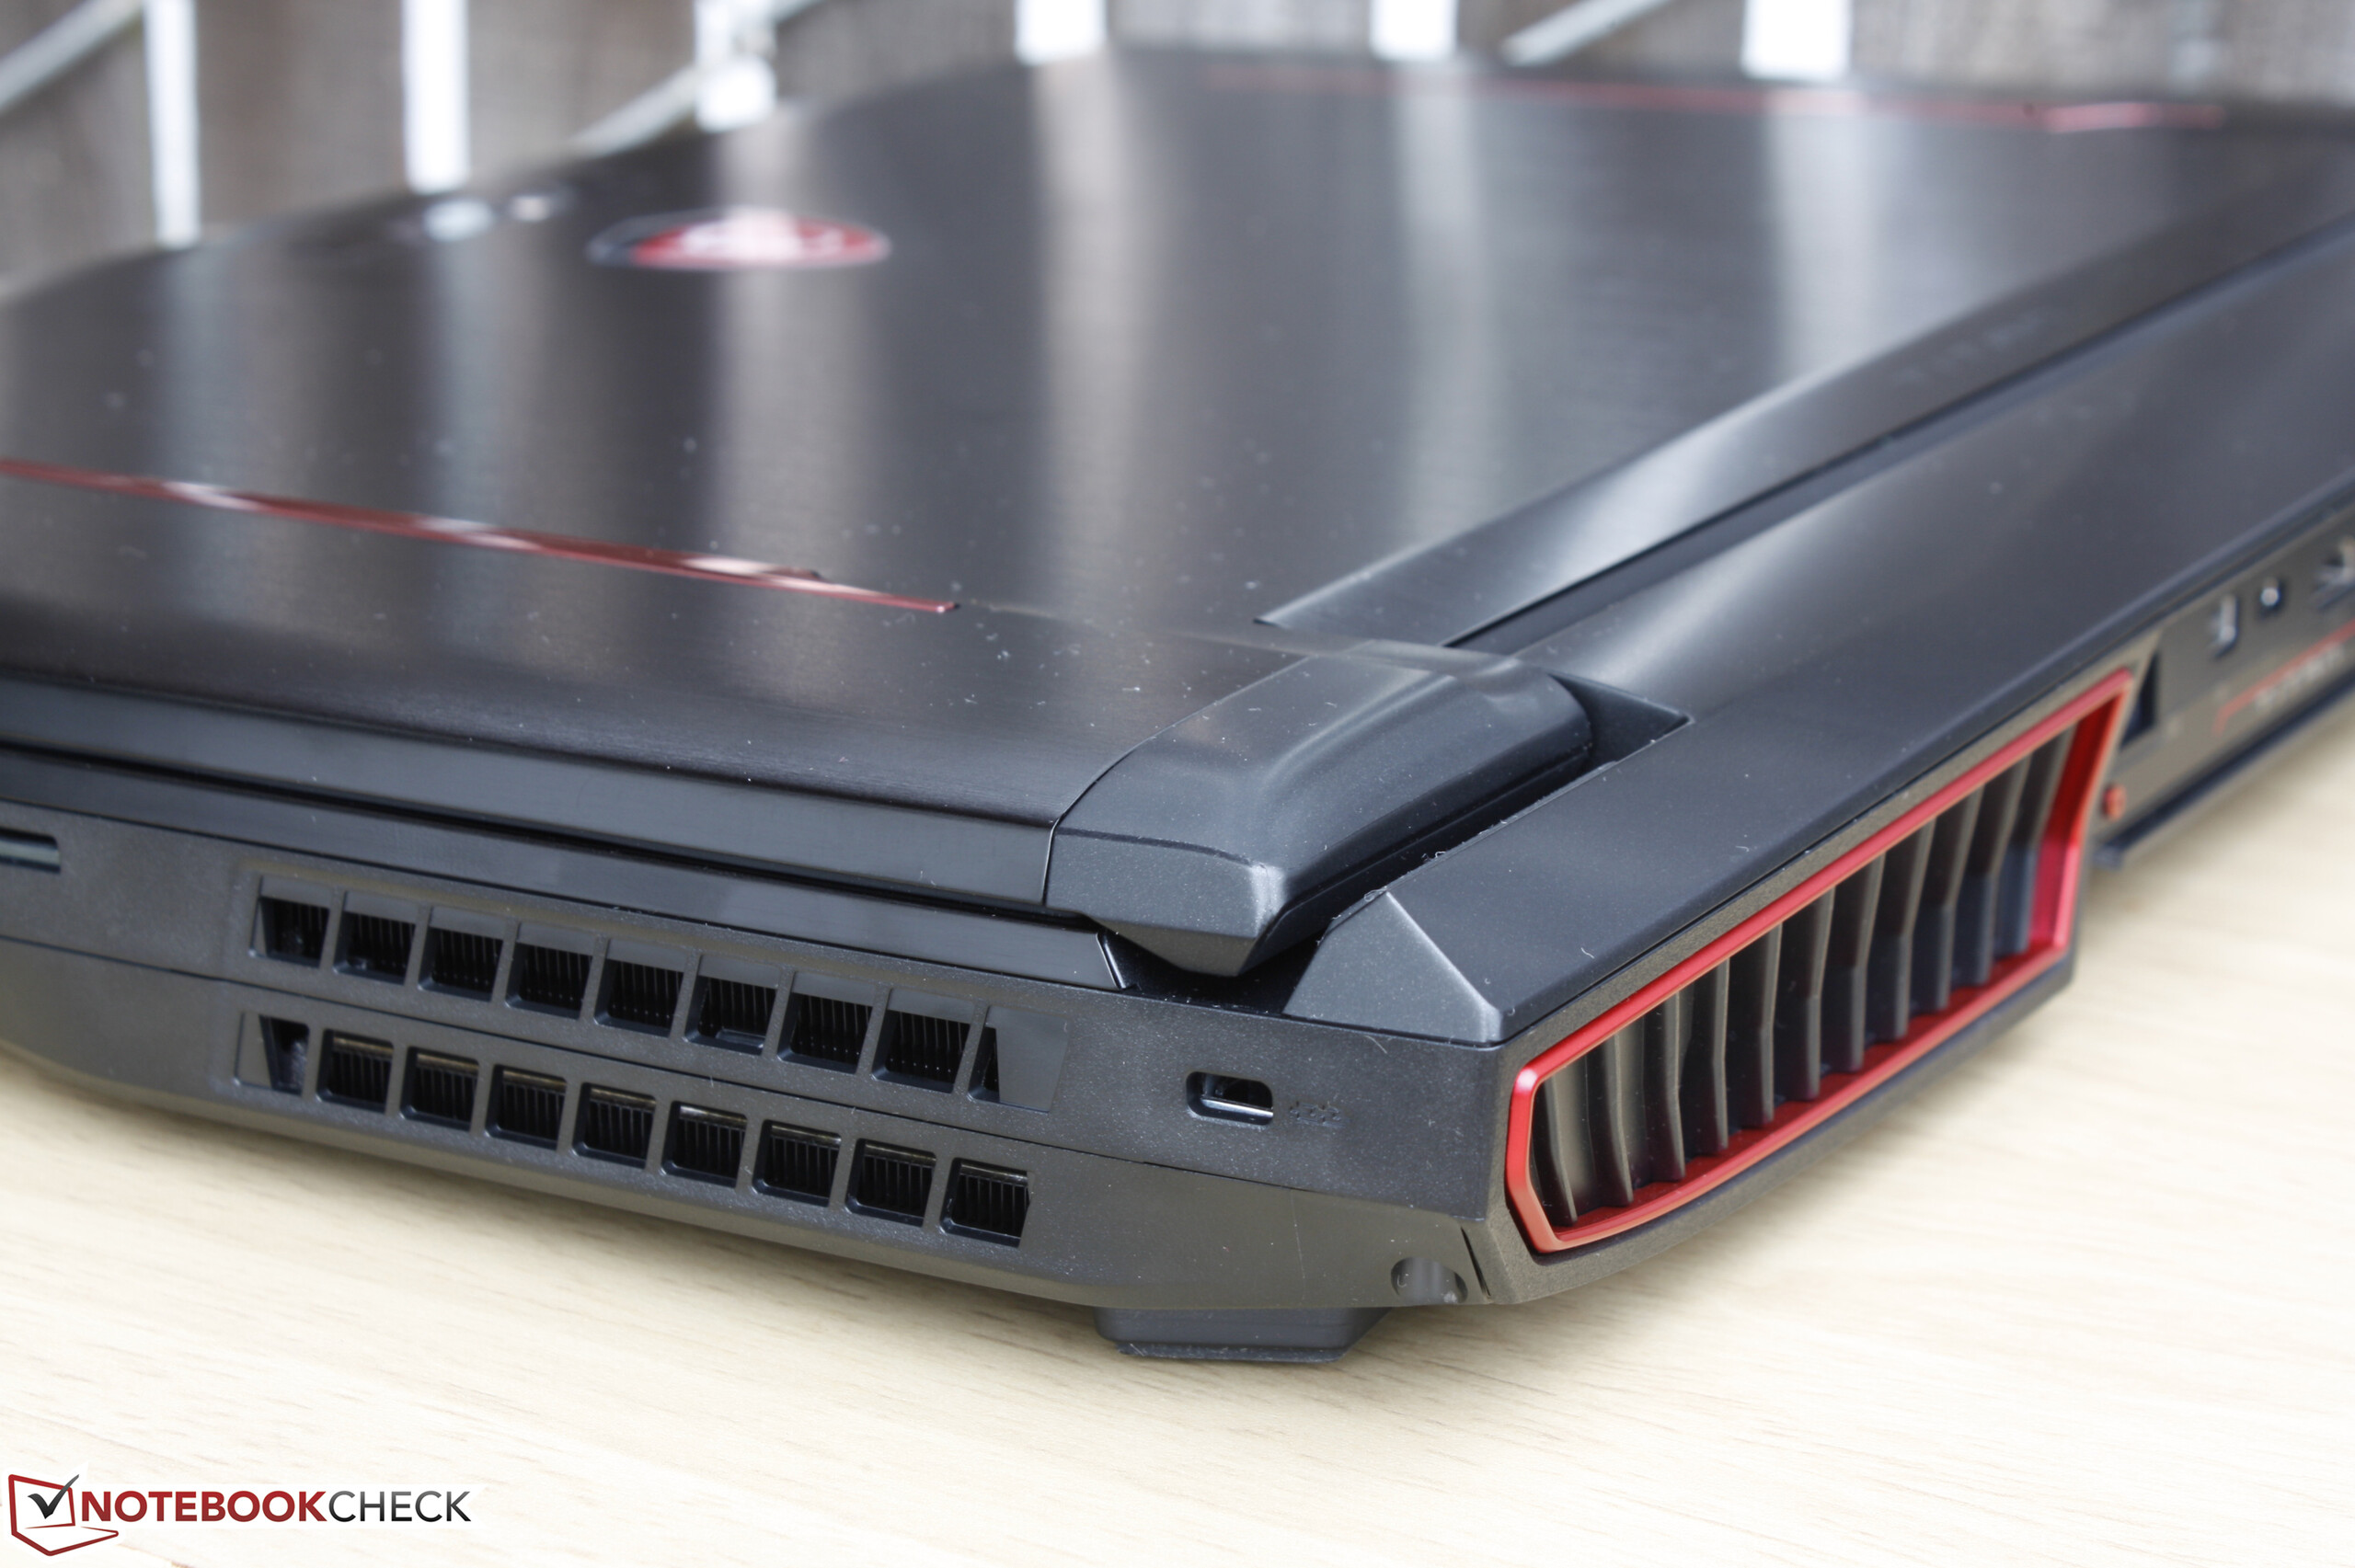
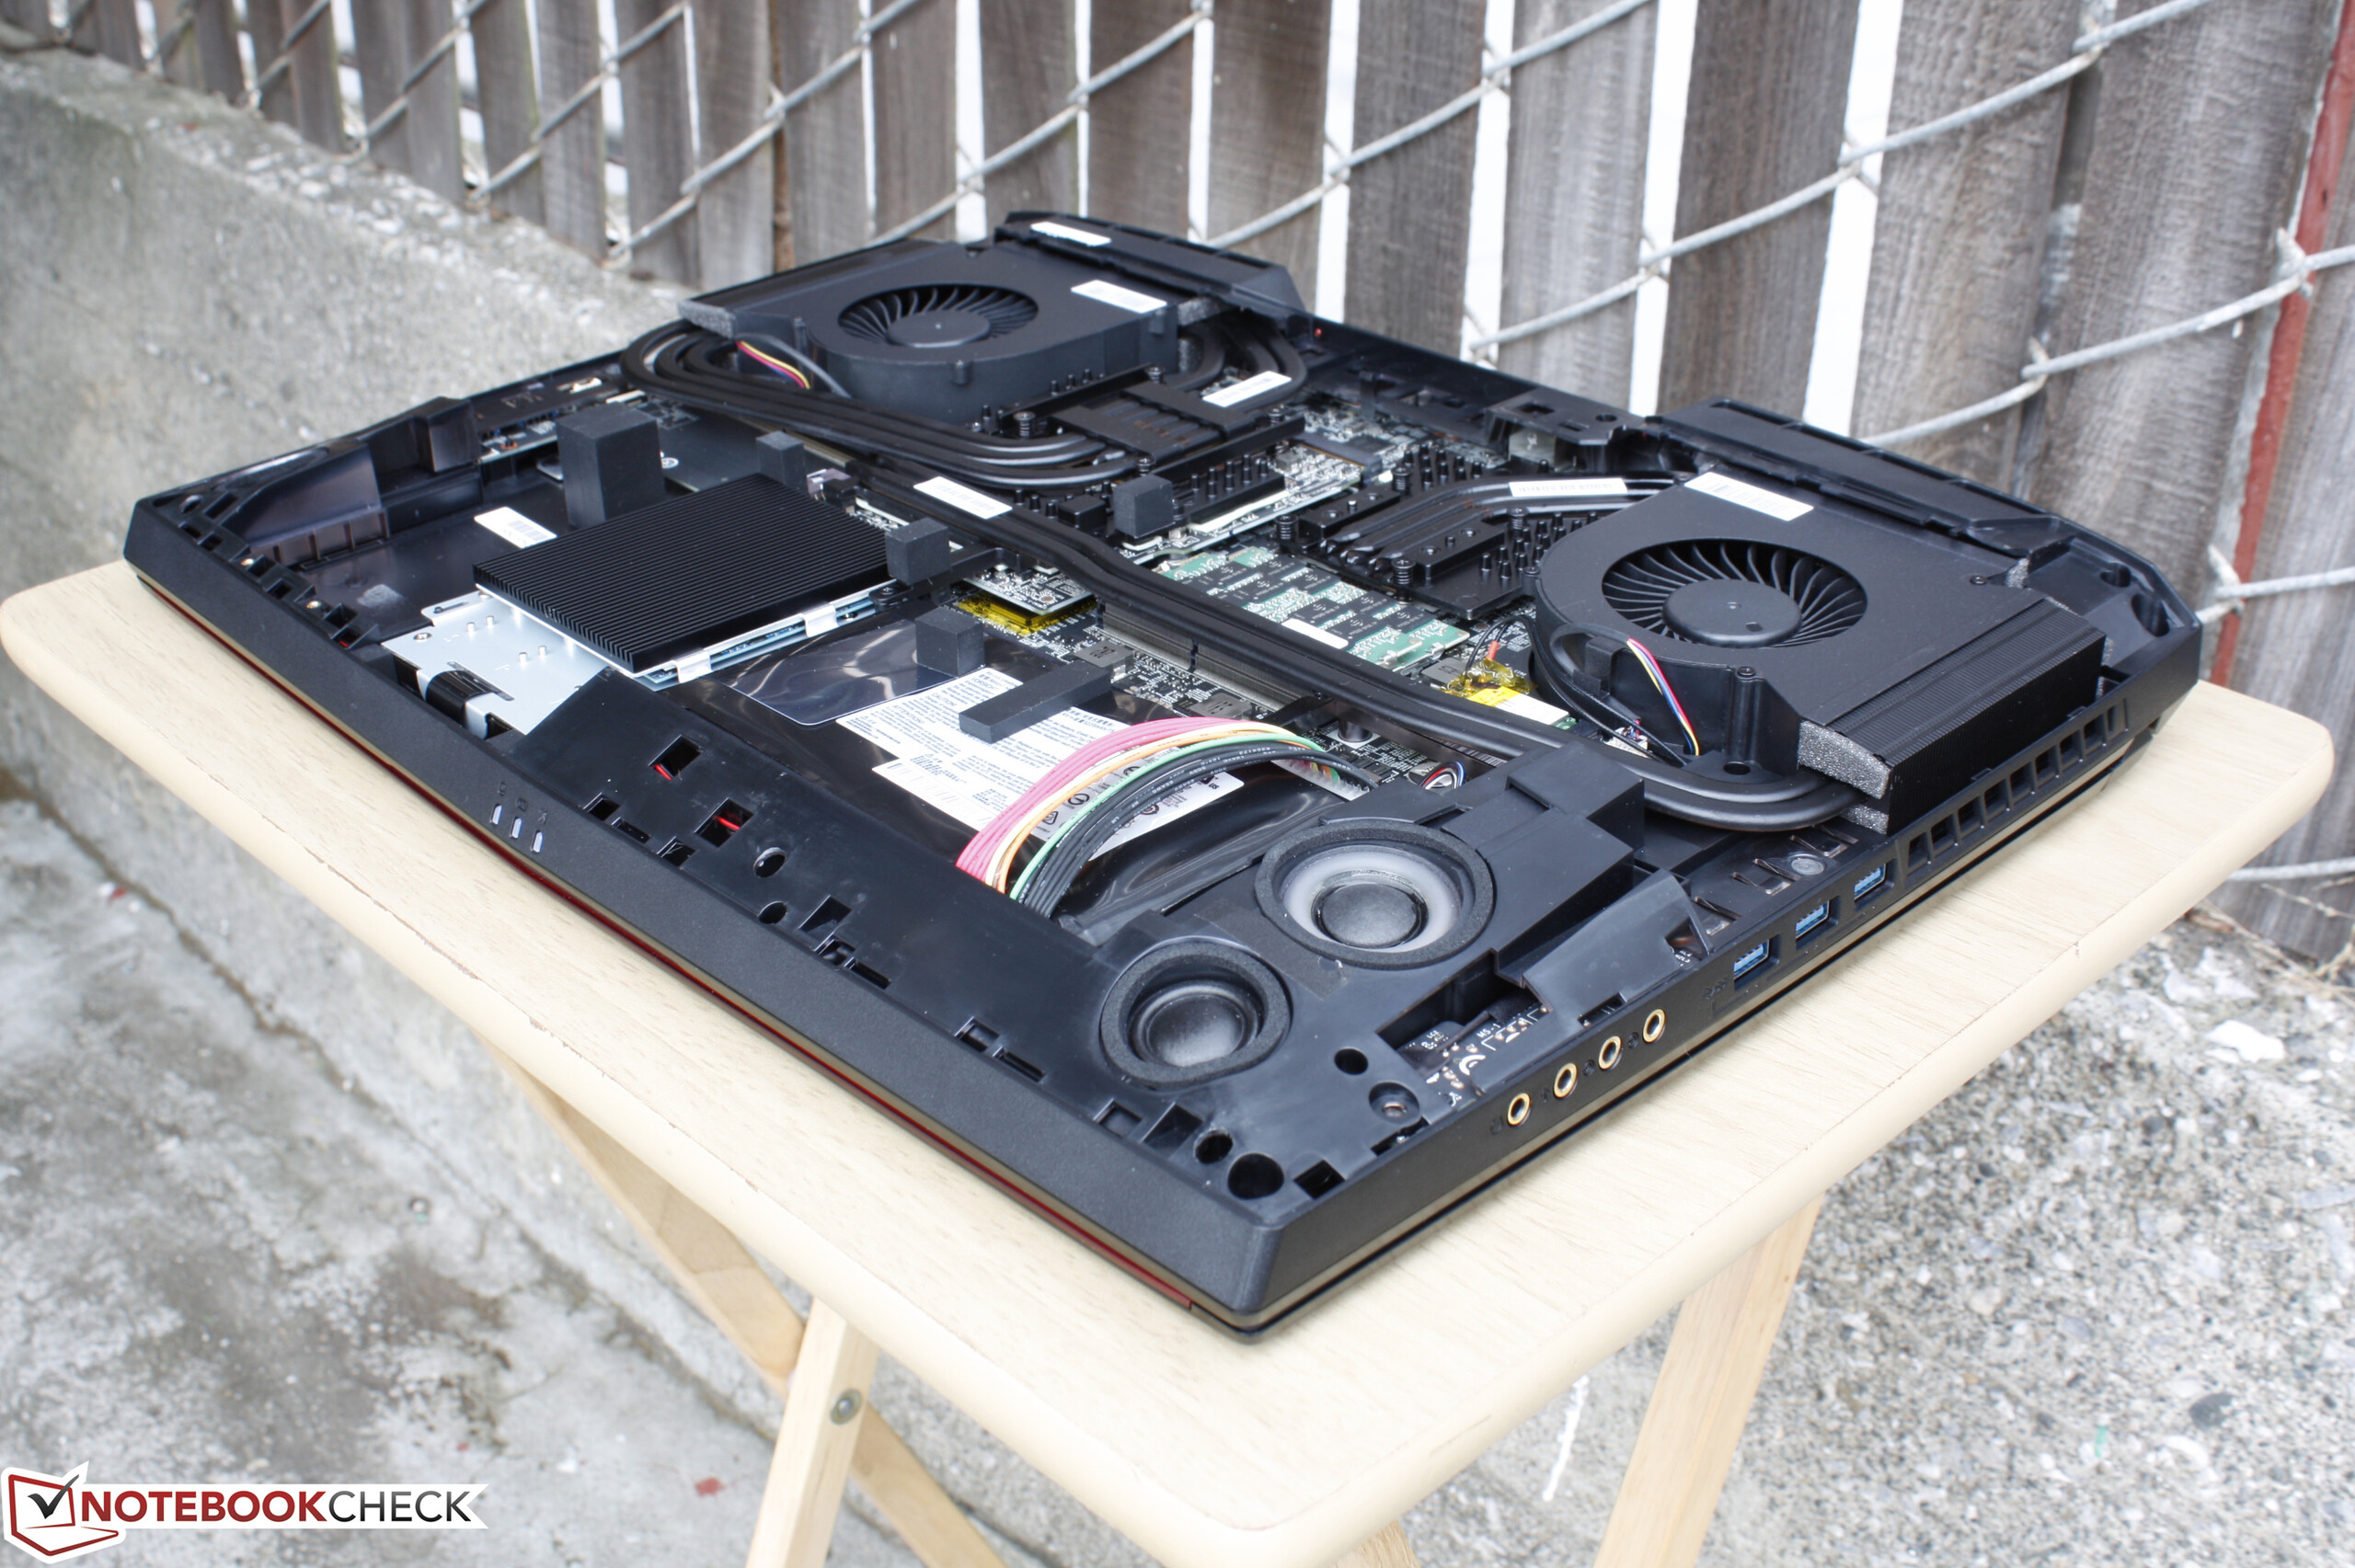
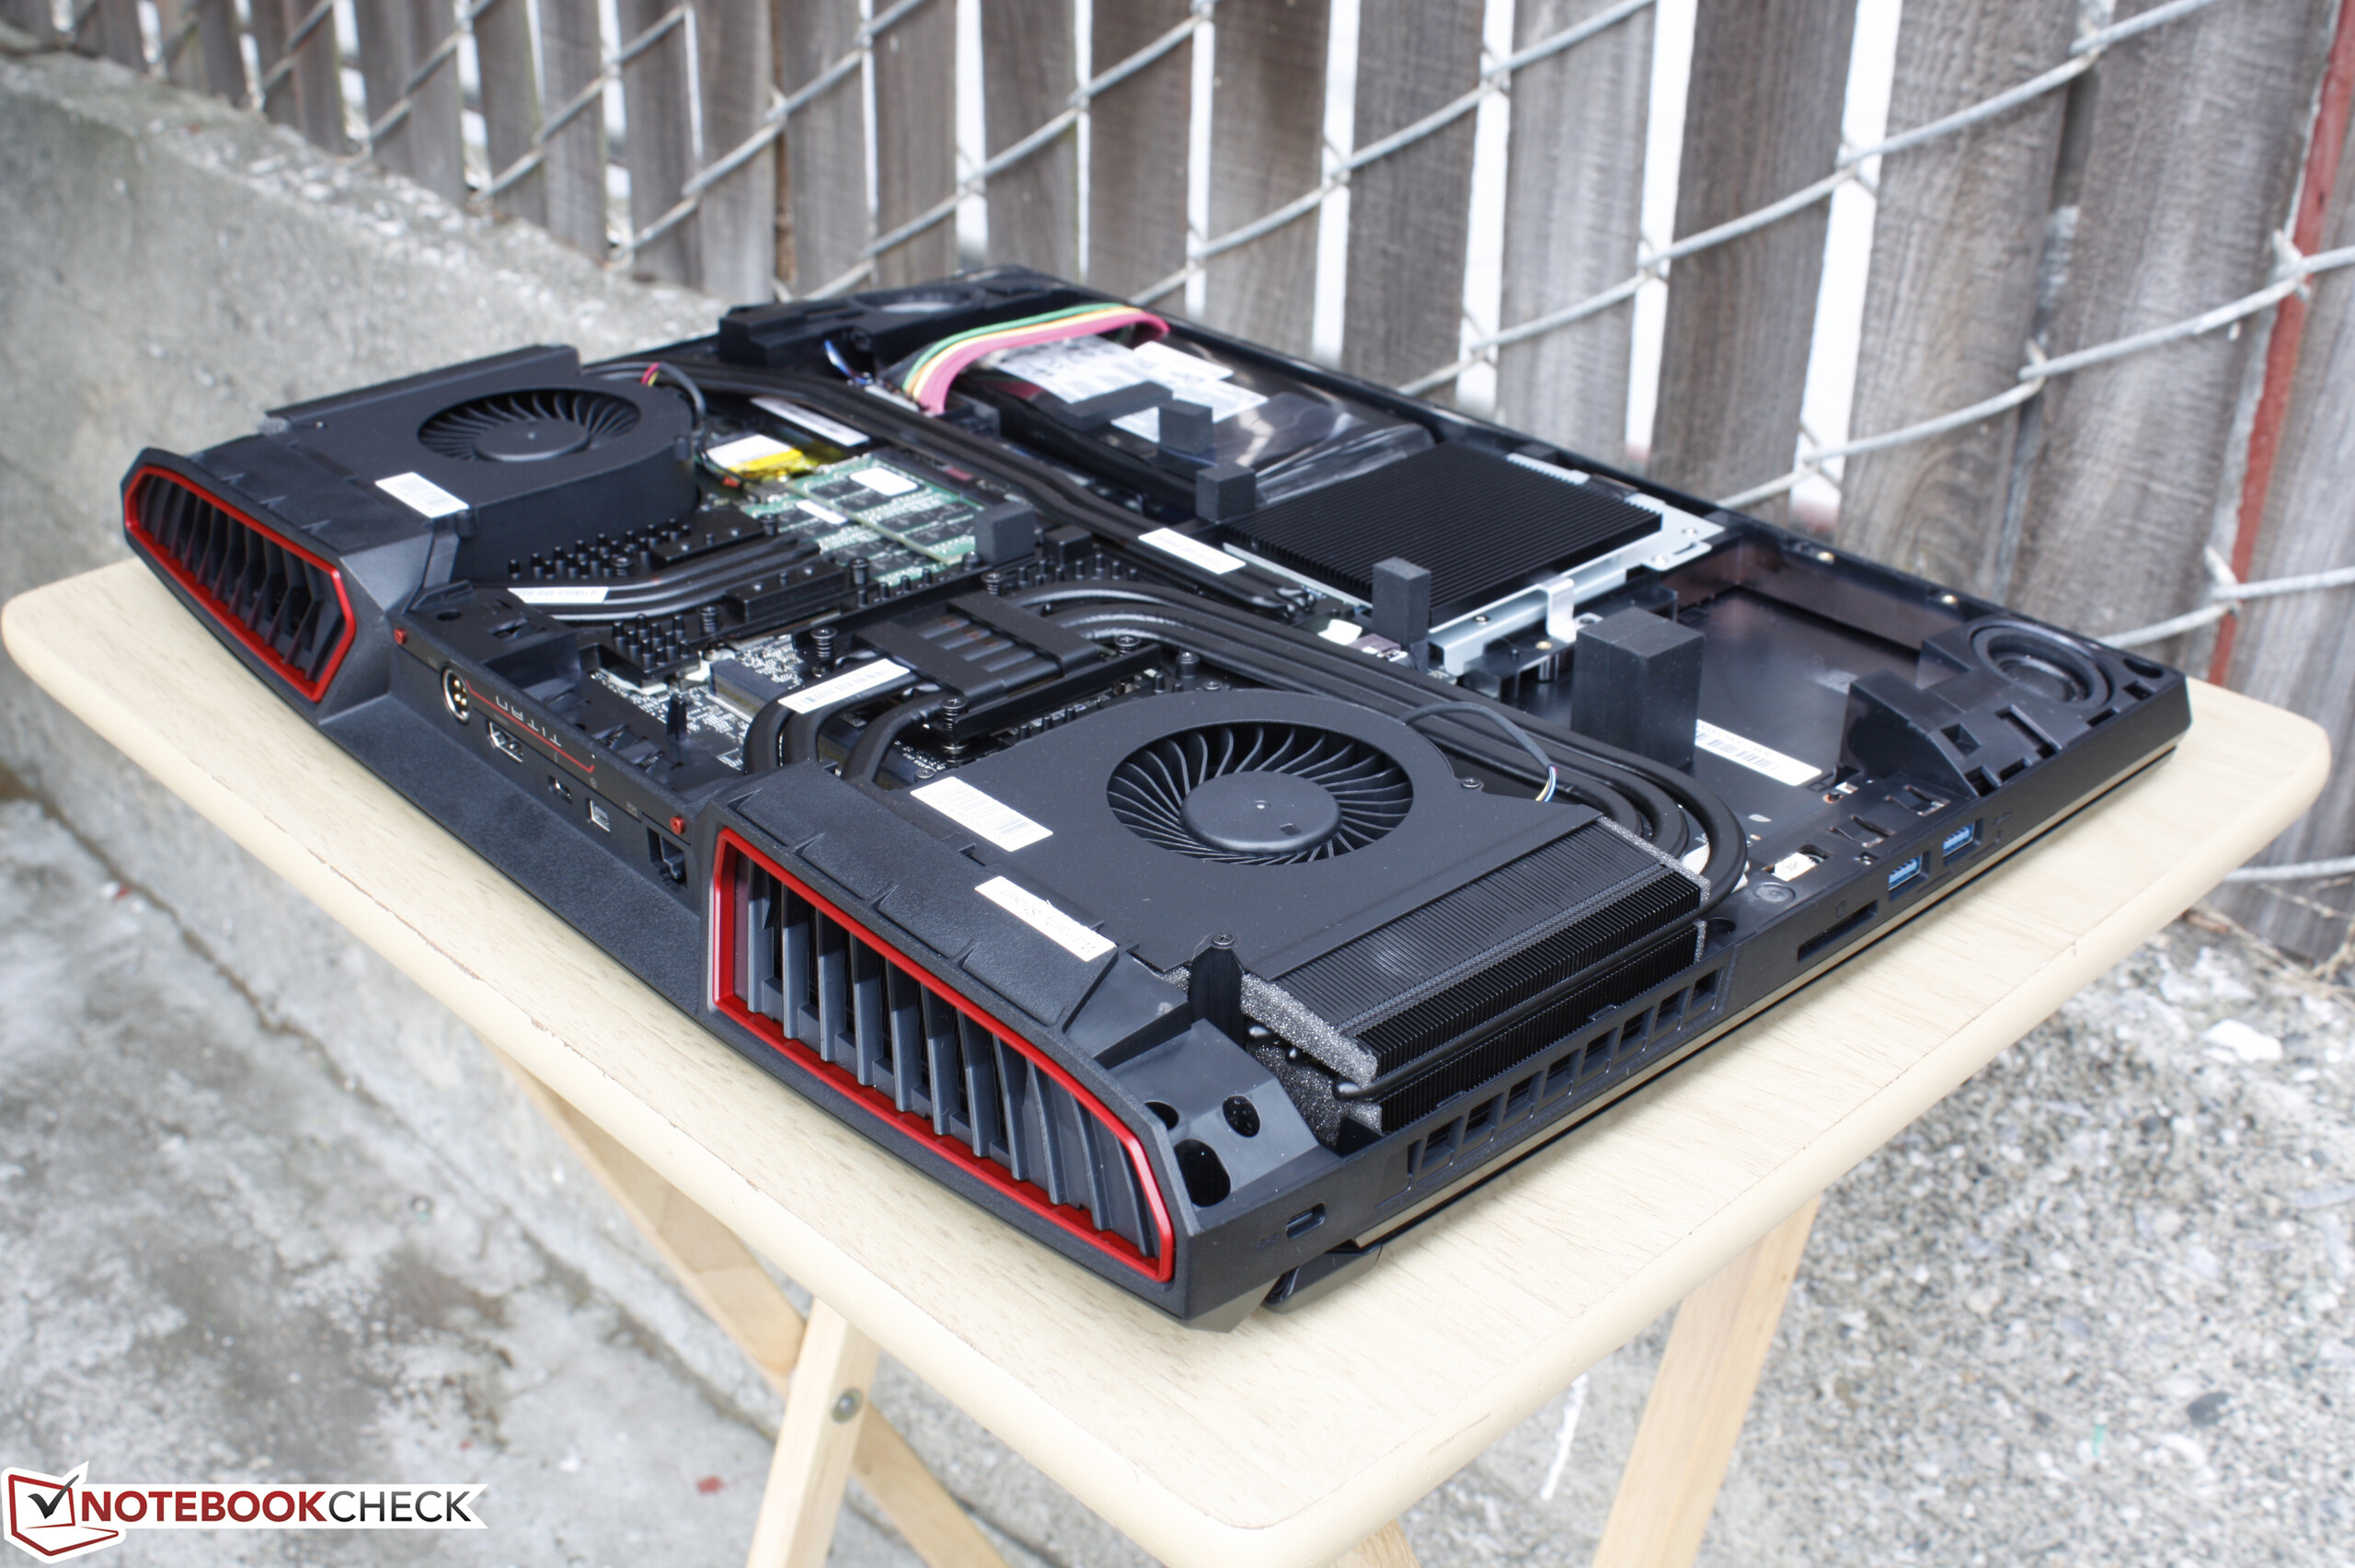
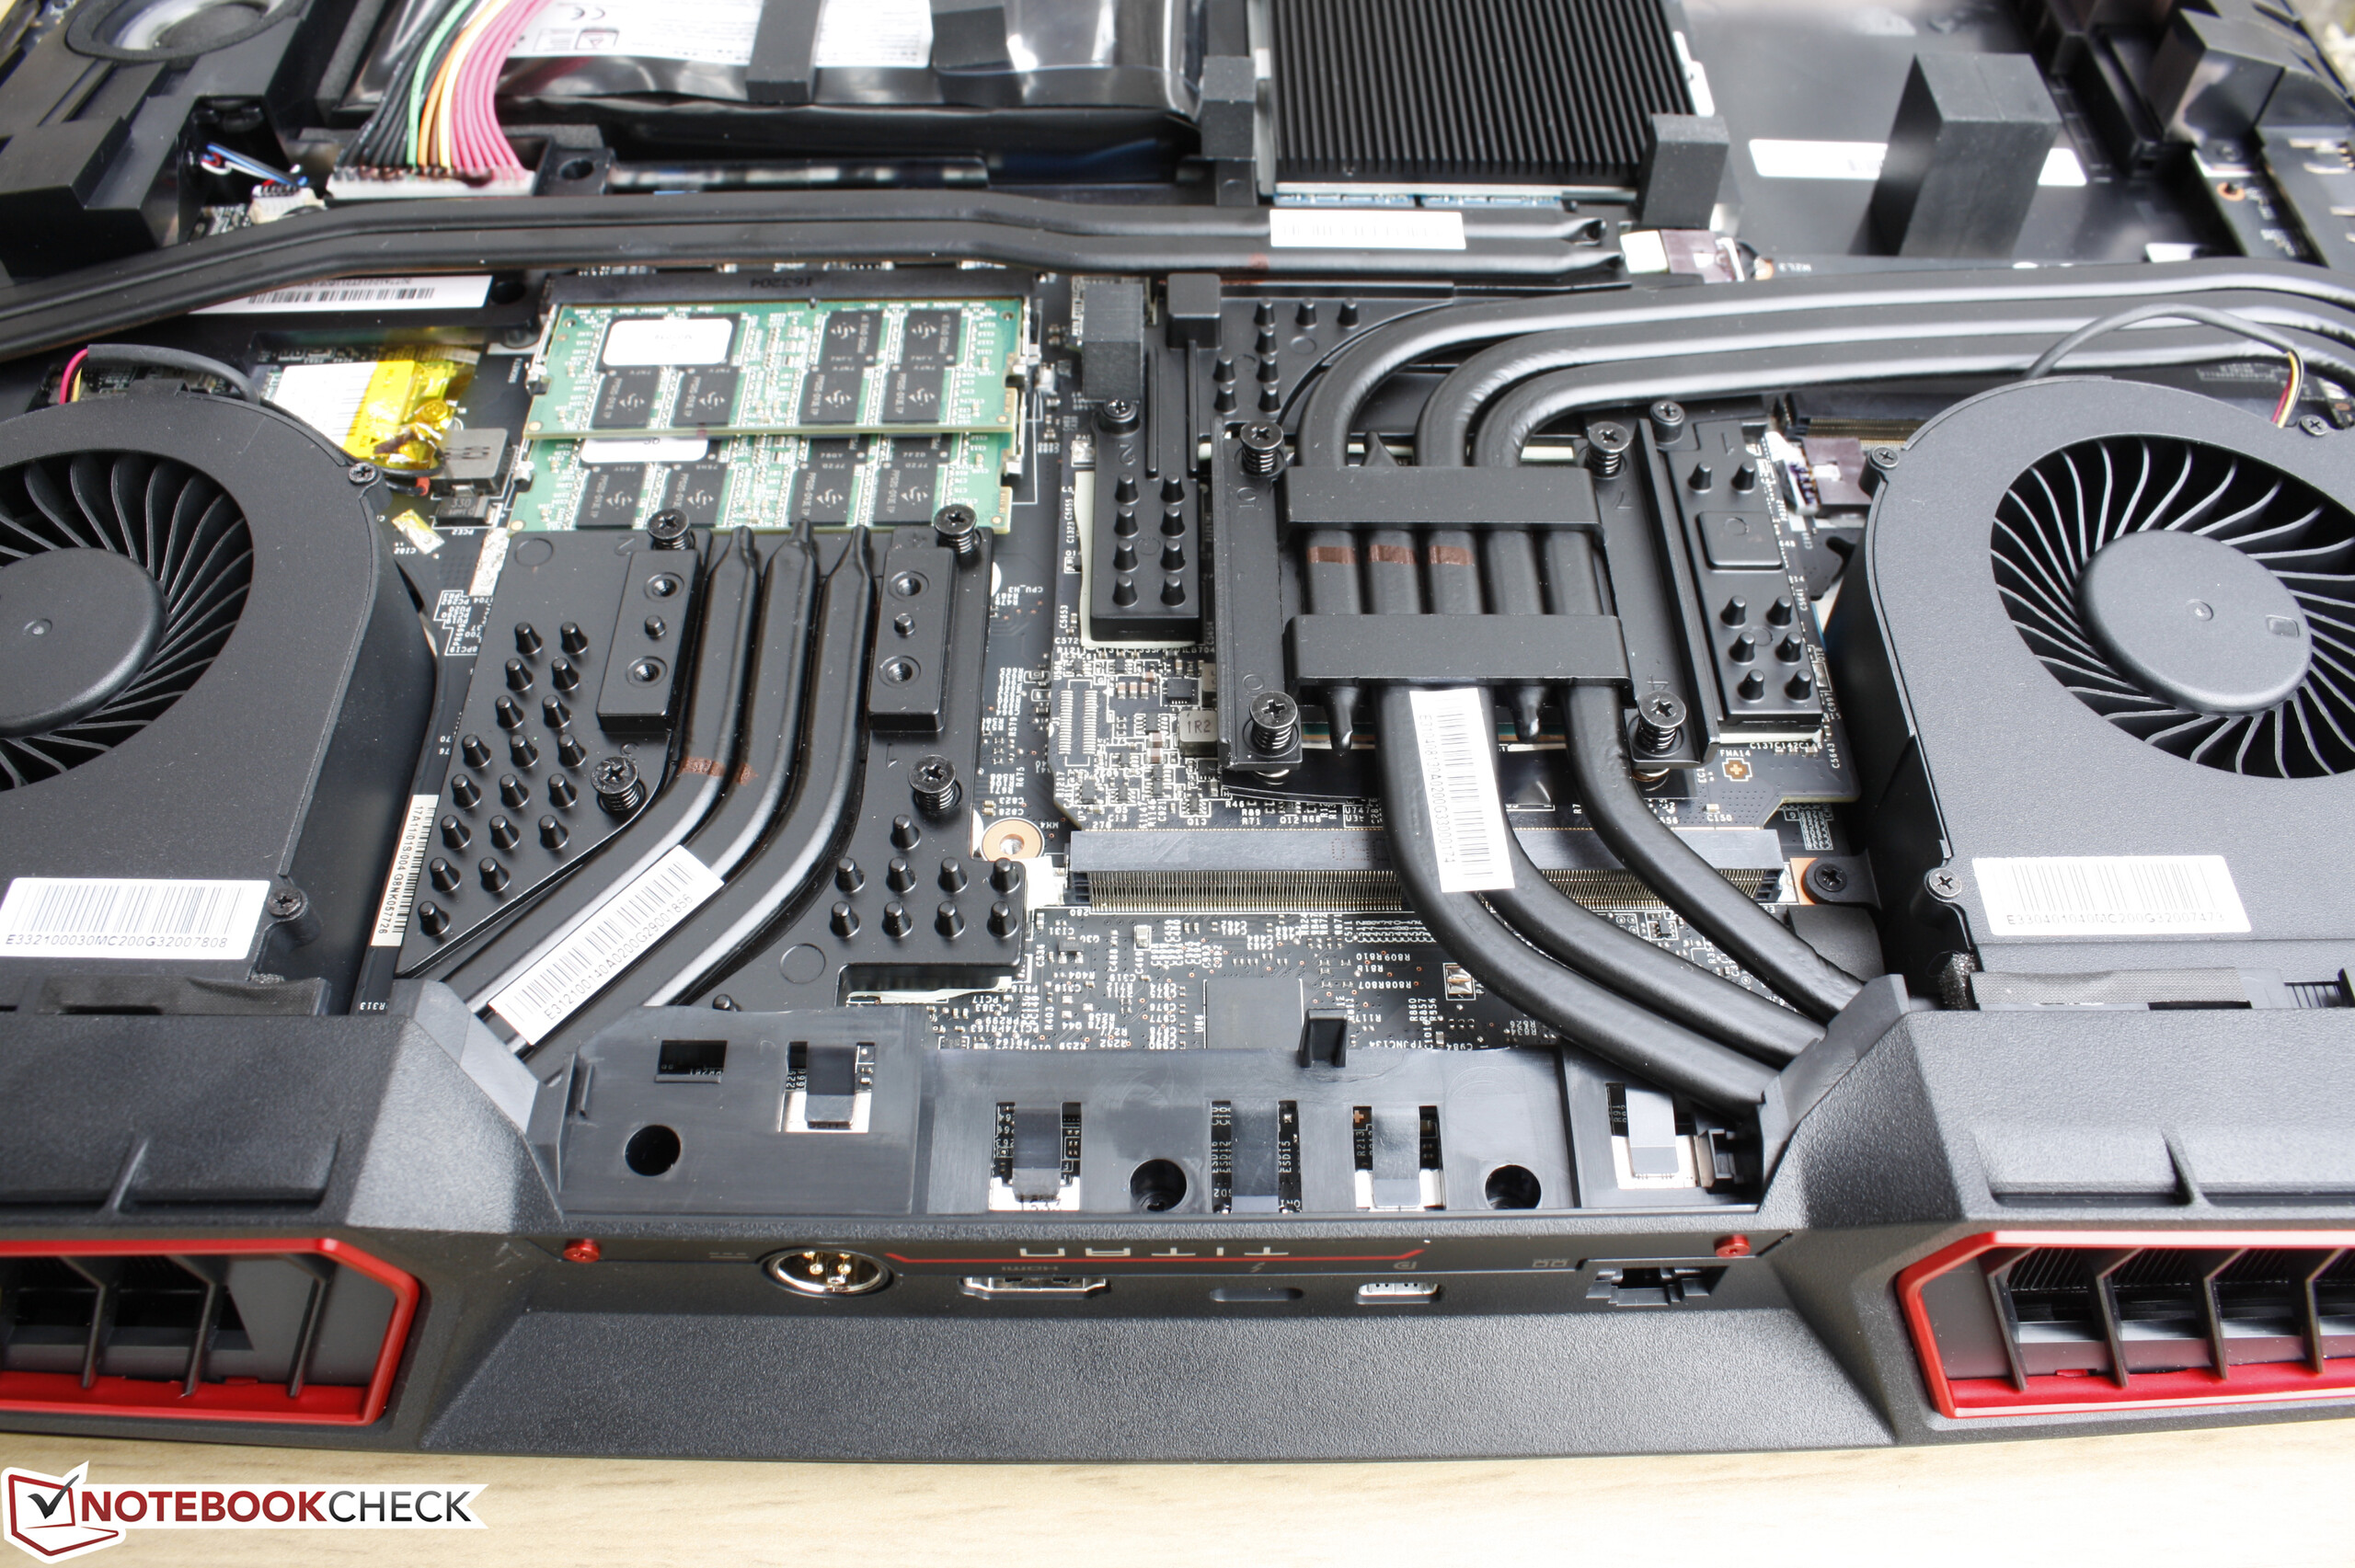
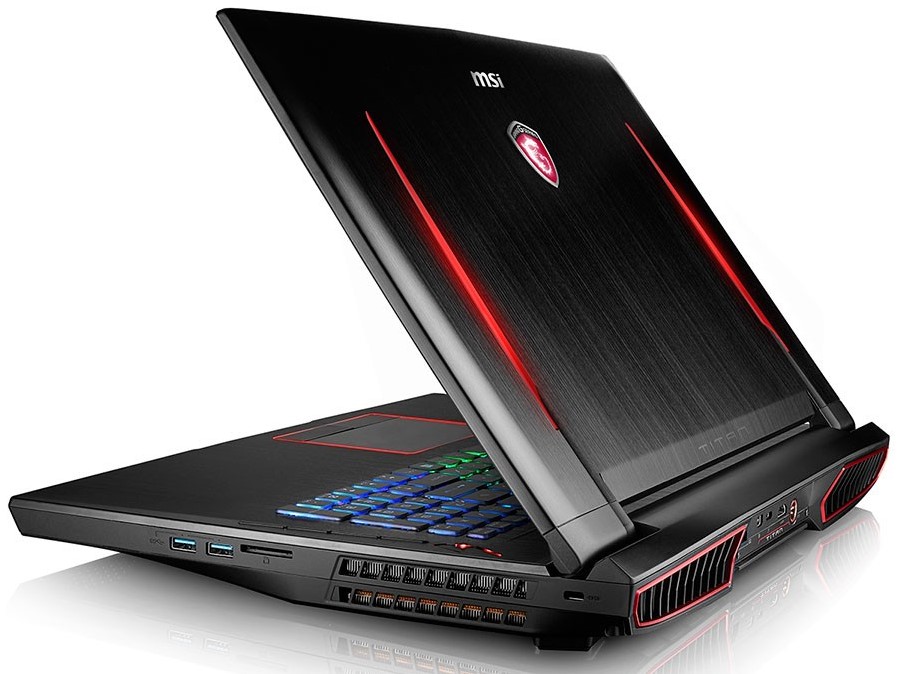
A GT73VR háza még mindig az egyik legjobb a GTX 1080 számára, mivel sokoldalú és nagyon jó hűtést kapott. Az ugyanezen GPU-val szerelt ultravékony notebookok közül több érkezik meg még idén - például az Aorus X7 V6 és a Razer Blade Pro - de nem valószínű, hogy ezek a könnyebben hordozható gépek az MSI-nél halkabban, és hűvösebben tudnak működni majd.
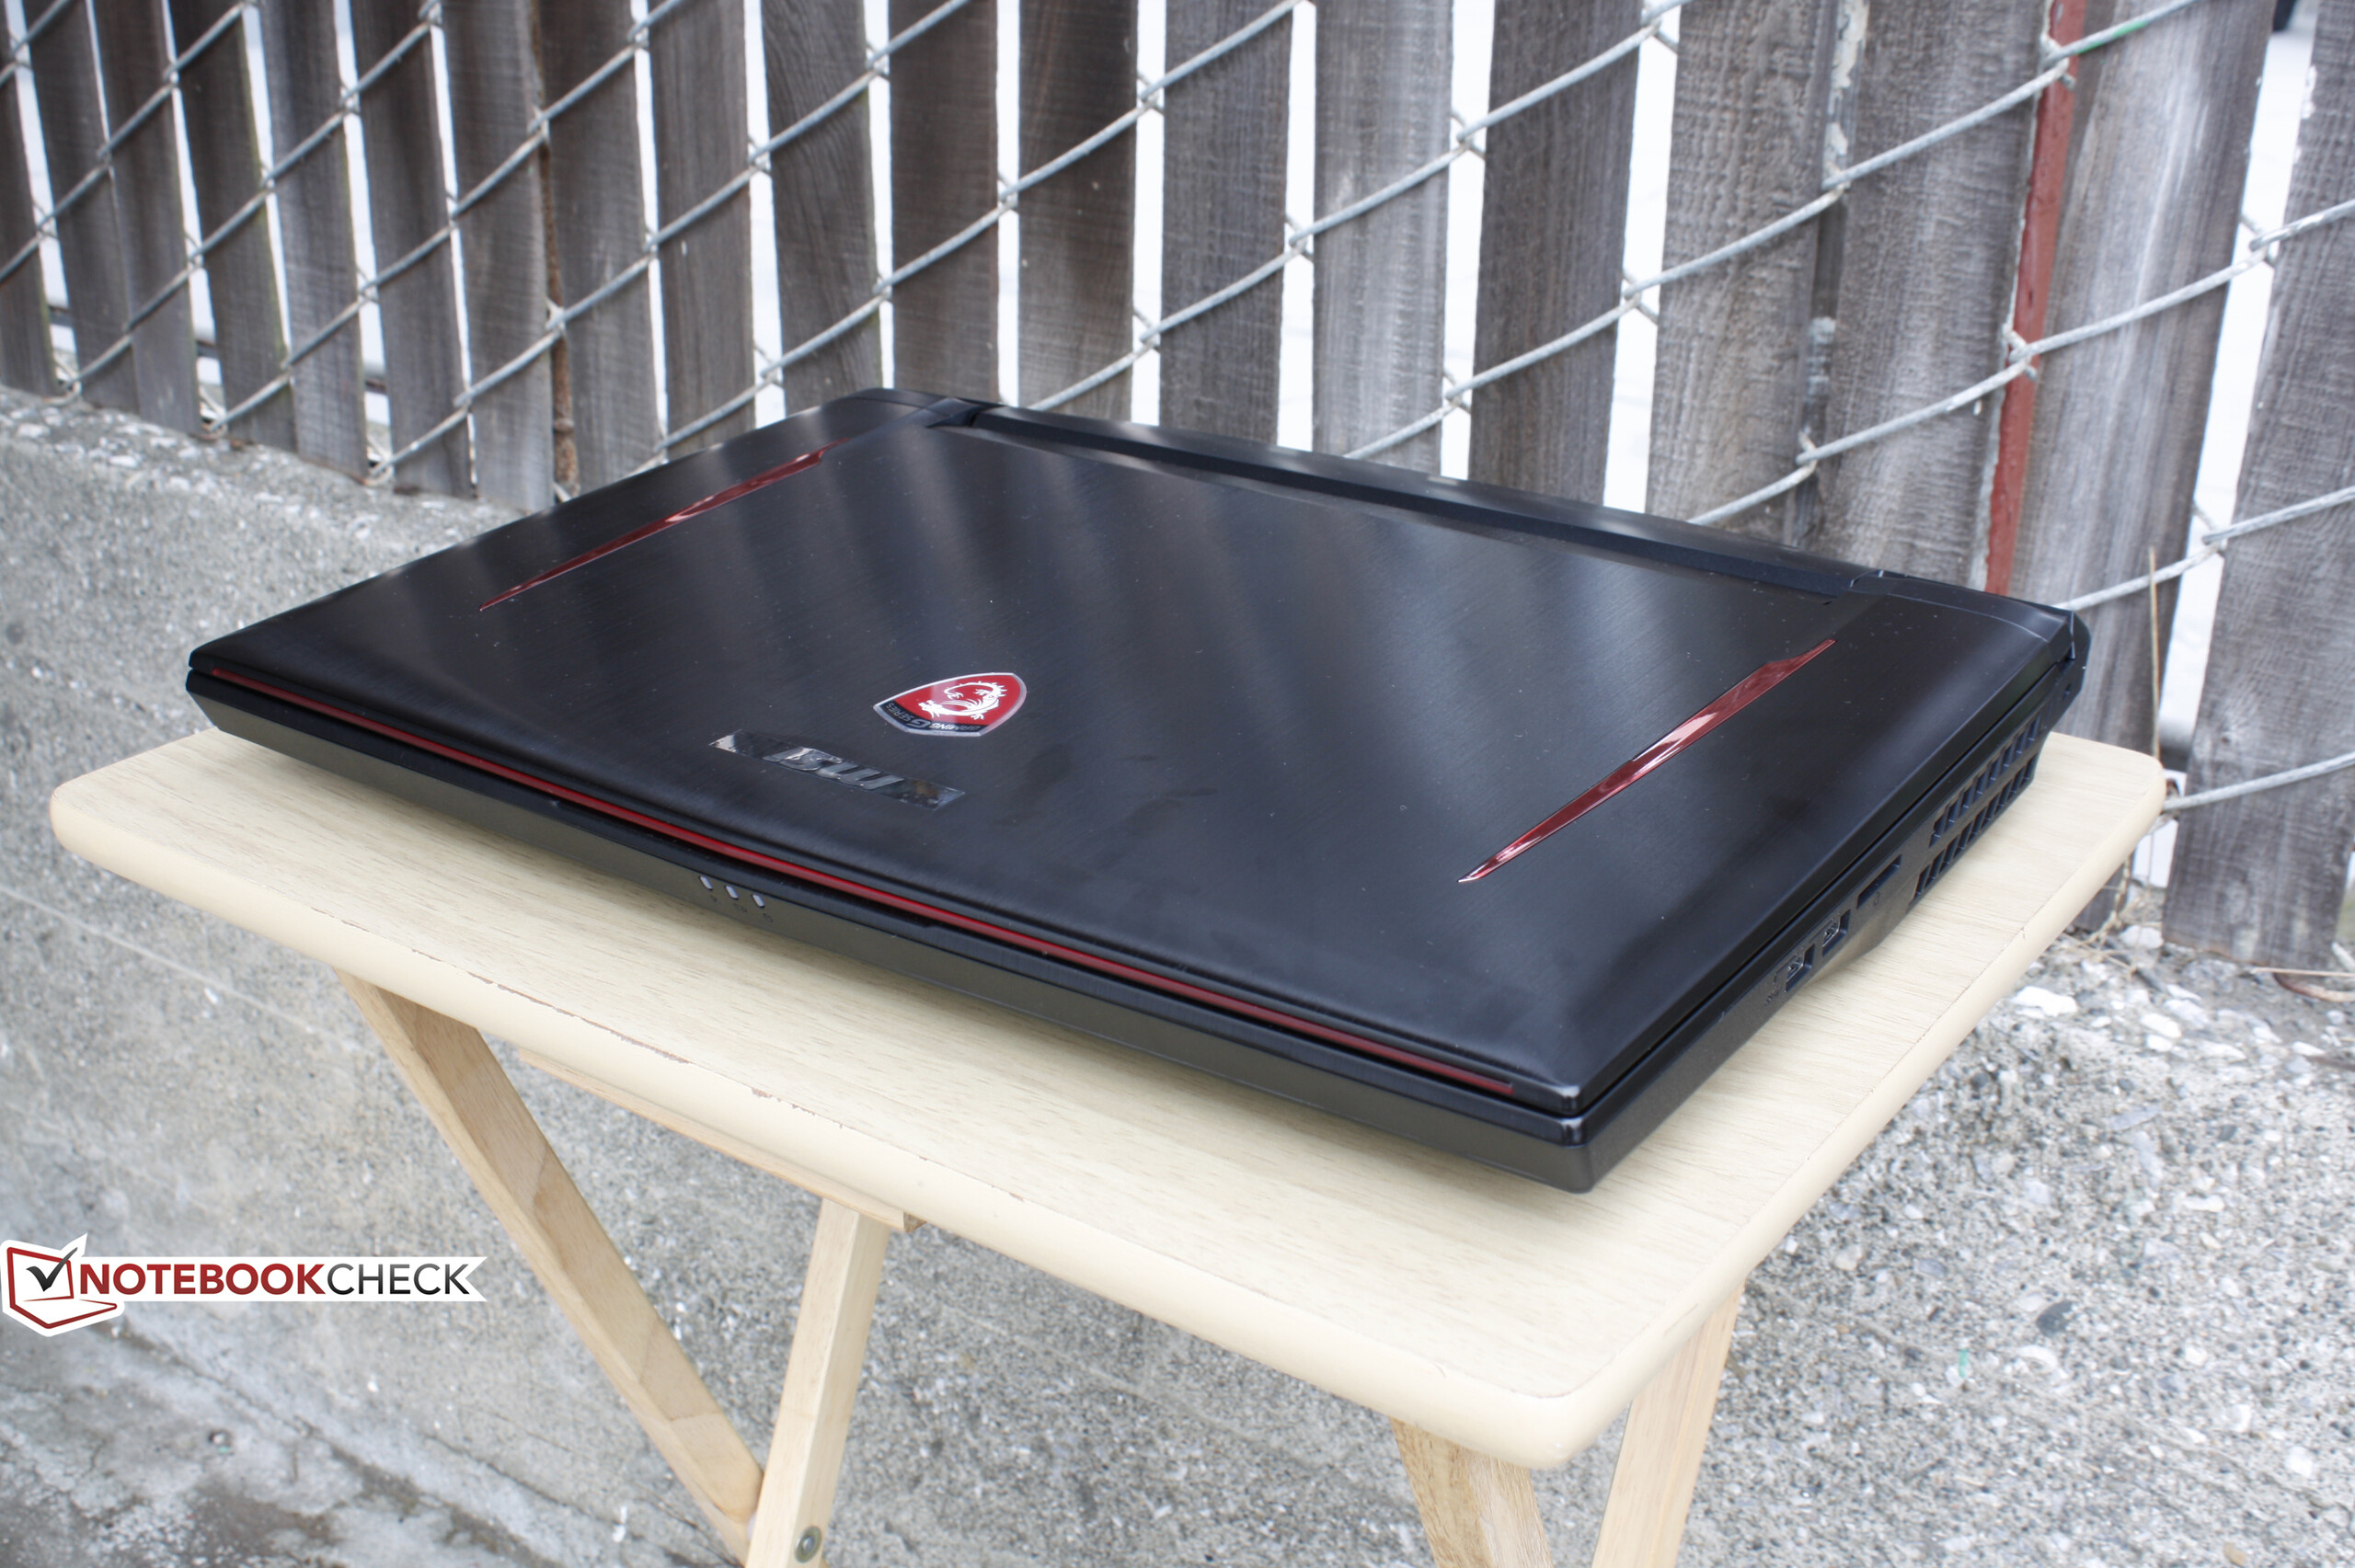
A GT73VR jó irányba viszi el a GT sorozatot, és majdnem mindenben felülmúlja a GT72-t. Vastagabb és nehezebb ugyan, de az extra tömeget és terjedelmet bölcsen hasznosították az erősen megnövelt játékélmény érdekében.
Ez az eredeti értékelés rövidített változata. A teljes, angol nyelvű értékelés itt olvasható.
MSI GT73VR 6RF
-
11/04/2016 v5.1(old)
Allen Ngo
Pricecompare
