 Deutsch
 English
 Español
 Français
 Italiano
 Nederlands
 Polski
 Português
 Русский
 Türkçe
 Svenska
 Chinese
 Magyar
Dell Inspiron 15 5000 5567-1753 Notebook rövid értékelés


| SD Card Reader | |
| average JPG Copy Test (av. of 3 runs) | |
| Lenovo ThinkPad E470-20H2S00400 | |
| Lenovo IdeaPad 510-15IKB 80SV0087GE | |
| Acer Aspire F15 F5-573G-53V1 | |
| HP Pavilion 15-aw004ng W8Y60EA | |
| Acer Aspire E5-575G-549D | |
| Dell Inspiron 15 5000 5567-1753 | |
| HP Pavilion 17-x110ng | |
| maximum AS SSD Seq Read Test (1GB) | |
| HP Pavilion 15-aw004ng W8Y60EA | |
| Lenovo ThinkPad E470-20H2S00400 | |
| Acer Aspire E5-575G-549D | |
| Dell Inspiron 15 5000 5567-1753 | |
| Lenovo IdeaPad 510-15IKB 80SV0087GE | |
| HP Pavilion 17-x110ng | |
| Networking | |
| iperf3 transmit AX12 | |
| Lenovo ThinkPad E470-20H2S00400 | |
| Dell Inspiron 15 5000 5567-1753 | |
| HP Pavilion 17-x110ng | |
| iperf3 receive AX12 | |
| Lenovo ThinkPad E470-20H2S00400 | |
| Dell Inspiron 15 5000 5567-1753 | |
| HP Pavilion 17-x110ng | |
| |||||||||||||||||||||||||
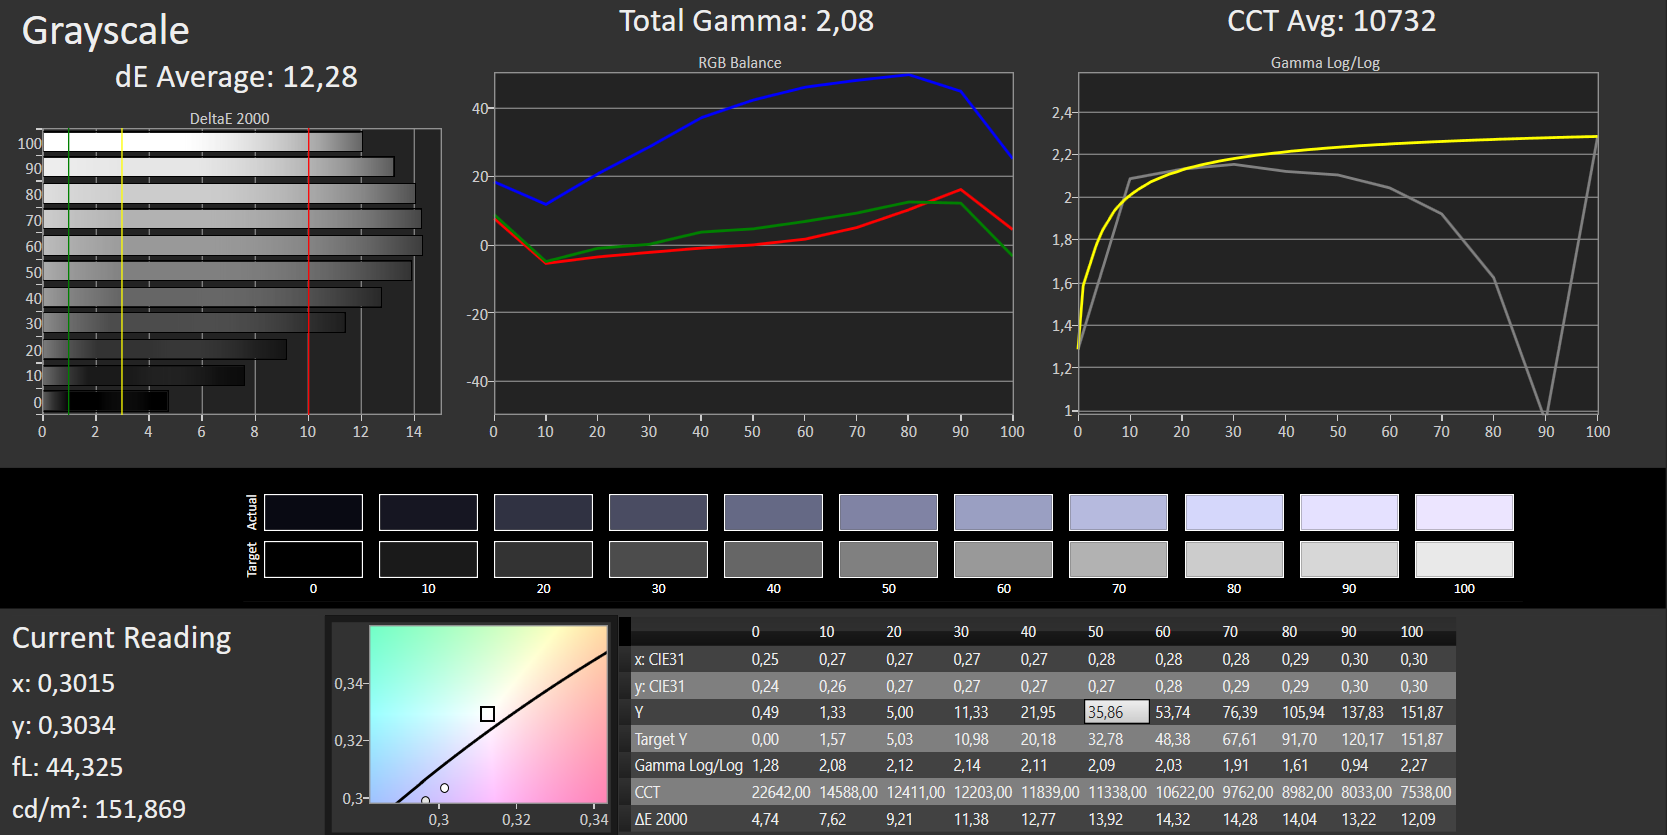
Fényerő megoszlás: 90 %
Centrumban: 187 cd/m²
Kontraszt: 296:1 (Fekete: 0.49 cd/m²)
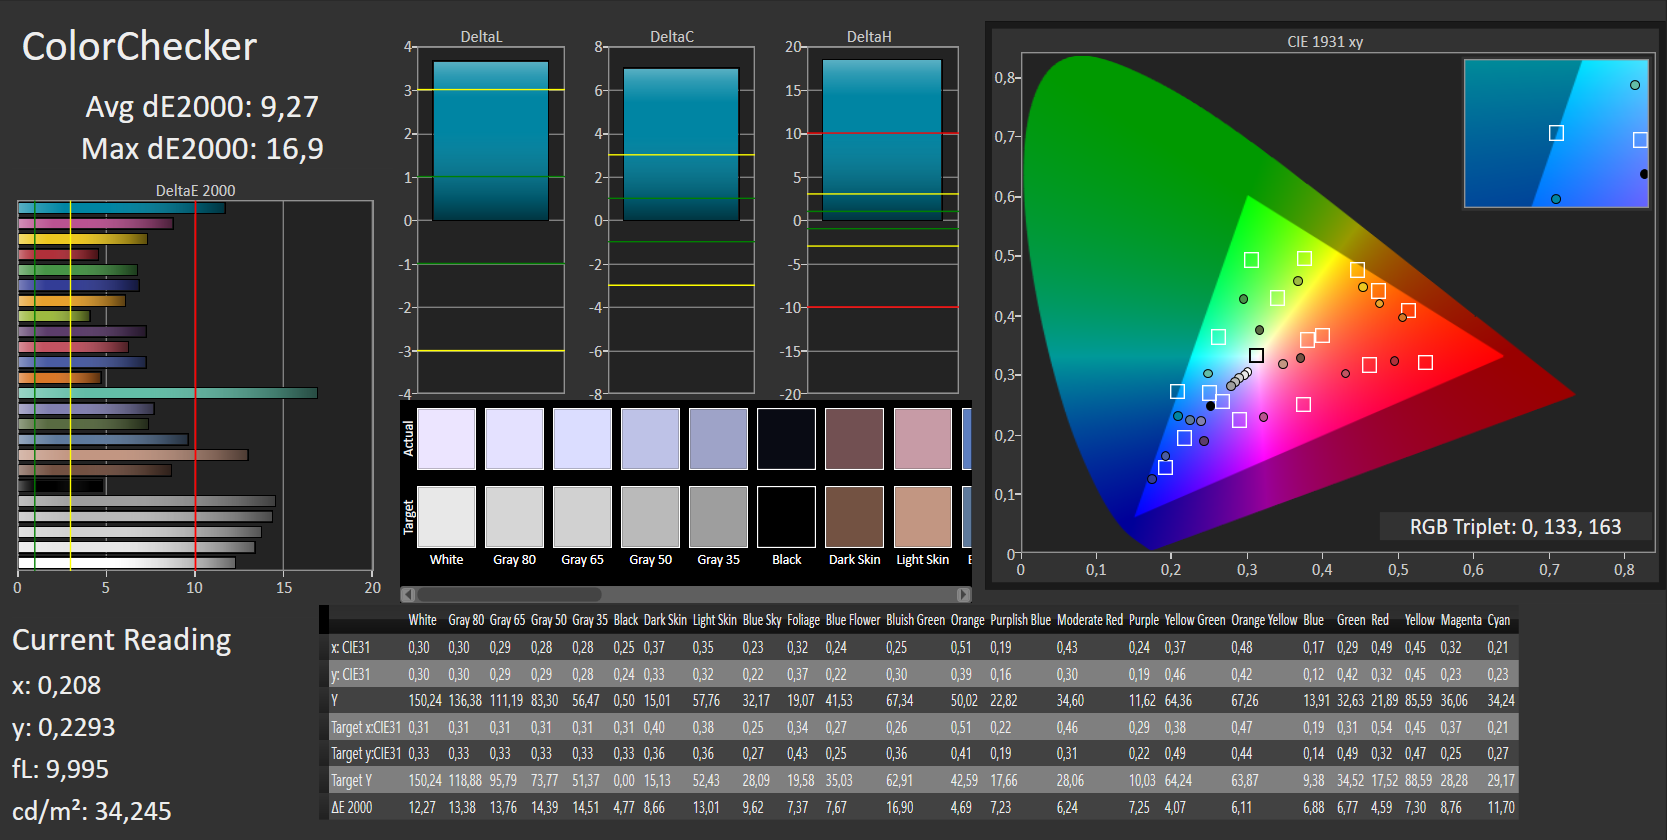
ΔE Color 9.27 | 0.5-29.43 Ø5
ΔE Greyscale 12.28 | 0.57-98 Ø5.3
55% sRGB (Argyll 1.6.3 3D)
35% AdobeRGB 1998 (Argyll 1.6.3 3D)
37.44% AdobeRGB 1998 (Argyll 2.2.0 3D)
54.6% sRGB (Argyll 2.2.0 3D)
36.24% Display P3 (Argyll 2.2.0 3D)
Gamma: 2.03
| Dell Inspiron 15 5000 5567-1753 BOE NT15N41, 1920x1080, 15.60 | Acer Aspire E5-575G-549D Chi Mei CMN15C4, 1920x1080, 15.60 | Lenovo IdeaPad 510-15IKB 80SV0087GE BOE HF NV156FHM-N42, 1920x1080, 15.60 | Lenovo ThinkPad E470-20H2S00400 N140HCA-EAB, 1920x1080, 14.00 | HP Pavilion 15-aw004ng W8Y60EA Chi Mei, 1920x1080, 15.60 | HP Pavilion 17-x110ng Chi Mei CMN1738, 1920x1080, 17.30 | |
|---|---|---|---|---|---|---|
| Display | 6% | 18% | 13% | 11% | 67% | |
| Display P3 Coverage | 36.24 | 38.57 6% | 42.66 18% | 41.23 14% | 40.35 11% | 63.6 75% |
| sRGB Coverage | 54.6 | 57.4 5% | 64.1 17% | 61.4 12% | 60.3 10% | 86.5 58% |
| AdobeRGB 1998 Coverage | 37.44 | 39.89 7% | 44.08 18% | 42.67 14% | 41.71 11% | 63.3 69% |
| Response Times | -31% | -95% | -56% | -30% | -55% | |
| Response Time Grey 50% / Grey 80% * | 43 ? | 39 ? 9% | 51 ? -19% | 40.8 ? 5% | 41 ? 5% | 41 ? 5% |
| Response Time Black / White * | 14 ? | 24 ? -71% | 38 ? -171% | 30.4 ? -117% | 23 ? -64% | 30 ? -114% |
| PWM Frequency | 50 ? | 200 ? | ||||
| Screen | 13% | 76% | 40% | 19% | 52% | |
| Brightness middle | 145 | 176 21% | 291 101% | 244 68% | 240 66% | 288 99% |
| Brightness | 144 | 169 17% | 265 84% | 231 60% | 228 58% | 285 98% |
| Brightness Distribution | 90 | 91 1% | 86 -4% | 89 -1% | 89 -1% | 88 -2% |
| Black Level * | 0.49 | 0.47 4% | 0.23 53% | 0.37 24% | 0.49 -0% | 0.61 -24% |
| Contrast | 296 | 374 26% | 1265 327% | 659 123% | 490 66% | 472 59% |
| Colorchecker dE 2000 * | 9.27 | 8.83 5% | 4.78 48% | 6.41 31% | 10.96 -18% | 4.56 51% |
| Colorchecker dE 2000 max. * | 16.9 | 14.01 17% | 9.51 44% | 13.4 21% | 18.36 -9% | 7.76 54% |
| Greyscale dE 2000 * | 12.28 | 8.97 27% | 3.49 72% | 5.94 52% | 11.34 8% | 4.95 60% |
| Gamma | 2.03 108% | 2.43 91% | 2.58 85% | 2.28 96% | 2.27 97% | 2.48 89% |
| CCT | 10732 61% | 10234 64% | 6013 108% | 6101 107% | 12292 53% | 7669 85% |
| Color Space (Percent of AdobeRGB 1998) | 35 | 36.8 5% | 40 14% | 39.3 12% | 39 11% | |
| Color Space (Percent of sRGB) | 55 | 57.3 4% | 64 16% | 61.1 11% | 60 9% | 93 69% |
| Teljes átlag (program / beállítások) | -4% /
6% | -0% /
41% | -1% /
22% | 0% /
11% | 21% /
40% |
* ... a kisebb jobb
Megjelenítési válaszidők
| ↔ Válaszidő Fekete-fehér | ||
|---|---|---|
| 14 ms ... emelkedés és süllyedés ↘ kombinálva | ↗ 6 ms emelkedés | 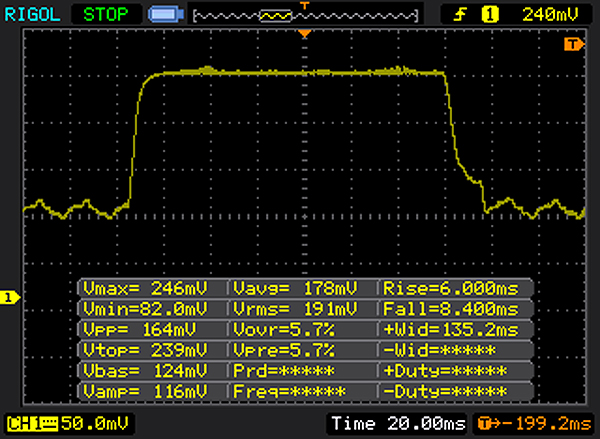 |
| ↘ 8 ms ősz | ||
| A képernyő jó reakciósebességet mutat tesztjeinkben, de túl lassú lehet a versenyképes játékosok számára. In comparison, all tested devices range from 0.1 (minimum) to 240 (maximum) ms. » 29 % of all devices are better. Ez azt jelenti, hogy a mért válaszidő jobb, mint az összes vizsgált eszköz átlaga (21.5 ms). | ||
| ↔ Válaszidő 50% szürke és 80% szürke között | ||
| 43 ms ... emelkedés és süllyedés ↘ kombinálva | ↗ 18 ms emelkedés | 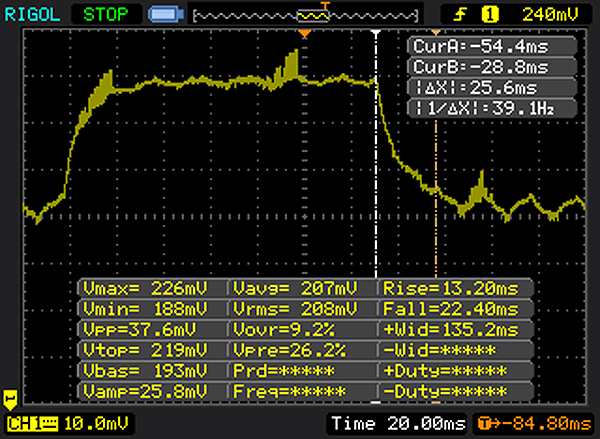 |
| ↘ 25 ms ősz | ||
| A képernyő lassú reakciósebességet mutat tesztjeinkben, és nem lesz kielégítő a játékosok számára. In comparison, all tested devices range from 0.2 (minimum) to 636 (maximum) ms. » 67 % of all devices are better. Ez azt jelenti, hogy a mért válaszidő rosszabb, mint az összes vizsgált eszköz átlaga (33.7 ms). | ||
Képernyő villogása / PWM (impulzusszélesség-moduláció)
| Képernyő villogása / PWM nem érzékelhető | ||
In comparison: 53 % of all tested devices do not use PWM to dim the display. If PWM was detected, an average of 17900 (minimum: 5 - maximum: 3846000) Hz was measured. | ||


| Cinebench R15 | |
| CPU Single 64Bit | |
| Lenovo IdeaPad 510-15IKB 80SV0087GE | |
| Dell Inspiron 15 5000 5567-1753 | |
| HP Pavilion 17-x110ng | |
| Acer Aspire E5-575G-549D | |
| Lenovo ThinkPad E470-20H2S00400 | |
| HP Pavilion 15-aw004ng W8Y60EA | |
| CPU Multi 64Bit | |
| Lenovo IdeaPad 510-15IKB 80SV0087GE | |
| Dell Inspiron 15 5000 5567-1753 | |
| Acer Aspire E5-575G-549D | |
| Lenovo ThinkPad E470-20H2S00400 | |
| HP Pavilion 17-x110ng | |
| HP Pavilion 15-aw004ng W8Y60EA | |
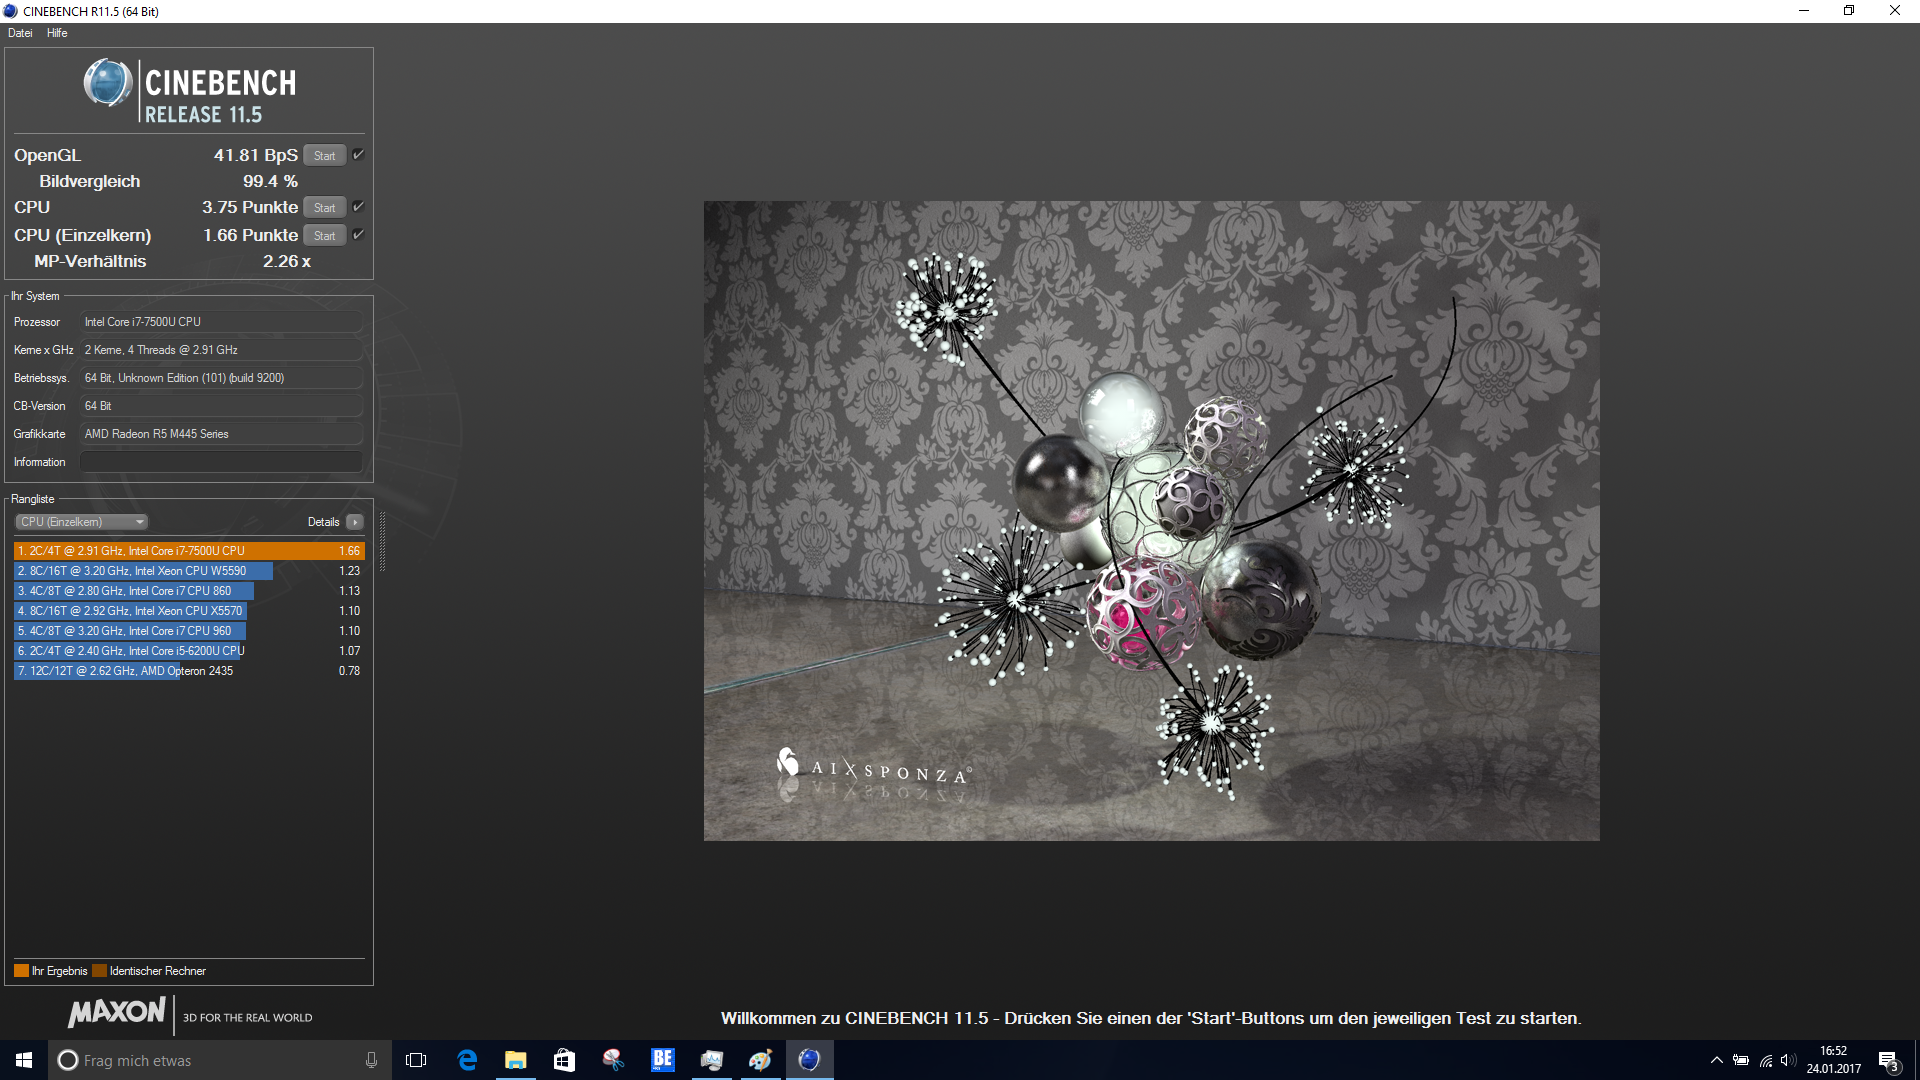
| Cinebench R11.5 | |
| CPU Single 64Bit | |
| Dell Inspiron 15 5000 5567-1753 | |
| Acer Aspire E5-575G-549D | |
| Lenovo ThinkPad E470-20H2S00400 | |
| HP Pavilion 17-x110ng | |
| HP Pavilion 15-aw004ng W8Y60EA | |
| CPU Multi 64Bit | |
| Dell Inspiron 15 5000 5567-1753 | |
| Acer Aspire E5-575G-549D | |
| Lenovo ThinkPad E470-20H2S00400 | |
| HP Pavilion 17-x110ng | |
| HP Pavilion 15-aw004ng W8Y60EA | |
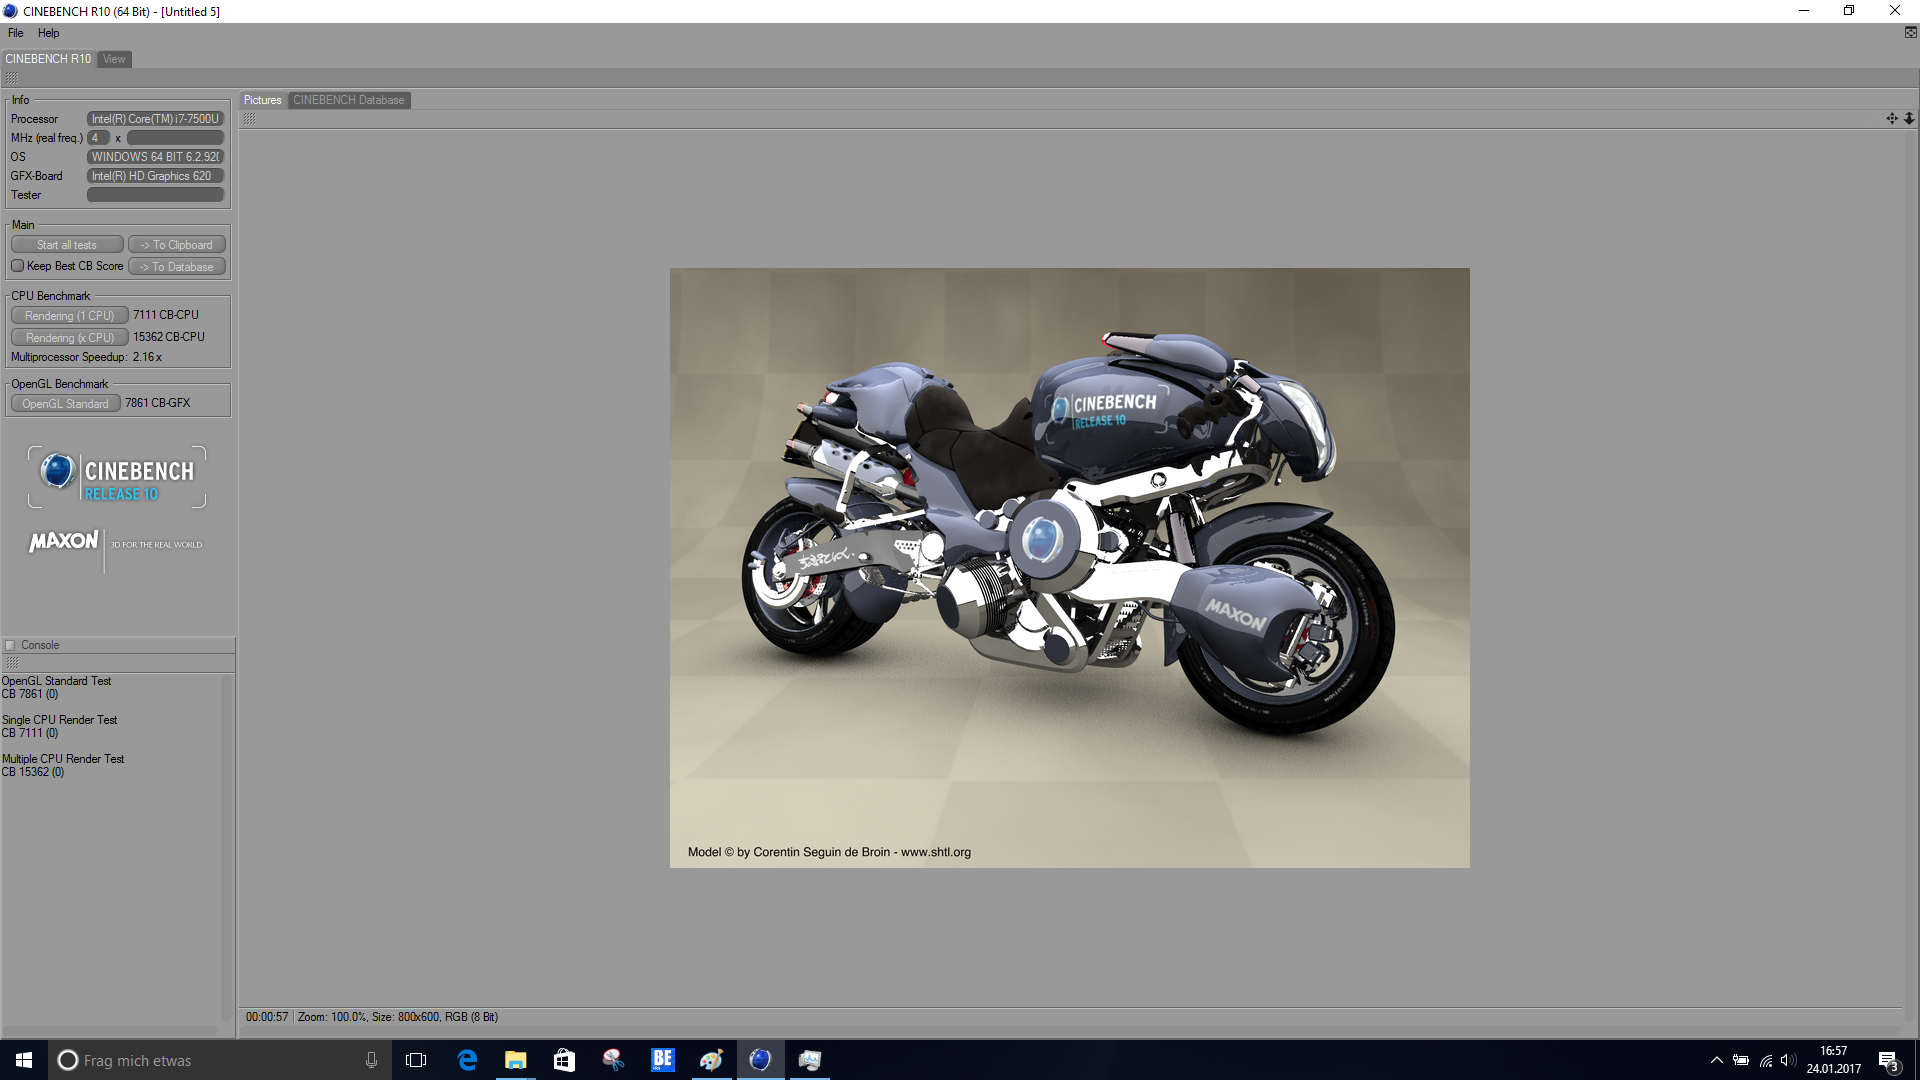
| Cinebench R10 | |
| Rendering Single CPUs 64Bit | |
| Dell Inspiron 15 5000 5567-1753 | |
| HP Pavilion 17-x110ng | |
| Rendering Multiple CPUs 64Bit | |
| Dell Inspiron 15 5000 5567-1753 | |
| HP Pavilion 17-x110ng | |
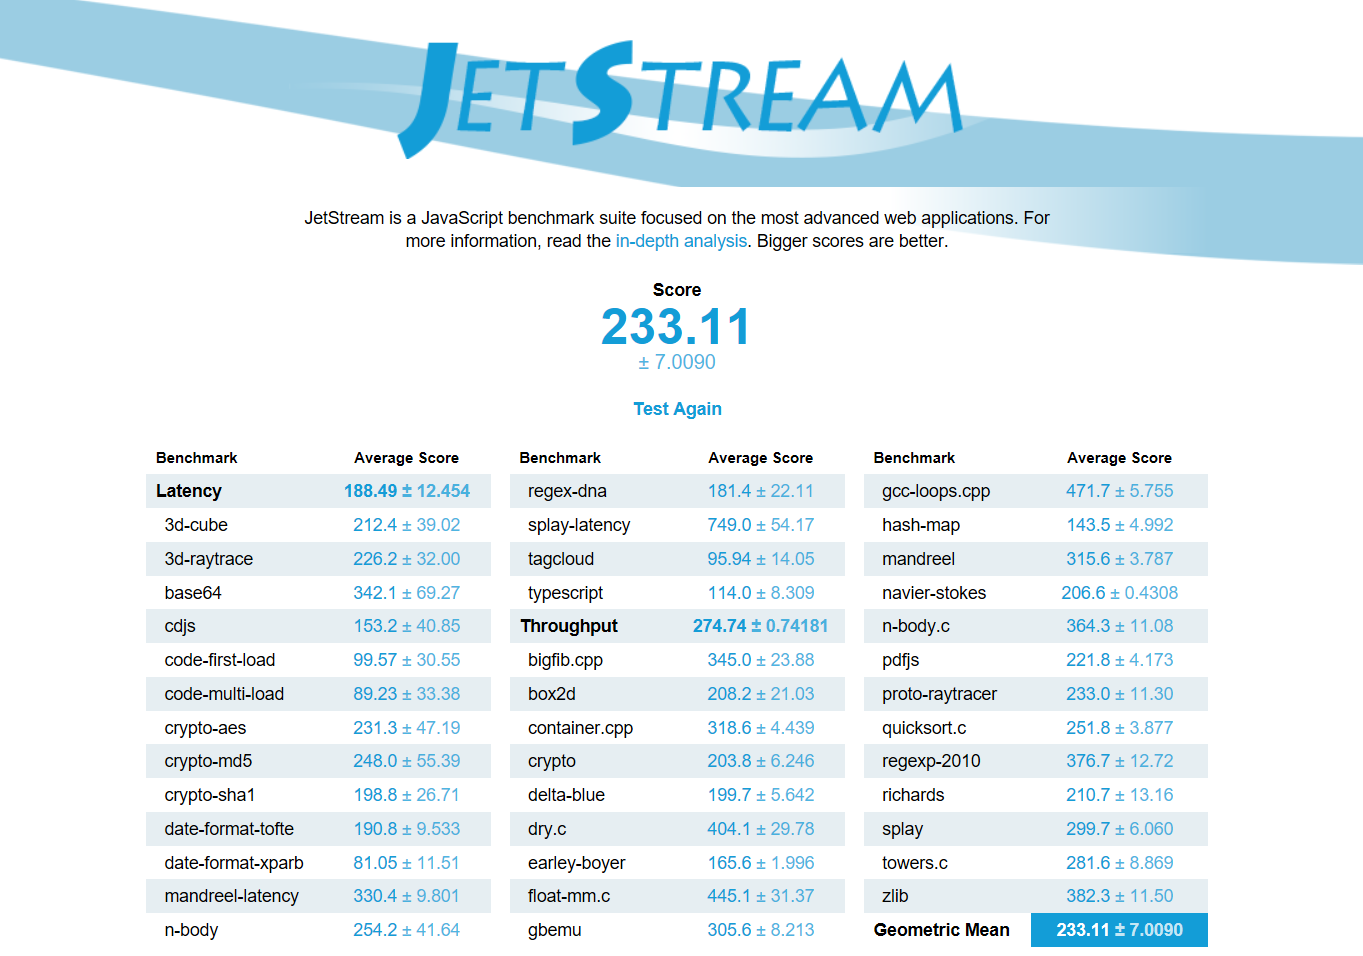
| JetStream 1.1 - Total Score | |
| Lenovo IdeaPad 510-15IKB 80SV0087GE | |
| Dell Inspiron 15 5000 5567-1753 | |
| Acer Aspire E5-575G-549D | |
| HP Pavilion 17-x110ng | |
| Lenovo ThinkPad E470-20H2S00400 | |
| HP Pavilion 15-aw004ng W8Y60EA | |
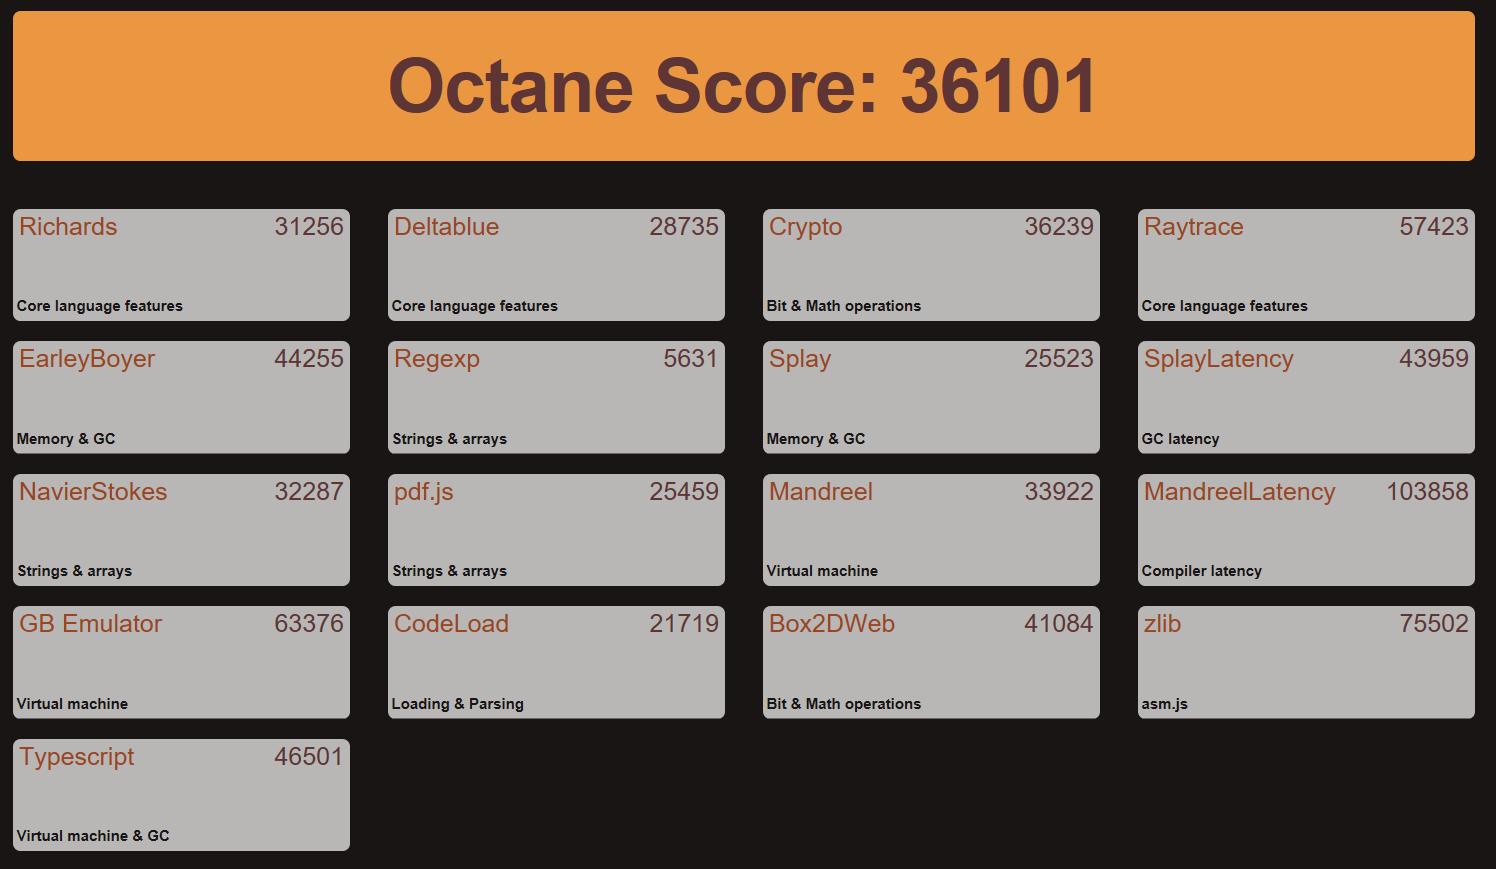
| Octane V2 - Total Score | |
| Dell Inspiron 15 5000 5567-1753 | |
| Lenovo ThinkPad E470-20H2S00400 | |
| HP Pavilion 17-x110ng | |
| Acer Aspire E5-575G-549D | |
| HP Pavilion 15-aw004ng W8Y60EA | |
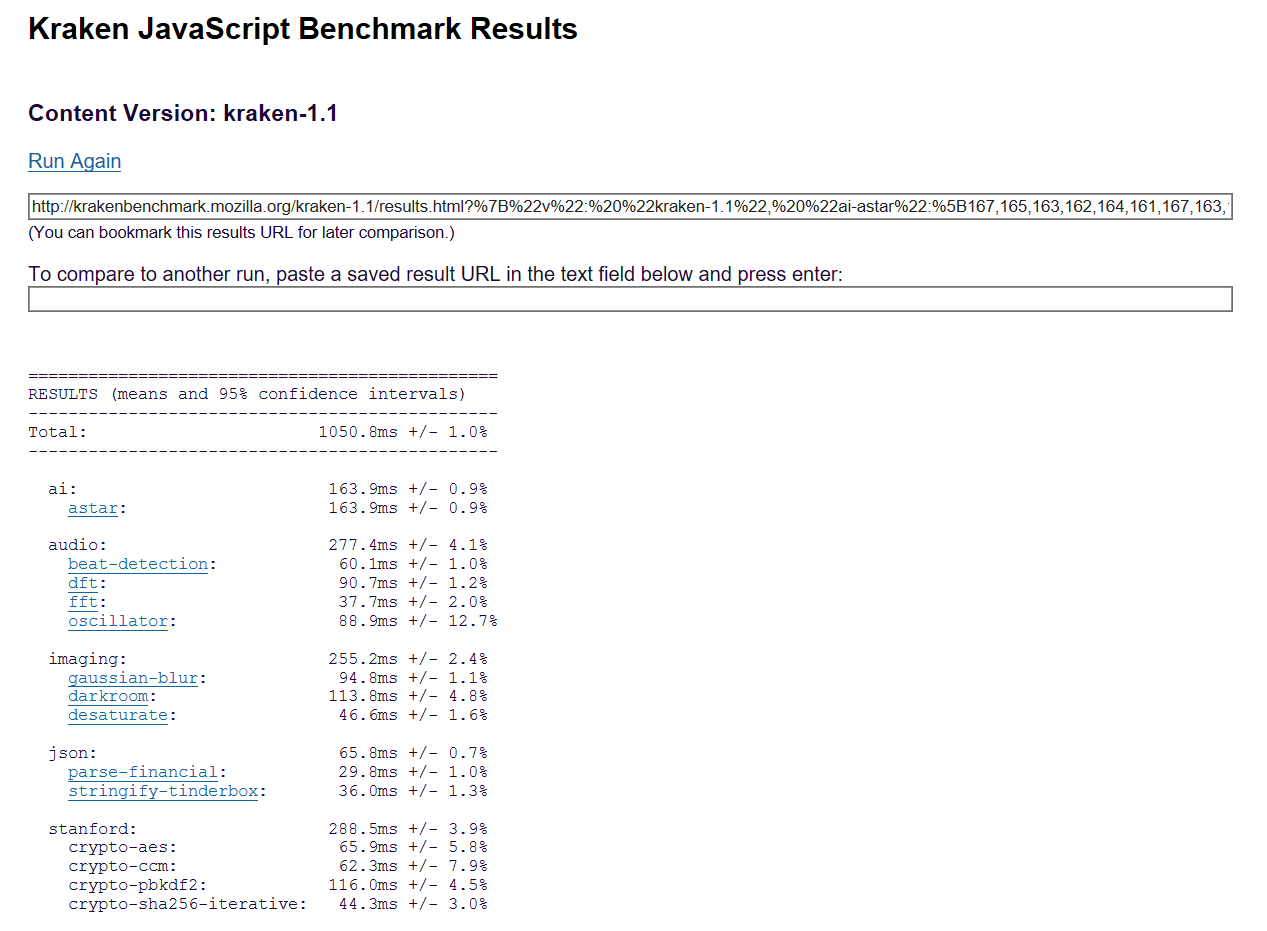
| Mozilla Kraken 1.1 - Total | |
| HP Pavilion 15-aw004ng W8Y60EA | |
| HP Pavilion 17-x110ng | |
| Lenovo ThinkPad E470-20H2S00400 | |
| Acer Aspire E5-575G-549D | |
| Dell Inspiron 15 5000 5567-1753 | |
* ... a kisebb jobb
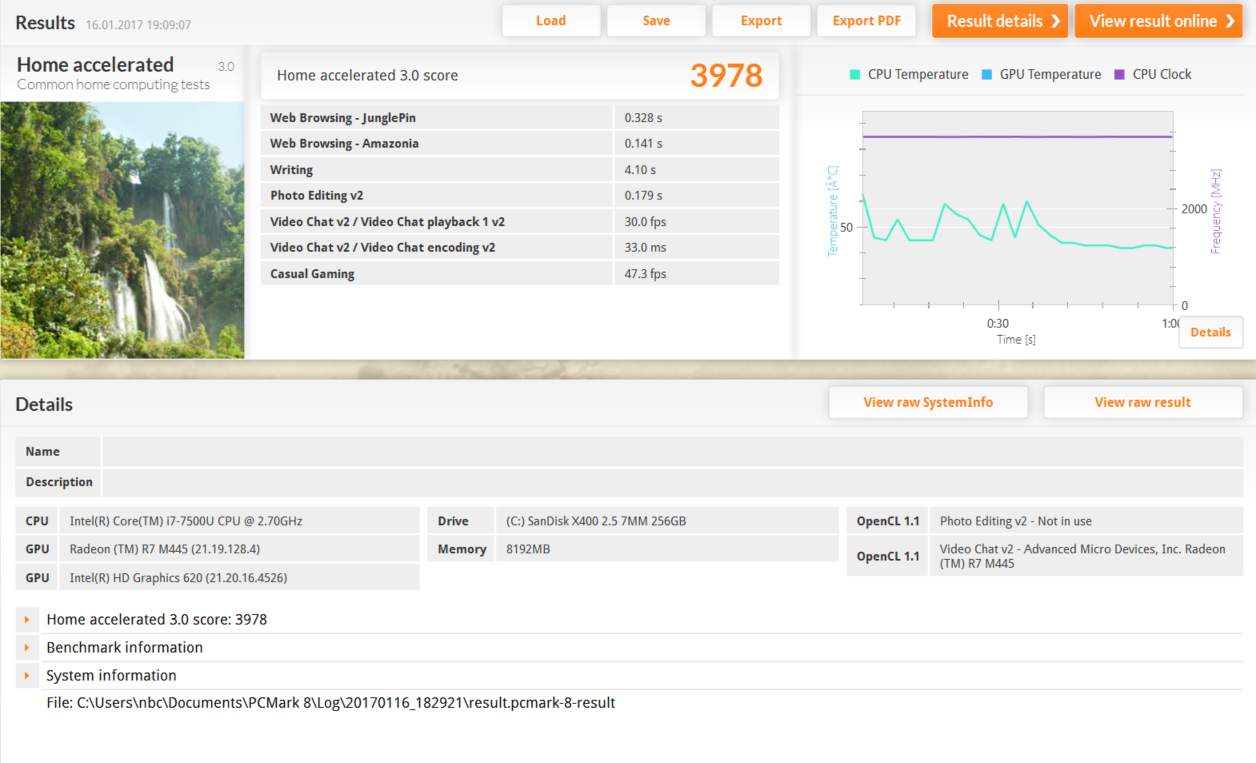
| PCMark 8 | |
| Home Score Accelerated v2 | |
| Dell Inspiron 15 5000 5567-1753 | |
| Lenovo IdeaPad 510-15IKB 80SV0087GE | |
| Lenovo ThinkPad E470-20H2S00400 | |
| Acer Aspire E5-575G-549D | |
| HP Pavilion 17-x110ng | |
| HP Pavilion 15-aw004ng W8Y60EA | |
| Work Score Accelerated v2 | |
| Dell Inspiron 15 5000 5567-1753 | |
| Lenovo ThinkPad E470-20H2S00400 | |
| Acer Aspire E5-575G-549D | |
| HP Pavilion 15-aw004ng W8Y60EA | |
| Creative Score Accelerated v2 | |
| Dell Inspiron 15 5000 5567-1753 | |
| HP Pavilion 17-x110ng | |
| Lenovo ThinkPad E470-20H2S00400 | |
| Acer Aspire E5-575G-549D | |
| HP Pavilion 15-aw004ng W8Y60EA | |
| PCMark 7 | |
| Score | |
| Dell Inspiron 15 5000 5567-1753 | |
| HP Pavilion 17-x110ng | |
| HP Pavilion 15-aw004ng W8Y60EA | |
| Productivity | |
| Dell Inspiron 15 5000 5567-1753 | |
| HP Pavilion 17-x110ng | |
| HP Pavilion 15-aw004ng W8Y60EA | |
| Entertainment | |
| Dell Inspiron 15 5000 5567-1753 | |
| HP Pavilion 17-x110ng | |
| HP Pavilion 15-aw004ng W8Y60EA | |
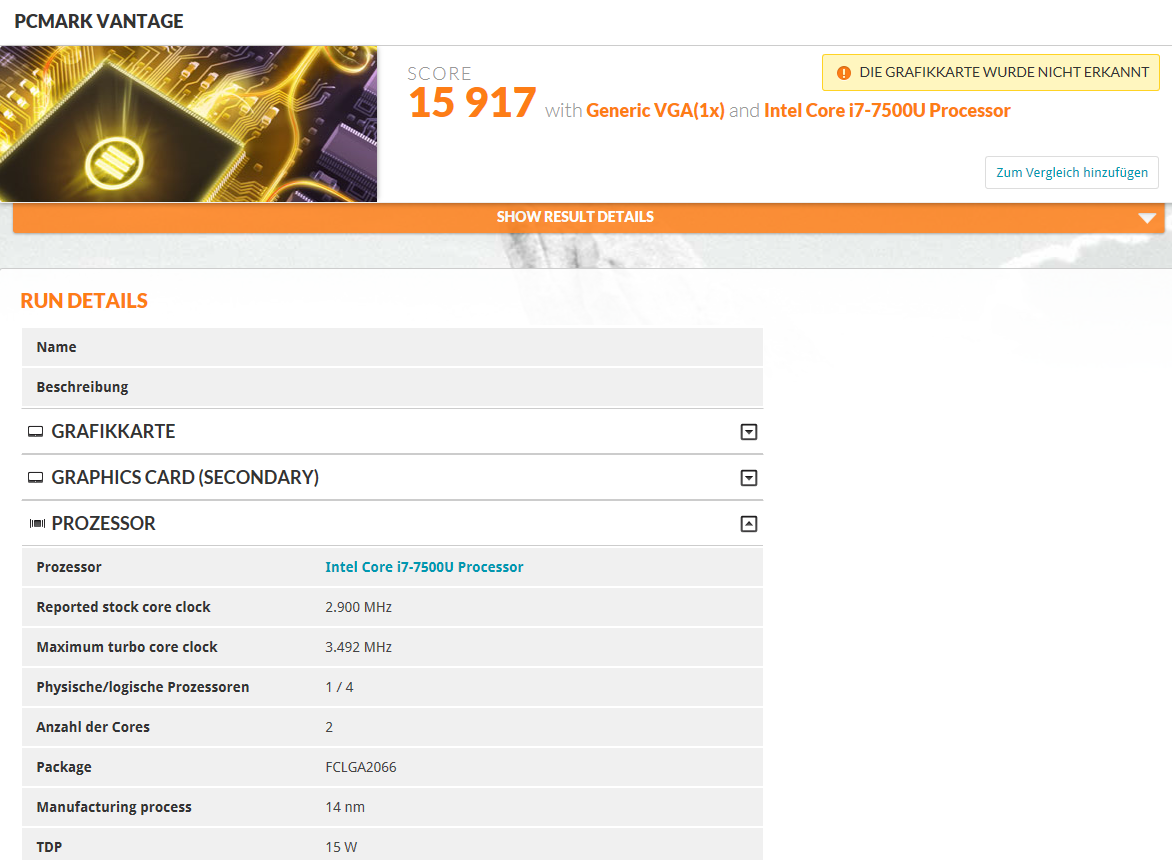
| PCMark Vantage Result | 15917 pontok | |
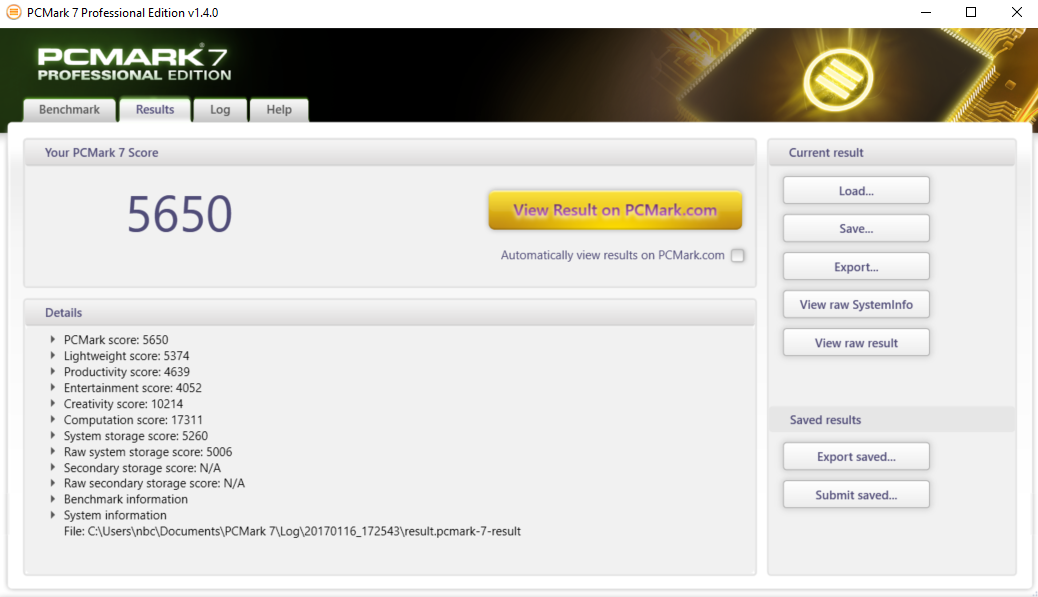
| PCMark 7 Score | 5650 pontok | |
| PCMark 8 Home Score Accelerated v2 | 3978 pontok | |
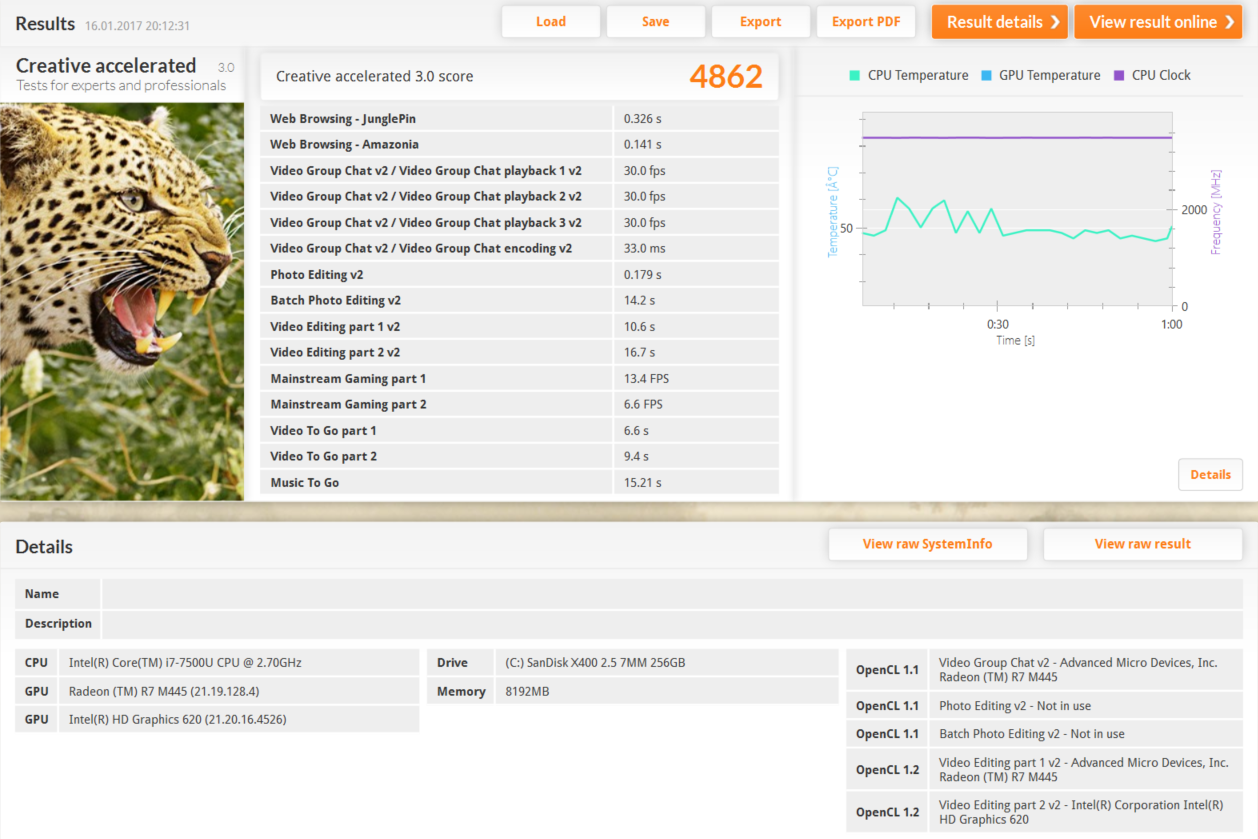
| PCMark 8 Creative Score Accelerated v2 | 4862 pontok | |
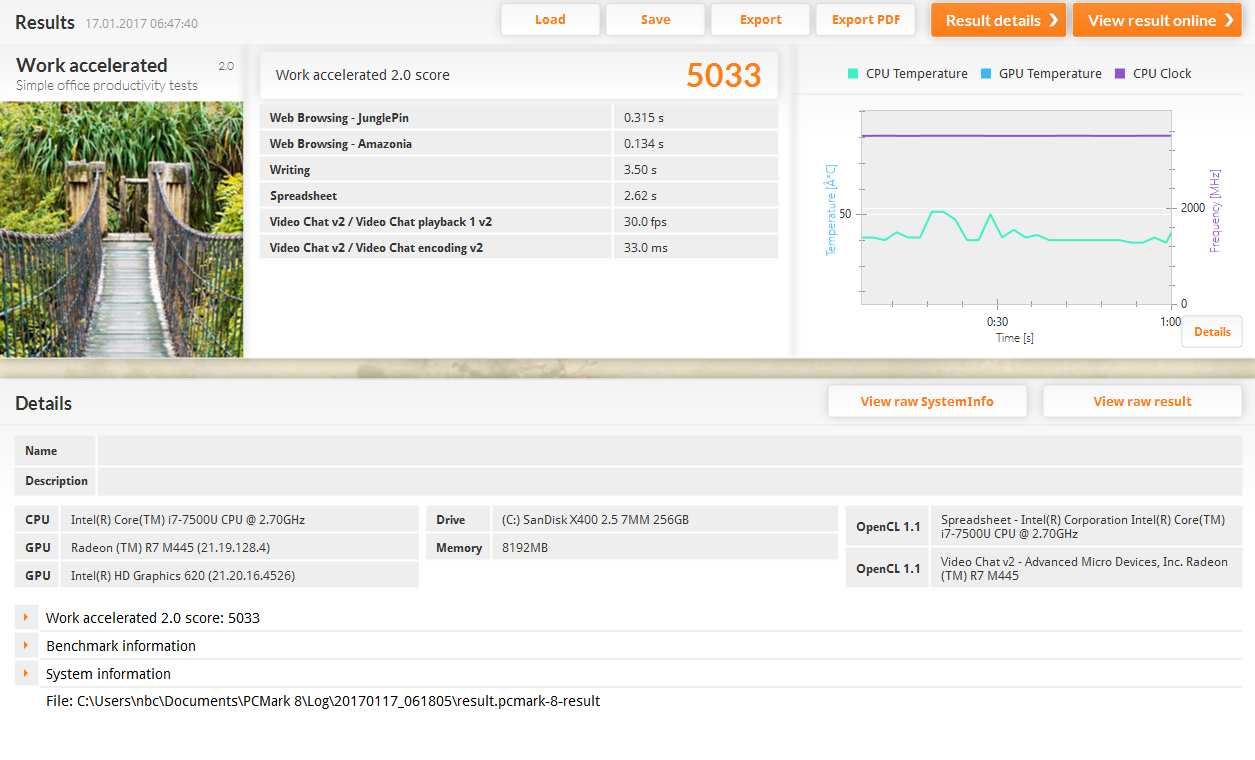
| PCMark 8 Work Score Accelerated v2 | 5033 pontok | |
Segítség | ||


| Dell Inspiron 15 5000 5567-1753 SanDisk X400 SED 256GB, SATA (SD8TB8U-256G) | Acer Aspire E5-575G-549D Toshiba MQ01ABD100 | Lenovo IdeaPad 510-15IKB 80SV0087GE Liteonit CV3-DE256 | Lenovo ThinkPad E470-20H2S00400 SanDisk X400 SED 256GB, SATA (SD8TB8U-256G) | HP Pavilion 15-aw004ng W8Y60EA | HP Pavilion 17-x110ng SanDisk Z400s SD8SNAT-256G | |
|---|---|---|---|---|---|---|
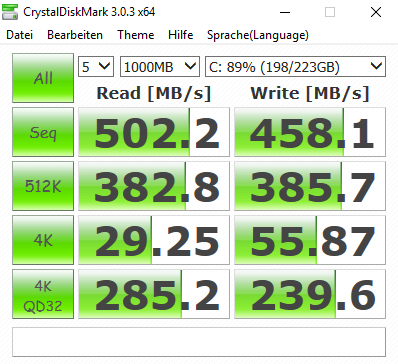
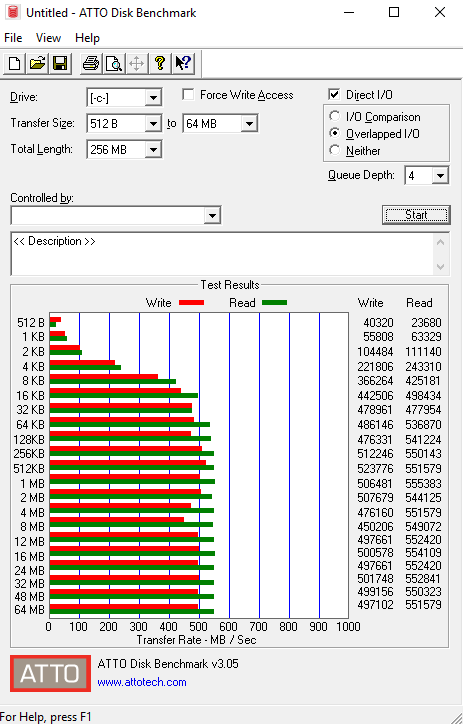
| CrystalDiskMark 3.0 | -93% | 0% | -1% | -31% | -15% | |
| Read Seq | 502 | 95.3 -81% | 469.2 -7% | 476.5 -5% | 503 0% | 500 0% |
| Write Seq | 458.1 | 85.6 -81% | 431.5 -6% | 458.7 0% | 316.6 -31% | 325.1 -29% |
| Read 512 | 382.8 | 29.32 -92% | 338.3 -12% | 346.4 -10% | 261.9 -32% | 290.2 -24% |
| Write 512 | 385.7 | 25.93 -93% | 297.9 -23% | 291.1 -25% | 281.2 -27% | 300.3 -22% |
| Read 4k | 29.25 | 0.366 -99% | 28.68 -2% | 35.15 20% | 17.04 -42% | 11.24 -62% |
| Write 4k | 55.9 | 0.726 -99% | 66.8 19% | 78.8 41% | 46.55 -17% | 86 54% |
| Read 4k QD32 | 285.2 | 0.647 -100% | 364.7 28% | 276 -3% | 125 -56% | 145.4 -49% |
| Write 4k QD32 | 239.6 | 0.722 -100% | 245.9 3% | 178.3 -26% | 131.4 -45% | 272.7 14% |


| 3DMark | |
| 1280x720 Cloud Gate Standard Graphics | |
| Acer Aspire E5-575G-549D | |
| HP Pavilion 15-aw004ng W8Y60EA | |
| Dell Inspiron 15 5000 5567-1753 | |
| Lenovo ThinkPad E470-20H2S00400 | |
| HP Pavilion 17-x110ng | |
| 1920x1080 Fire Strike Graphics | |
| Acer Aspire E5-575G-549D | |
| HP Pavilion 15-aw004ng W8Y60EA | |
| Lenovo ThinkPad E470-20H2S00400 | |
| Dell Inspiron 15 5000 5567-1753 | |
| HP Pavilion 17-x110ng | |
| 3DMark 11 - 1280x720 Performance GPU | |
| Acer Aspire E5-575G-549D | |
| HP Pavilion 15-aw004ng W8Y60EA | |
| Lenovo ThinkPad E470-20H2S00400 | |
| Lenovo IdeaPad 510-15IKB 80SV0087GE | |
| HP Pavilion 17-x110ng | |
| Dell Inspiron 15 5000 5567-1753 | |
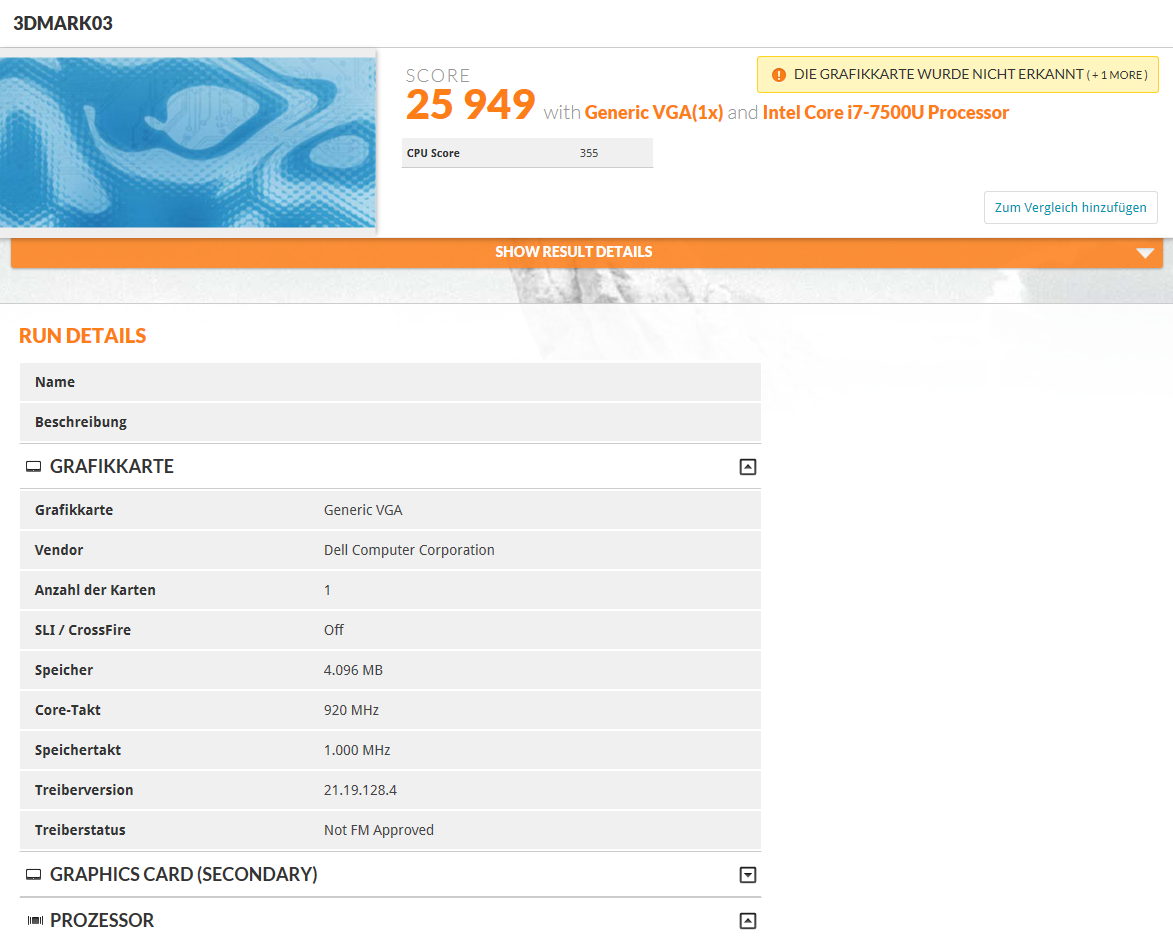
| 3DMark 03 Standard | 25949 pontok | |
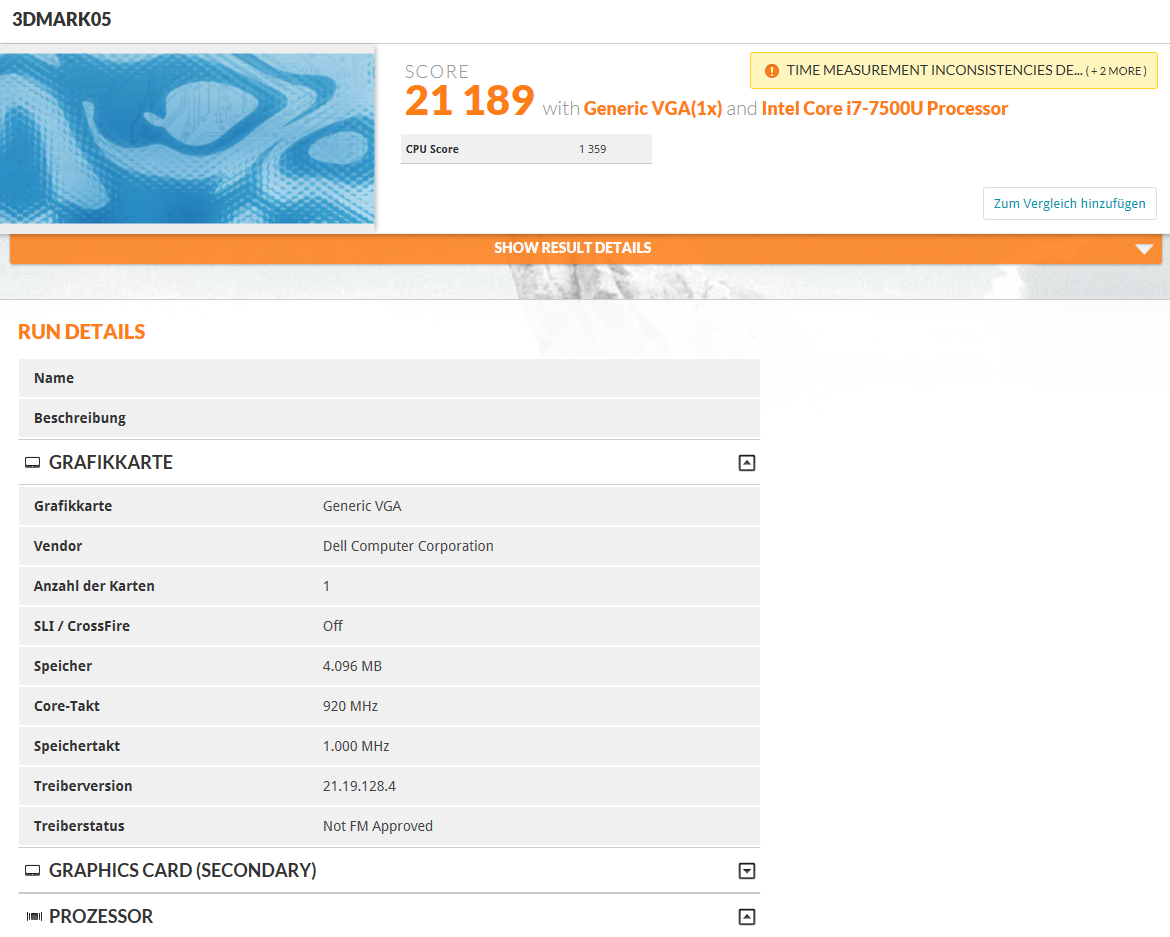
| 3DMark 05 Standard | 21189 pontok | |
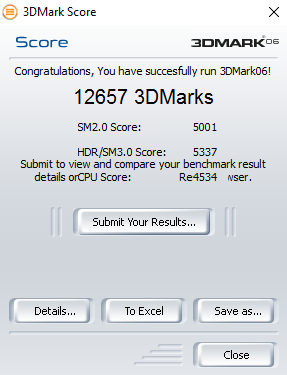
| 3DMark 06 Standard Score | 12657 pontok | |
| 3DMark Vantage P Result | 6872 pontok | |
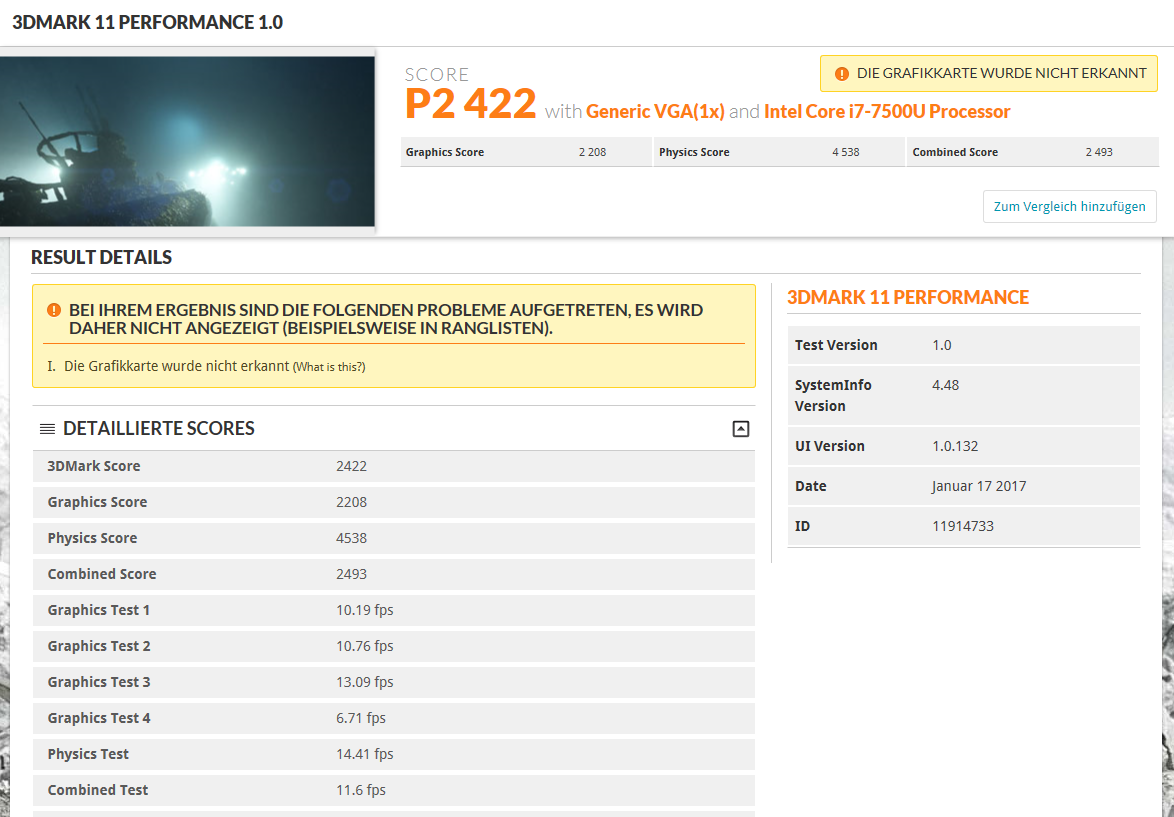
| 3DMark 11 Performance | 2422 pontok | |
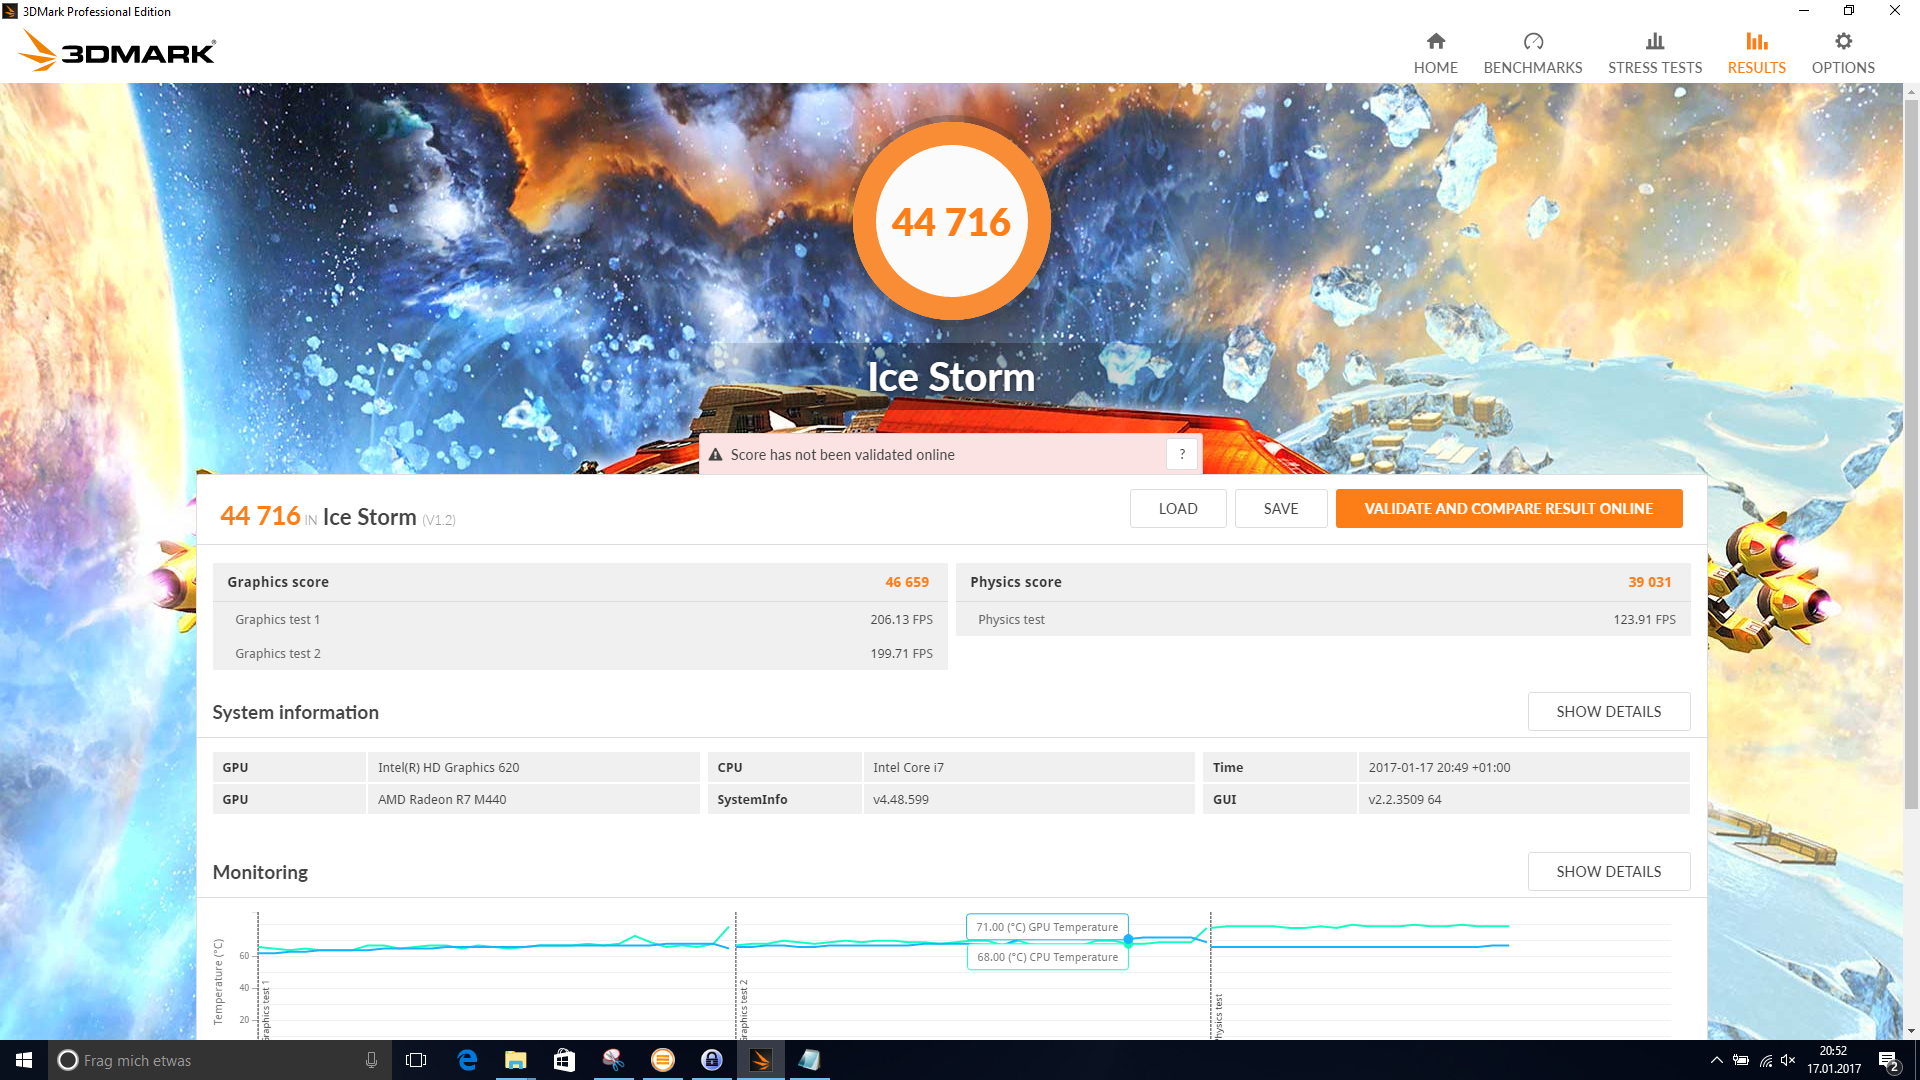
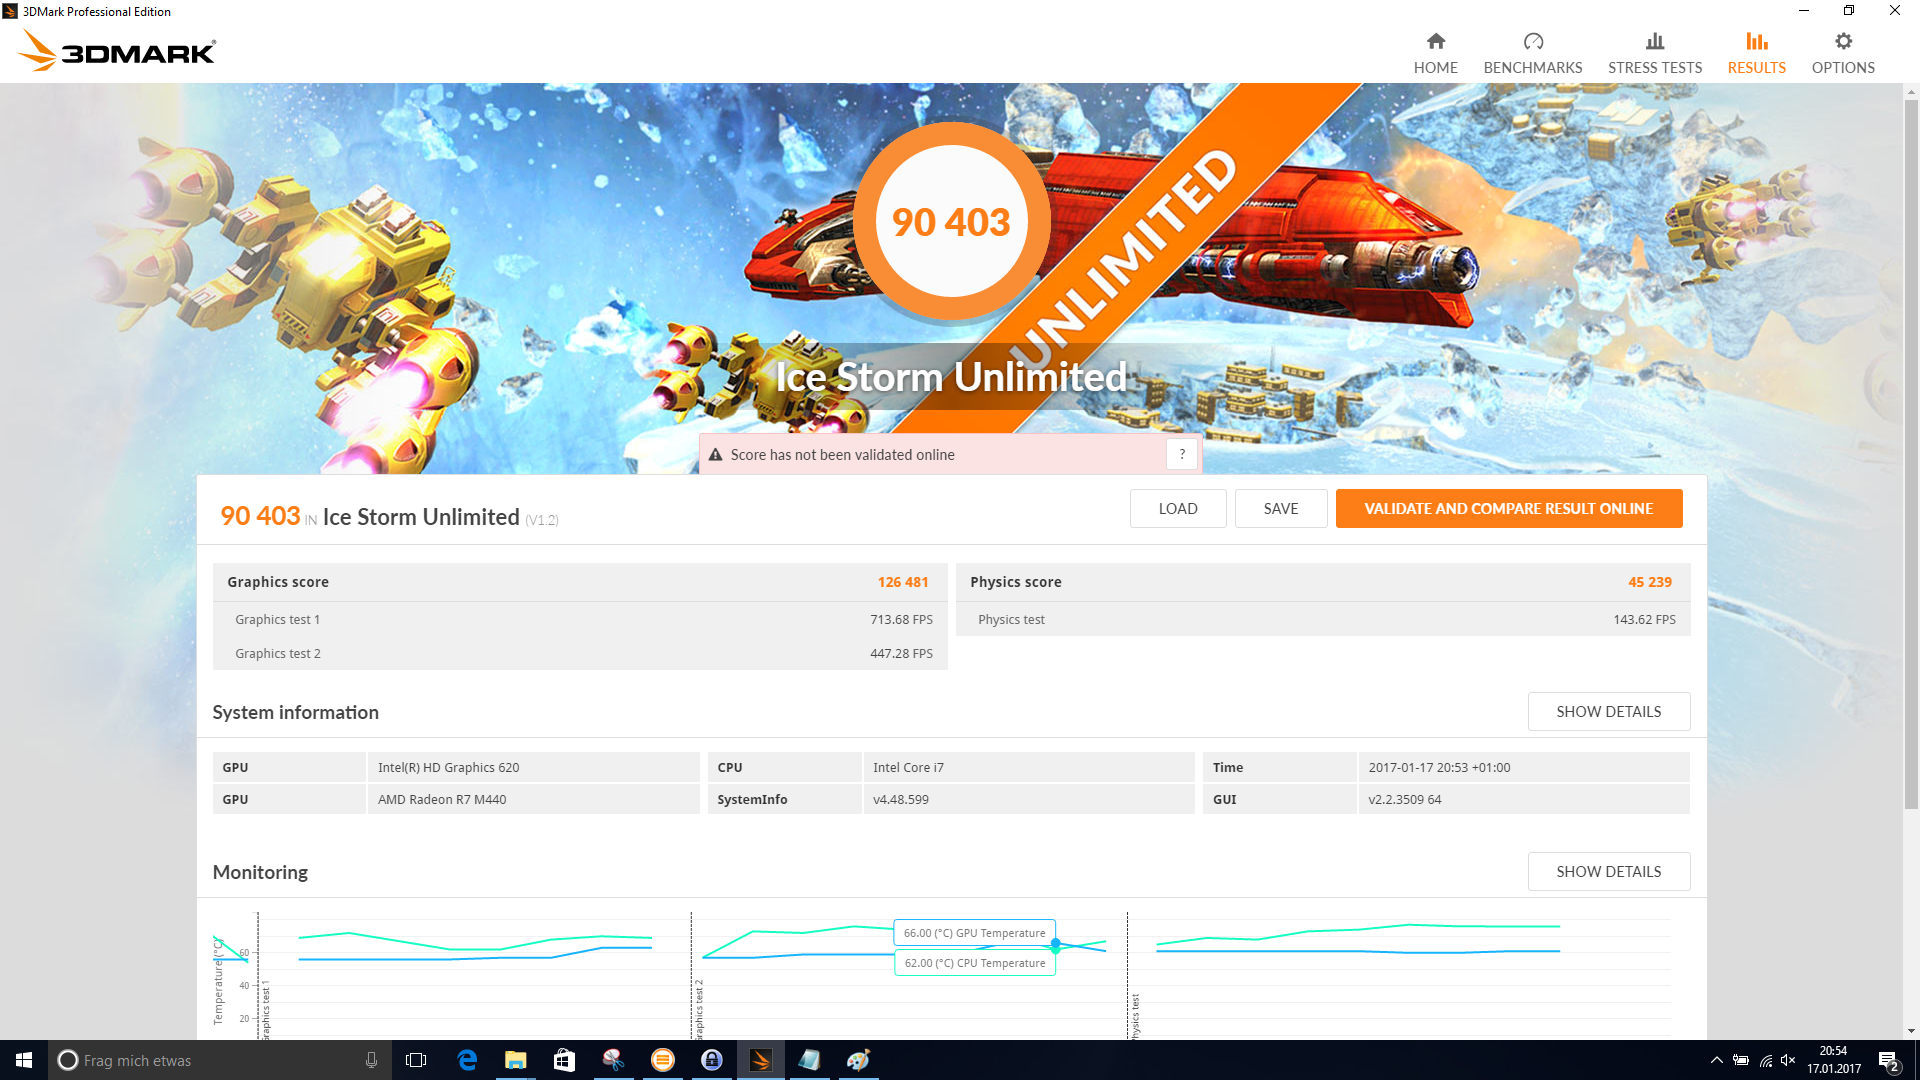
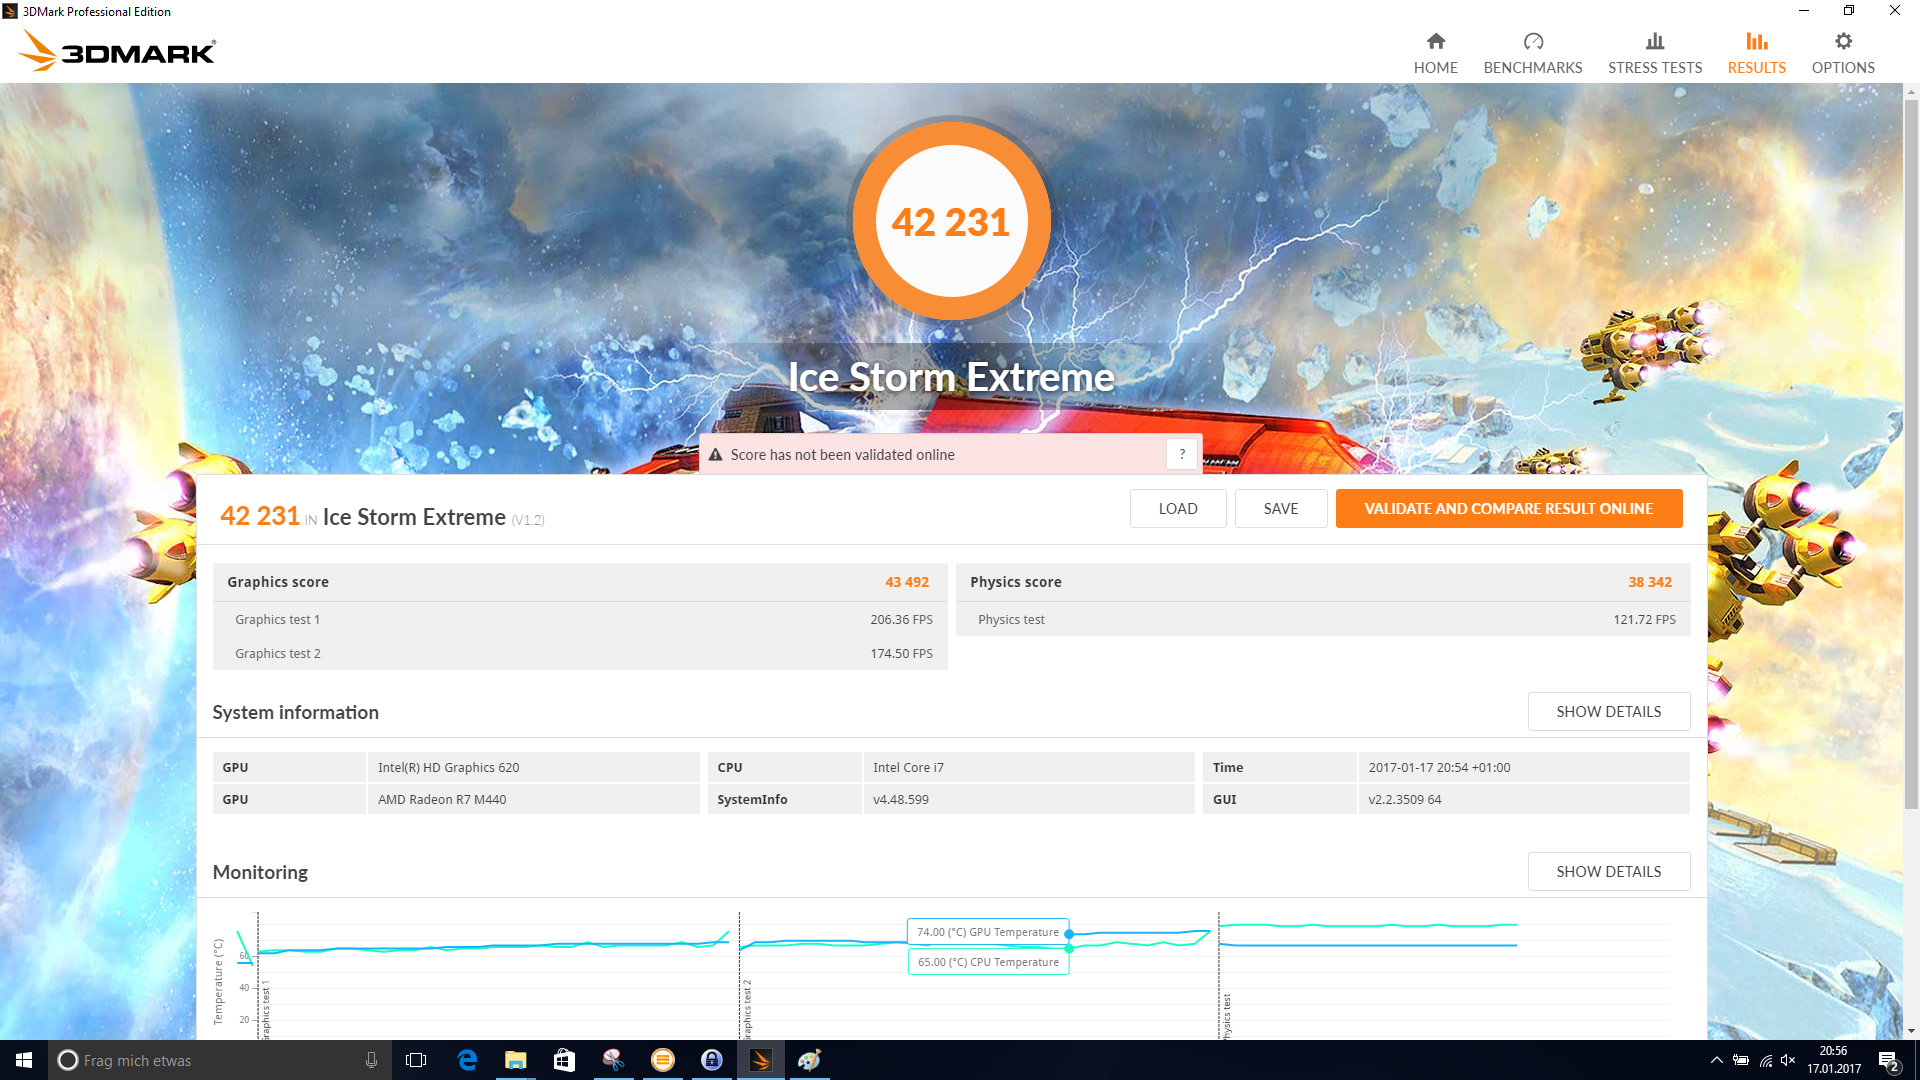
| 3DMark Ice Storm Standard Score | 44716 pontok | |
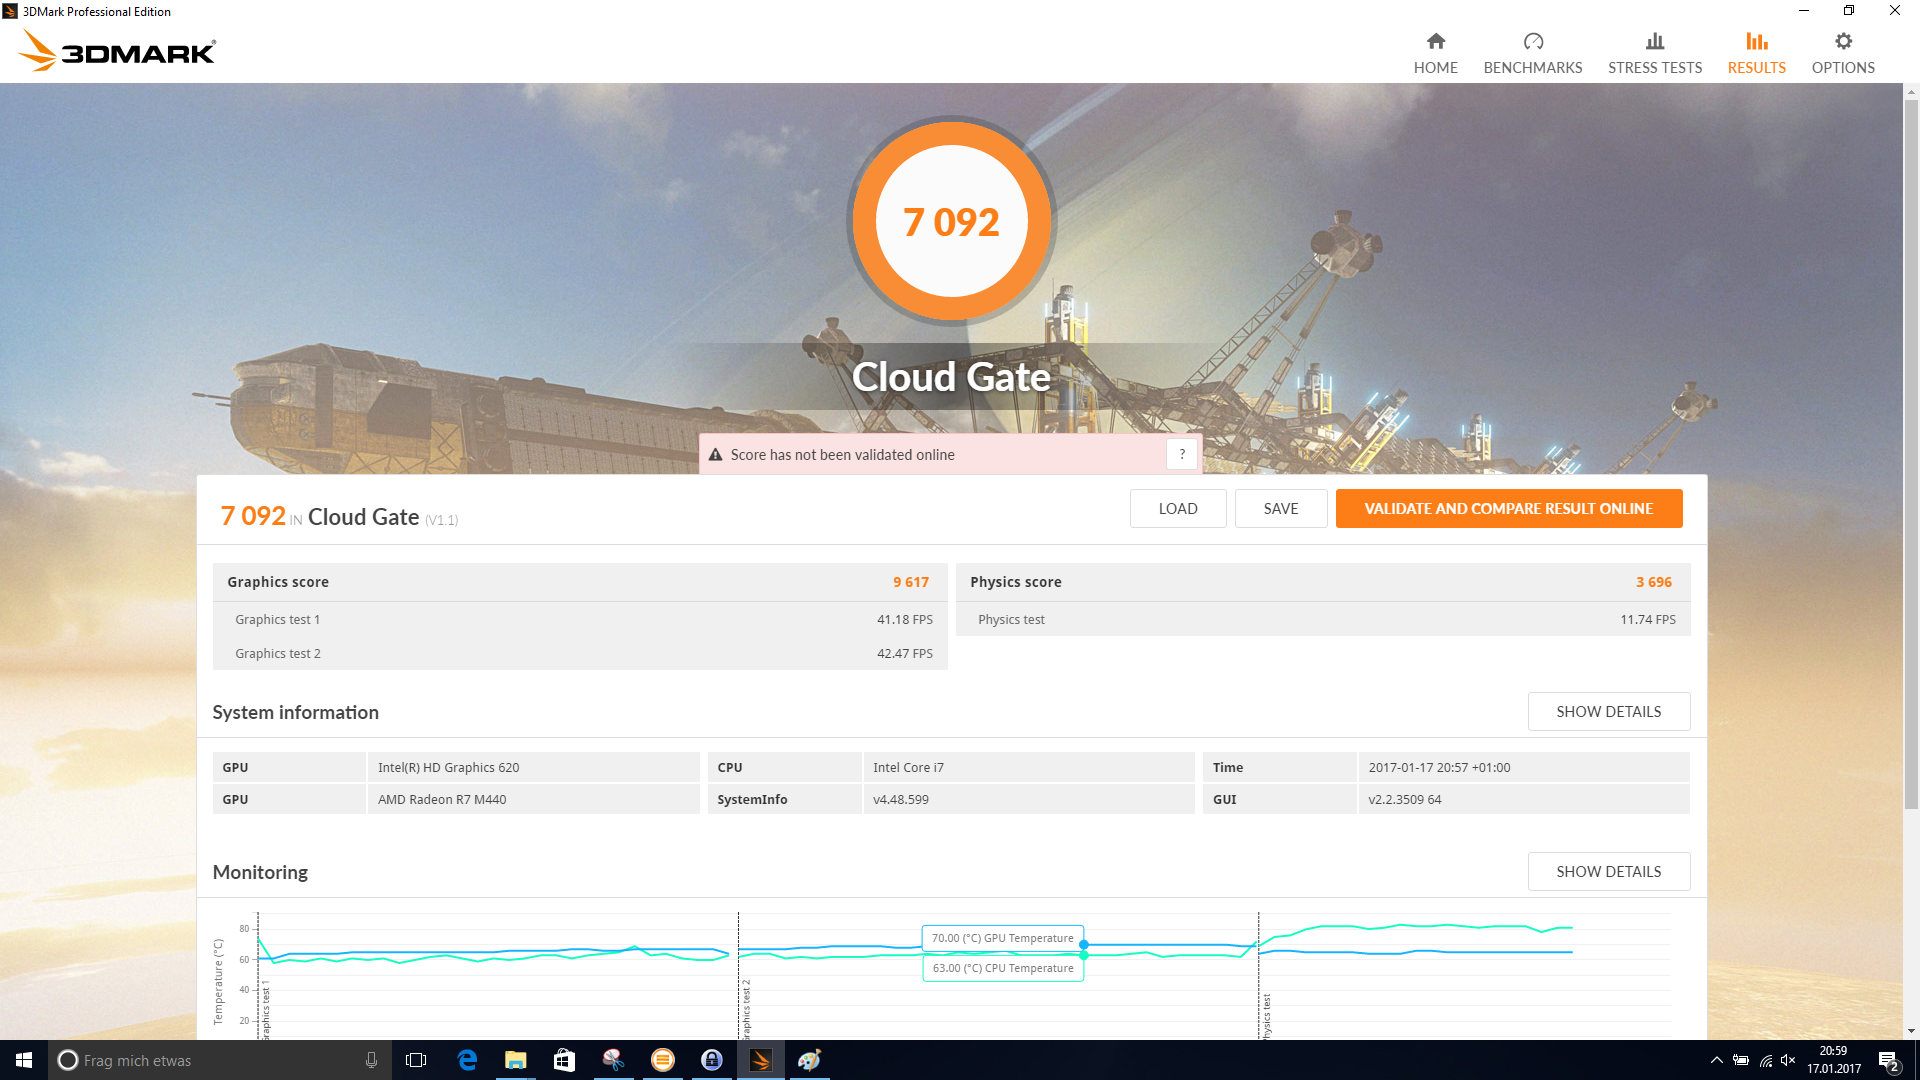
| 3DMark Cloud Gate Standard Score | 7092 pontok | |
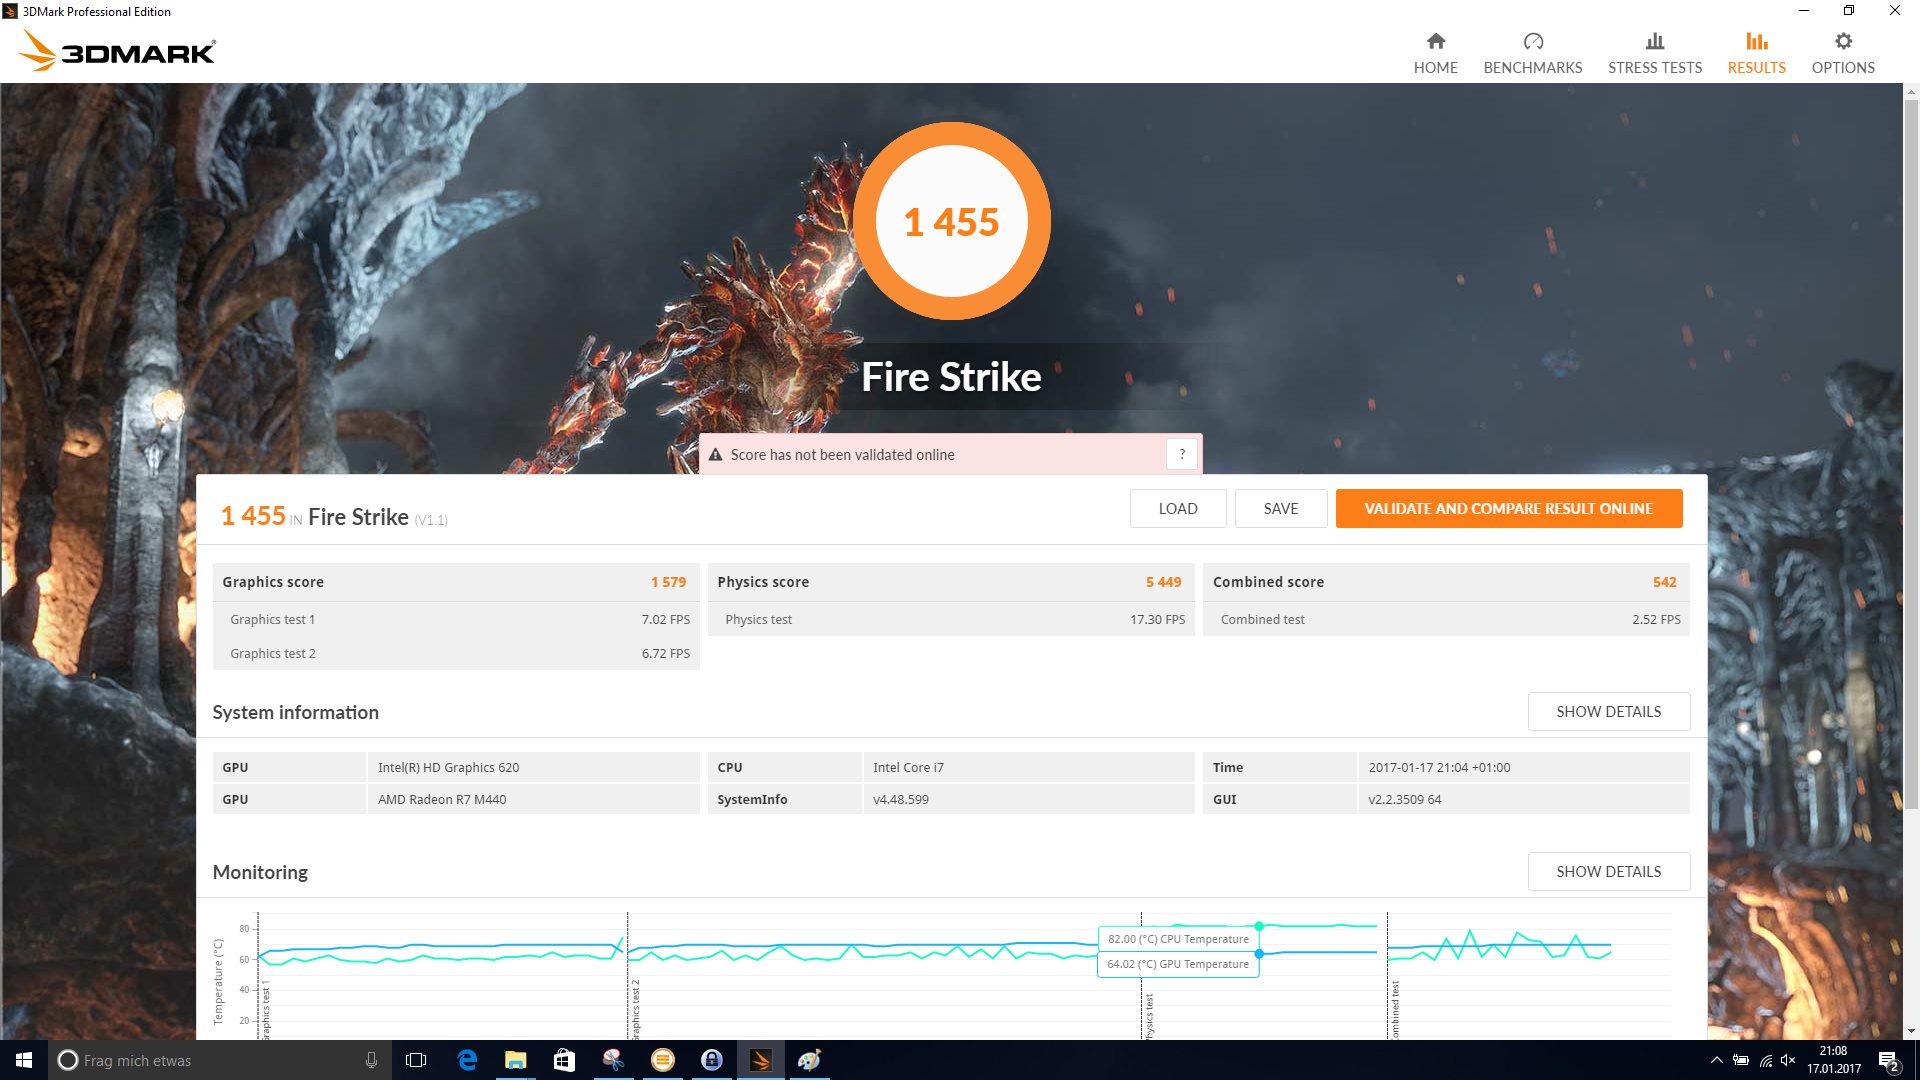
| 3DMark Fire Strike Score | 1455 pontok | |
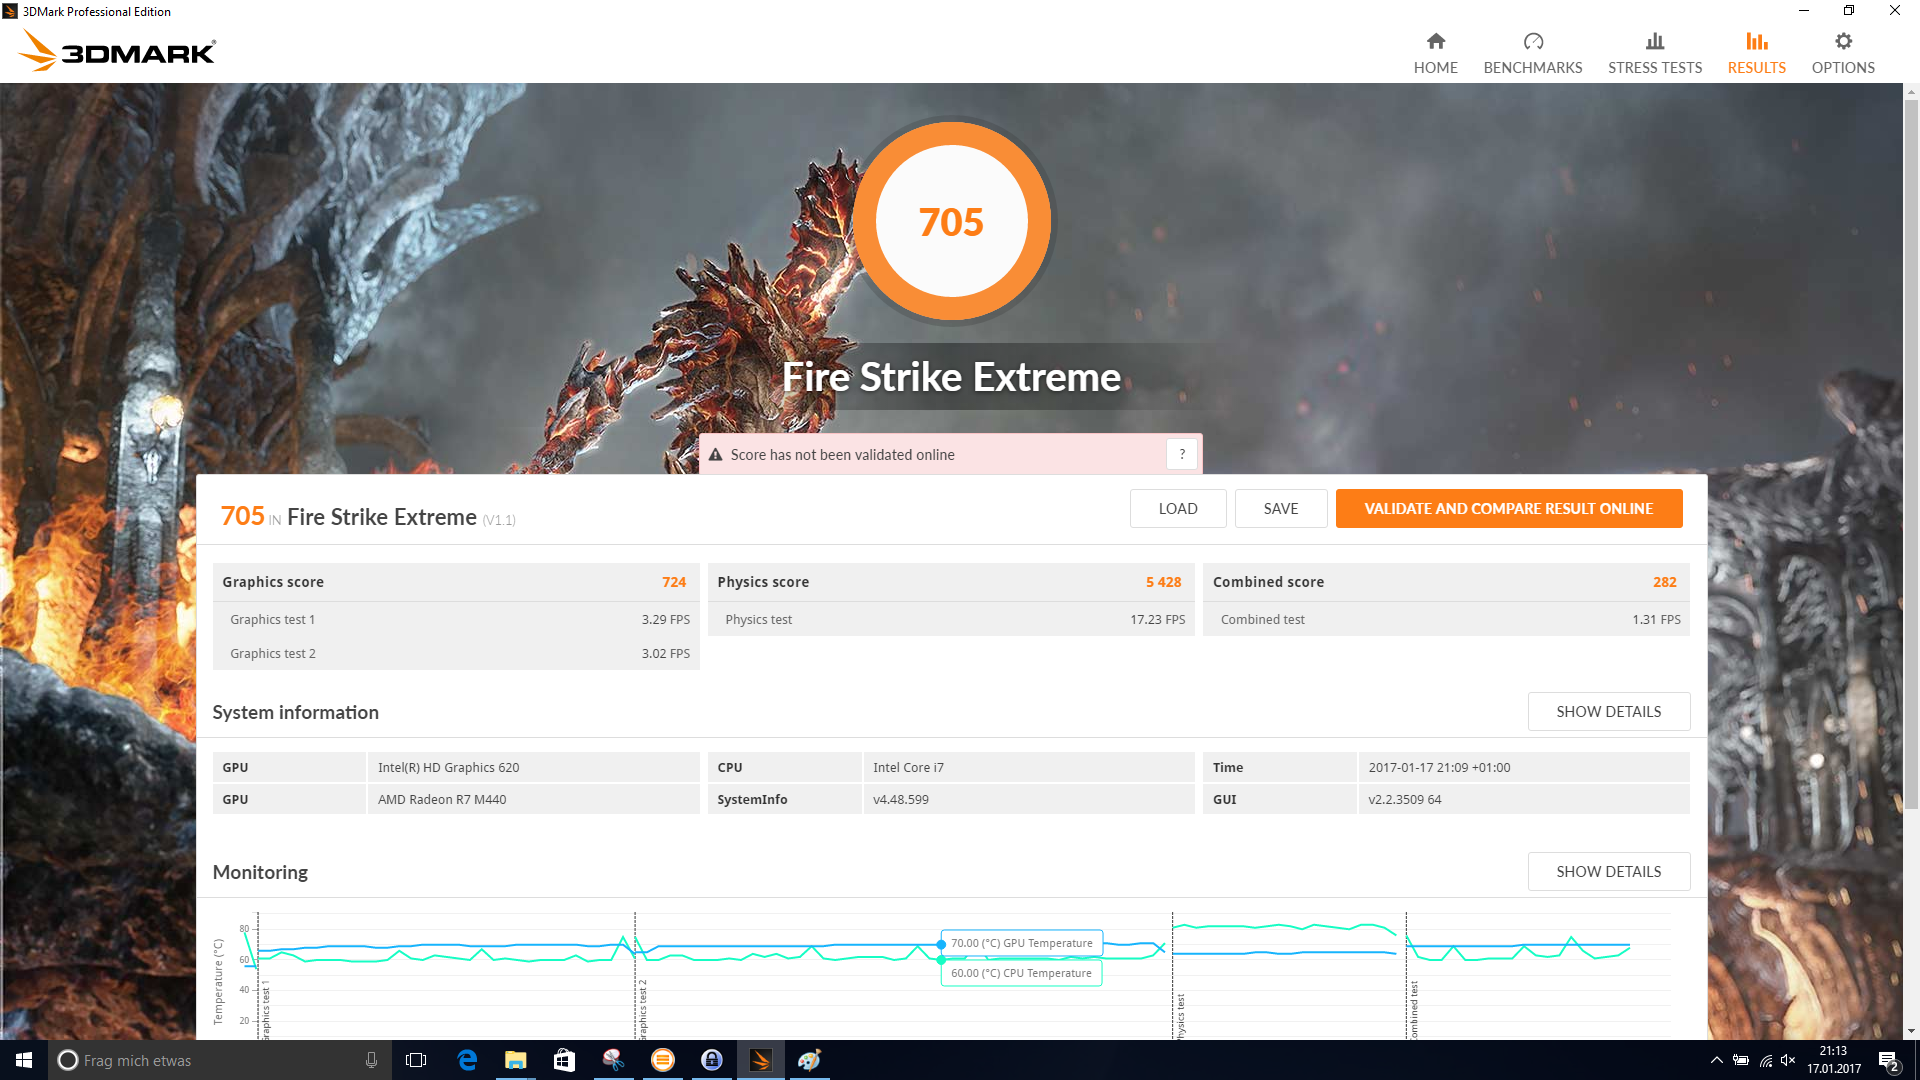
| 3DMark Fire Strike Extreme Score | 705 pontok | |
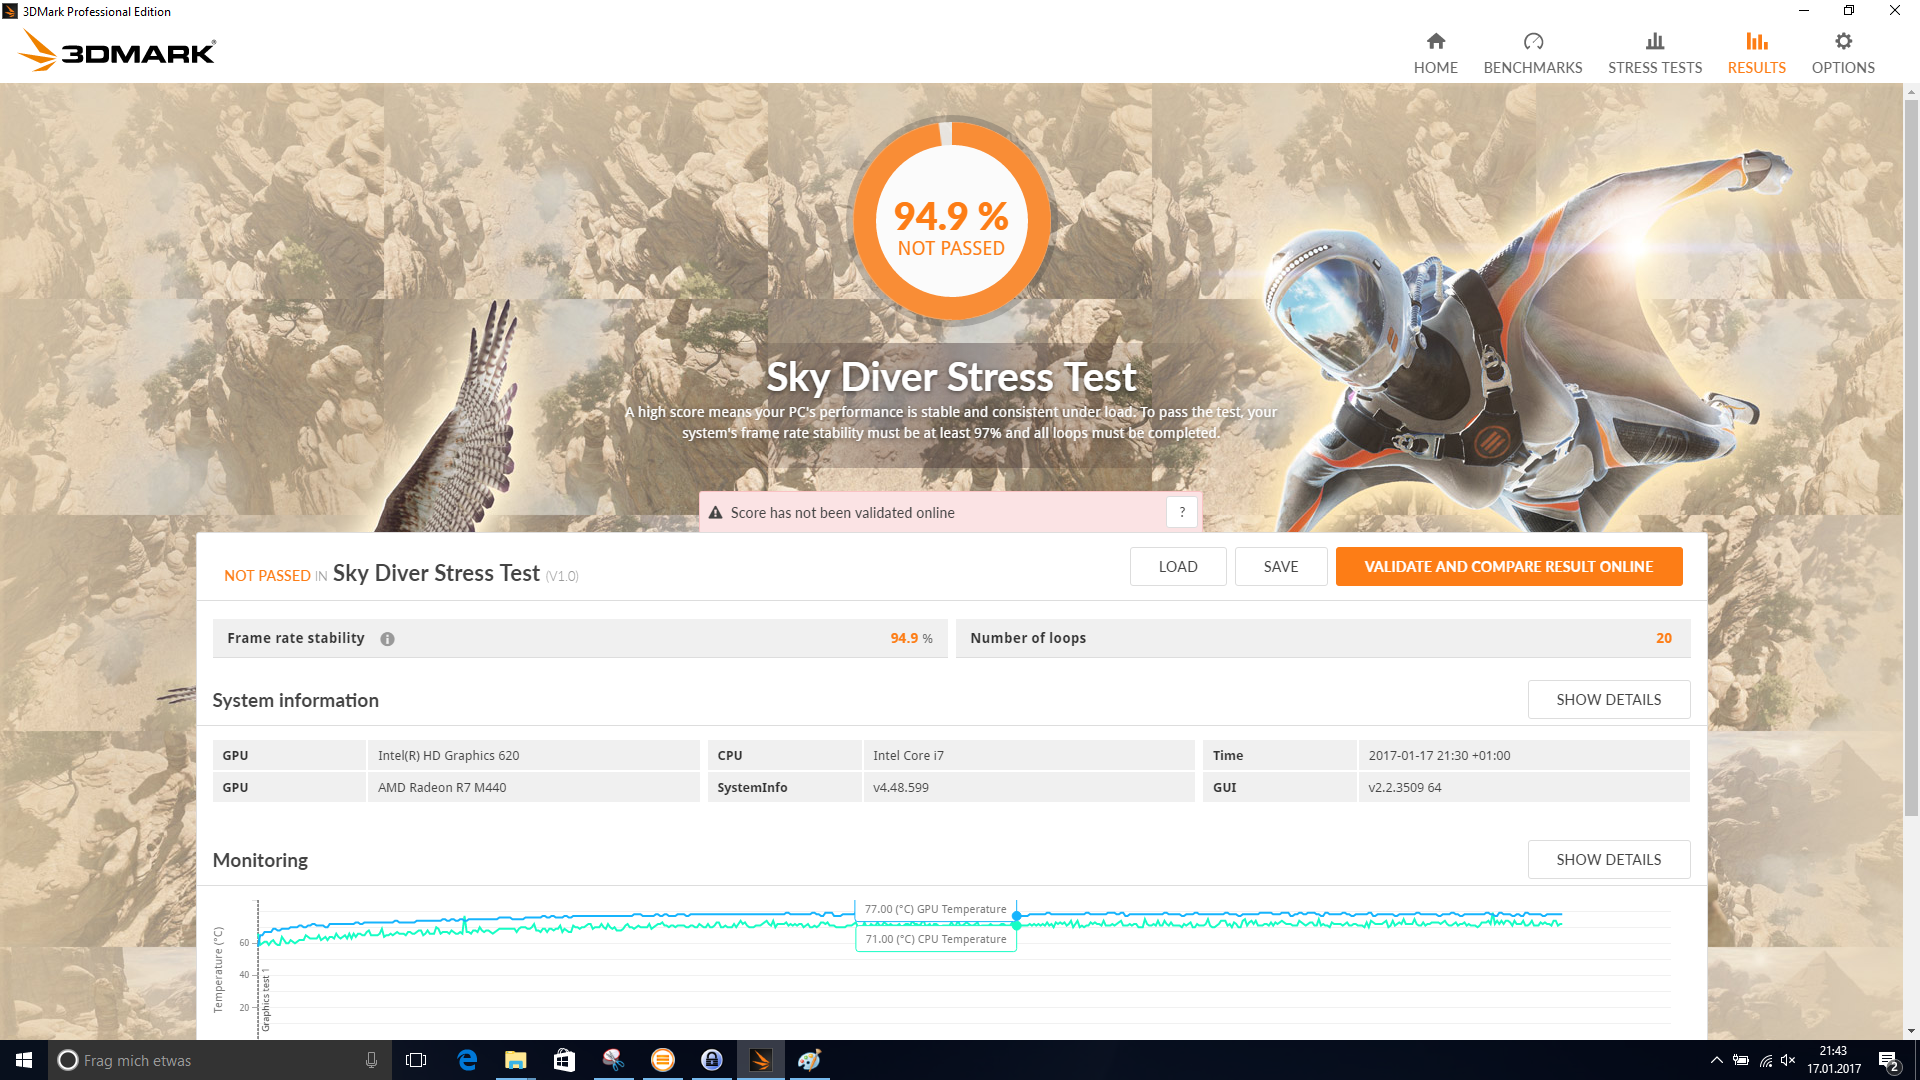
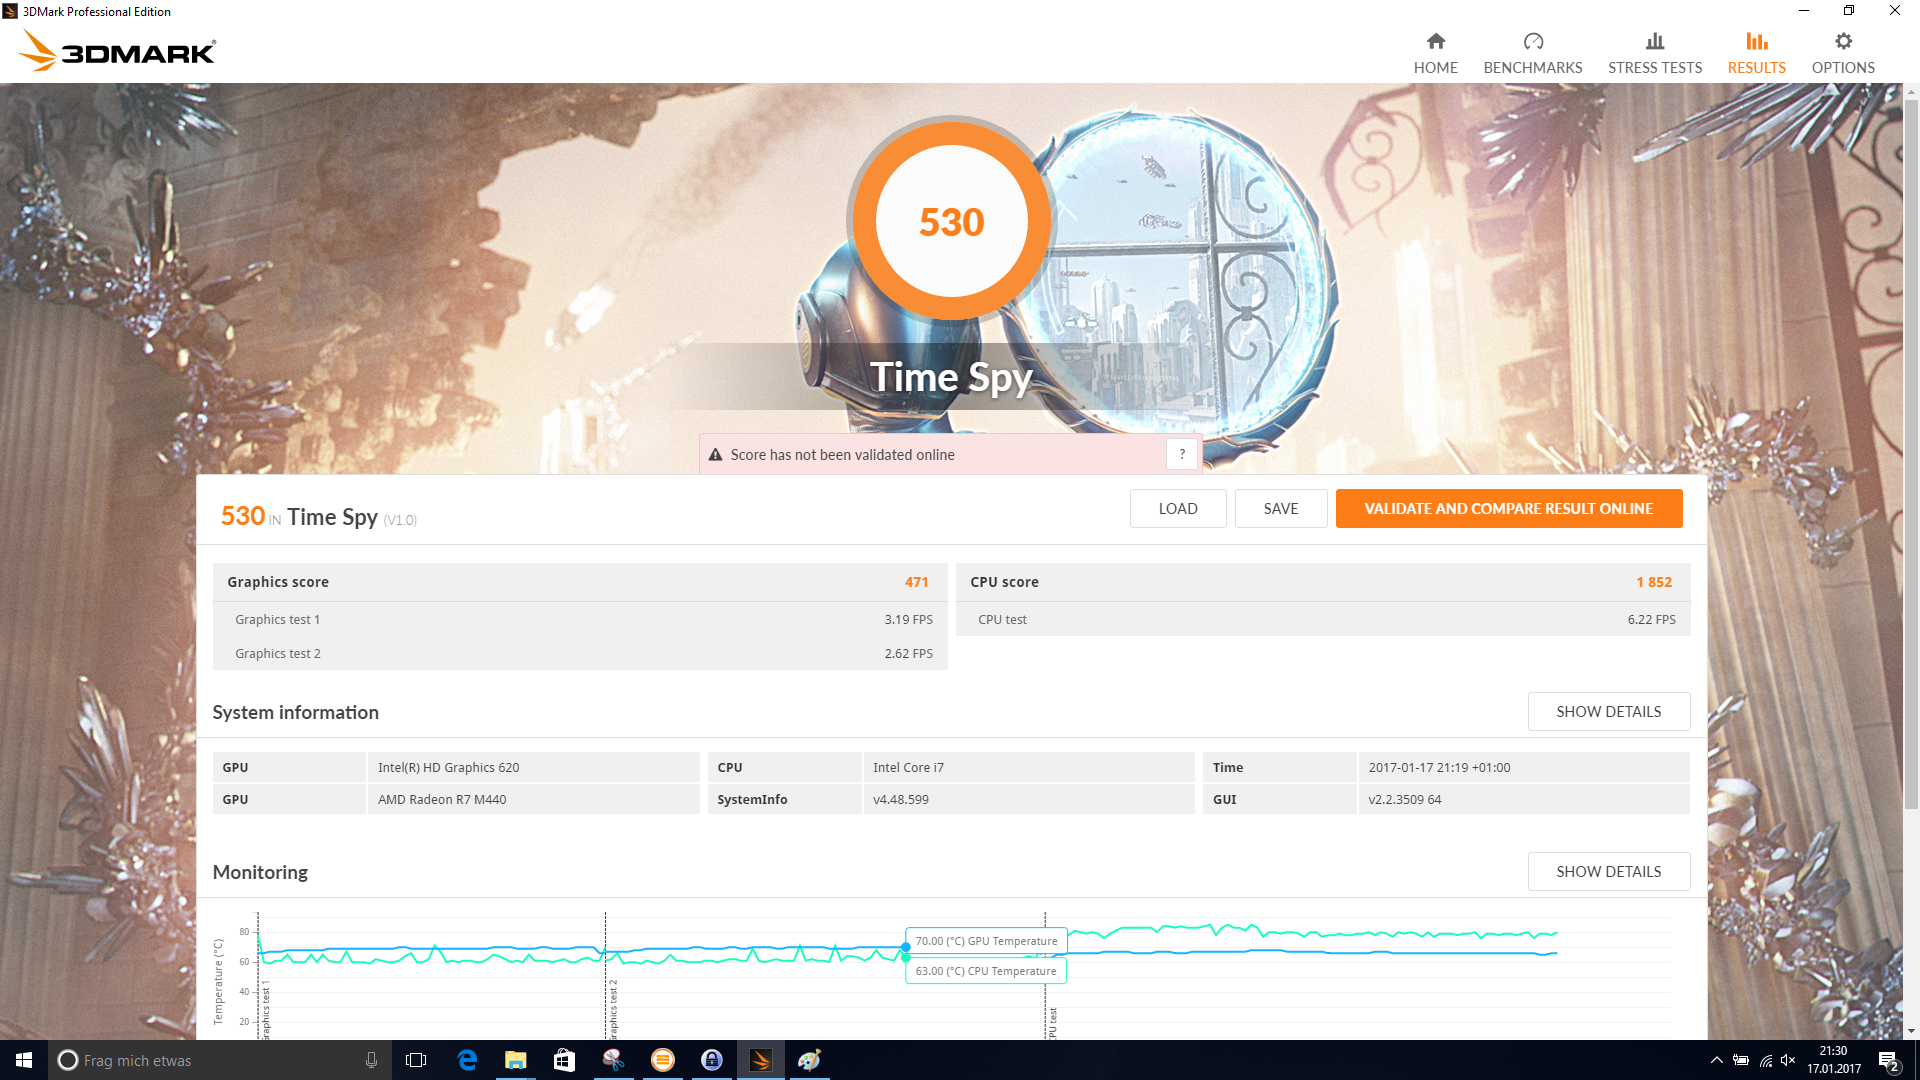
| 3DMark Time Spy Score | 530 pontok | |
Segítség | ||
| BioShock Infinite - 1366x768 Medium Preset | |
| Acer Aspire E5-575G-549D | |
| Dell Inspiron 15 5000 5567-1753 | |
| Lenovo ThinkPad E470-20H2S00400 | |
| Lenovo IdeaPad 510-15IKB 80SV0087GE | |
| HP Pavilion 15-aw004ng W8Y60EA | |
| HP Pavilion 17-x110ng | |
| Rise of the Tomb Raider - 1366x768 Medium Preset AF:2x | |
| Acer Aspire E5-575G-549D | |
| Dell Inspiron 15 5000 5567-1753 | |
| HP Pavilion 15-aw004ng W8Y60EA | |
| HP Pavilion 17-x110ng | |
| Battlefield 4 - 1366x768 Medium Preset | |
| Acer Aspire E5-575G-549D | |
| Dell Inspiron 15 5000 5567-1753 | |
| Lenovo ThinkPad E470-20H2S00400 | |
| HP Pavilion 15-aw004ng W8Y60EA | |
| HP Pavilion 17-x110ng | |
| alacsony | közepes | magas | ultra | |
| BioShock Infinite (2013) | 98.7 | 53.9 | 44.5 | 13.8 |
| Battlefield 4 (2013) | 74.3 | 49.6 | 32.7 | 11.7 |
| Sims 4 (2014) | 132.9 | 66.9 | 28.8 | 27.4 |
| GTA V (2015) | 50.7 | 43.7 | 12.2 | |
| The Witcher 3 (2015) | 30.8 | 18.2 | 9.6 | 4.7 |
| Rainbow Six Siege (2015) | 64.4 | 37.8 | 20.1 | 13.5 |
| Rise of the Tomb Raider (2016) | 29.6 | 15.1 | 8.5 | 6.7 |
| XCOM 2 (2016) | 22.8 | 7.9 | 5.2 | 4.9 |
| Far Cry Primal (2016) | 27 | 12 | 10 | |
| The Division (2016) | 32.4 | 24.5 | 9.6 | 6.7 |
| Doom (2016) | 35 | 28 | 14 | |
| Overwatch (2016) | 75.3 | 52.6 | 23.5 | 14.1 |
| Deus Ex Mankind Divided (2016) | 21 | 14 | 7 | |
| FIFA 17 (2016) | 61.8 | 59.7 | 34.6 | 29.4 |
| Battlefield 1 (2016) | 40 | 28 | 13 | 12 |
| Farming Simulator 17 (2016) | 64.2 | 42.9 | 16.9 | 10 |
| Titanfall 2 (2016) | 57 | 41 | 17 | 16 |
| Call of Duty Infinite Warfare (2016) | 27 | 24 | 16 | |
| Dishonored 2 (2016) | 23.4 | 18.6 | 12.2 | 9.9 |
| Watch Dogs 2 (2016) | 30.2 | 24.1 | 11.5 | |
| Resident Evil 7 (2017) | 55.3 | 24.1 | 13.9 |
Zajszint
| Üresjárat |
| 30.6 / 30.6 / 30.6 dB(A) |
| DVD |
| 36.9 / dB(A) |
| Terhelés |
| 41.9 / 41.8 dB(A) |
 | ||
30 dB csendes 40 dB(A) hallható 50 dB(A) hangos |
||
min: | ||
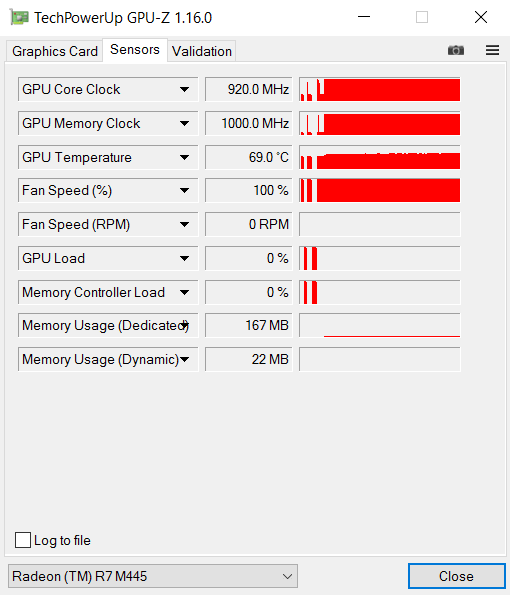
| Dell Inspiron 15 5000 5567-1753 i7-7500U, Radeon R7 M445 | Acer Aspire E5-575G-549D i5-7200U, GeForce GTX 950M | Lenovo IdeaPad 510-15IKB 80SV0087GE i7-7500U, GeForce 940MX | Lenovo ThinkPad E470-20H2S00400 i5-7200U, GeForce 940MX | HP Pavilion 15-aw004ng W8Y60EA A10-9600P, Radeon R8 M445DX | HP Pavilion 17-x110ng i5-7200U, Radeon R7 M440 | |
|---|---|---|---|---|---|---|
| Noise | 5% | 1% | 7% | -2% | 2% | |
| off / környezet * | 30.6 | 28.9 6% | 31.6 -3% | 29 5% | 31.2 -2% | 29 5% |
| Idle Minimum * | 30.6 | 30.8 -1% | 32.6 -7% | 29 5% | 31.7 -4% | 31 -1% |
| Idle Average * | 30.6 | 30.8 -1% | 32.6 -7% | 29 5% | 31.9 -4% | 31 -1% |
| Idle Maximum * | 30.6 | 30.8 -1% | 32.6 -7% | 29 5% | 31.9 -4% | 31 -1% |
| Load Average * | 41.9 | 33.4 20% | 35.3 16% | 35.6 15% | 41 2% | 33.8 19% |
| Load Maximum * | 41.8 | 40.1 4% | 37.1 11% | 38.5 8% | 42.7 -2% | 44.8 -7% |
* ... a kisebb jobb
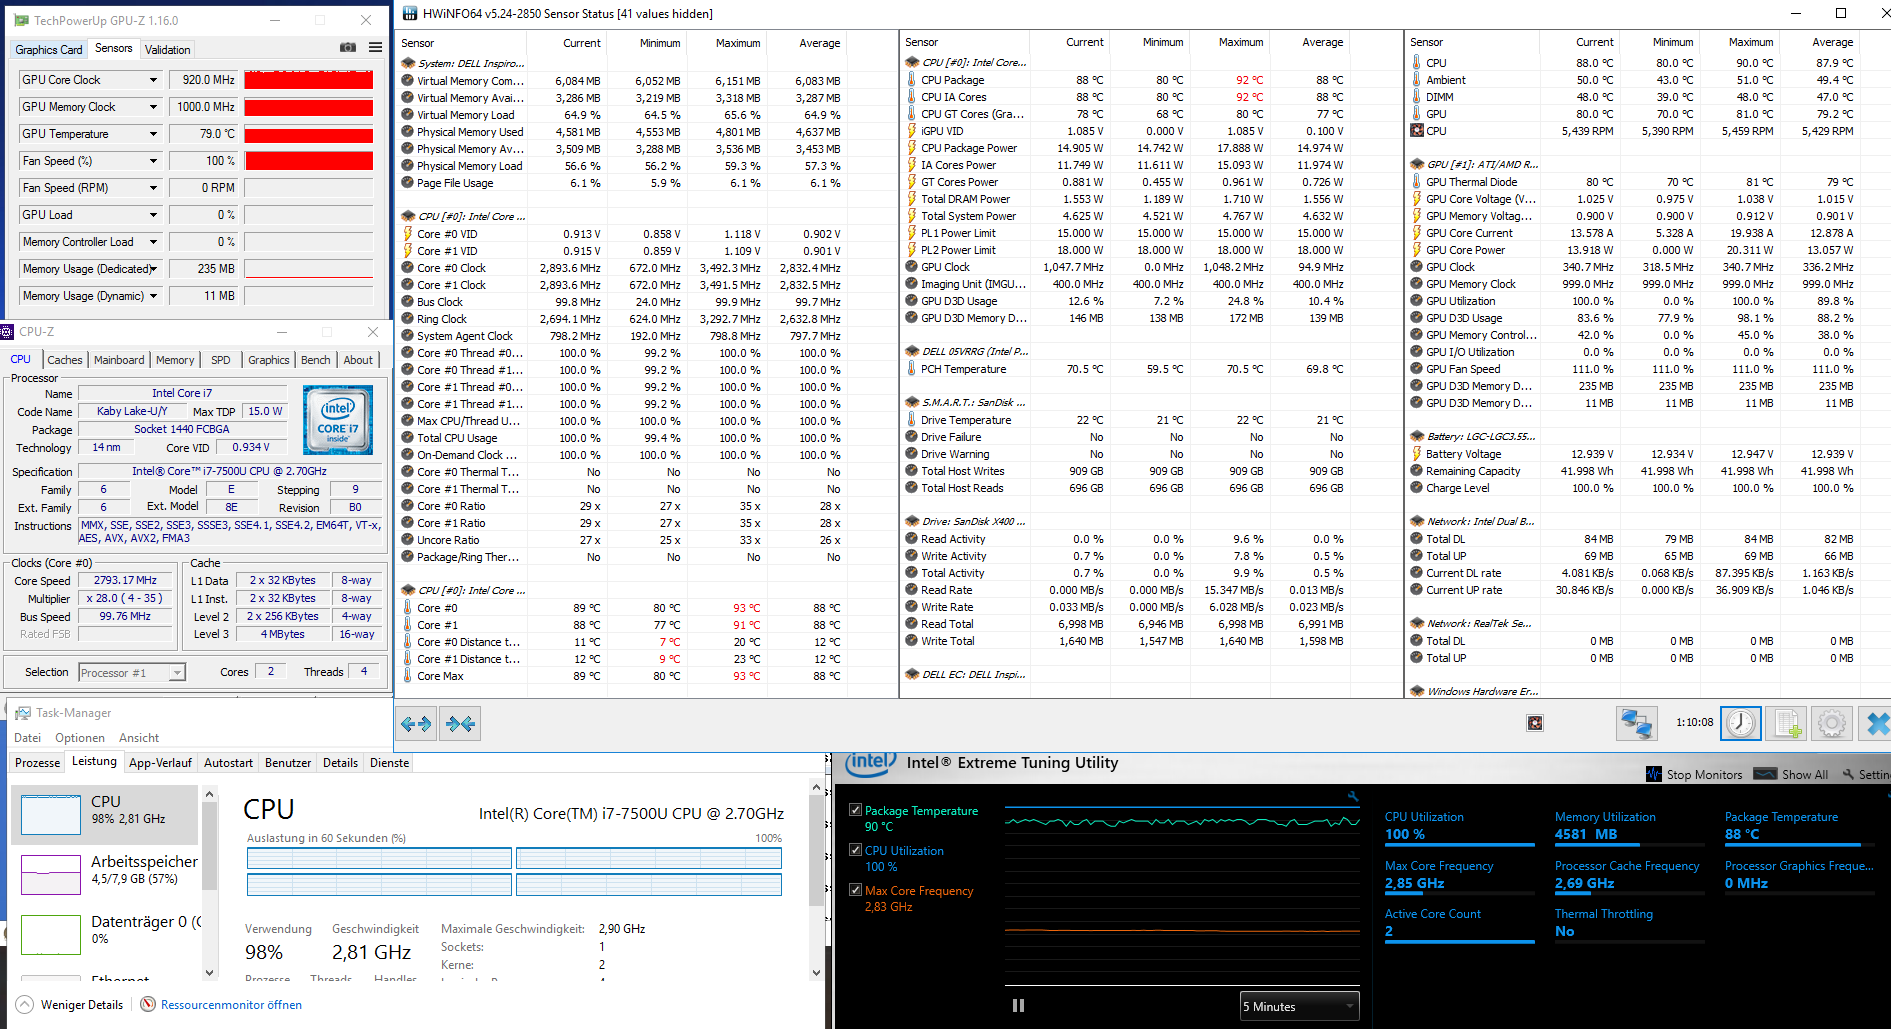


(±) The maximum temperature on the upper side is 41.6 °C / 107 F, compared to the average of 36.9 °C / 98 F, ranging from 21.1 to 71 °C for the class Multimedia.
(-) The bottom heats up to a maximum of 51.3 °C / 124 F, compared to the average of 39.1 °C / 102 F
(+) In idle usage, the average temperature for the upper side is 25.6 °C / 78 F, compared to the device average of 31.2 °C / 88 F.
(+) The palmrests and touchpad are cooler than skin temperature with a maximum of 27.9 °C / 82.2 F and are therefore cool to the touch.
(±) The average temperature of the palmrest area of similar devices was 28.8 °C / 83.8 F (+0.9 °C / 1.6 F).
| Dell Inspiron 15 5000 5567-1753 i7-7500U, Radeon R7 M445 | Acer Aspire E5-575G-549D i5-7200U, GeForce GTX 950M | Lenovo IdeaPad 510-15IKB 80SV0087GE i7-7500U, GeForce 940MX | Lenovo ThinkPad E470-20H2S00400 i5-7200U, GeForce 940MX | HP Pavilion 15-aw004ng W8Y60EA A10-9600P, Radeon R8 M445DX | HP Pavilion 17-x110ng i5-7200U, Radeon R7 M440 | |
|---|---|---|---|---|---|---|
| Heat | -10% | 19% | 5% | 18% | 15% | |
| Maximum Upper Side * | 41.6 | 48.1 -16% | 38.3 8% | 43.8 -5% | 33.4 20% | 40.3 3% |
| Maximum Bottom * | 51.3 | 60.8 -19% | 36 30% | 53 -3% | 32.9 36% | 46.1 10% |
| Idle Upper Side * | 29.4 | 30.8 -5% | 24.9 15% | 25.9 12% | 27.7 6% | 23.8 19% |
| Idle Bottom * | 32.4 | 31.9 2% | 25.6 21% | 27.1 16% | 29.4 9% | 23.4 28% |
* ... a kisebb jobb
Dell Inspiron 15 5000 5567-1753 audio analysis
(±) | speaker loudness is average but good (72 dB)
Bass 100 - 315 Hz
(-) | nearly no bass - on average 19.4% lower than median
(±) | linearity of bass is average (8.9% delta to prev. frequency)
Mids 400 - 2000 Hz
(±) | higher mids - on average 5.1% higher than median
(±) | linearity of mids is average (10.2% delta to prev. frequency)
Highs 2 - 16 kHz
(+) | balanced highs - only 2.4% away from median
(+) | highs are linear (6.6% delta to prev. frequency)
Összességében 100 - 16.000 Hz
(±) | linearity of overall sound is average (18.6% difference to median)
Ugyanazon osztályhoz képest
» 52% of all tested devices in this class were better, 9% similar, 39% worse
» The best had a delta of 5%, average was 18%, worst was 45%
Az összes tesztelt eszközzel összehasonlítva
» 37% of all tested devices were better, 8% similar, 56% worse
» The best had a delta of 4%, average was 25%, worst was 134%
Apple MacBook 12 (Early 2016) 1.1 GHz audio analysis
(+) | speakers can play relatively loud (83.6 dB)
Bass 100 - 315 Hz
(±) | reduced bass - on average 11.3% lower than median
(±) | linearity of bass is average (14.2% delta to prev. frequency)
Mids 400 - 2000 Hz
(+) | balanced mids - only 2.4% away from median
(+) | mids are linear (5.5% delta to prev. frequency)
Highs 2 - 16 kHz
(+) | balanced highs - only 2% away from median
(+) | highs are linear (4.5% delta to prev. frequency)
Összességében 100 - 16.000 Hz
(+) | overall sound is linear (10.2% difference to median)
Ugyanazon osztályhoz képest
» 5% of all tested devices in this class were better, 2% similar, 93% worse
» The best had a delta of 5%, average was 19%, worst was 53%
Az összes tesztelt eszközzel összehasonlítva
» 3% of all tested devices were better, 1% similar, 96% worse
» The best had a delta of 4%, average was 25%, worst was 134%
| Kikapcsolt állapot / Készenlét | |
| Üresjárat | |
| Terhelés |
|
| Dell Inspiron 15 5000 5567-1753 i7-7500U, Radeon R7 M445, SanDisk X400 SED 256GB, SATA (SD8TB8U-256G) | Acer Aspire E5-575G-549D i5-7200U, GeForce GTX 950M, Toshiba MQ01ABD100 | Lenovo IdeaPad 510-15IKB 80SV0087GE i7-7500U, GeForce 940MX, Liteonit CV3-DE256 | Lenovo ThinkPad E470-20H2S00400 i5-7200U, GeForce 940MX, SanDisk X400 SED 256GB, SATA (SD8TB8U-256G) | HP Pavilion 15-aw004ng W8Y60EA A10-9600P, Radeon R8 M445DX, | HP Pavilion 17-x110ng i5-7200U, Radeon R7 M440, SanDisk Z400s SD8SNAT-256G | |
|---|---|---|---|---|---|---|
| Power Consumption | -32% | -2% | 10% | -18% | -59% | |
| Idle Minimum * | 4 | 6 -50% | 3.9 2% | 2.7 32% | 5.5 -38% | 7.7 -93% |
| Idle Average * | 5.4 | 8.1 -50% | 7.4 -37% | 5.5 -2% | 8.2 -52% | 14 -159% |
| Idle Maximum * | 8.3 | 9.8 -18% | 9.5 -14% | 6.5 22% | 9.5 -14% | 15.1 -82% |
| Load Average * | 54 | 52.5 3% | 41 24% | 44.2 18% | 44.5 18% | 33 39% |
| Load Maximum * | 55.4 | 81.6 -47% | 48 13% | 65.2 -18% | 58 -5% | 54.6 1% |
* ... a kisebb jobb
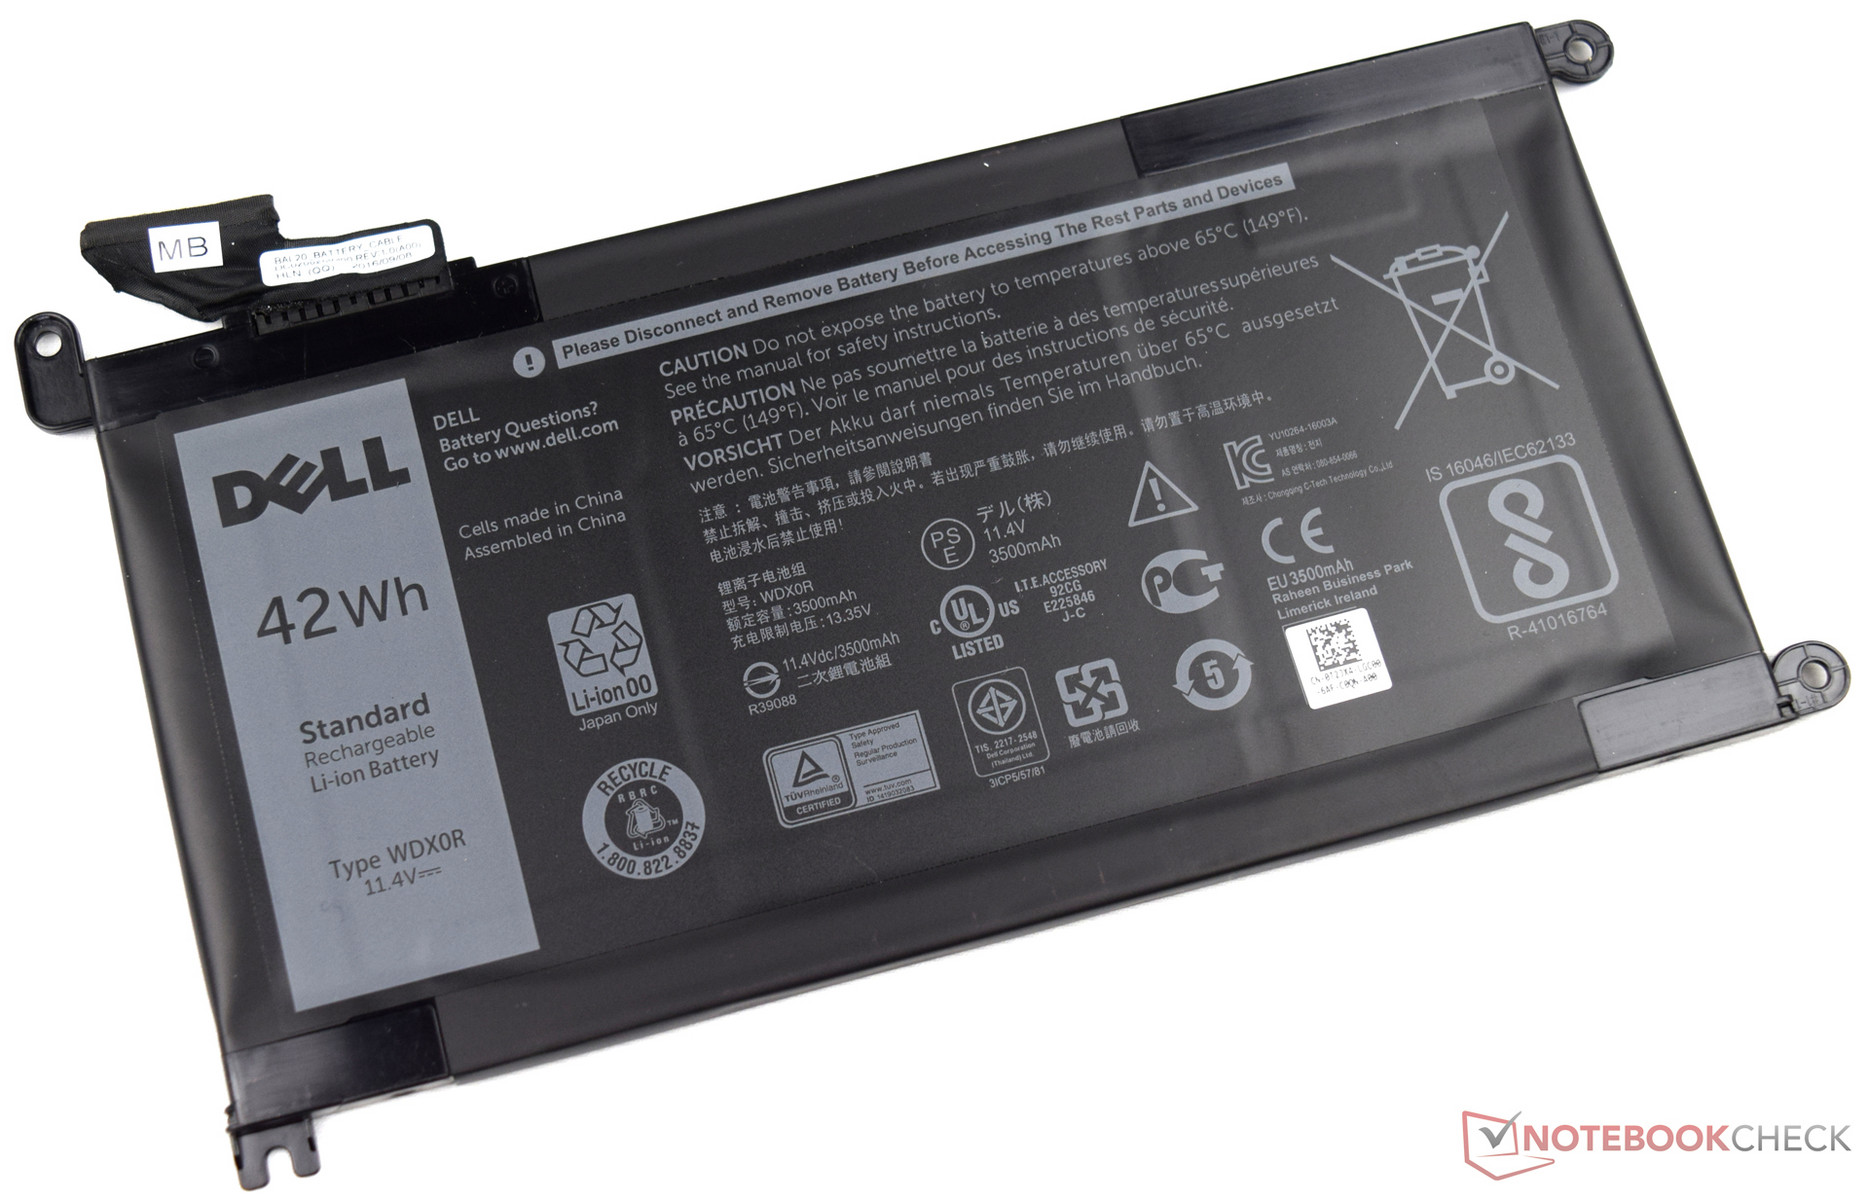
| Dell Inspiron 15 5000 5567-1753 i7-7500U, Radeon R7 M445, 42 Wh | Acer Aspire E5-575G-549D i5-7200U, GeForce GTX 950M, 62 Wh | Lenovo IdeaPad 510-15IKB 80SV0087GE i7-7500U, GeForce 940MX, 30 Wh | Lenovo ThinkPad E470-20H2S00400 i5-7200U, GeForce 940MX, 45 Wh | HP Pavilion 15-aw004ng W8Y60EA A10-9600P, Radeon R8 M445DX, 41 Wh | HP Pavilion 17-x110ng i5-7200U, Radeon R7 M440, 41 Wh | |
|---|---|---|---|---|---|---|
| Akkumulátor üzemidő | 25% | -34% | 48% | -14% | -5% | |
| Reader / Idle | 466 | 767 65% | 1043 124% | 560 20% | 527 13% | |
| H.264 | 316 | 460 46% | 503 59% | 194 -39% | 287 -9% | |
| WiFi v1.3 | 417 | 451 8% | 275 -34% | 326 -22% | 260 -38% | 346 -17% |
| Load | 95 | 75 -21% | 124 31% | 95 0% | 90 -5% |
Pro
Kontra

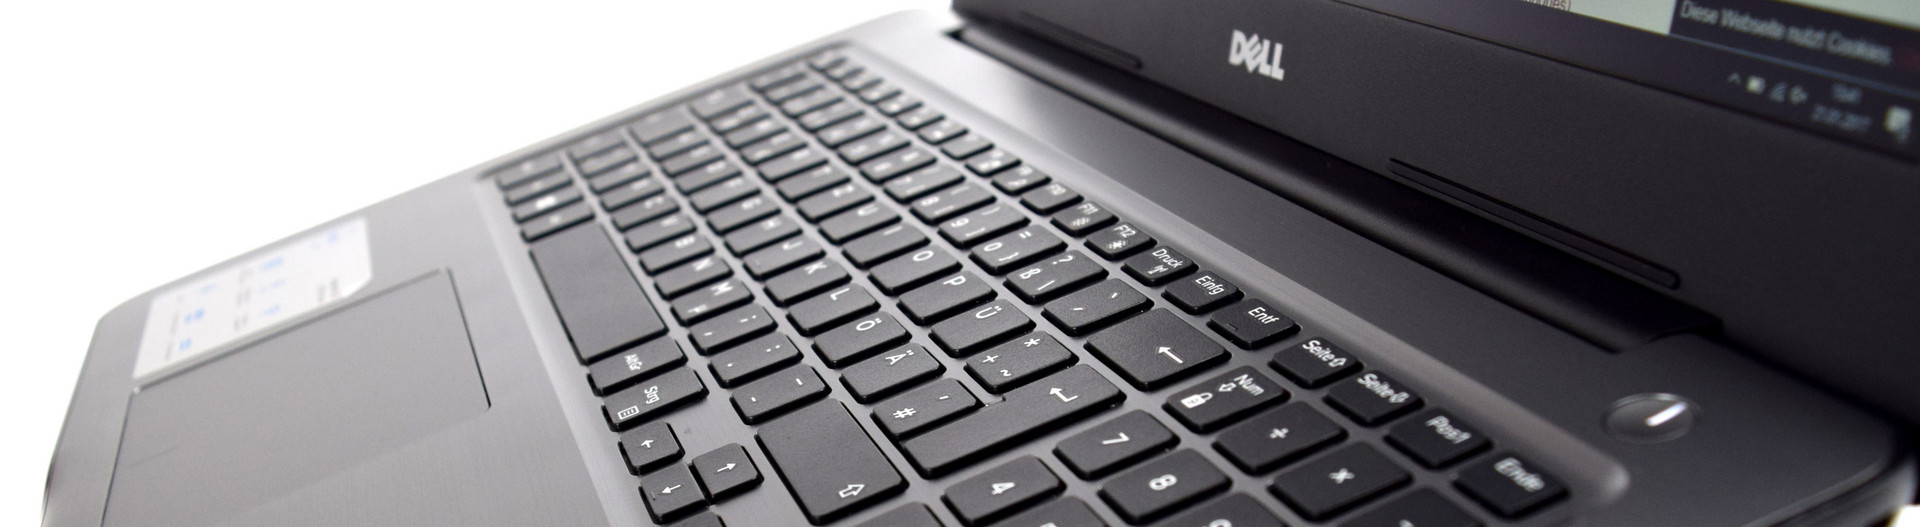
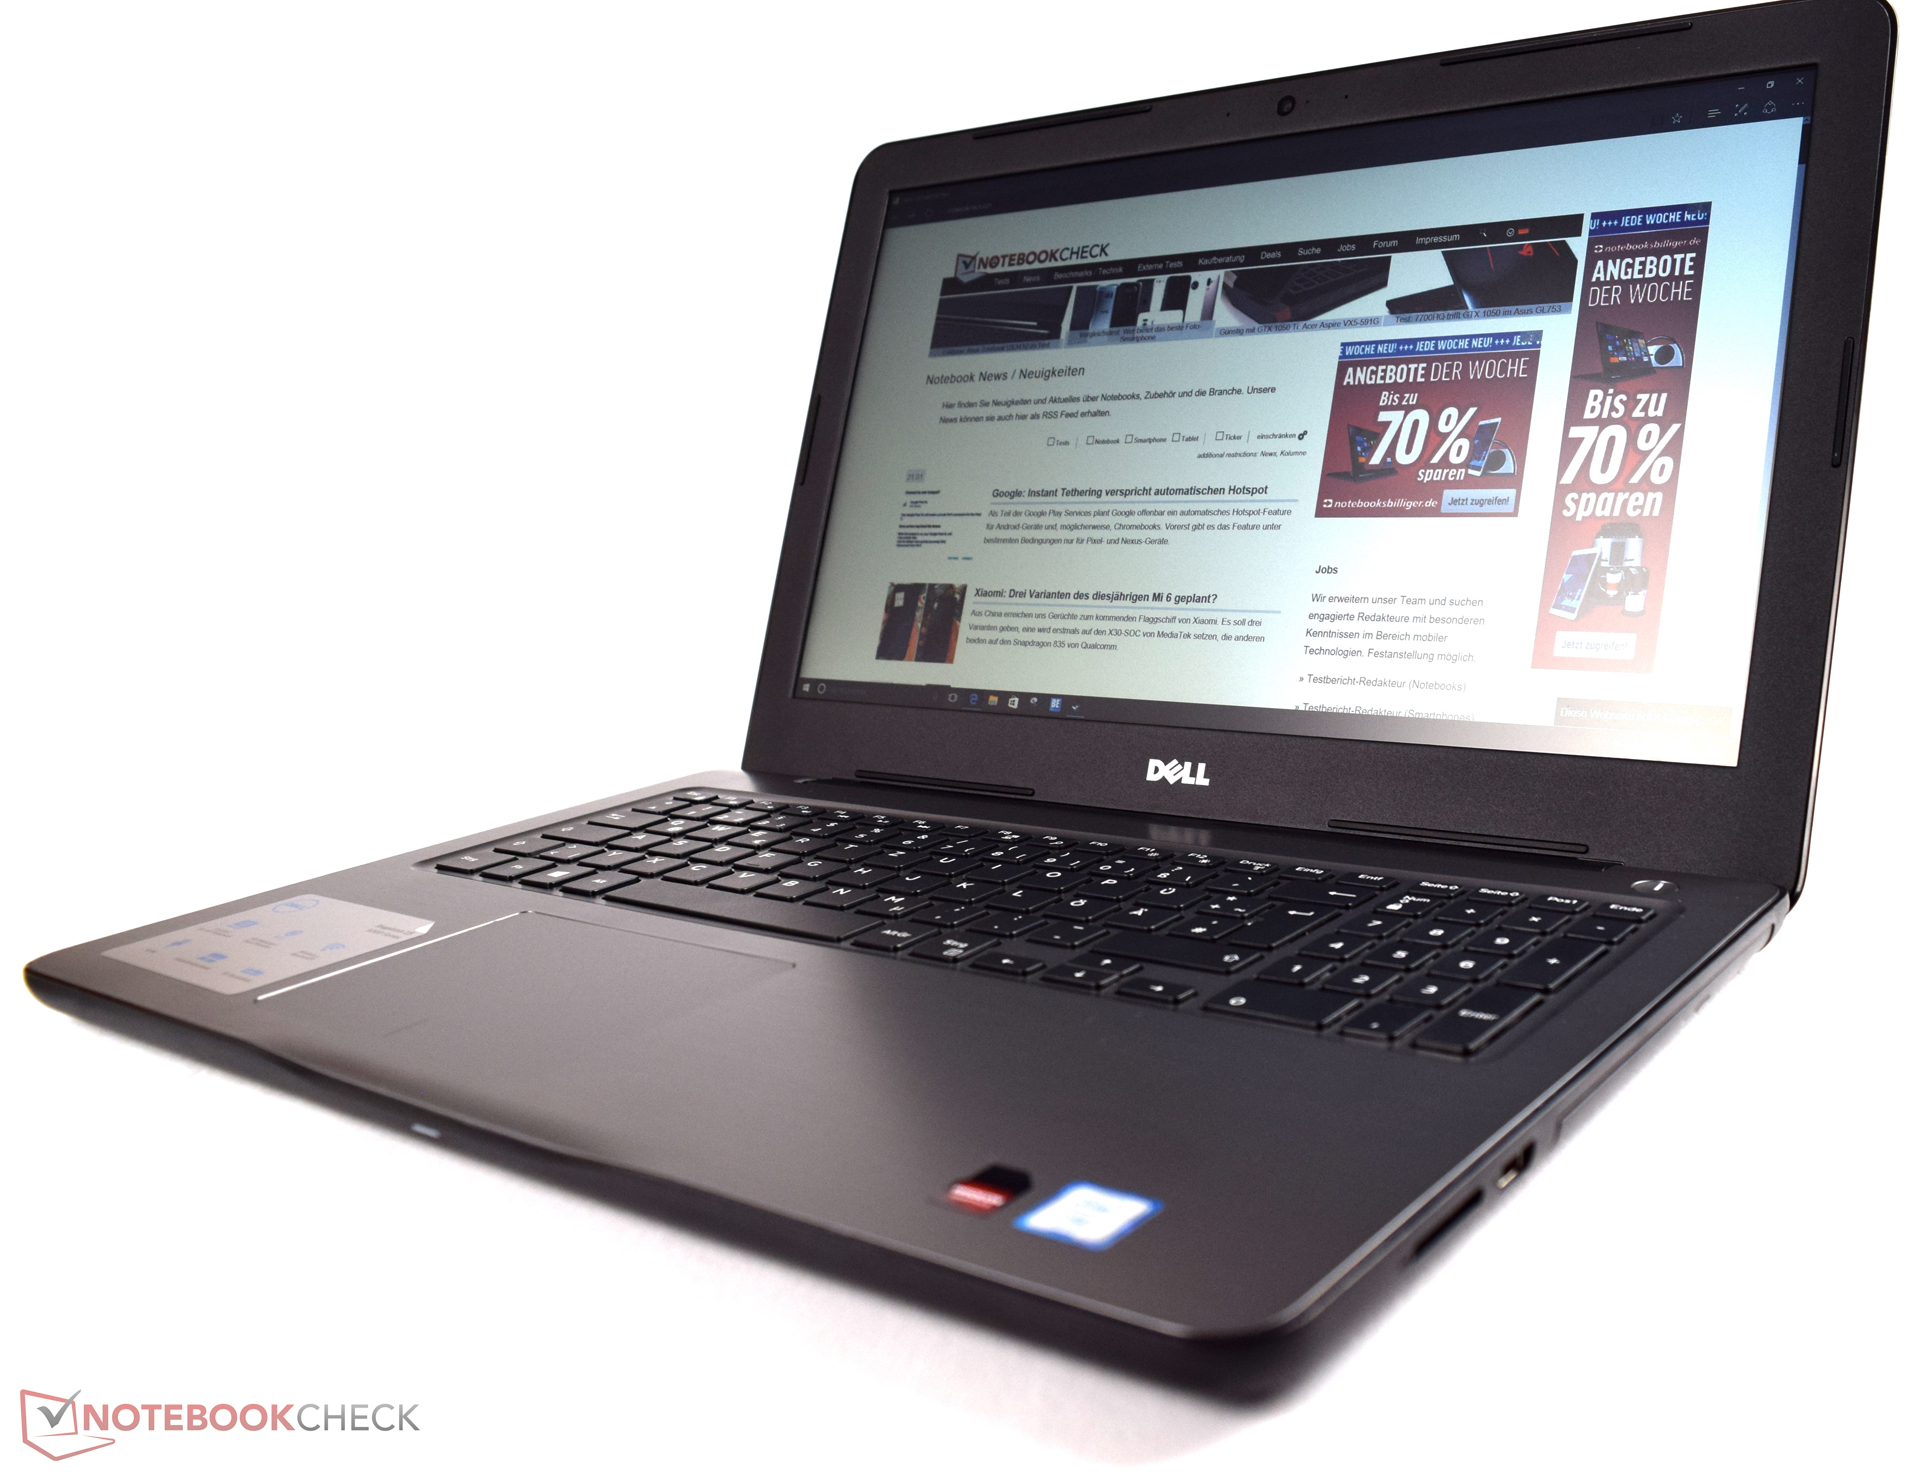
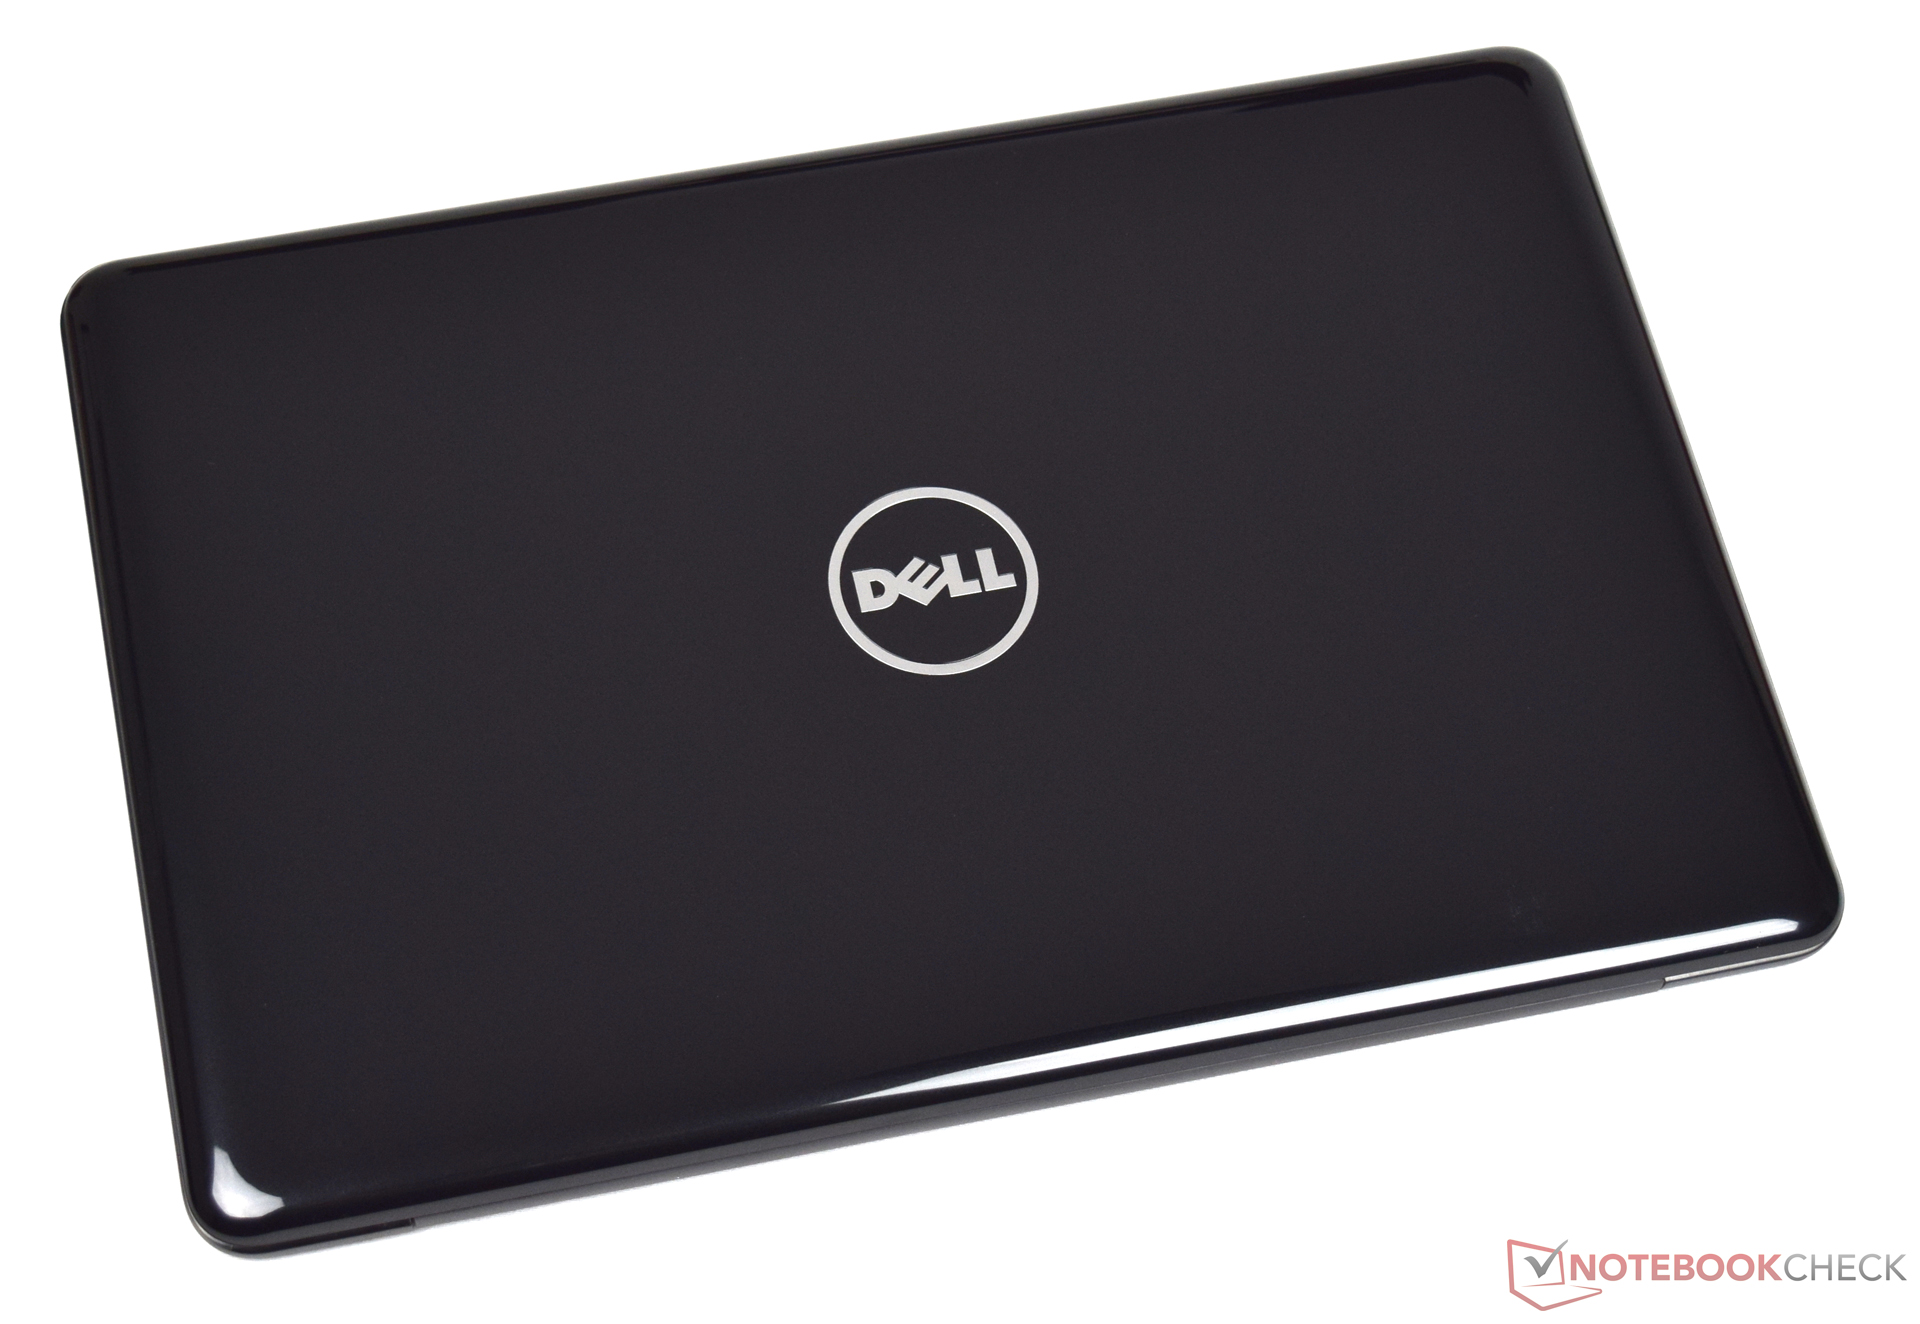
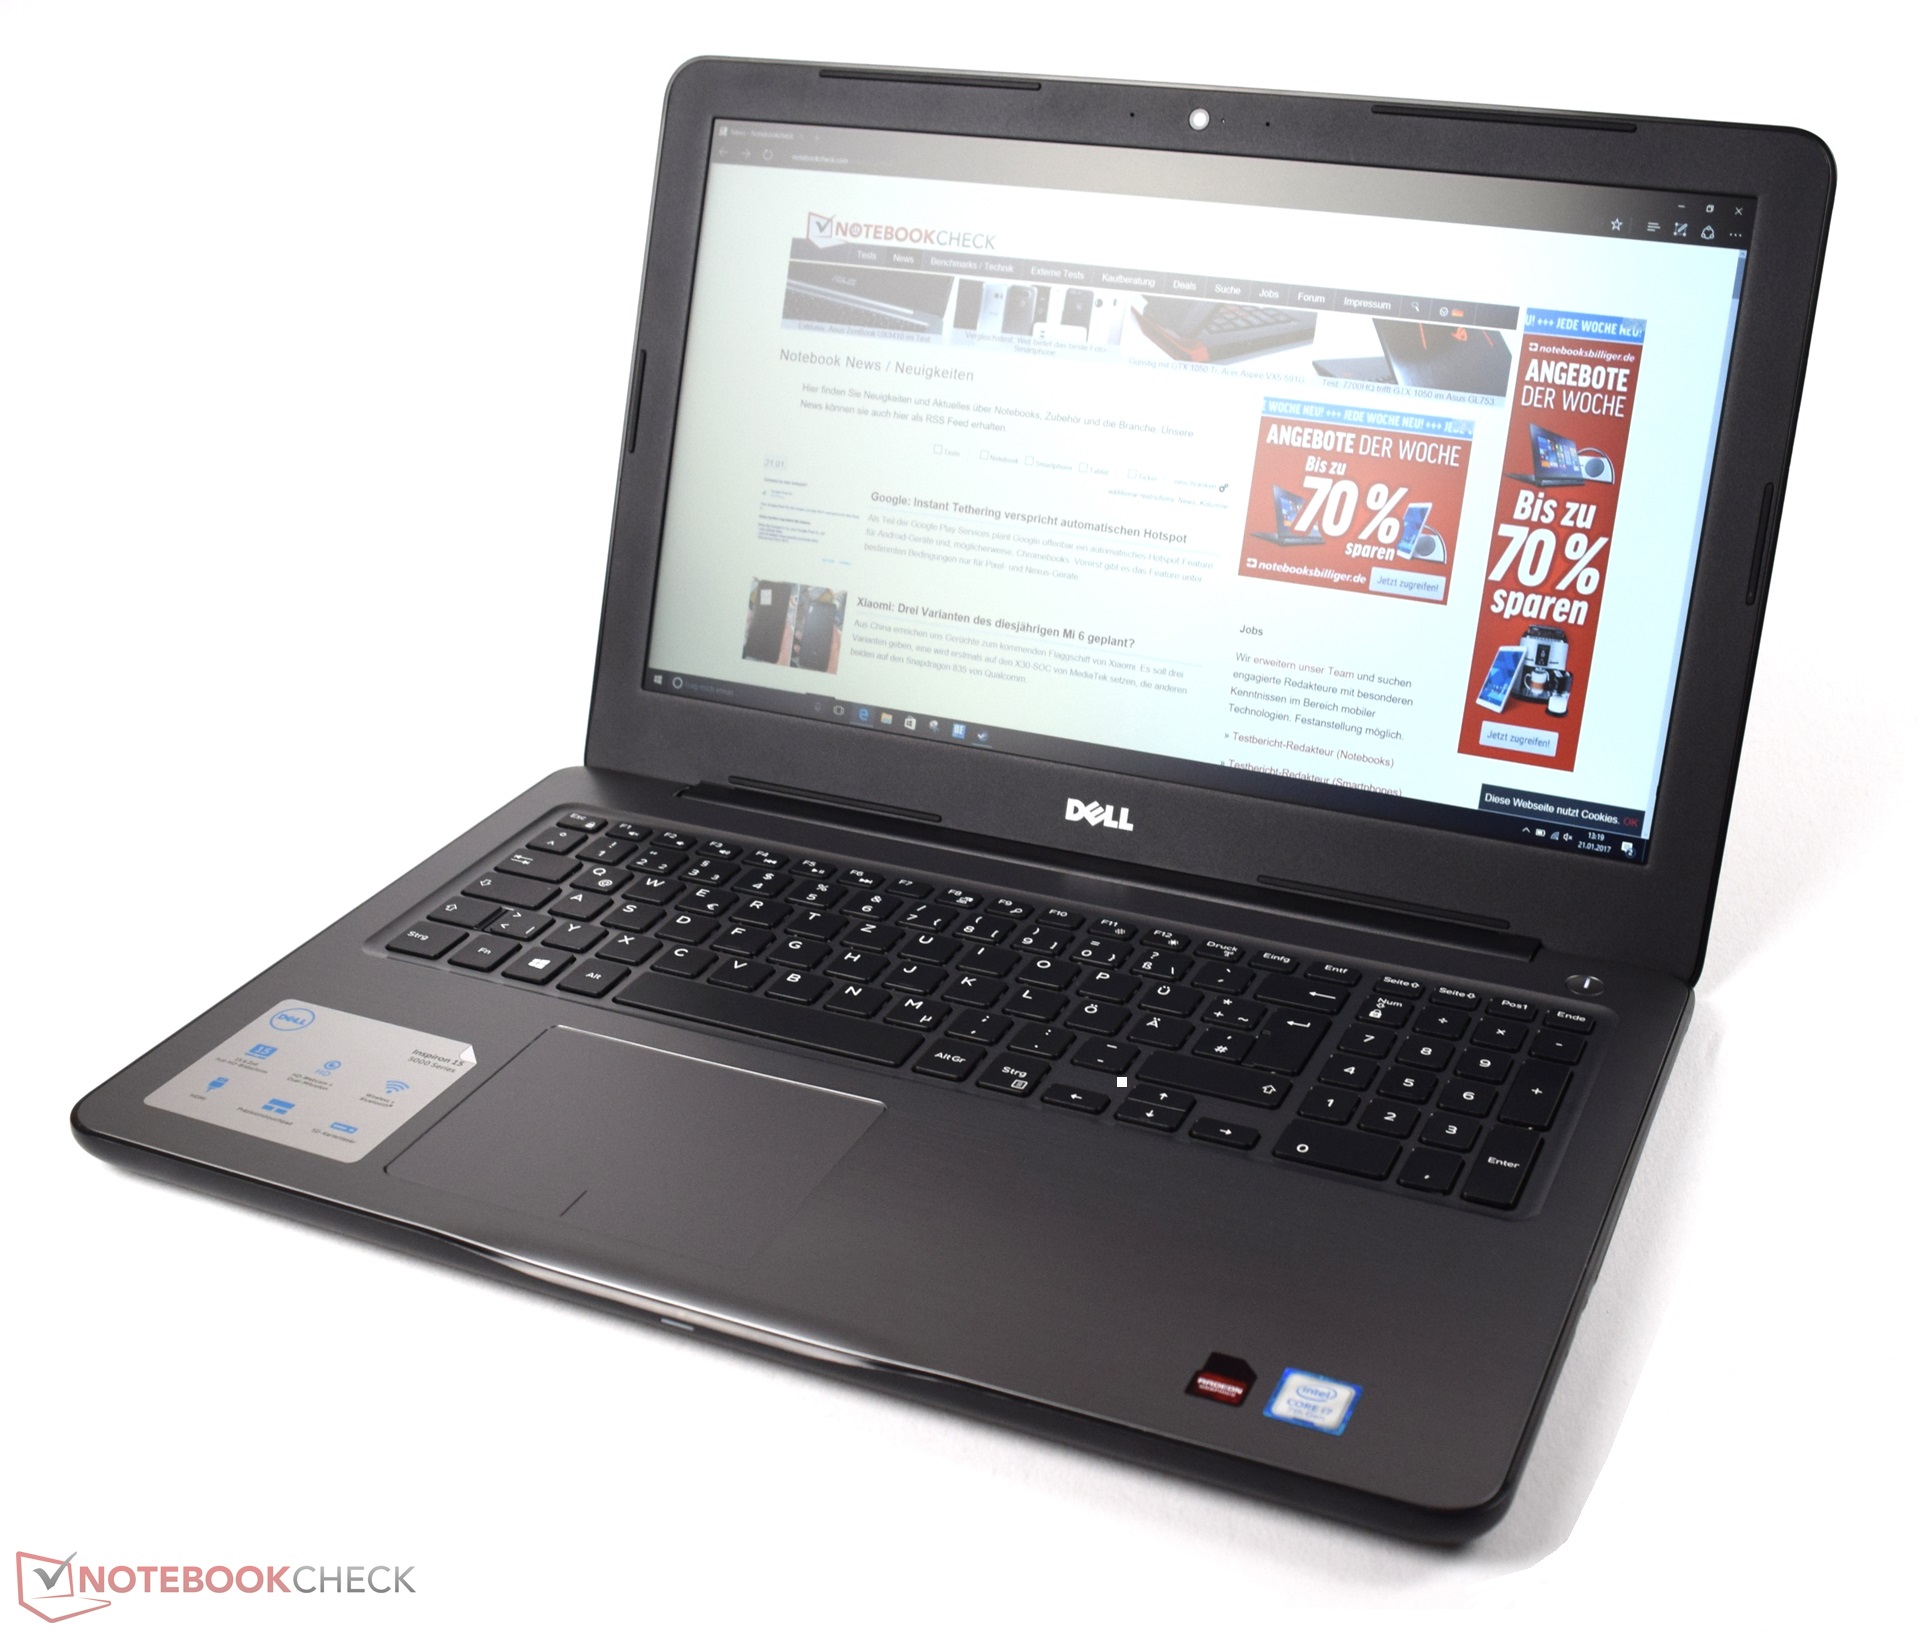
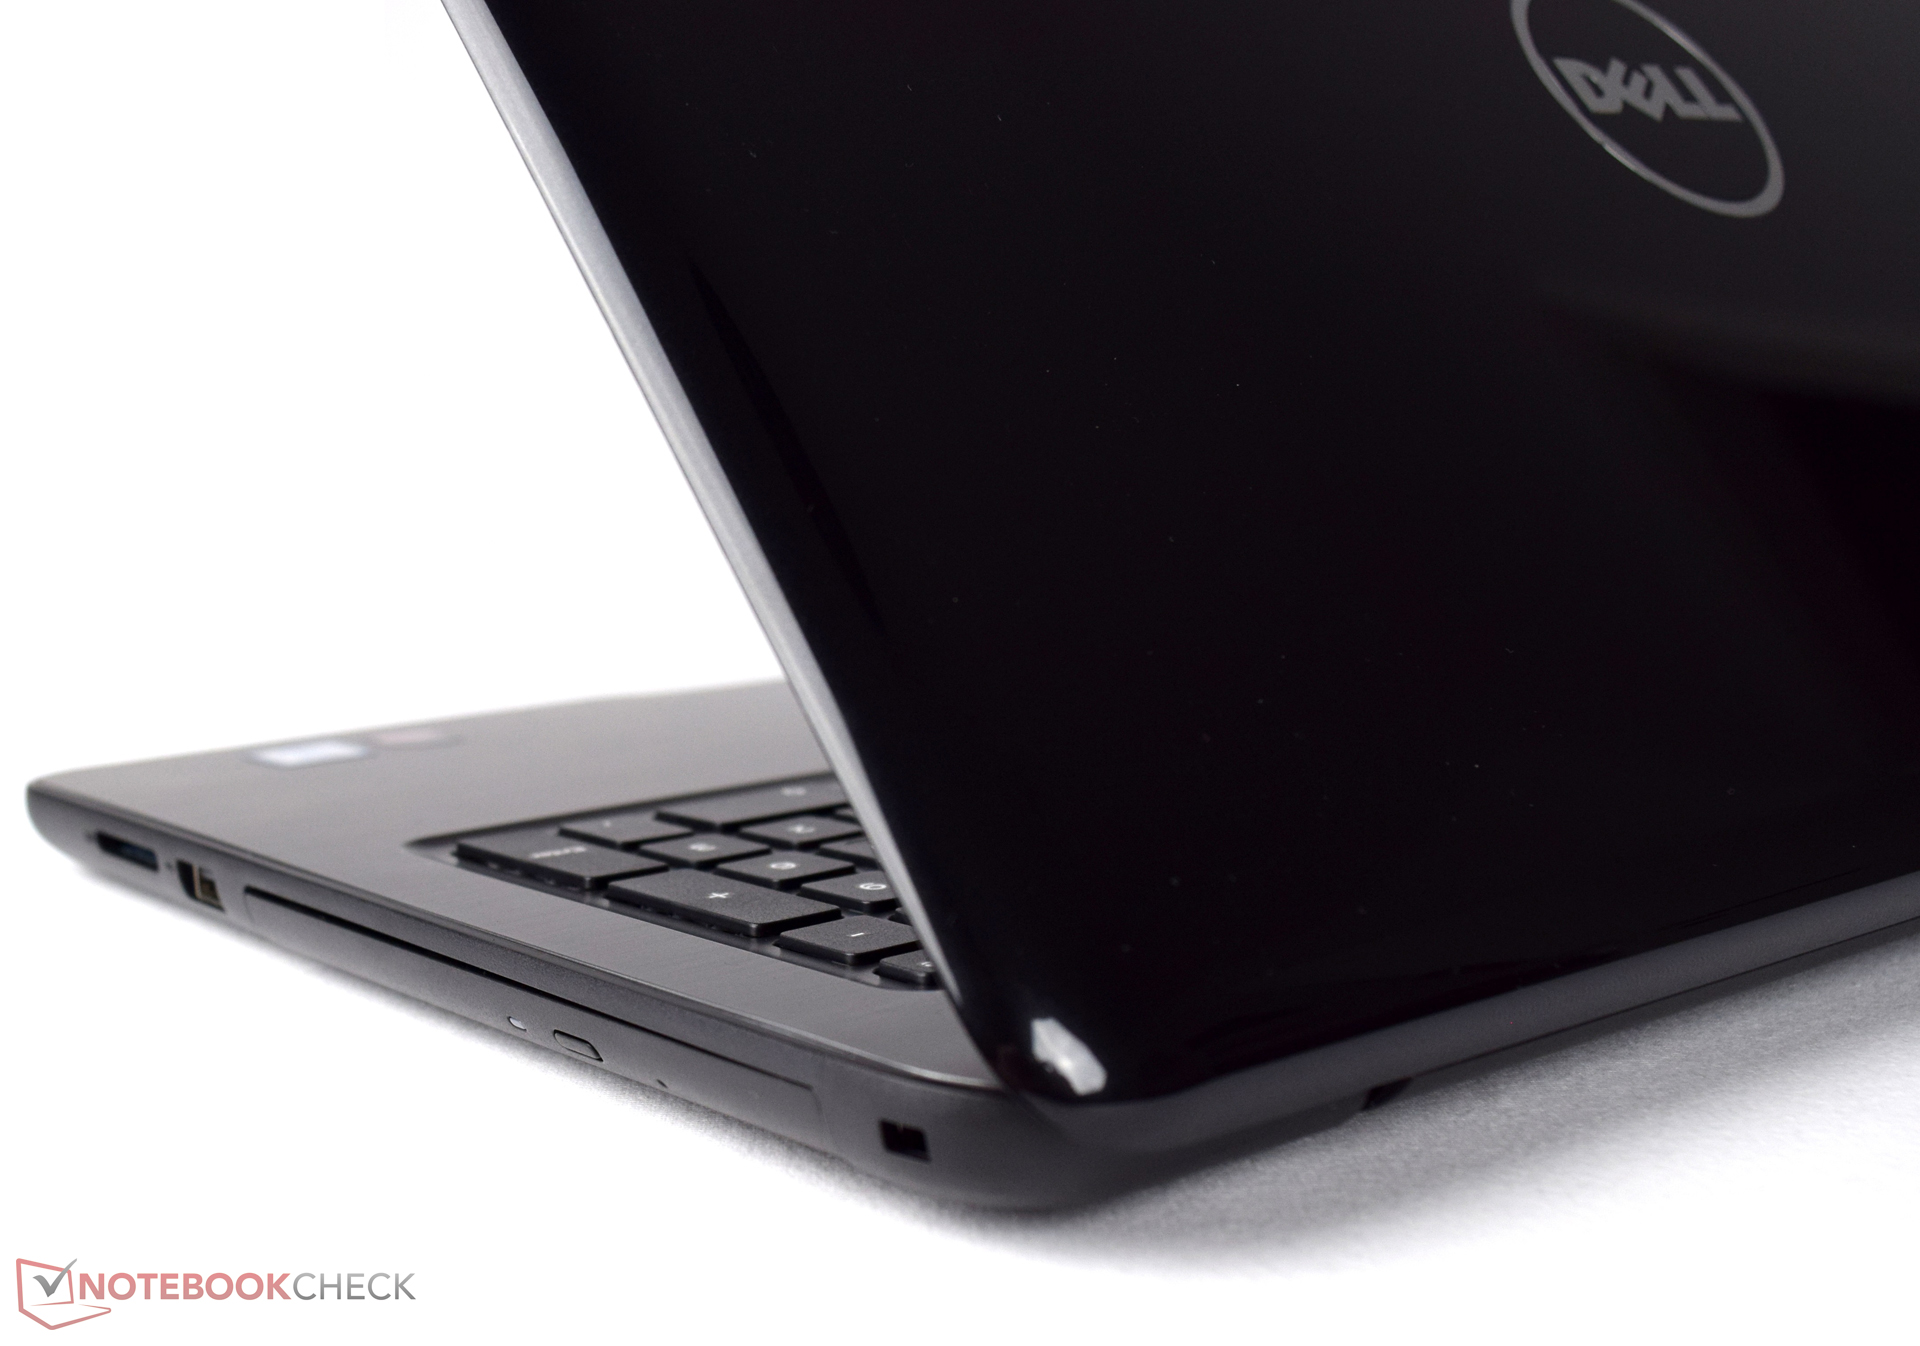
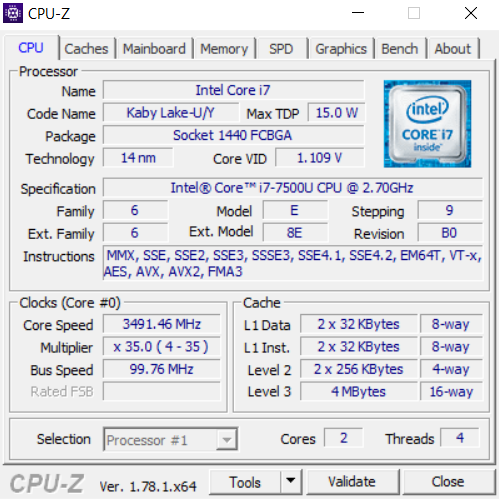
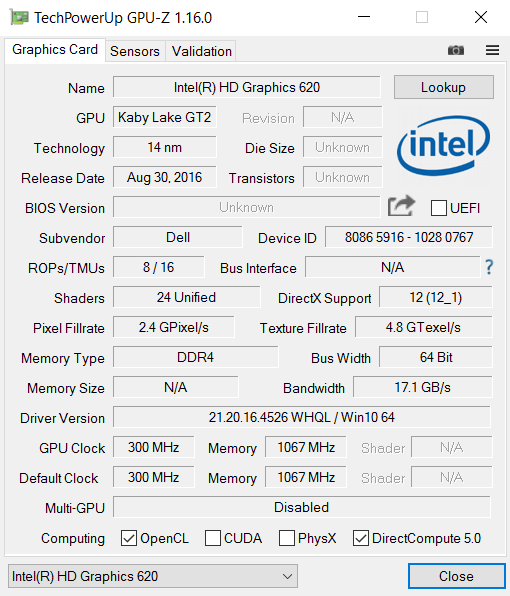
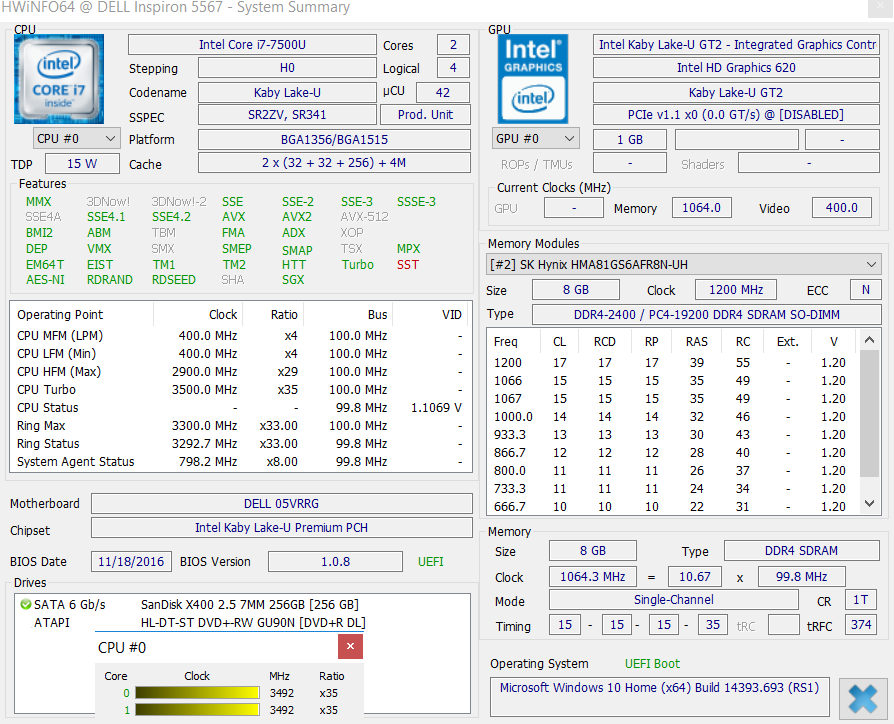
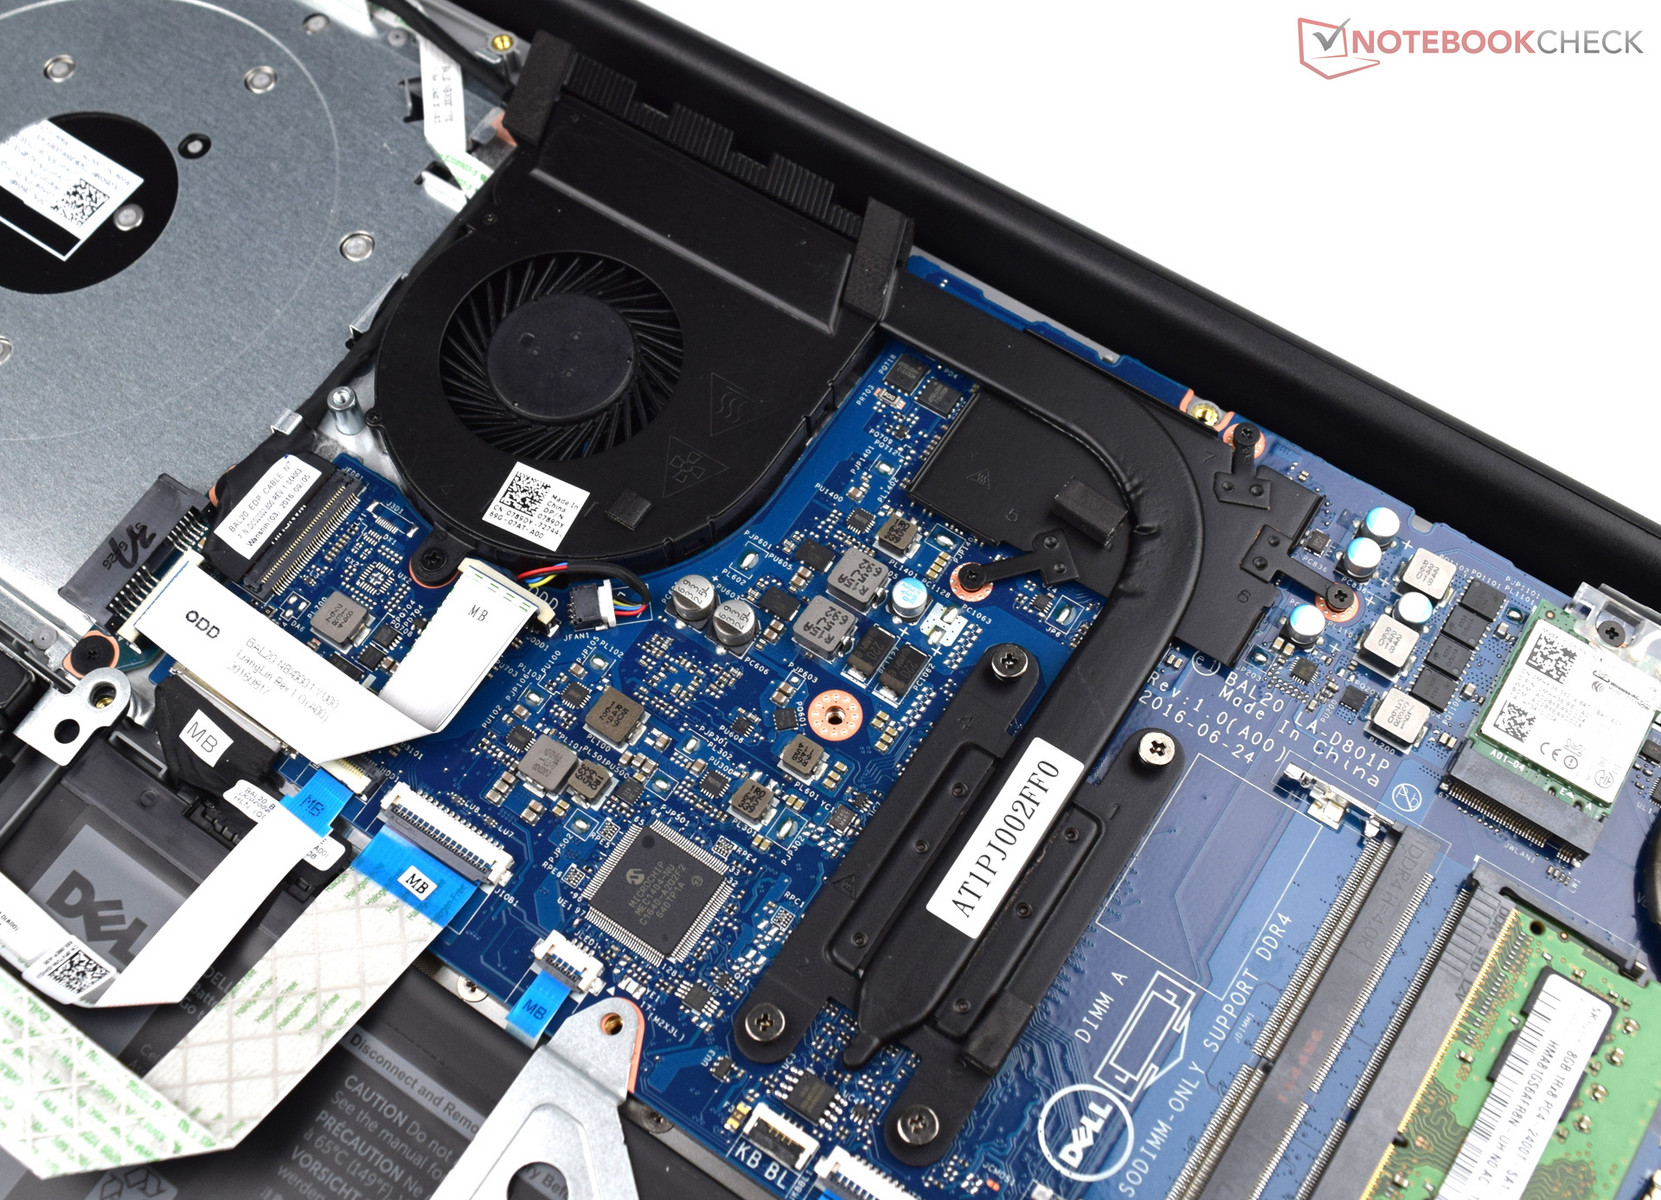
A Dell Inspiron 15 5000 5567-1753 egy multimédia eszköz, egyszerű és feltűnésmentes dizájnnal. Idővel azonban a fényes fedélen a karcolások eluralkodhatnak, ami nem mutat jól. A 15.6 inches tesztpéldányunk modern és erős Intel Kaby Lake processzort kapott. A Core i7-7500U elegendő erőt ad a gépnek mindennapi multimédia feladatok leküzdésére, és a dedikált videokártya lehetővé teszi több modern játék futtatását, bár a legnagyobb felbontásokat nem bírja el. Ez a gép jelenleg 719 euróért (~$776) érhető el több online üzletben.
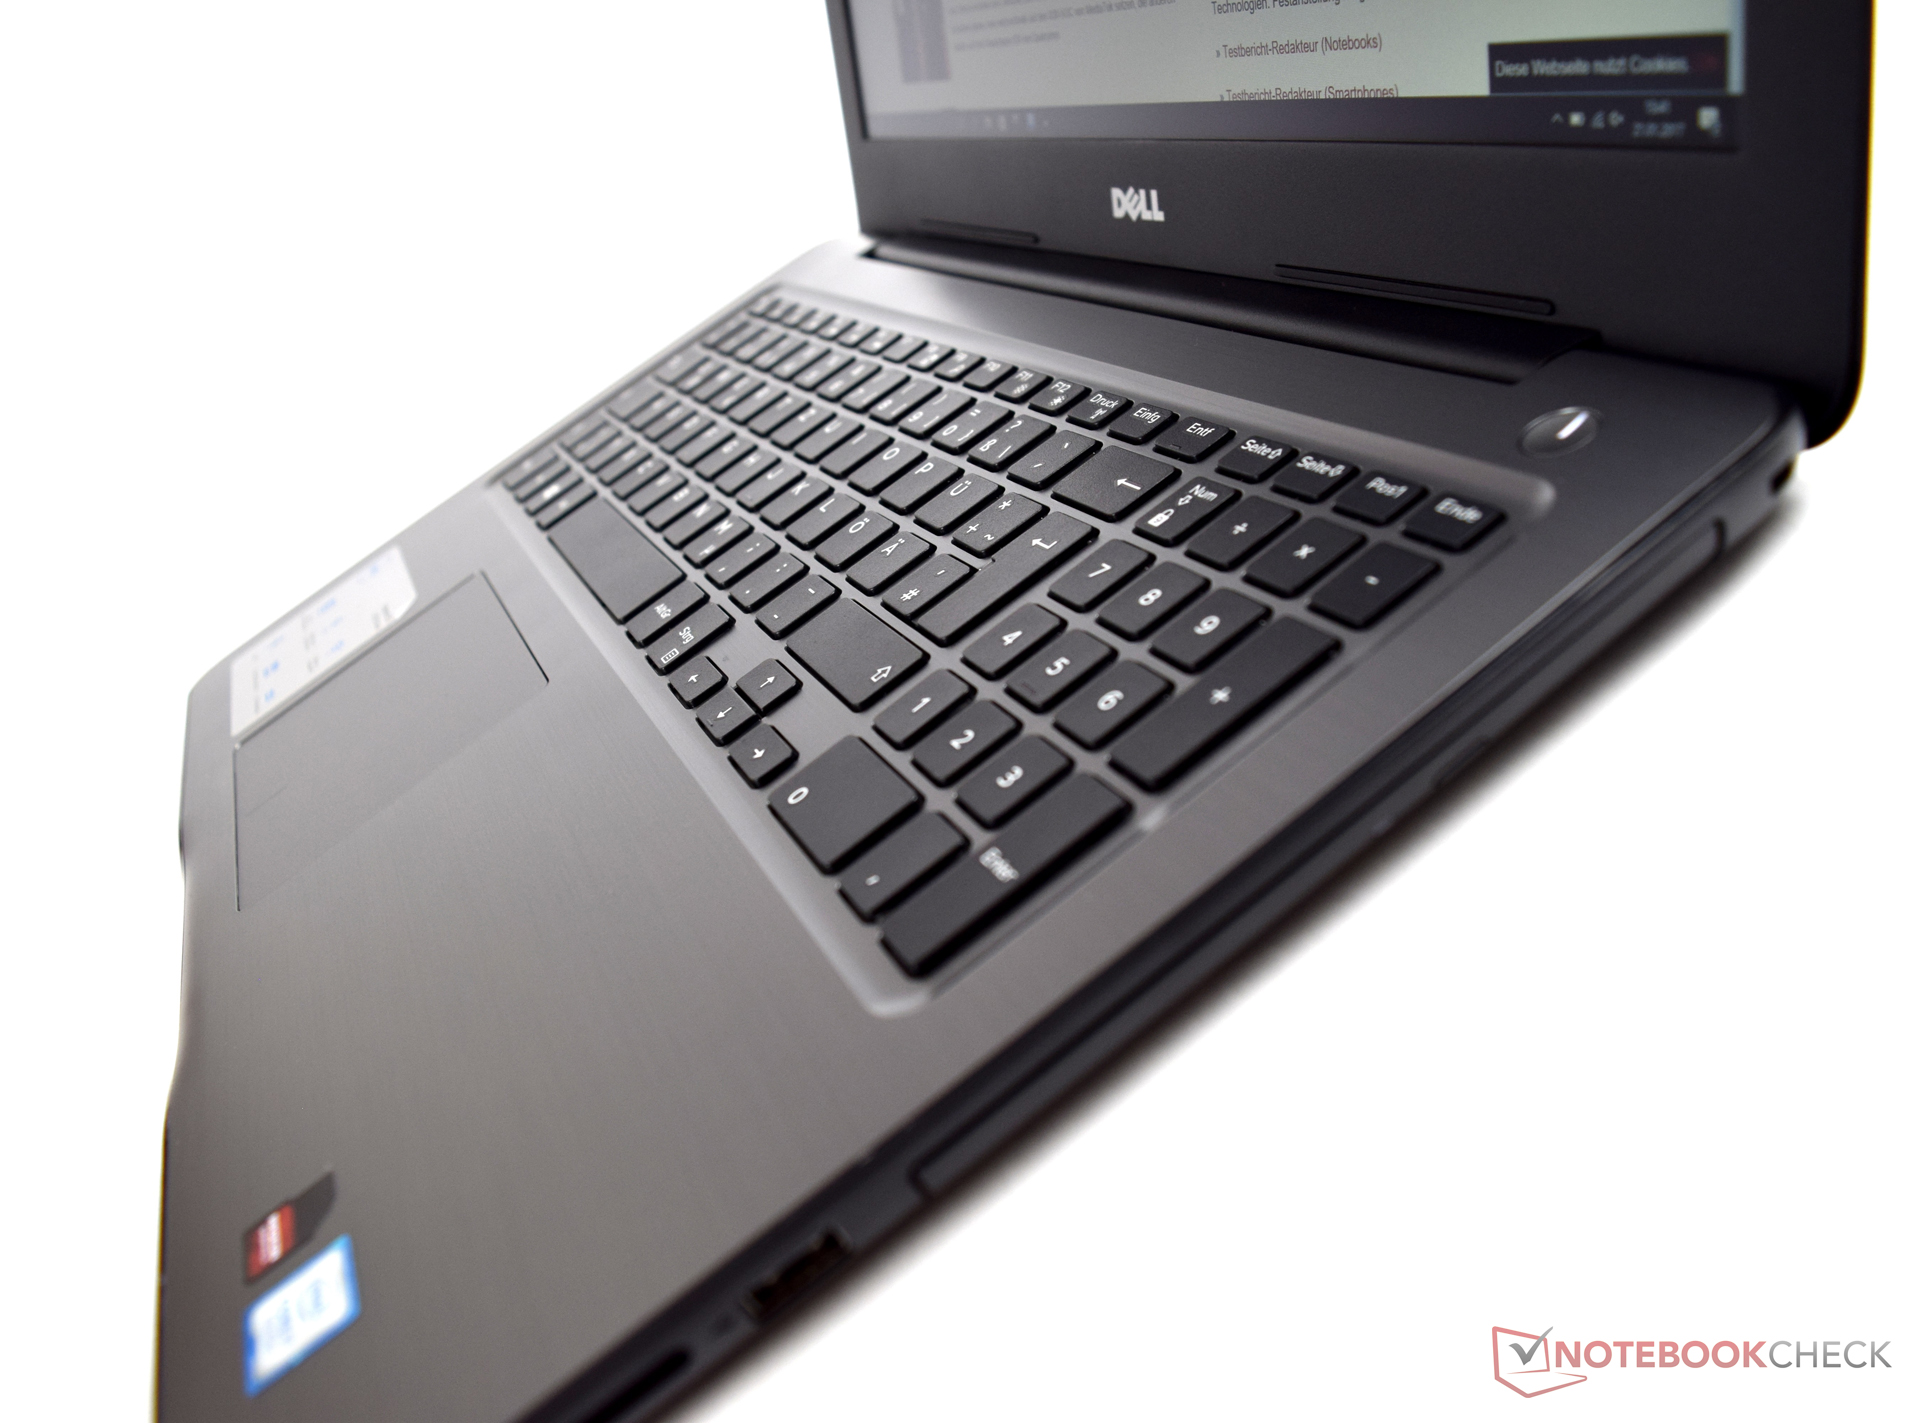
A Dell Inspiron 15 5000 5567-1753 stabil teljesítményt és jó beviteli eszközöket kínál mindennapi feladatokra. Ennek ellenére a gyenge kijelző komoly hátrány, és alatta maradt elvárásainknak. A gyártónak hamar orvosolnia kellene ezt a problémát, mert az ilyen TN panelek ideje lejárt.
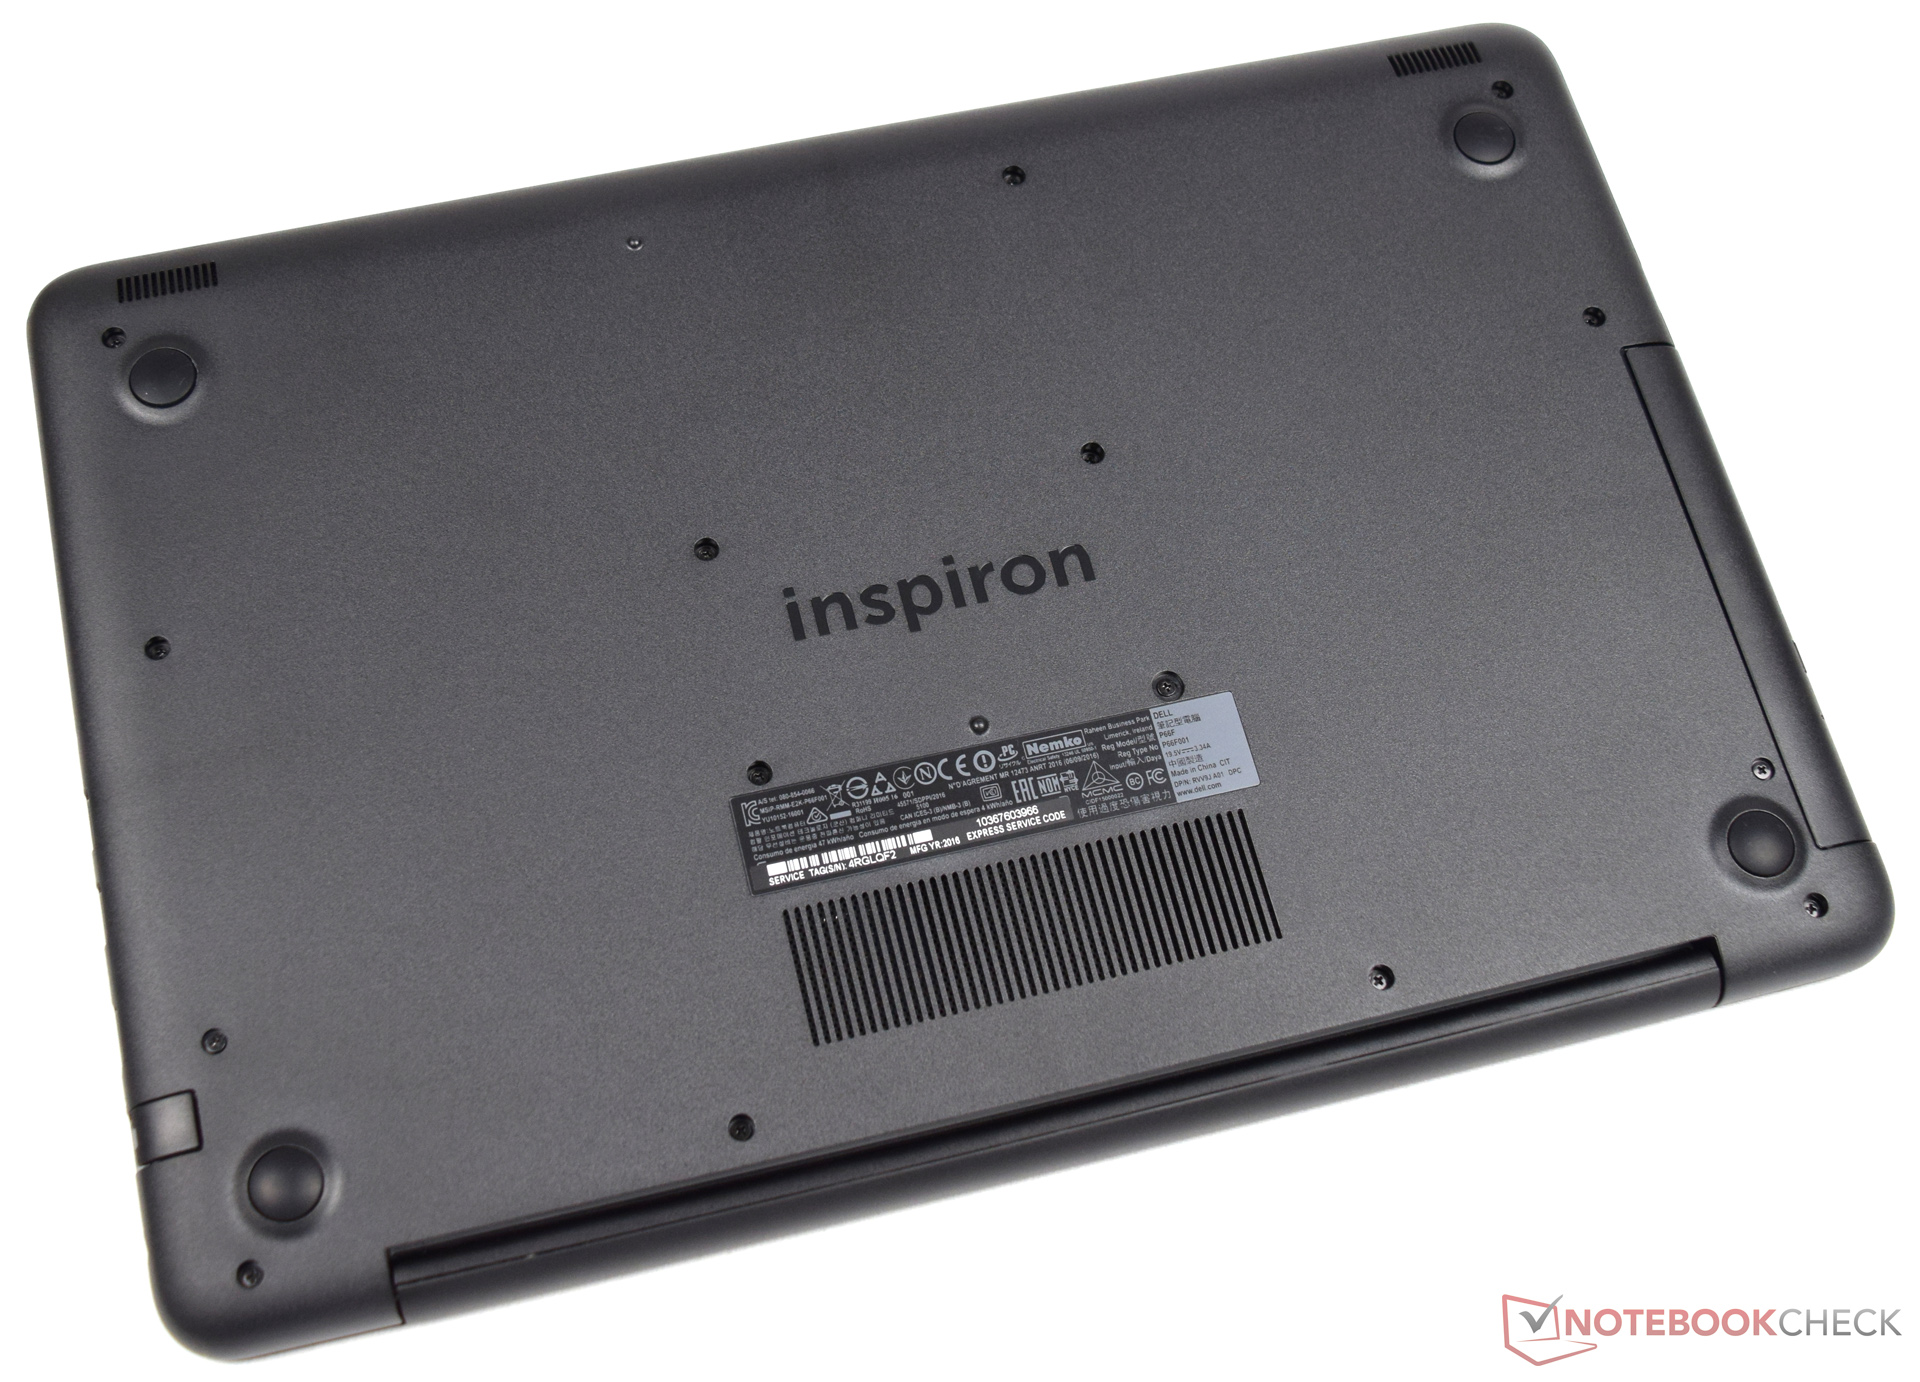
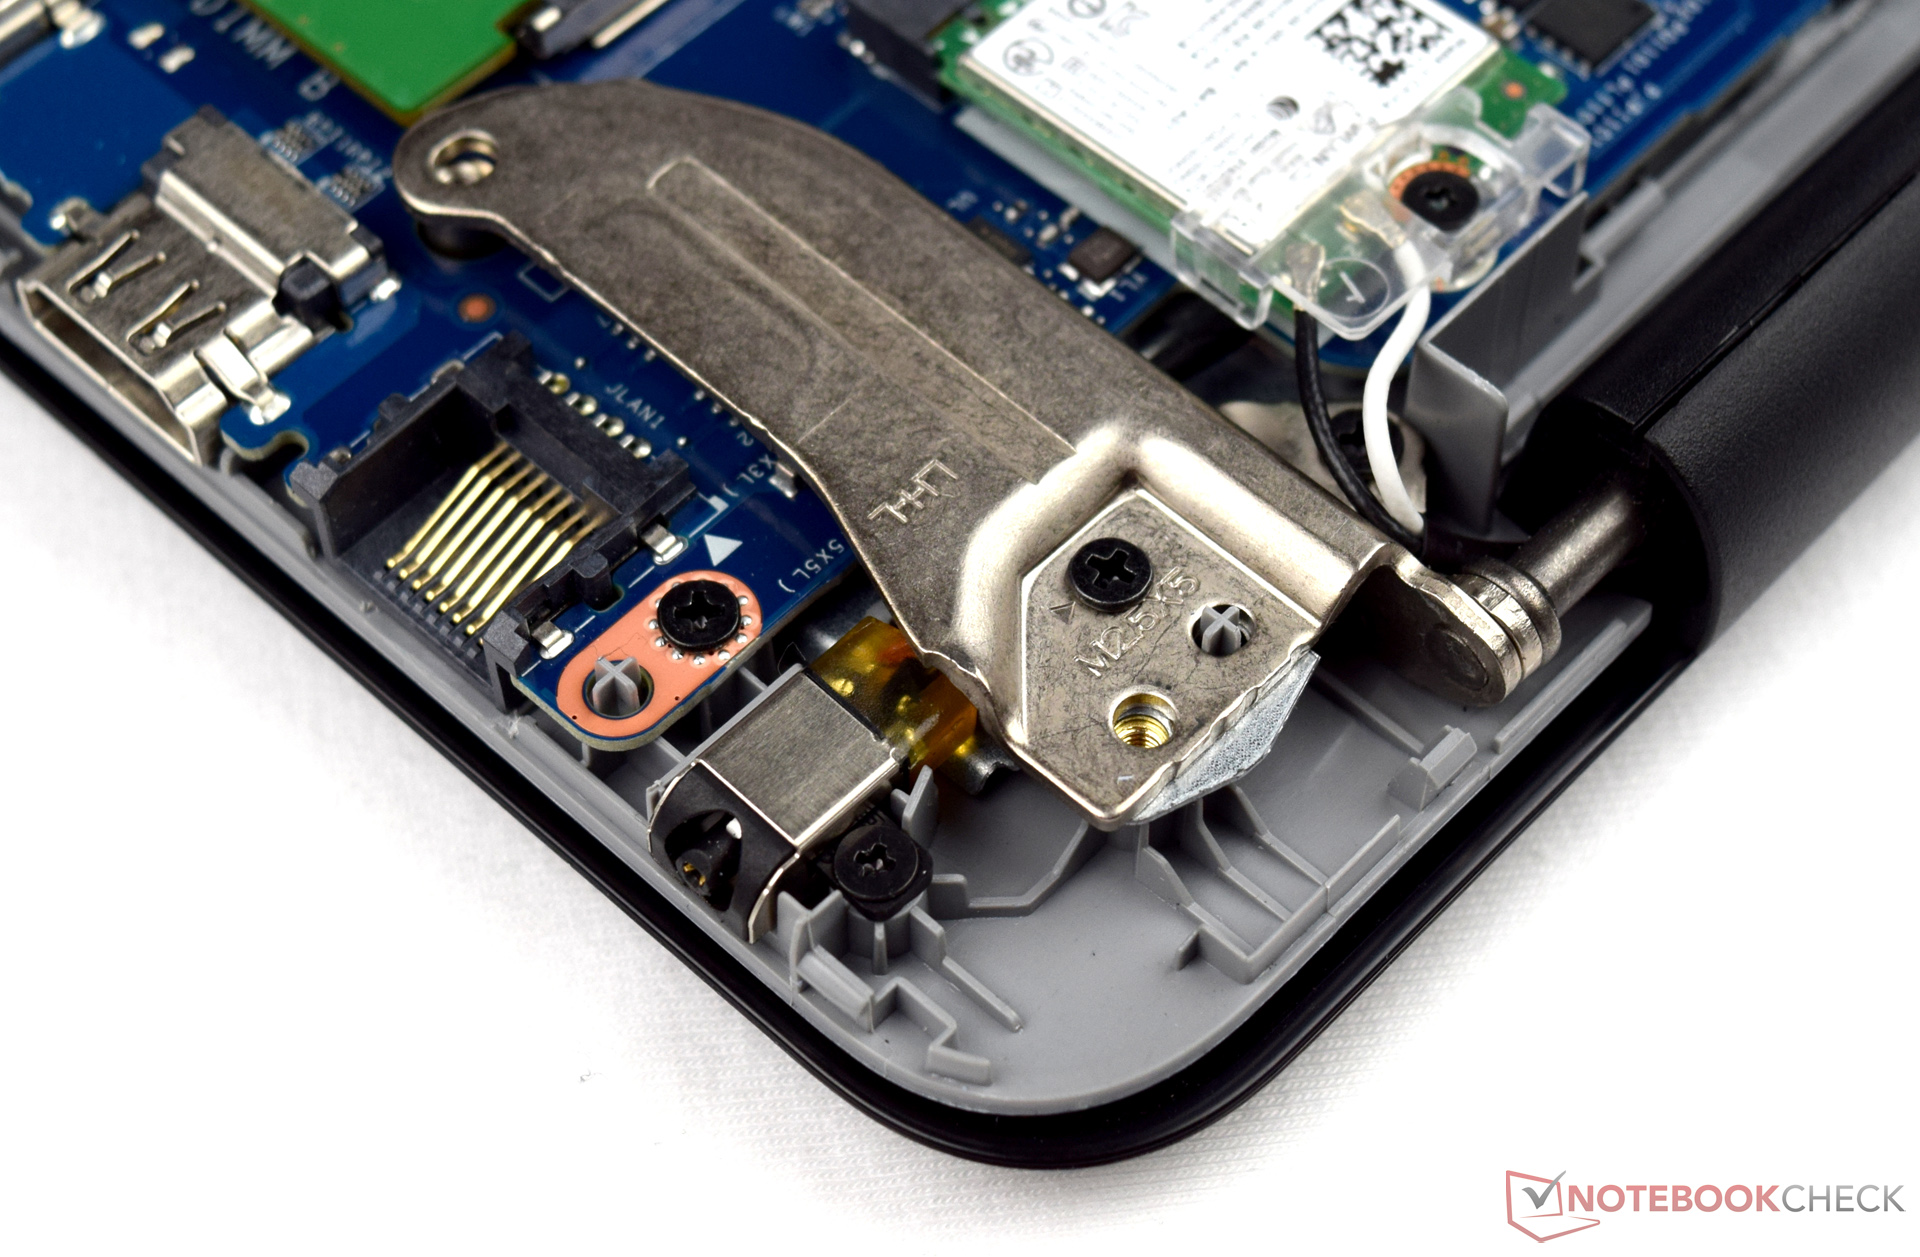
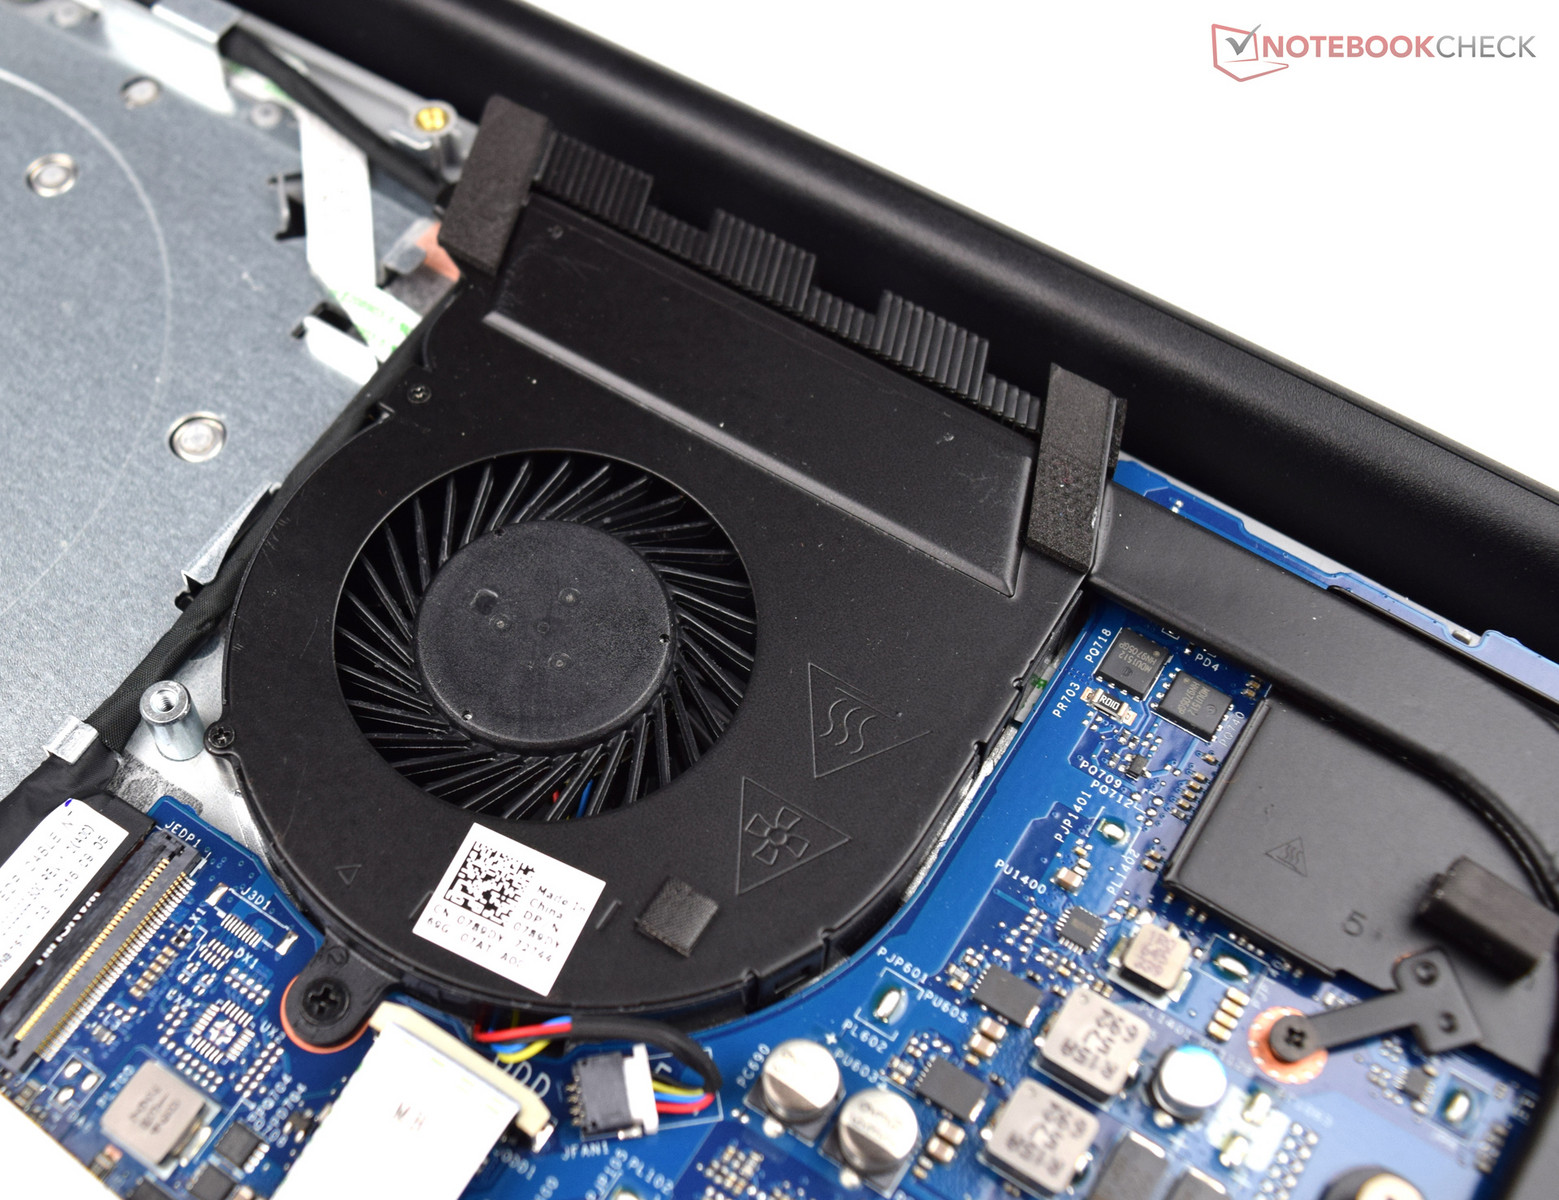
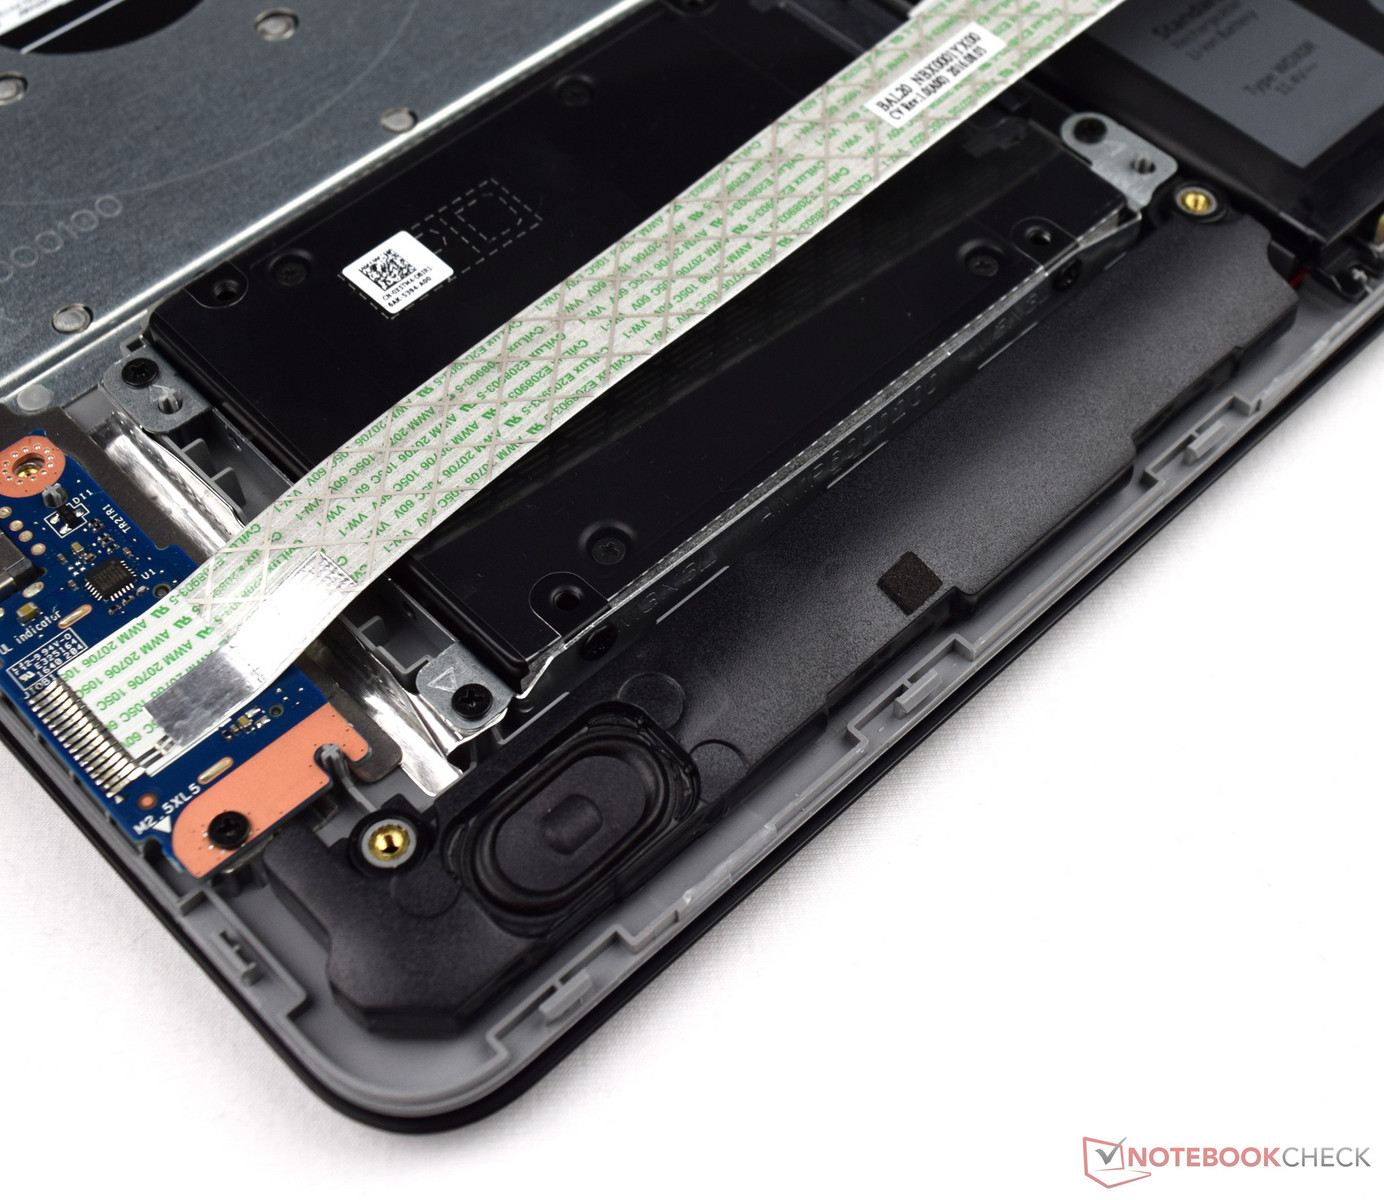
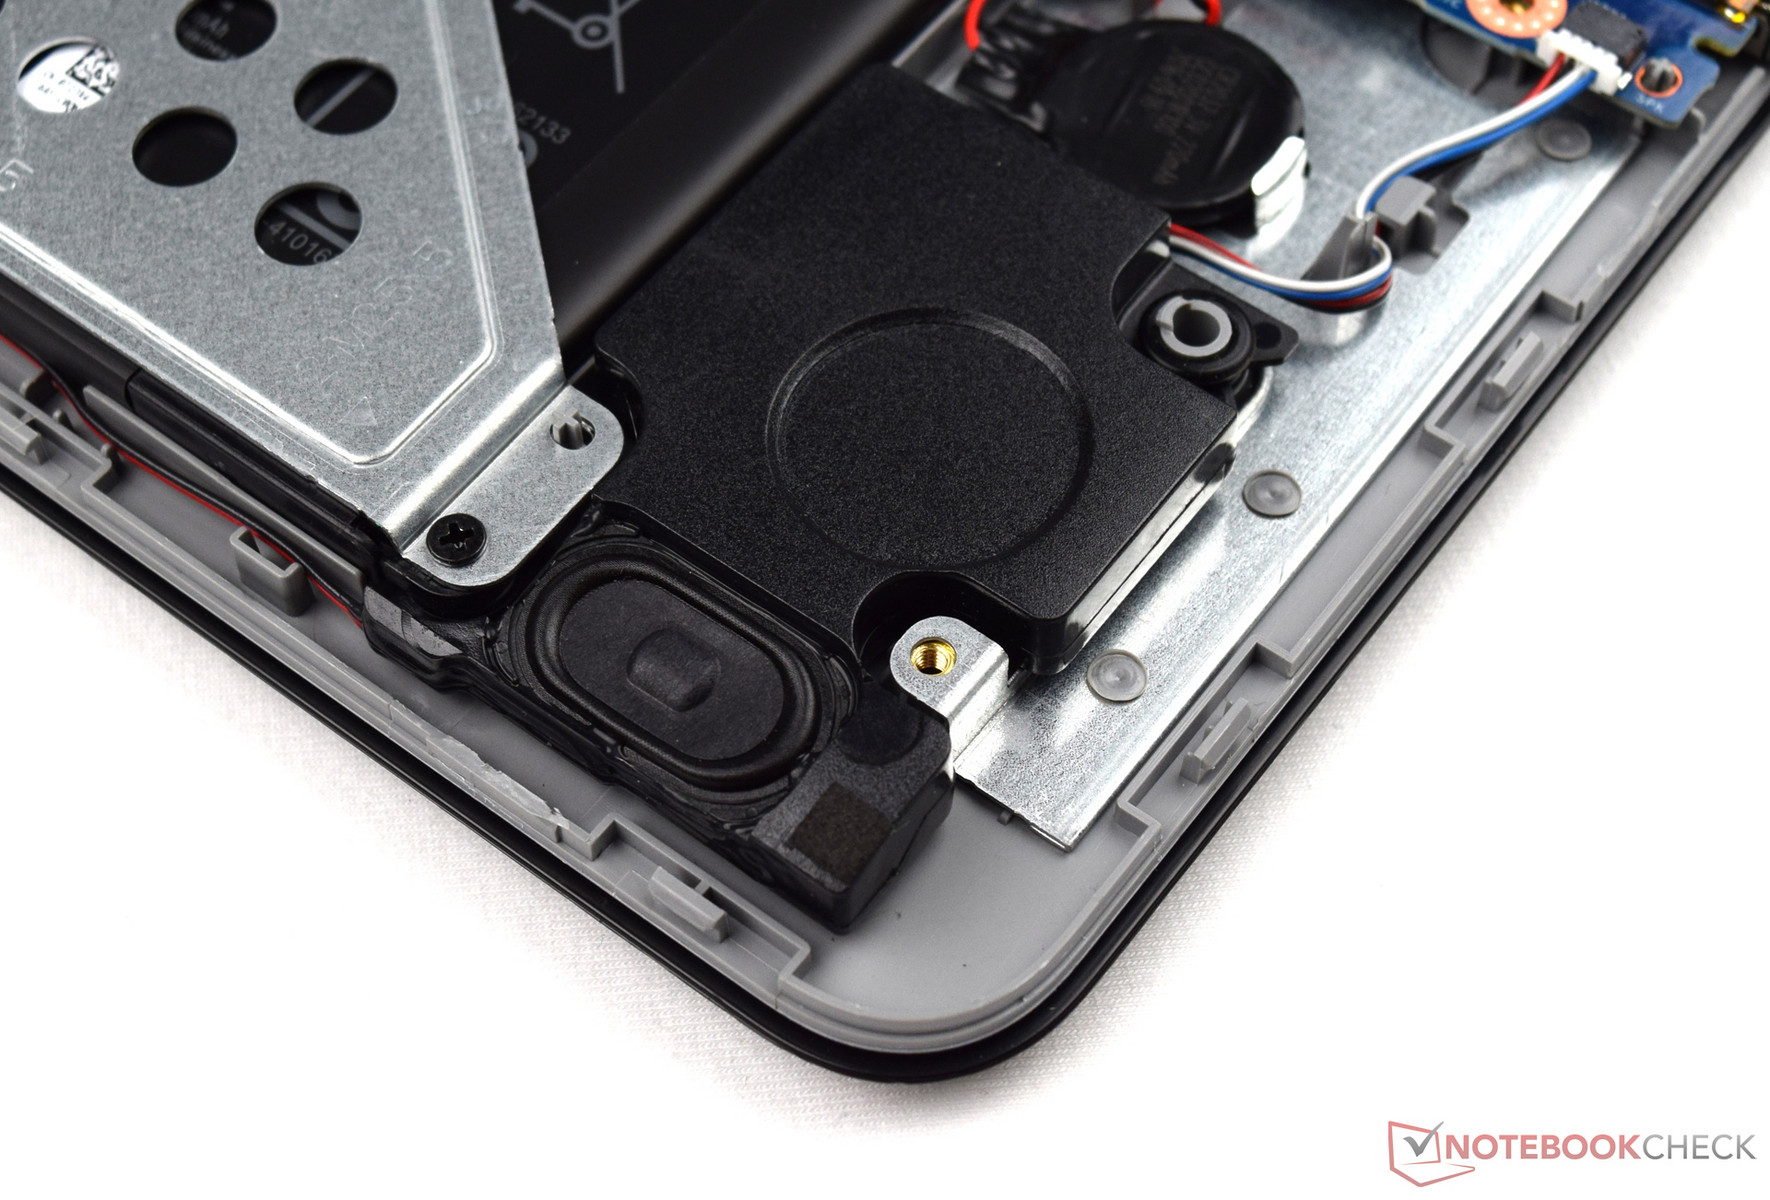
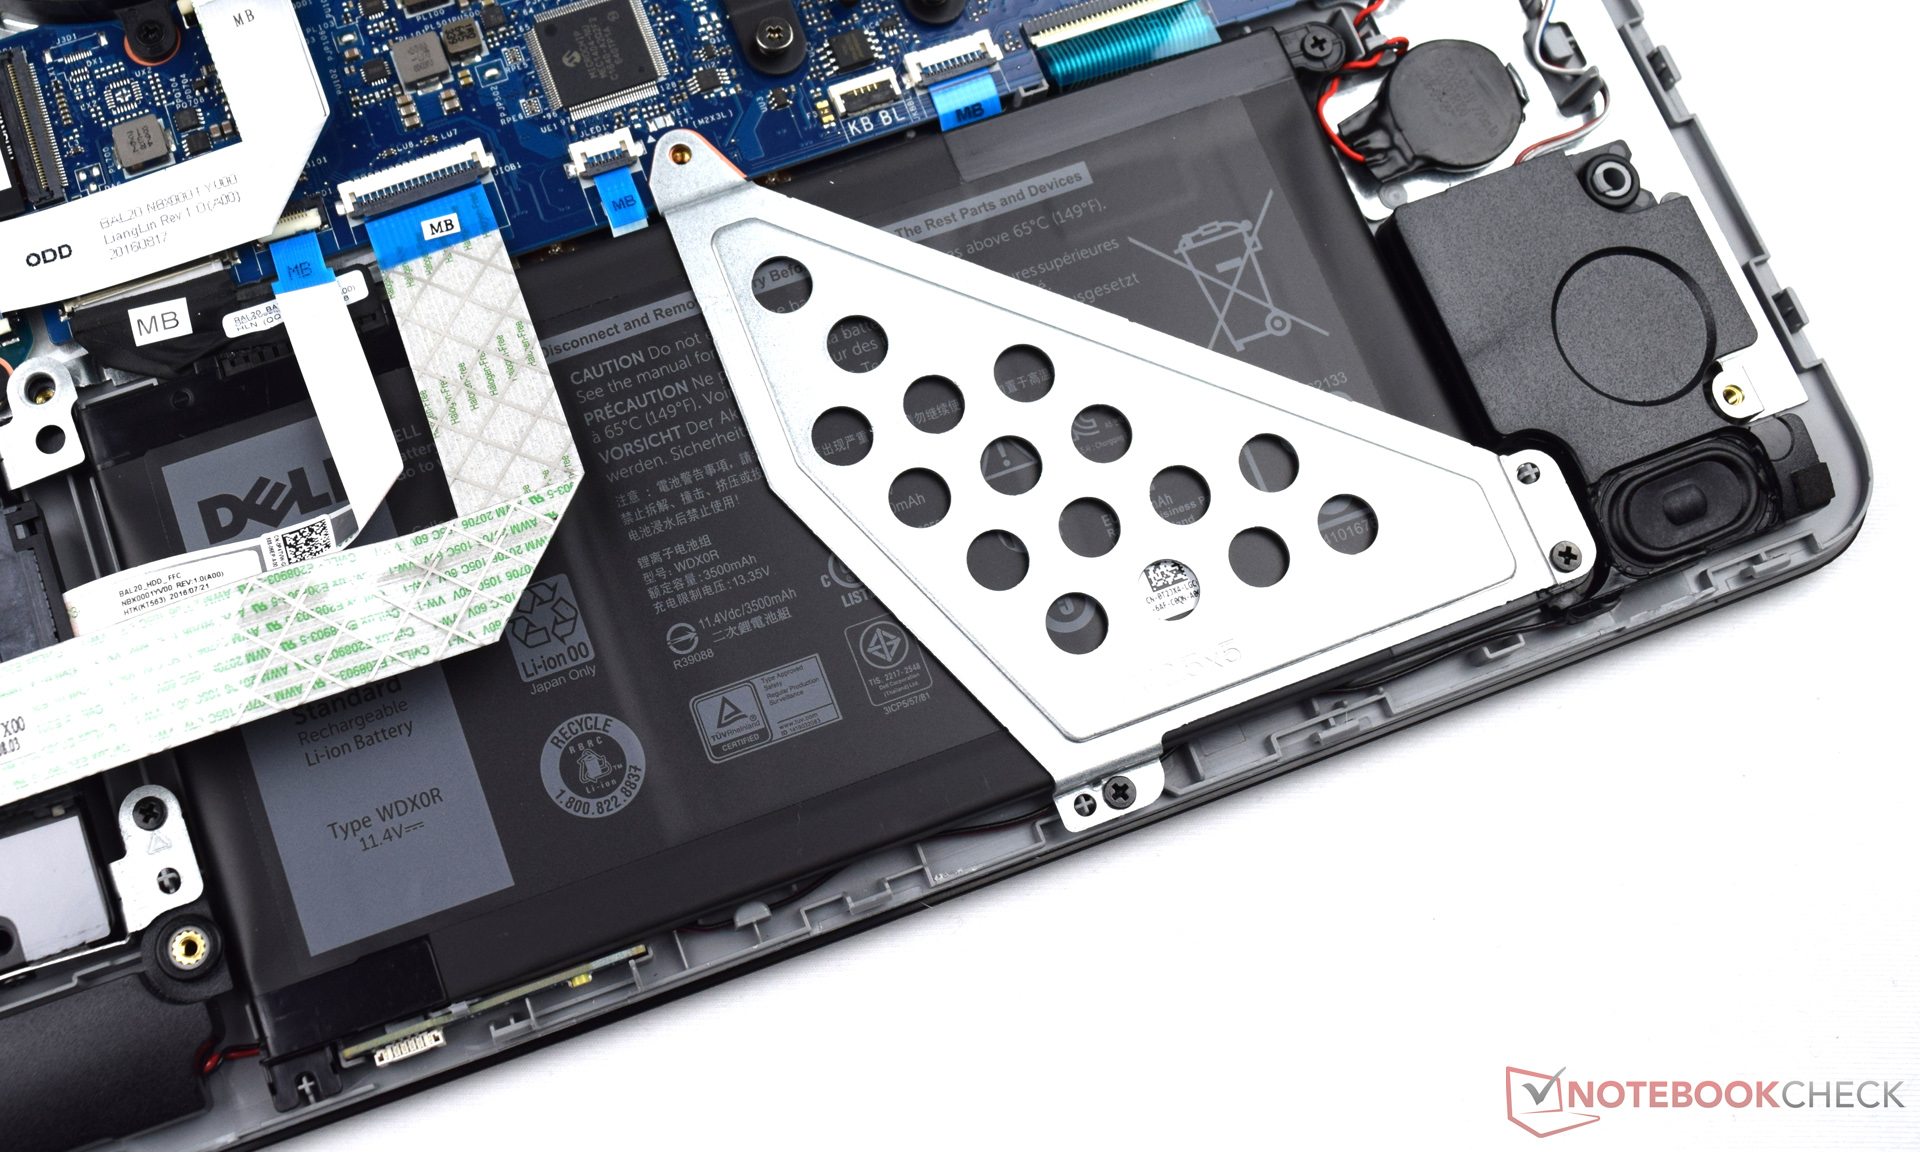
A tárhely kérdésére a megoldás attól függ, hogy mennyi helyre van szükség valójában. Amennyiben pár játékot felpakolunk, hamar kifogyhatunk a tárhelyből, emiatt nem rossz ötlet egy nagyobb SSD beszerzése. Ez lehetséges is, mivel az alsó borító leszerelhető, bár a folyamat némileg körülményes.
Ez az eredeti értékelés rövidített változata. A teljes, angol nyelvű cikk itt olvasható.
Dell Inspiron 15 5000 5567-1753
-
01/30/2017 v6(old)
Sebastian Bade
Pricecompare
