 Deutsch
 English
 Español
 Français
 Italiano
 Nederlands
 Polski
 Português
 Русский
 Türkçe
 Svenska
 Chinese
 Magyar
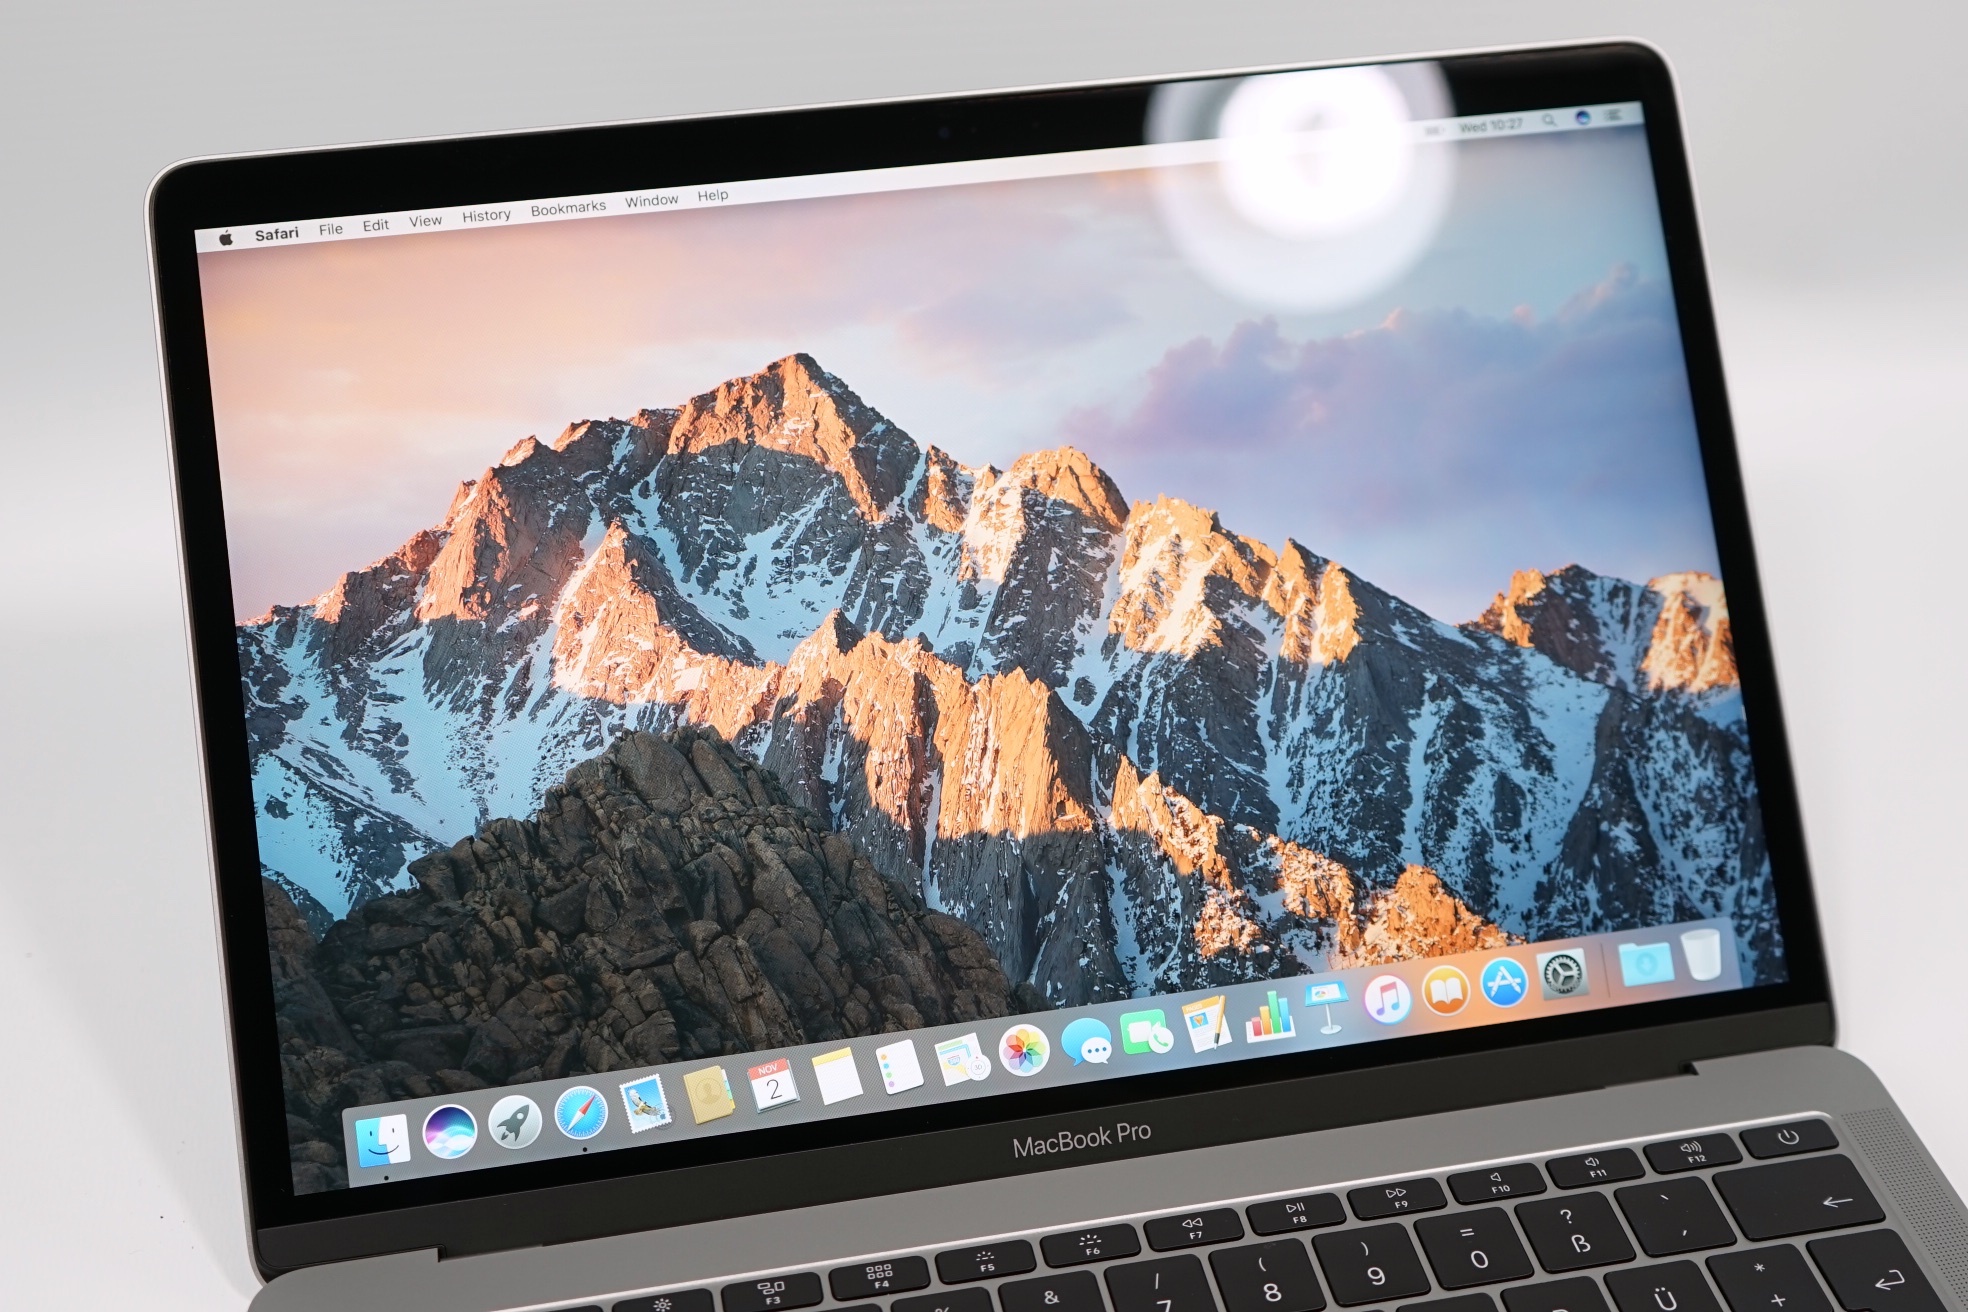
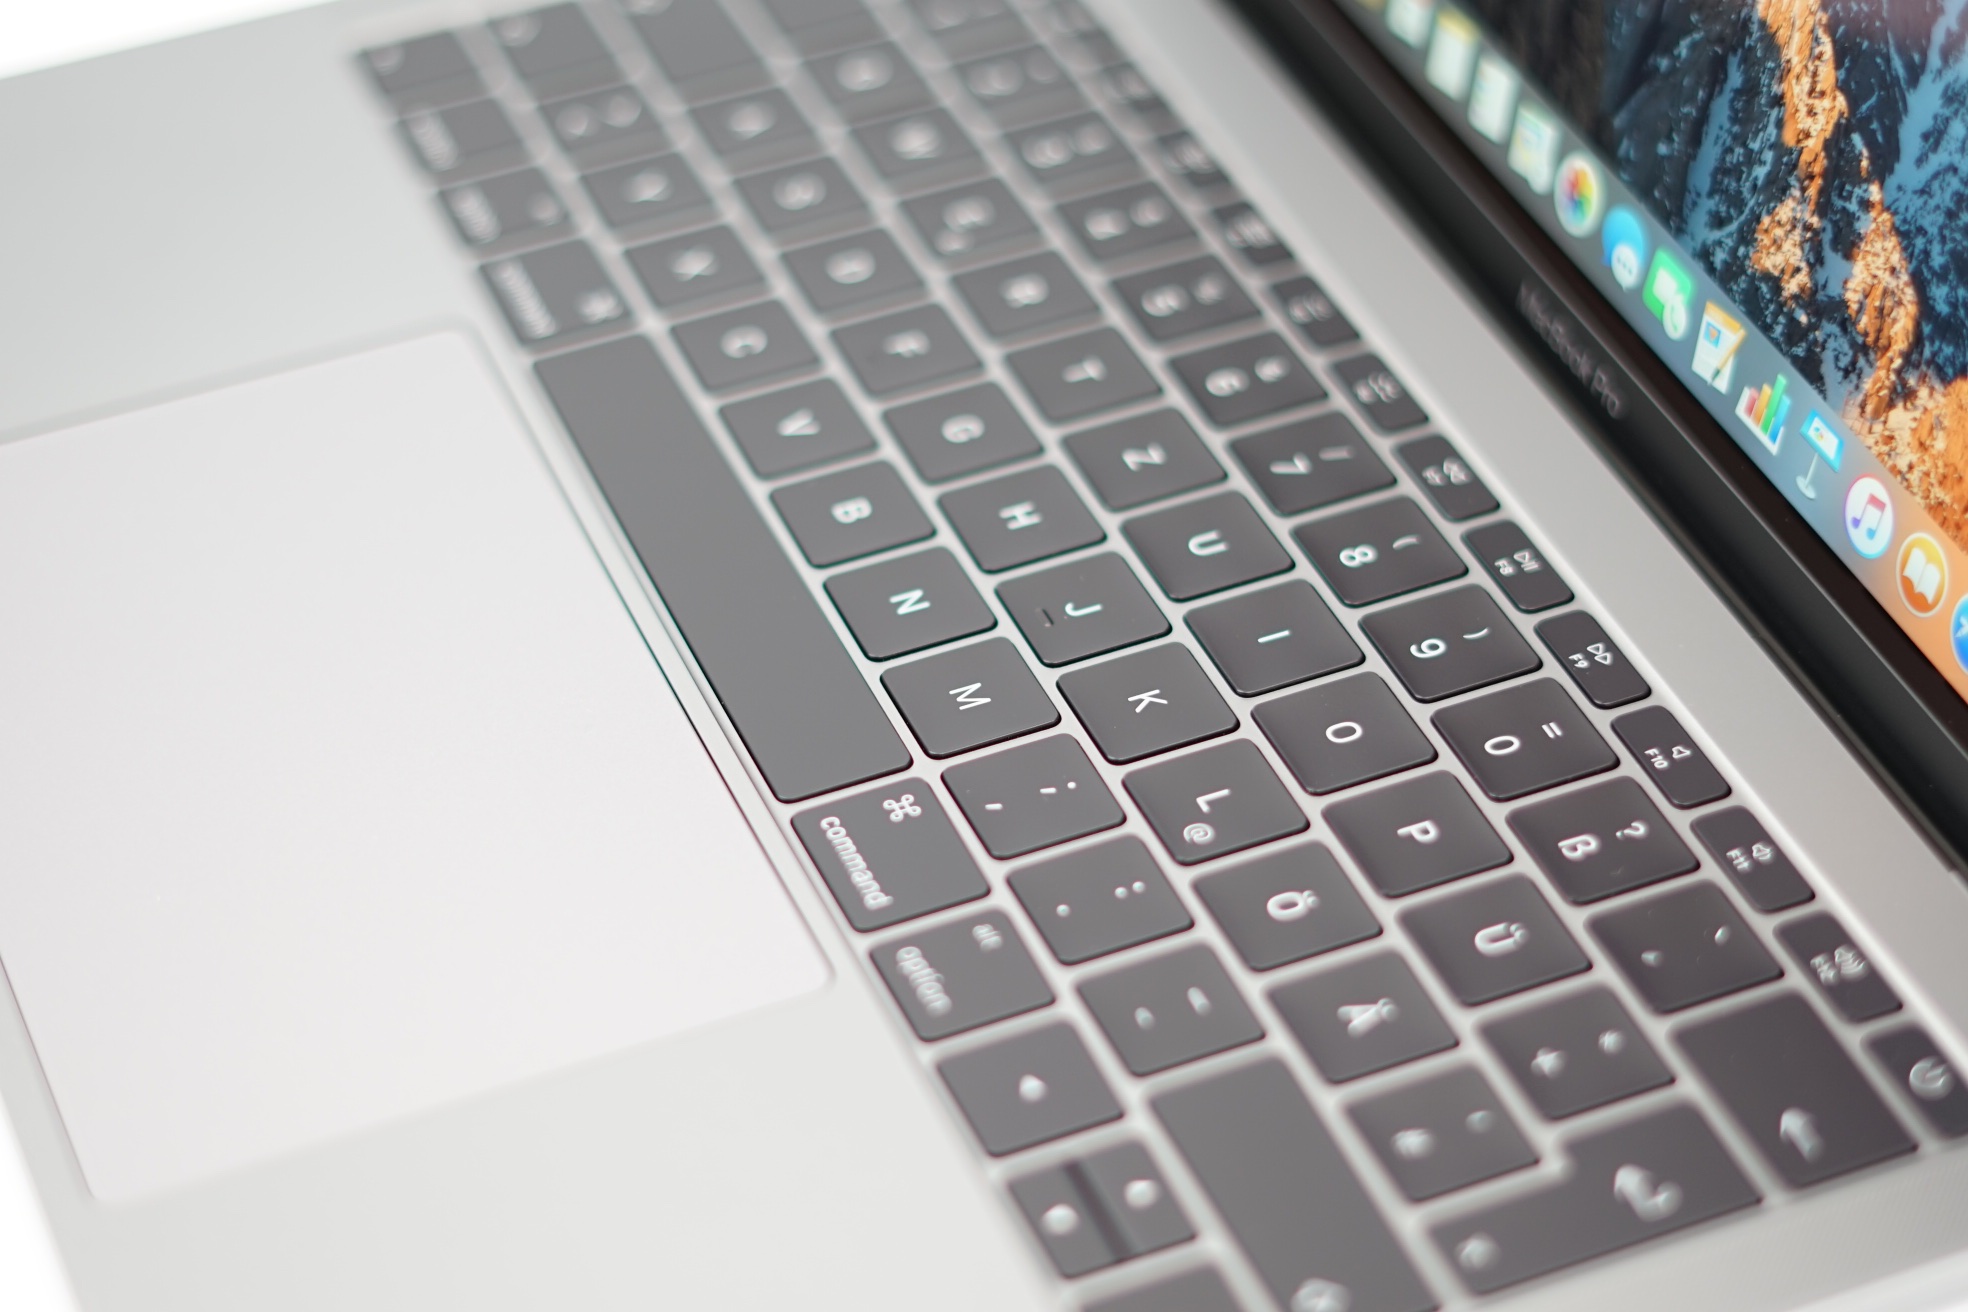
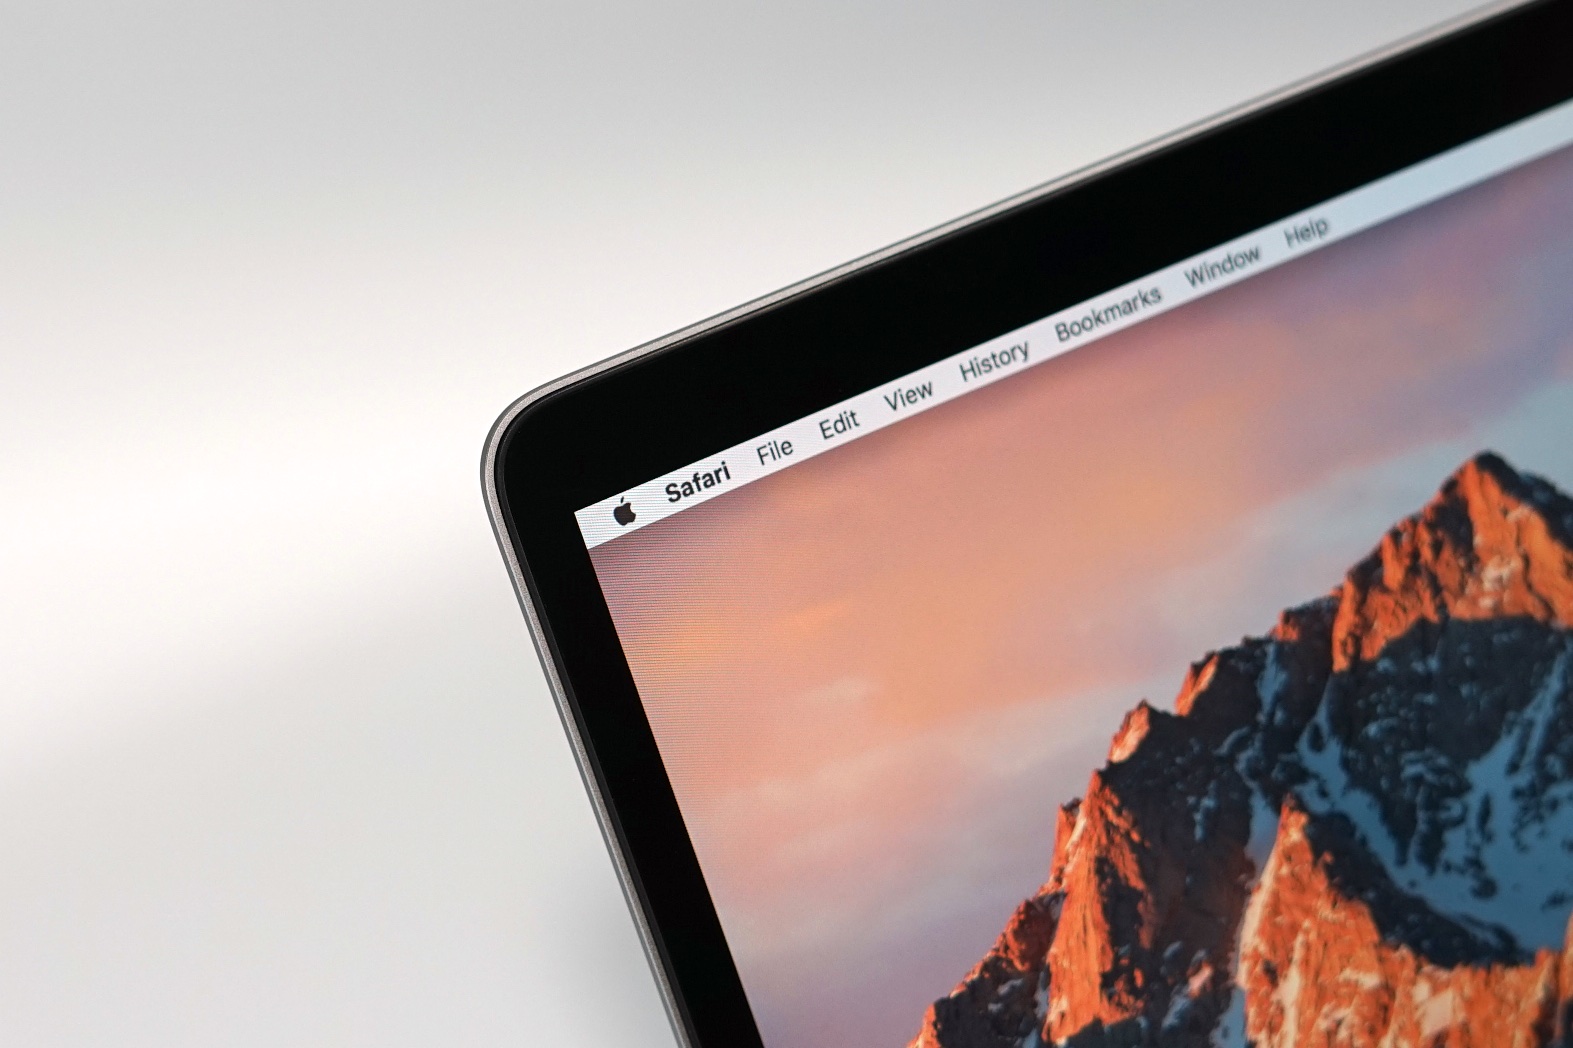
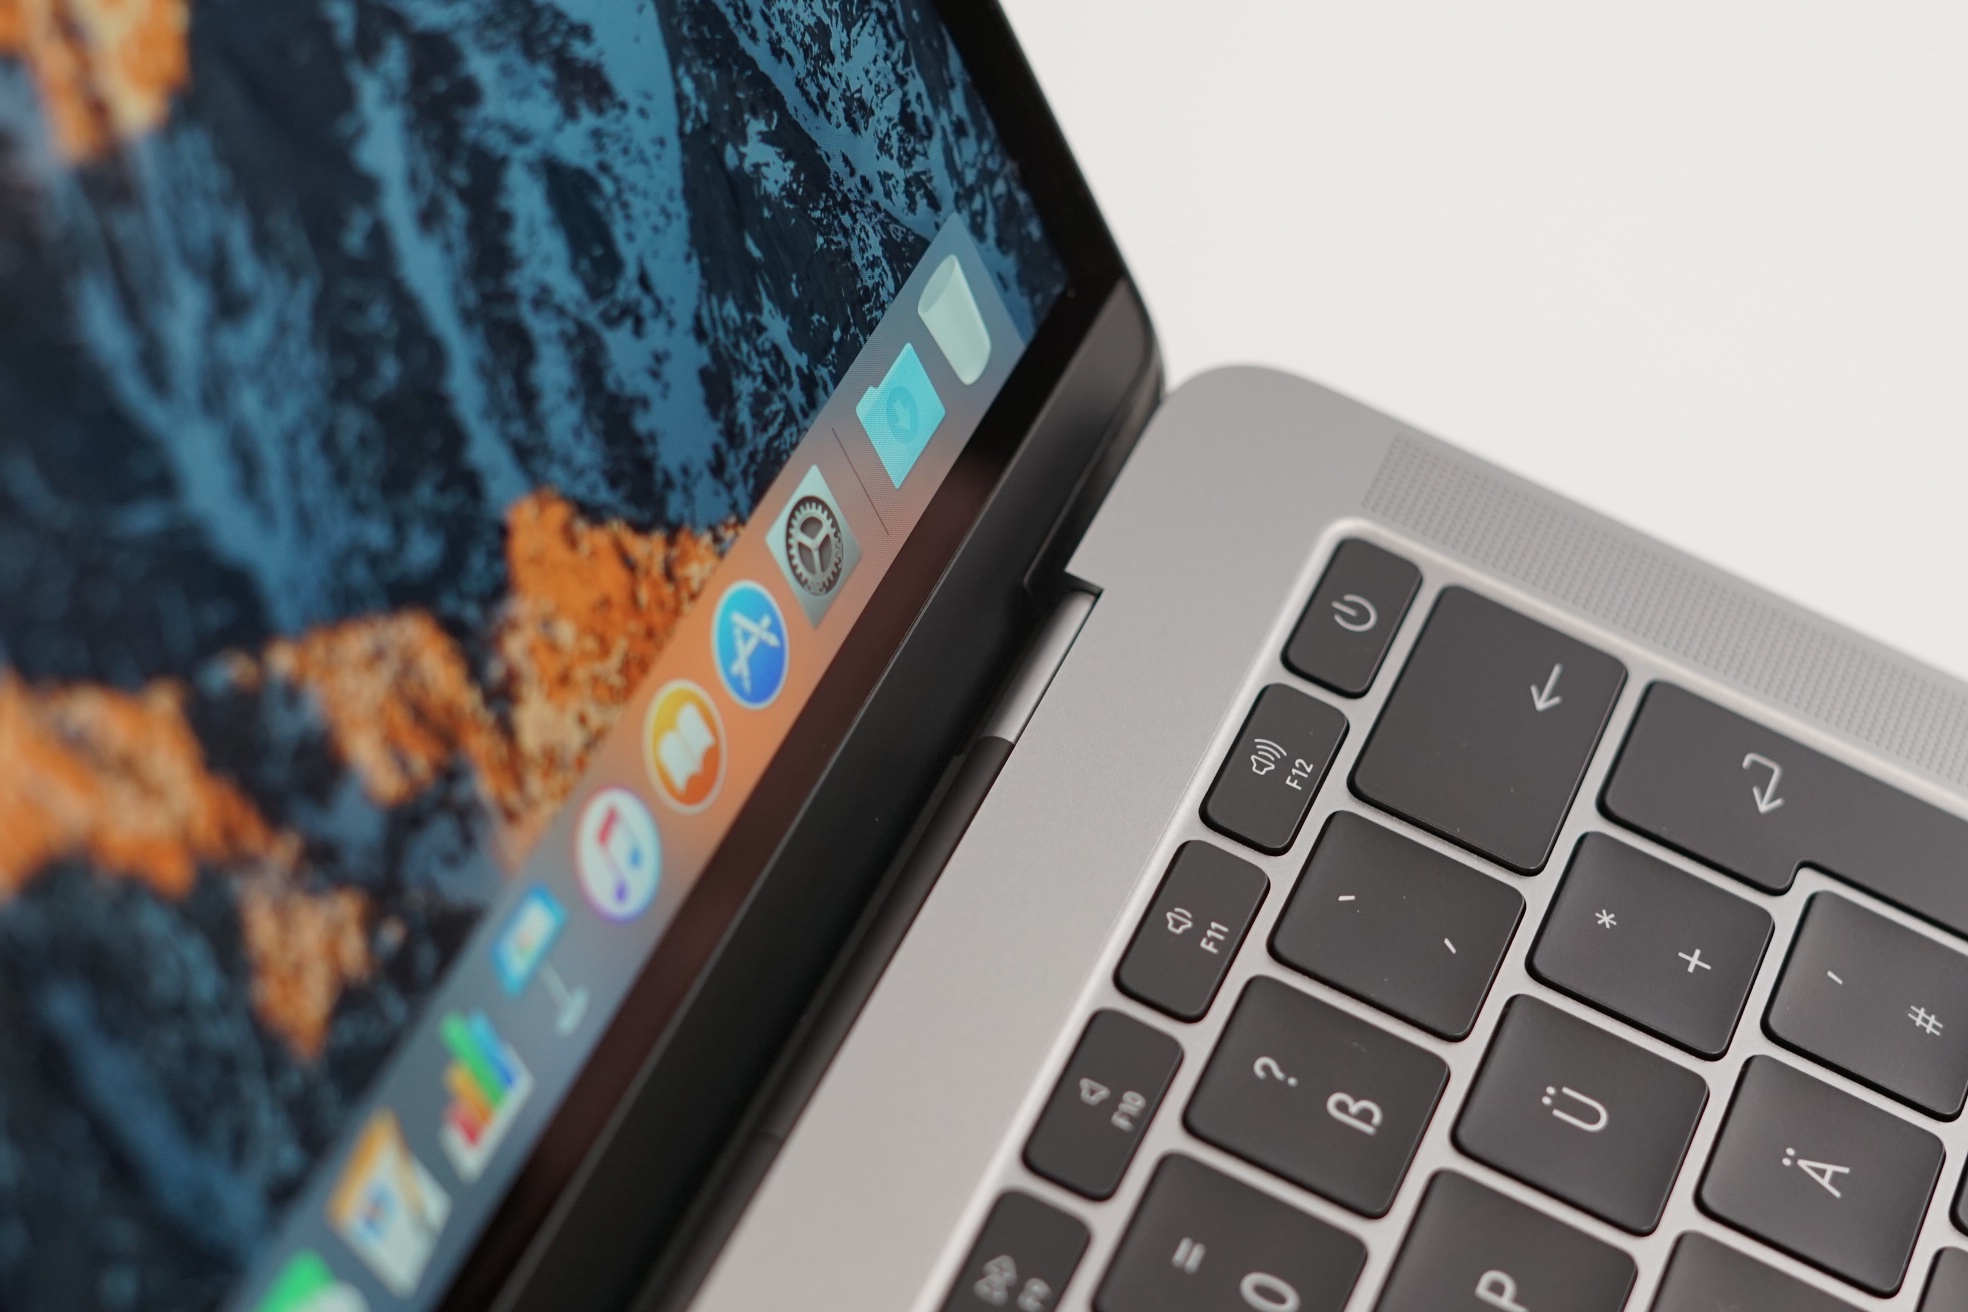
Apple MacBook Pro 13 (Late 2016, 2 GHz i5, without Touch Bar) Laptop rövid értékelés


| Networking | |
| iperf3 transmit AX12 | |
| Apple MacBook Pro Retina 13 inch 2013-10 (Klaus I211) | |
| Apple MacBook Pro 13 2016 (Klaus I211) | |
| Acer Spin 7 SP714-51-M09D (jseb) | |
| Microsoft Surface Pro 4, Core i5, 128GB (Klaus I211) | |
| Dell XPS 13 9360 QHD+ i7 | |
| Intel NUC5i5RYH (Klaus I211) | |
| Lenovo ThinkPad T460s-20FA003GGE | |
| iperf3 receive AX12 | |
| Apple MacBook Pro Retina 13 inch 2013-10 (Klaus I211) | |
| Apple MacBook Pro 13 2016 (Klaus I211) | |
| Dell XPS 13 9360 QHD+ i7 | |
| Lenovo ThinkPad T460s-20FA003GGE | |
| Acer Spin 7 SP714-51-M09D (jseb) | |
| Microsoft Surface Pro 4, Core i5, 128GB (Klaus I211) | |
| Intel NUC5i5RYH (Klaus I211) | |
| |||||||||||||||||||||||||
Fényerő megoszlás: 89 %
Centrumban: 600 cd/m²
Kontraszt: 1053:1 (Fekete: 0.57 cd/m²)
ΔE Color 1.5 | 0.5-29.43 Ø5
ΔE Greyscale 2 | 0.57-98 Ø5.3
92% sRGB (Argyll 1.6.3 3D)
77% AdobeRGB 1998 (Argyll 1.6.3 3D)
86.7% AdobeRGB 1998 (Argyll 2.2.0 3D)
99.8% sRGB (Argyll 2.2.0 3D)
97.1% Display P3 (Argyll 2.2.0 3D)
Gamma: 2.27
| Apple MacBook Pro 13 2016 APPA034, , 2560x1600, 13.30 | Apple MacBook Pro Retina 13 inch 2015-03 APPA02A, , 2560x1600, 13.30 | Dell XPS 13 9360 QHD+ i7 Sharp SHP144A, , 3200x1800, 13.30 | Razer Blade Stealth QHD i7-7500U Sharp SHP142F (LQ125T1JW02), , 2560x1440, 12.50 | Apple MacBook Air 13 inch 2015-03 Apple APP9CF0, , 1440x900, 13.30 | Apple MacBook 12 (Early 2016) 1.1 GHz APPA027, , 2304x1440, 12.00 | |
|---|---|---|---|---|---|---|
| Display | -19% | -23% | -17% | -50% | -19% | |
| Display P3 Coverage | 97.1 | 65.9 -32% | 62.8 -35% | 68.7 -29% | 40.1 -59% | 66.8 -31% |
| sRGB Coverage | 99.8 | 97 -3% | 89.4 -10% | 95.8 -4% | 59.8 -40% | 95.4 -4% |
| AdobeRGB 1998 Coverage | 86.7 | 67.4 -22% | 64.6 -25% | 69.9 -19% | 41.51 -52% | 68 -22% |
| Response Times | 26% | 29% | 27% | |||
| Response Time Grey 50% / Grey 80% * | 47.2 ? | 43.6 ? 8% | 37 ? 22% | 41.2 ? 13% | ||
| Response Time Black / White * | 51.6 ? | 29.2 ? 43% | 33.4 ? 35% | 30.4 ? 41% | ||
| PWM Frequency | 200 ? | |||||
| Screen | -9% | -44% | -49% | -58% | -10% | |
| Brightness middle | 600 | 361 -40% | 396.2 -34% | 402 -33% | 329 -45% | 387 -35% |
| Brightness | 564 | 342 -39% | 357 -37% | 382 -32% | 310 -45% | 358 -37% |
| Brightness Distribution | 89 | 81 -9% | 84 -6% | 88 -1% | 82 -8% | 88 -1% |
| Black Level * | 0.57 | 0.361 37% | 0.266 53% | 0.45 21% | 0.405 29% | 0.47 18% |
| Contrast | 1053 | 1000 -5% | 1489 41% | 893 -15% | 812 -23% | 823 -22% |
| Colorchecker dE 2000 * | 1.5 | 1.82 -21% | 3.9 -160% | 3.6 -140% | 3.96 -164% | 1.6 -7% |
| Colorchecker dE 2000 max. * | 2.9 | 3.26 -12% | 7.58 -161% | 7.5 -159% | 7.51 -159% | 4 -38% |
| Greyscale dE 2000 * | 2 | 1.8 10% | 4.16 -108% | 4.3 -115% | 3.51 -76% | 1 50% |
| Gamma | 2.27 97% | 2.49 88% | 2.31 95% | 2.1 105% | 3.83 57% | 2.26 97% |
| CCT | 6855 95% | 6417 101% | 6514 100% | 6572 99% | 6711 97% | 6680 97% |
| Color Space (Percent of AdobeRGB 1998) | 77 | 61.9 -20% | 57.5 -25% | 62.3 -19% | 38.4 -50% | 61.6 -20% |
| Color Space (Percent of sRGB) | 92 | 96.9 5% | 88.7 -4% | 95.7 4% | 59.8 -35% | 82.2 -11% |
| Teljes átlag (program / beállítások) | -14% /
-12% | -14% /
-31% | -12% /
-32% | -54% /
-56% | -1% /
-7% |
* ... a kisebb jobb
| PCMark 8 | |
| Home Score Accelerated v2 | |
| Apple MacBook Air 13 inch 2015-03 | |
| Dell XPS 13 2016 9350 (FHD, i7-6560U) | |
| Apple MacBook Pro Retina 13 inch 2015-03 | |
| Razer Blade Stealth QHD i7-7500U | |
| Apple MacBook Pro 13 2016 | |
| Dell XPS 13 9360 QHD+ i7 | |
| Apple MacBook 12 (Early 2016) 1.1 GHz | |
| Work Score Accelerated v2 | |
| Apple MacBook Air 13 inch 2015-03 | |
| Dell XPS 13 2016 9350 (FHD, i7-6560U) | |
| Dell XPS 13 9360 QHD+ i7 | |
| Apple MacBook Pro Retina 13 inch 2015-03 | |
| Apple MacBook Pro 13 2016 | |
| Apple MacBook 12 (Early 2016) 1.1 GHz | |
| PCMark 8 Home Score Accelerated v2 | 3280 pontok | |
| PCMark 8 Creative Score Accelerated v2 | 4205 pontok | |
| PCMark 8 Work Score Accelerated v2 | 3853 pontok | |
Segítség | ||
| Apple MacBook Pro 13 2016 Apple SSD AP0256 | Apple MacBook Pro Retina 13 inch 2015-03 Apple SSD SM0128G | Apple MacBook Air 13 inch 2015-03 Apple SSD SD0256F | Dell XPS 13 9360 QHD+ i7 Toshiba NVMe THNSN5256GPUK | Razer Blade Stealth QHD i7-7500U Samsung PM951 NVMe MZVLV256 | Apple MacBook 12 (Early 2016) 1.1 GHz Apple SSD AP0256 | Dell XPS 13 2016 9350 (FHD, i7-6560U) Samsung PM951 NVMe MZ-VLV256D | |
|---|---|---|---|---|---|---|---|
| CrystalDiskMark 3.0 | -1% | 9% | 117% | 140% | -21% | 112% | |
| Read Seq | 1345 | 1403 4% | 1352 1% | 1214 -10% | 1178 -12% | 754 -44% | 1131 -16% |
| Write Seq | 1320 | 657 -50% | 1111 -16% | 655 -50% | 305.4 -77% | 638 -52% | 311.4 -76% |
| Read 512 | 831 | 810 -3% | 880 6% | 1019 23% | 638 -23% | 616 -26% | 685 -18% |
| Write 512 | 1486 | 648 -56% | 1023 -31% | 445.7 -70% | 305.7 -79% | 678 -54% | 276.3 -81% |
| Read 4k | 31.68 | 20.95 -34% | 21.93 -31% | 35.55 12% | 38.54 22% | 14.6 -54% | 39.63 25% |
| Write 4k | 11.02 | 32.43 194% | 30.94 181% | 130 1080% | 153.4 1292% | 20.5 86% | 133.9 1115% |
| Read 4k QD32 | 533 | 343.6 -36% | 339.5 -36% | 537 1% | 614 15% | 464 -13% | 399.7 -25% |
| Write 4k QD32 | 362 | 254.4 -30% | 342.9 -5% | 173.8 -52% | 302.7 -16% | 315 -13% | 245.6 -32% |
| AS SSD | 7% | 10% | 80% | 116% | -12% | 92% | |
| Seq Read | 2275 | 1233 -46% | 1212 -47% | 1346 -41% | 1332 -41% | 1056 -54% | 1323 -42% |
| Seq Write | 1435 | 616 -57% | 1001 -30% | 586 -59% | 283.6 -80% | 651 -55% | 235.3 -84% |
| 4K Read | 13.3 | 20.6 55% | 19.16 44% | 31.64 138% | 35.2 165% | 16.4 23% | 35.4 166% |
| 4K Write | 15.4 | 30.2 96% | 23.73 54% | 95.6 521% | 127.2 726% | 22.1 44% | 108.3 603% |
| 4K-64 Read | 904 | 891 -1% | 1140 26% | 655 -28% | 891 -1% | 509 -44% | 767 -15% |
| 4K-64 Write | 417 | 221.2 -47% | 338.9 -19% | 205.6 -51% | 256.9 -38% | 283 -32% | 186.3 -55% |
| Access Time Read * | 0.288 | 0.141 51% | 0.171 41% | 0.065 77% | 0.06 79% | 0.186 35% | 0.088 69% |
| Access Time Write * | 0.123 | 0.155 | 0.033 | 0.03 | 0.035 | ||
| Teljes átlag (program / beállítások) | 3% /
3% | 10% /
9% | 99% /
99% | 128% /
129% | -17% /
-17% | 102% /
102% |
* ... a kisebb jobb

| The Witcher 3 - 1024x768 Low Graphics & Postprocessing | |
| Apple MacBook Pro 13 2016 | |
| Acer Aspire V3-372-57CW | |
| Lenovo IdeaPad 710S-13ISK | |
| Dell XPS 13 2016 9350 (FHD, i7-6560U) | |
| Dell XPS 13 9360 QHD+ i7 | |
| Razer Blade Stealth QHD i7-7500U | |
| Asus Zenbook UX360UA-C4159T | |
| alacsony | közepes | magas | ultra | |
| BioShock Infinite (2013) | 40.3 | 11.6 | ||
| Metro: Last Light (2013) | 42 | 35.4 | 22.1 | |
| Dirt Rally (2015) | 149 | 36.8 | 18.7 | |
| The Witcher 3 (2015) | 20.5 | |||
| Dota 2 Reborn (2015) | 59.8 | 46.9 | 29.2 | 34.6 |
| World of Warships (2015) | 73.3 | 33.5 | ||
| Fallout 4 (2015) | 23.2 | |||
| Rise of the Tomb Raider (2016) | 24 kis grafikai problémák (wrong clouds) | 16 kis grafikai problémák (wrong clouds) | ||
| Far Cry Primal (2016) | 23 | 12 | ||
| Ashes of the Singularity (2016) | 13.3 | |||
| Doom (2016) | 31.5 | |||
| Overwatch (2016) | 68 | 47.6 | 21.3 | |
| Mirror's Edge Catalyst (2016) | 35 | 20.5 | ||
| Deus Ex Mankind Divided (2016) | 16.7 | |||
| FIFA 17 (2016) | 61 kis grafikai problémák | 72 kis grafikai problémák | 0 kis grafikai problémák | |
| Mafia 3 (2016) | 11.3 | |||
| Battlefield 1 (2016) | 43.4 | 25.3 | 12.6 | |
| Farming Simulator 17 (2016) | 112 | 76 | 30.6 | 19.1 |
| Titanfall 2 (2016) | 55.3 | 38.6 | 14.3 | |
| Call of Duty Infinite Warfare (2016) | 30 | 27.3 | ||
| Dishonored 2 (2016) | 17.3 |
(±) The maximum temperature on the upper side is 42 °C / 108 F, compared to the average of 35.9 °C / 97 F, ranging from 21.4 to 59 °C for the class Subnotebook.
(±) The bottom heats up to a maximum of 41 °C / 106 F, compared to the average of 39.4 °C / 103 F
(+) In idle usage, the average temperature for the upper side is 24.8 °C / 77 F, compared to the device average of 30.7 °C / 87 F.
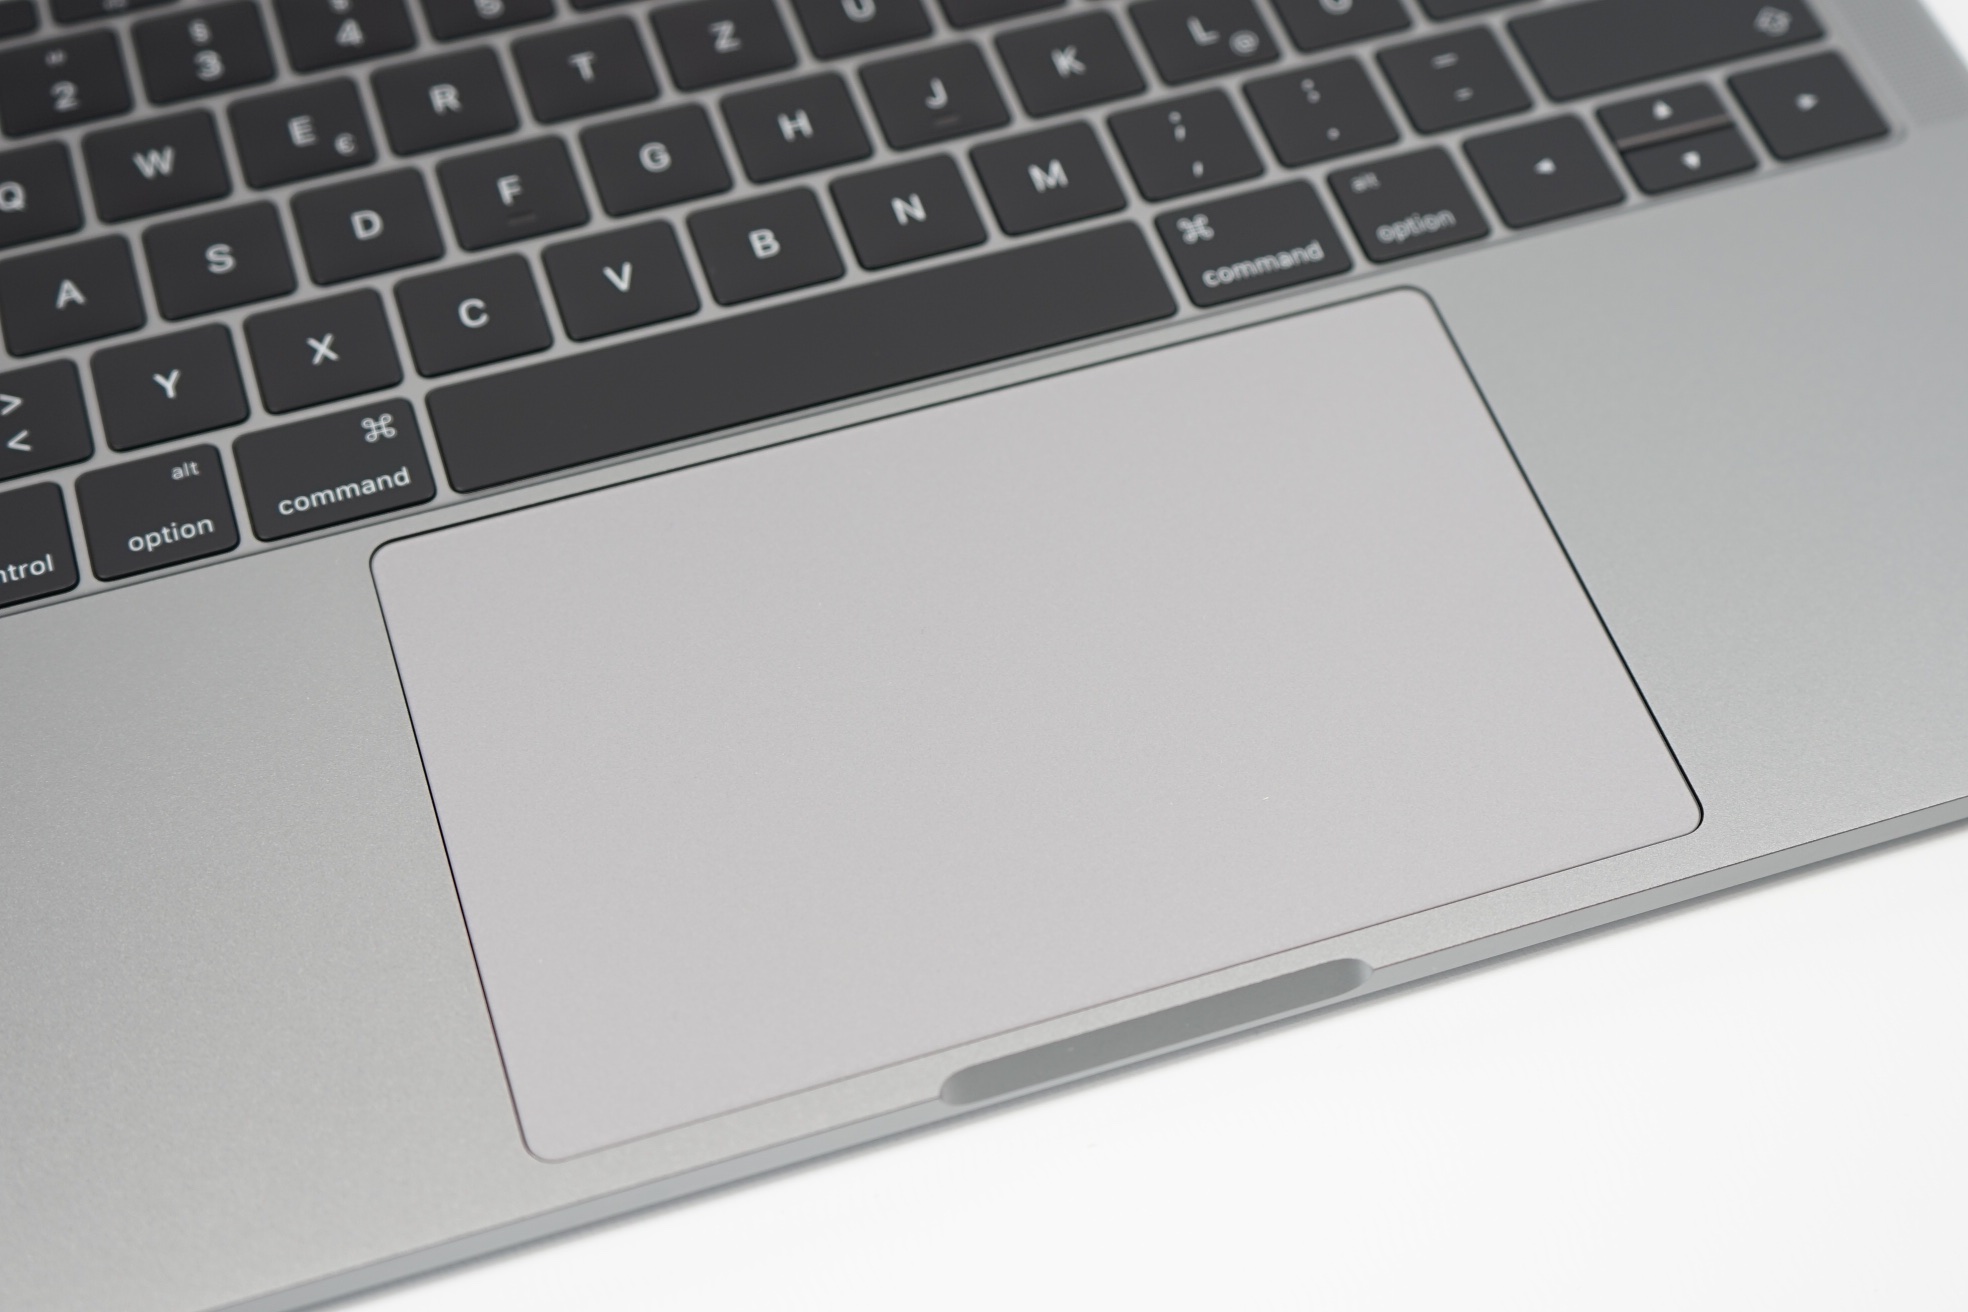
(+) The palmrests and touchpad are cooler than skin temperature with a maximum of 31 °C / 87.8 F and are therefore cool to the touch.
(-) The average temperature of the palmrest area of similar devices was 28.3 °C / 82.9 F (-2.7 °C / -4.9 F).
Apple MacBook Pro 13 2016 audio analysis
(+) | speakers can play relatively loud (83.2 dB)
Bass 100 - 315 Hz
(±) | reduced bass - on average 8.4% lower than median
(-) | bass is not linear (16.7% delta to prev. frequency)
Mids 400 - 2000 Hz
(+) | balanced mids - only 4.7% away from median
(+) | mids are linear (6.3% delta to prev. frequency)
Highs 2 - 16 kHz
(+) | balanced highs - only 1.1% away from median
(+) | highs are linear (2.6% delta to prev. frequency)
Összességében 100 - 16.000 Hz
(+) | overall sound is linear (9.8% difference to median)
Ugyanazon osztályhoz képest
» 4% of all tested devices in this class were better, 2% similar, 94% worse
» The best had a delta of 5%, average was 19%, worst was 53%
Az összes tesztelt eszközzel összehasonlítva
» 3% of all tested devices were better, 1% similar, 96% worse
» The best had a delta of 4%, average was 25%, worst was 134%
Apple MacBook 12 (Early 2016) 1.1 GHz audio analysis
(+) | speakers can play relatively loud (83.6 dB)
Bass 100 - 315 Hz
(±) | reduced bass - on average 11.3% lower than median
(±) | linearity of bass is average (14.2% delta to prev. frequency)
Mids 400 - 2000 Hz
(+) | balanced mids - only 2.4% away from median
(+) | mids are linear (5.5% delta to prev. frequency)
Highs 2 - 16 kHz
(+) | balanced highs - only 2% away from median
(+) | highs are linear (4.5% delta to prev. frequency)
Összességében 100 - 16.000 Hz
(+) | overall sound is linear (10.2% difference to median)
Ugyanazon osztályhoz képest
» 5% of all tested devices in this class were better, 2% similar, 93% worse
» The best had a delta of 5%, average was 19%, worst was 53%
Az összes tesztelt eszközzel összehasonlítva
» 3% of all tested devices were better, 1% similar, 96% worse
» The best had a delta of 4%, average was 25%, worst was 134%
Pricecompare
